interim results presentation - amazon web services · 2017-12-13 · interim results presentation...
TRANSCRIPT

Interim Results PresentationDecember 2017

2
Today’s agenda
1 Business Highlights Michael Bruce
2 Financial Highlights James Davies
3 Strategic Overview Michael Bruce
4 Summary
5 Q&A
6 Appendix

1 Business Highlights
4
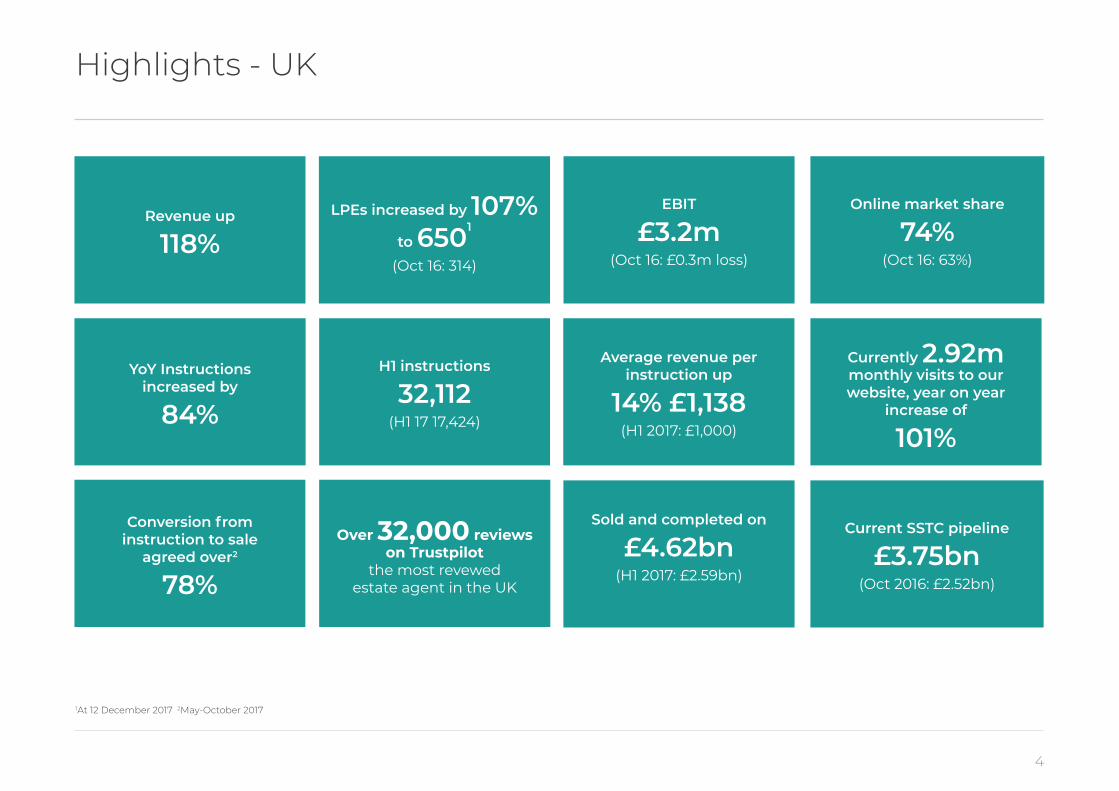
Highlights - UK
LPEs increased by 107%to 6501
(Oct 16: 314)
EBIT
£3.2m (Oct 16: £0.3m loss)
Online market share
74% (Oct 16: 63%)
Revenue up
118%
YoY Instructionsincreased by
84%
Currently 2.92m monthly visits to our website, year on year
increase of
101%
Average revenue per instruction up
14% £1,138 (H1 2017: £1,000)
Sold and completed on
£4.62bn (H1 2017: £2.59bn)
Current SSTC pipeline
£3.75bn(Oct 2016: £2.52bn)
Over 32,000 reviews on Trustpilot
the most revewed estate agent in the UK
Conversion frominstruction to sale
agreed over2
78%
1At 12 December 2017 2May-October 2017
H1 instructions
32,112 (H1 17 17,424)
5
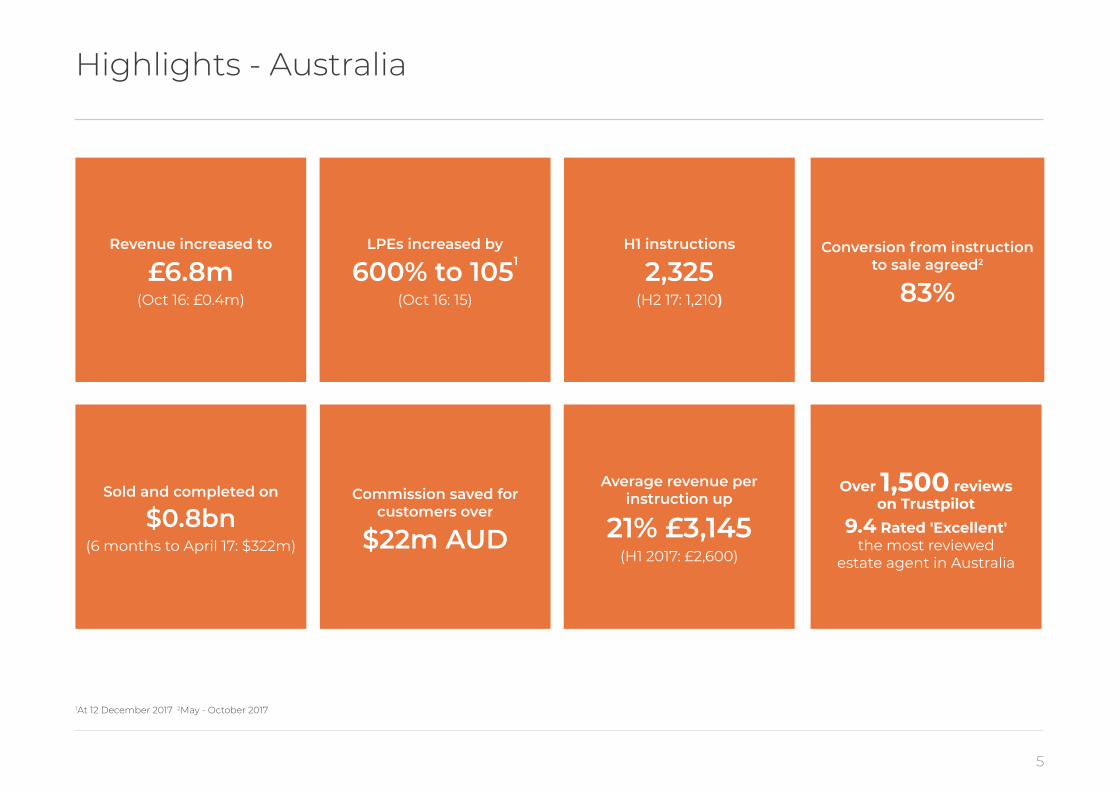
Highlights - Australia
LPEs increased by
600% to 1051 (Oct 16: 15)
H1 instructions
2,325(H2 17: 1,210)
Conversion from instruction to sale agreed2
83%
Revenue increased to
£6.8m(Oct 16: £0.4m)
Sold and completed on
$0.8bn(6 months to April 17: $322m)
Over 1,500 reviewson Trustpilot
9.4 Rated 'Excellent'the most reviewed
estate agent in Australia
Average revenue per instruction up
21% £3,145(H1 2017: £2,600)
Commission saved for customers over
$22m AUD
1At 12 December 2017 2May - October 2017

2 Financial Review
7
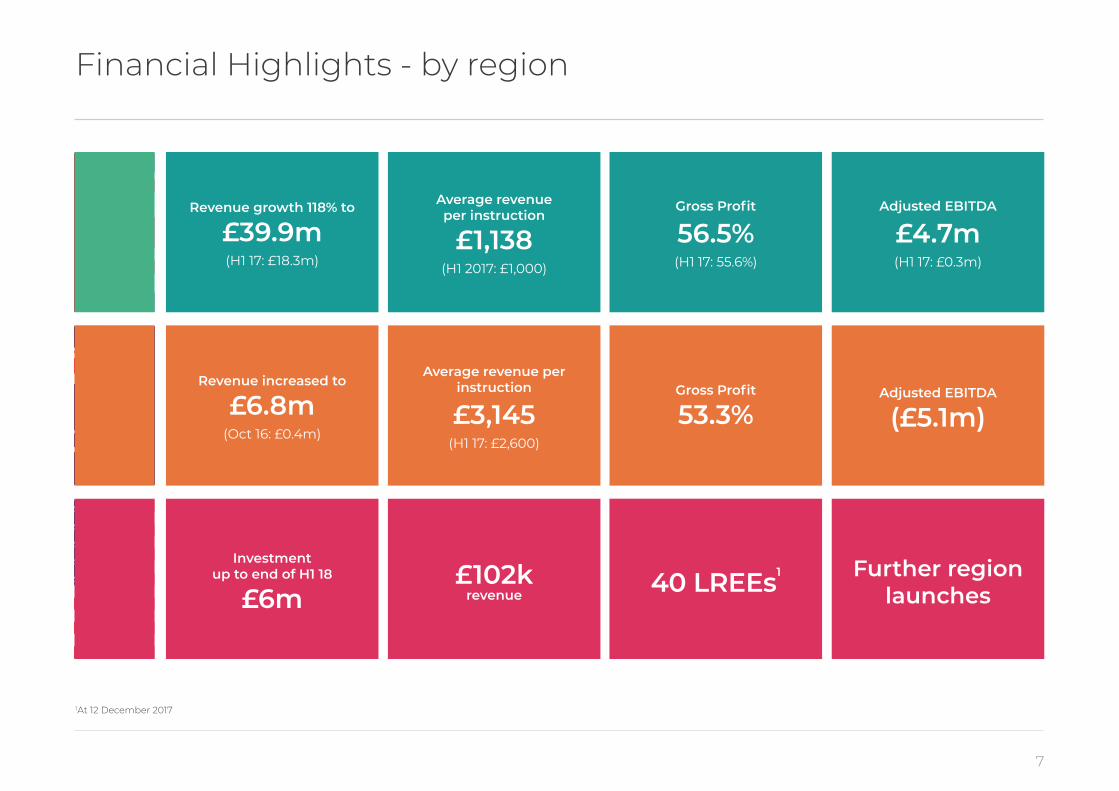
Financial Highlights - by region
Gross Profit
53.3%Adjusted EBITDA
(£5.1m)
Average revenue per instruction
£3,145 (H1 17: £2,600)
Revenue increased to
£6.8m(Oct 16: £0.4m)
Further region launches40 LREEs1£102k
revenue
Investmentup to end of H1 18
£6m
Average revenueper instruction
£1,138(H1 2017: £1,000)
Revenue growth 118% to
£39.9m(H1 17: £18.3m)
Gross Profit
56.5%(H1 17: 55.6%)
Adjusted EBITDA
£4.7m(H1 17: £0.3m)
1At 12 December 2017
8
1. At 12 December 2017.
Notes Adjusted EBITDA is defined by the Group as profit/(loss) before net finance costs, tax, depreciation, amortisation and share based payments charge.Financial data have not been rounded. As a result the arithmetic total of data presented in this document may vary slightly from the sum.
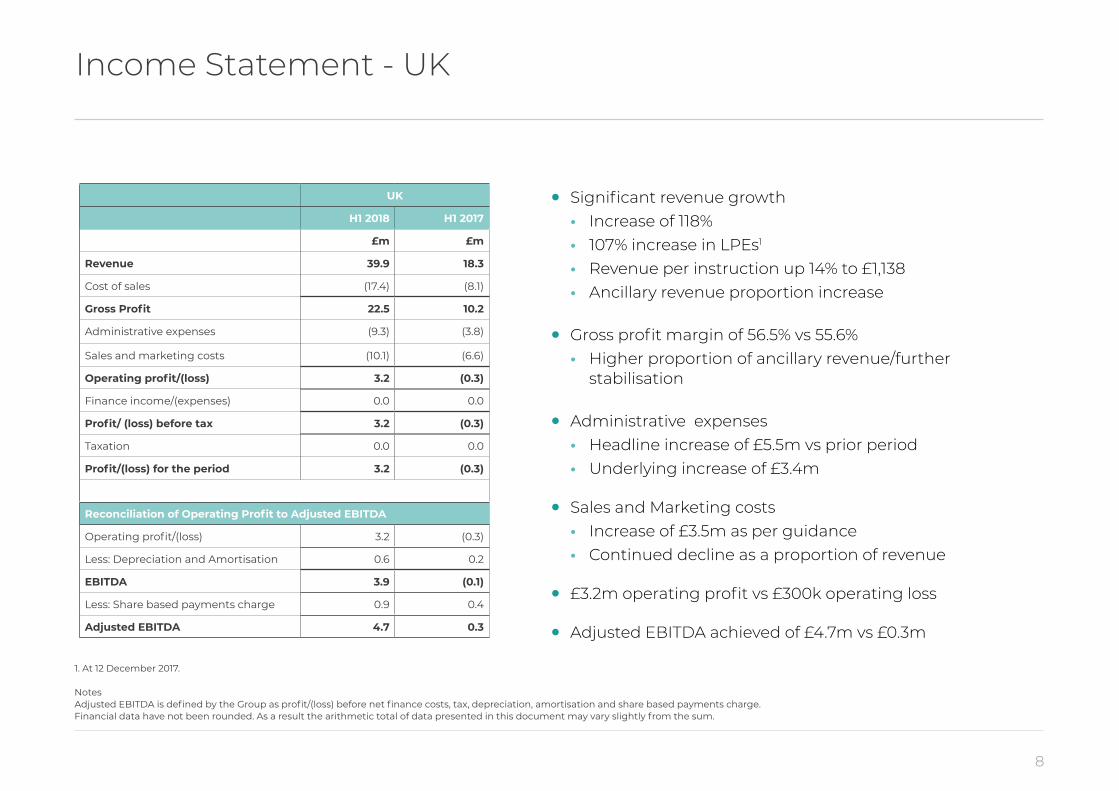
UK
H1 2018 H1 2017
£m £m
Revenue 39.9 18.3
Cost of sales (17.4) (8.1)
Gross Profit 22.5 10.2
Administrative expenses (9.3) (3.8)
Sales and marketing costs (10.1) (6.6)
Operating profit/(loss) 3.2 (0.3)
Finance income/(expenses) 0.0 0.0
Profit/ (loss) before tax 3.2 (0.3)
Taxation 0.0 0.0
Profit/(loss) for the period 3.2 (0.3)
Reconciliation of Operating Profit to Adjusted EBITDA
Operating profit/(loss) 3.2 (0.3)
Less: Depreciation and Amortisation 0.6 0.2
EBITDA 3.9 (0.1)
Less: Share based payments charge 0.9 0.4
Adjusted EBITDA 4.7 0.3
• Significant revenue growth • Increase of 118% • 107% increase in LPEs1
• Revenue per instruction up 14% to £1,138 • Ancillary revenue proportion increase
• Gross profit margin of 56.5% vs 55.6% • Higher proportion of ancillary revenue/further
stabilisation
• Administrative expenses • Headline increase of £5.5m vs prior period • Underlying increase of £3.4m
• Sales and Marketing costs • Increase of £3.5m as per guidance • Continued decline as a proportion of revenue
• £3.2m operating profit vs £300k operating loss
• Adjusted EBITDA achieved of £4.7m vs £0.3m
Income Statement - UK
9
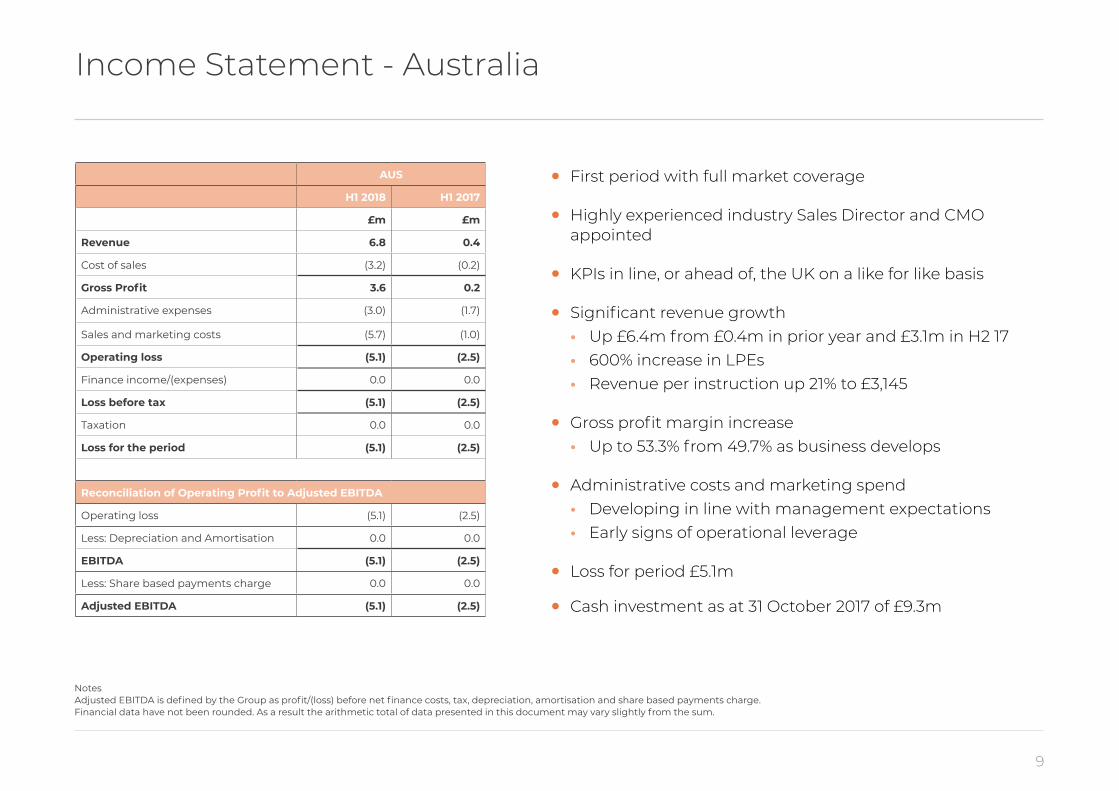
AUS
H1 2018 H1 2017
£m £m
Revenue 6.8 0.4
Cost of sales (3.2) (0.2)
Gross Profit 3.6 0.2
Administrative expenses (3.0) (1.7)
Sales and marketing costs (5.7) (1.0)
Operating loss (5.1) (2.5)
Finance income/(expenses) 0.0 0.0
Loss before tax (5.1) (2.5)
Taxation 0.0 0.0
Loss for the period (5.1) (2.5)
Reconciliation of Operating Profit to Adjusted EBITDA
Operating loss (5.1) (2.5)
Less: Depreciation and Amortisation 0.0 0.0
EBITDA (5.1) (2.5)
Less: Share based payments charge 0.0 0.0
Adjusted EBITDA (5.1) (2.5)
• First period with full market coverage
• Highly experienced industry Sales Director and CMO appointed
• KPIs in line, or ahead of, the UK on a like for like basis
• Significant revenue growth • Up £6.4m from £0.4m in prior year and £3.1m in H2 17 • 600% increase in LPEs • Revenue per instruction up 21% to £3,145
• Gross profit margin increase • Up to 53.3% from 49.7% as business develops
• Administrative costs and marketing spend • Developing in line with management expectations • Early signs of operational leverage
• Loss for period £5.1m
• Cash investment as at 31 October 2017 of £9.3m
Income Statement - Australia
Notes Adjusted EBITDA is defined by the Group as profit/(loss) before net finance costs, tax, depreciation, amortisation and share based payments charge.Financial data have not been rounded. As a result the arithmetic total of data presented in this document may vary slightly from the sum.
10
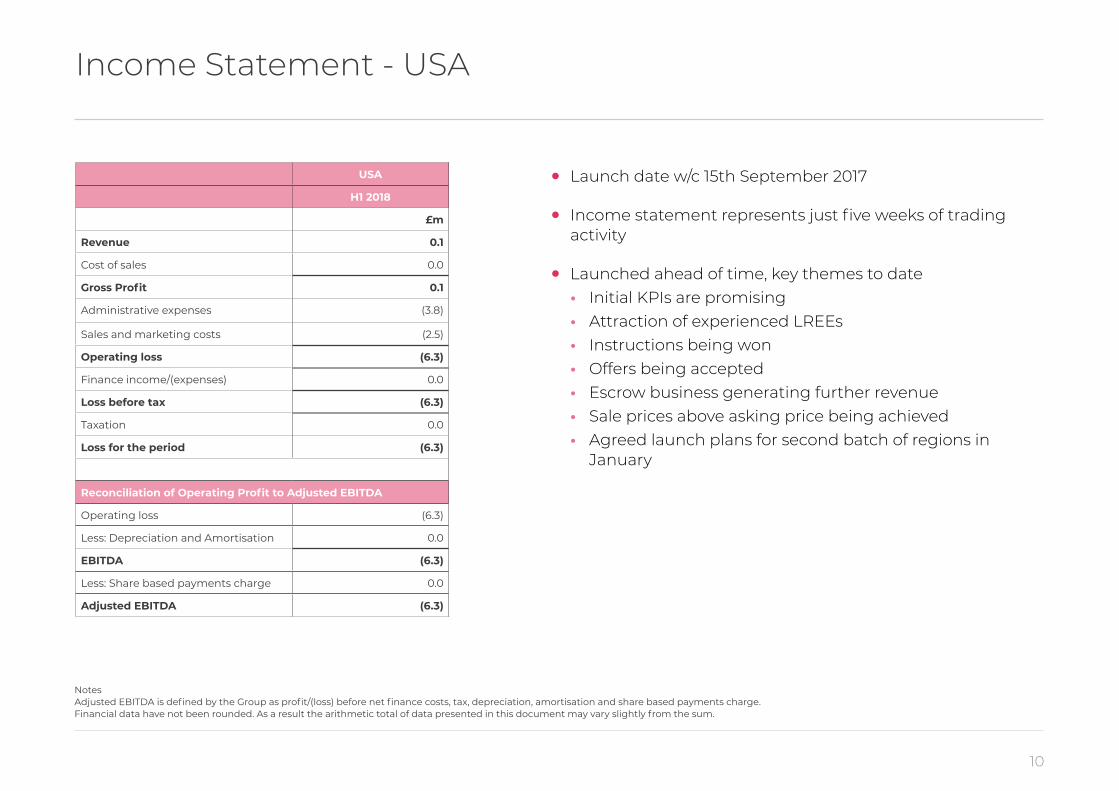
• Launch date w/c 15th September 2017
• Income statement represents just five weeks of trading activity
• Launched ahead of time, key themes to date • Initial KPIs are promising • Attraction of experienced LREEs • Instructions being won • Offers being accepted • Escrow business generating further revenue • Sale prices above asking price being achieved • Agreed launch plans for second batch of regions in
January
Income Statement - USA
USA
H1 2018
£m
Revenue 0.1
Cost of sales 0.0
Gross Profit 0.1
Administrative expenses (3.8)
Sales and marketing costs (2.5)
Operating loss (6.3)
Finance income/(expenses) 0.0
Loss before tax (6.3)
Taxation 0.0
Loss for the period (6.3)
Reconciliation of Operating Profit to Adjusted EBITDA
Operating loss (6.3)
Less: Depreciation and Amortisation 0.0
EBITDA (6.3)
Less: Share based payments charge 0.0
Adjusted EBITDA (6.3)
Notes Adjusted EBITDA is defined by the Group as profit/(loss) before net finance costs, tax, depreciation, amortisation and share based payments charge.Financial data have not been rounded. As a result the arithmetic total of data presented in this document may vary slightly from the sum.
11
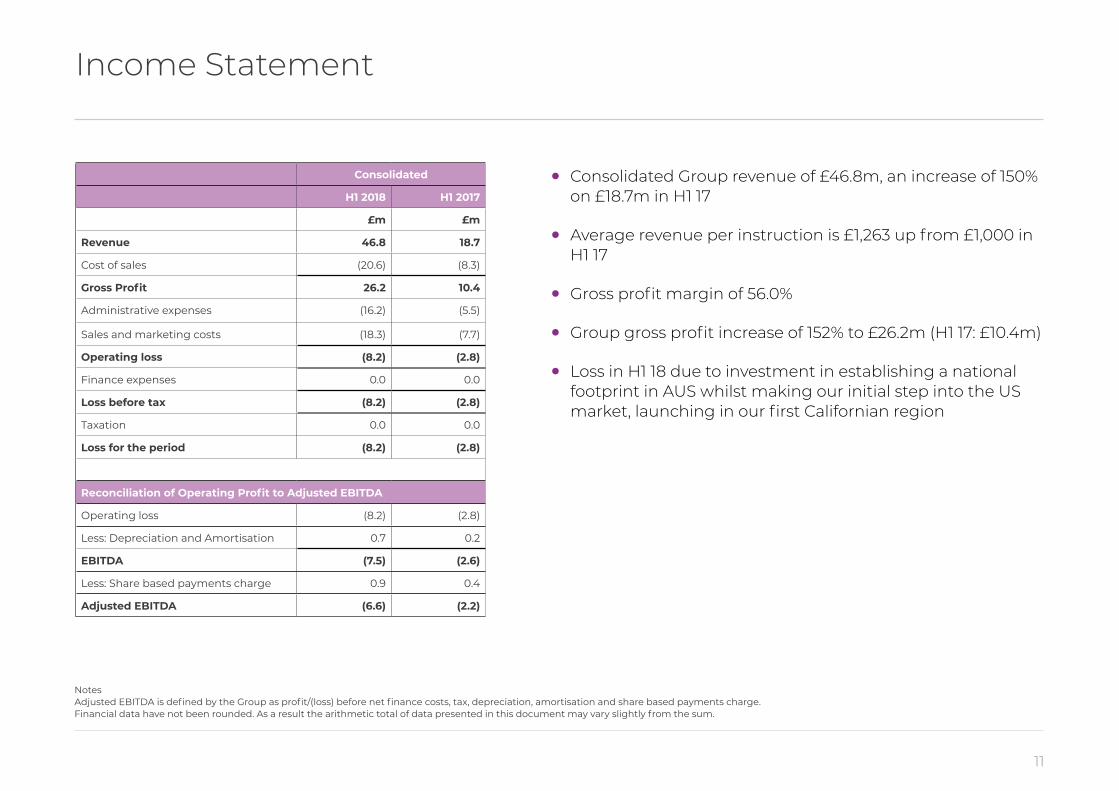
Consolidated
H1 2018 H1 2017
£m £m
Revenue 46.8 18.7
Cost of sales (20.6) (8.3)
Gross Profit 26.2 10.4
Administrative expenses (16.2) (5.5)
Sales and marketing costs (18.3) (7.7)
Operating loss (8.2) (2.8)
Finance expenses 0.0 0.0
Loss before tax (8.2) (2.8)
Taxation 0.0 0.0
Loss for the period (8.2) (2.8)
Reconciliation of Operating Profit to Adjusted EBITDA
Operating loss (8.2) (2.8)
Less: Depreciation and Amortisation 0.7 0.2
EBITDA (7.5) (2.6)
Less: Share based payments charge 0.9 0.4
Adjusted EBITDA (6.6) (2.2)
Income Statement
• Consolidated Group revenue of £46.8m, an increase of 150% on £18.7m in H1 17
• Average revenue per instruction is £1,263 up from £1,000 in H1 17
• Gross profit margin of 56.0%
• Group gross profit increase of 152% to £26.2m (H1 17: £10.4m)
• Loss in H1 18 due to investment in establishing a national footprint in AUS whilst making our initial step into the US market, launching in our first Californian region
Notes Adjusted EBITDA is defined by the Group as profit/(loss) before net finance costs, tax, depreciation, amortisation and share based payments charge.Financial data have not been rounded. As a result the arithmetic total of data presented in this document may vary slightly from the sum.

12
Cost contribution analysis - UK
UK
Period ended 31 Oct (£m) H1 2018 H1 2017 Growth
Revenue 39.9 18.3 118%
Underlying administration costs 6.7 3.3 107%
% of sales 17% 18%
Sales and marketing costs 10.1 6.6 53%
% of sales 25% 36%
Adjustments 2.6 0.5
Total non-direct costs 19.4 10.4
Evolution of marketing costs as a % of sales
91.7%
55.3%
36.1%
31.3%
25.2%
10
20
30
40
50
60
70
80
90
100
% o
f rev
enu
e
H1 16 H1 17H2 16 H2 17 H1 18
13
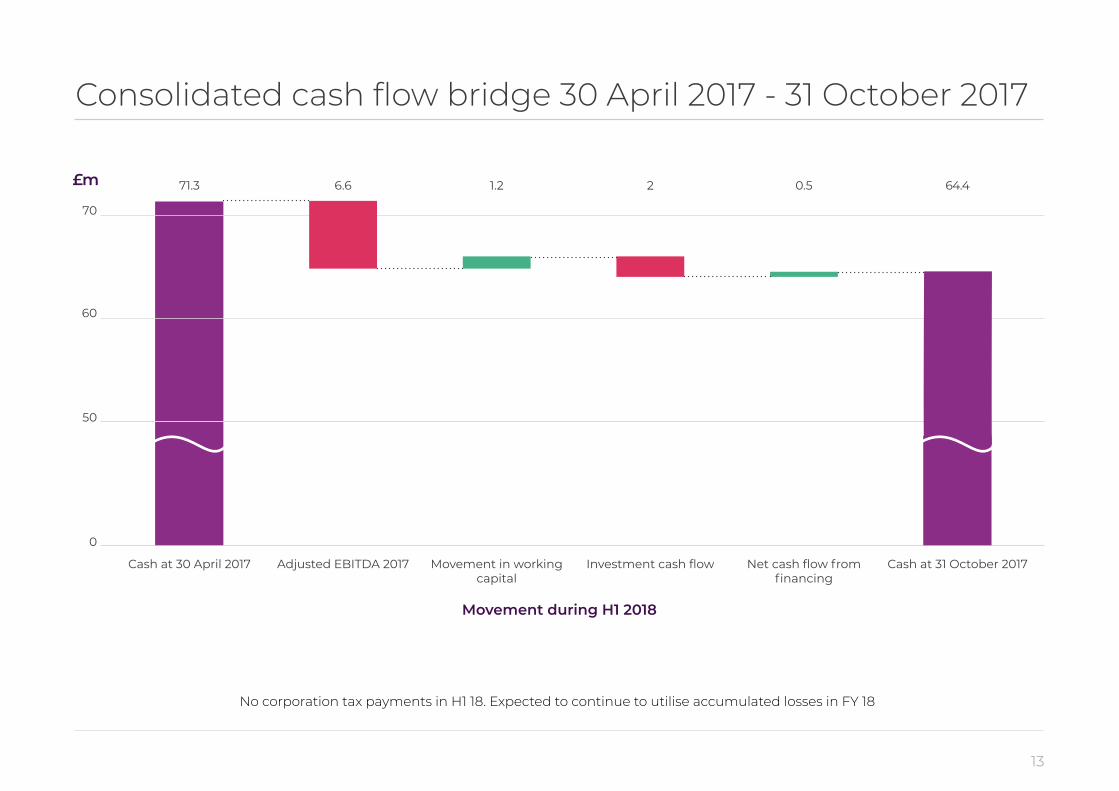
Consolidated cash flow bridge 30 April 2017 - 31 October 2017
Cash at 30 April 2017
71.3
70
50
60
Adjusted EBITDA 2017
6.6
Movement in working capital
1.2
Investment cash flow
2
Net cash flow from financing
0.5
Cash at 31 October 2017
64.4
Movement during H1 2018
£m
0
No corporation tax payments in H1 18. Expected to continue to utilise accumulated losses in FY 18

3 Strategic Overview
15
Leading historic change in the estate agency industry
Investing in people and innovation for growth
people culture innovation learning winning
16
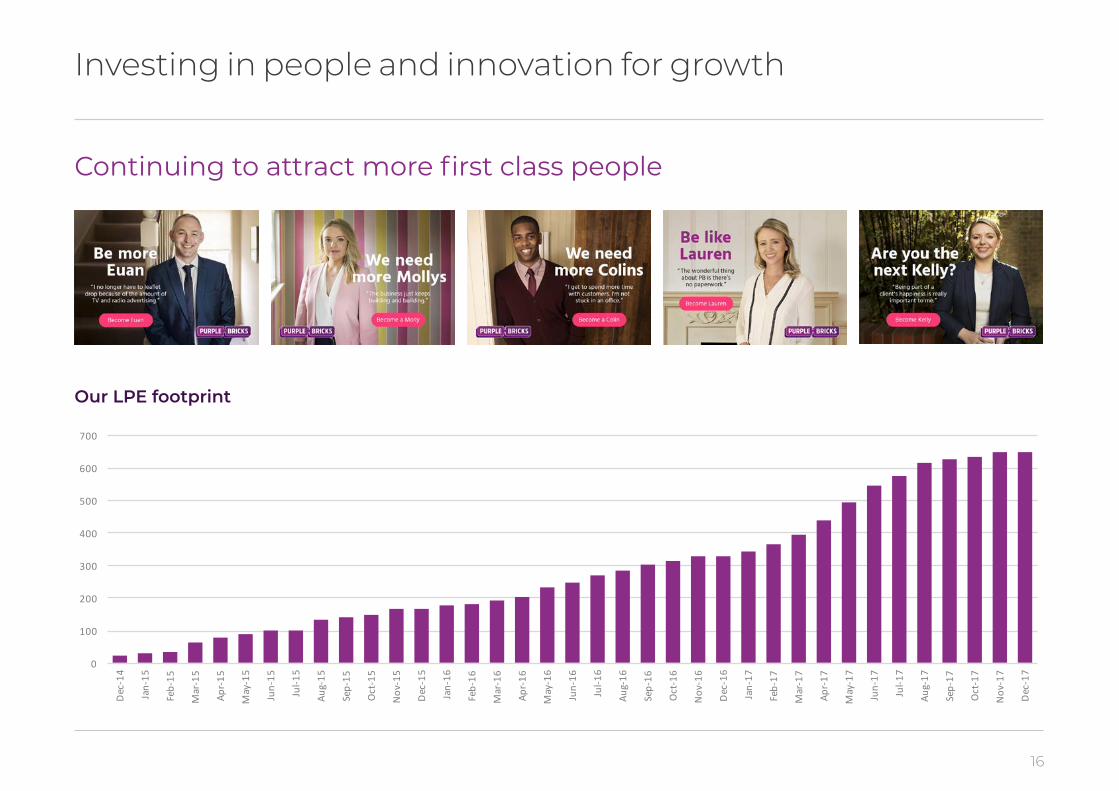
Investing in people and innovation for growth
Continuing to attract more first class people
0
100
200
300
400
500
600
700
Dec-14
Jan-15
Feb-15
Mar-15
Apr-15
May-15
Jun-15
Jul-1
5
Aug-15
Sep-15
Oct-15
Nov-15
Dec-15
Jan-16
Feb-16
Mar-16
Apr-16
May-16
Jun-16
Jul-1
6
Aug-16
Sep-16
Oct-16
Nov-16
Dec-16
Jan-17
Feb-17
Mar-17
Apr-17
May-17
Jun-17
Jul-1
7
Aug-17
Sep-17
Oct-17
Nov-17
Dec-17
Our LPE footprint
17
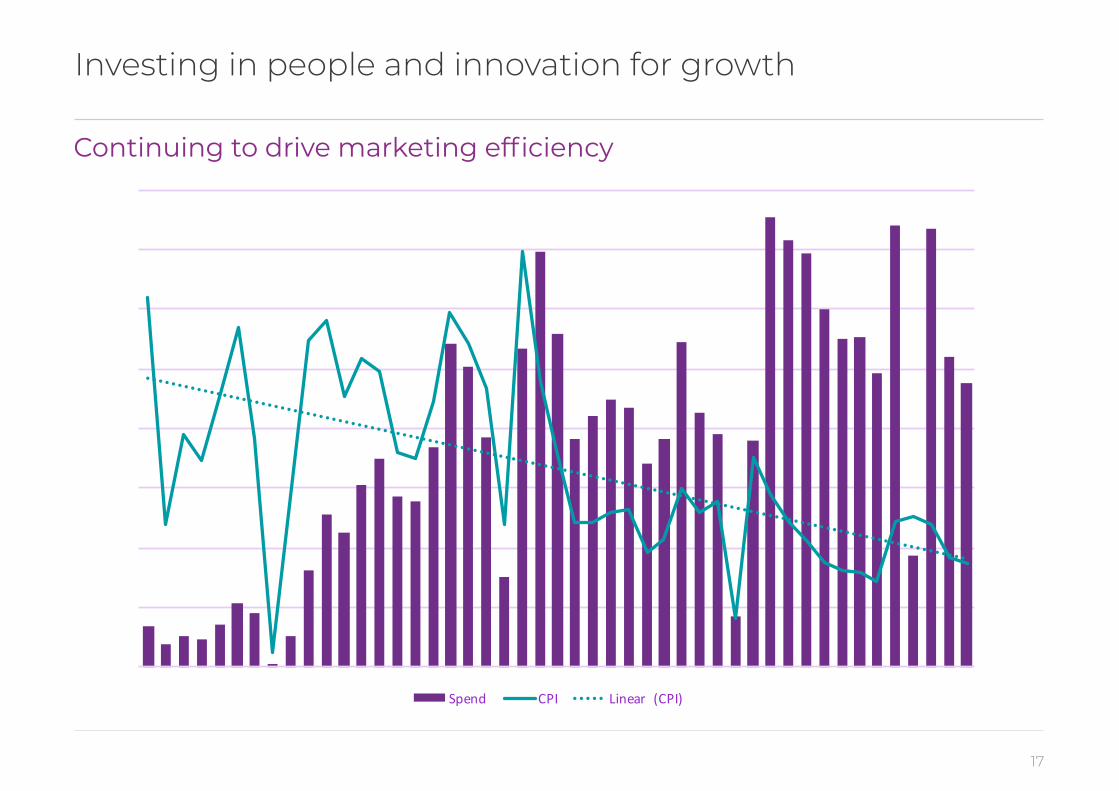
Continuing to drive marketing efficiency
Investing in people and innovation for growth
£0
£100
£200
£300
£400
£500
£600
£700
£800
£900
£1,000
£0
£200,000
£400,000
£600,000
£800,000
£1,000,000
£1,200,000
£1,400,000
£1,600,000
CPI
Spend
Spend CPI Linear (CPI)
£0
£100
£200
£300
£400
£500
£600
£700
£800
£900
£1,000
£0
£200,000
£400,000
£600,000
£800,000
£1,000,000
£1,200,000
£1,400,000
£1,600,000
CPI
Spend
Spend CPI Linear (CPI)
18
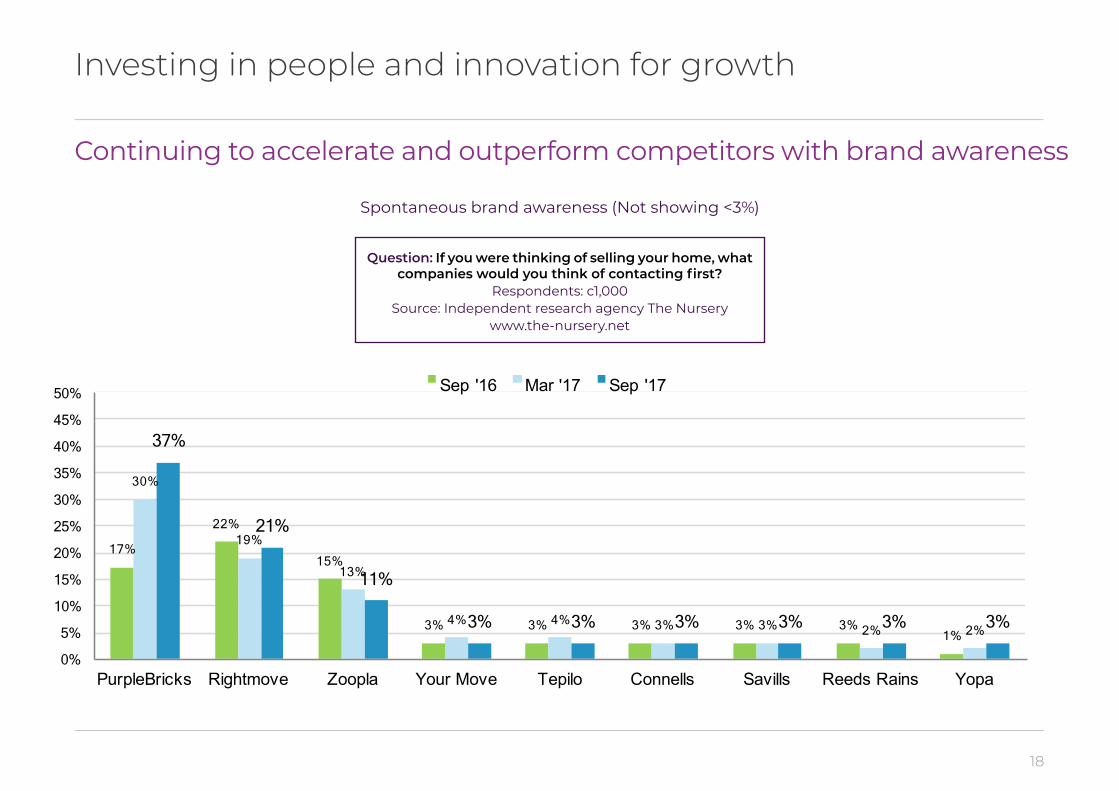
Investing in people and innovation for growth
Continuing to accelerate and outperform competitors with brand awareness
Spontaneous brand awareness (Not showing <3%)
Question: If you were thinking of selling your home, what companies would you think of contacting first?
Respondents: c1,000Source: Independent research agency The Nursery
www.the-nursery.net
17%
22%
15%
3% 3% 3% 3% 3% 1%
30%
19%
13%
4% 4% 3% 3% 2% 2%
37%
21%
11%
3% 3% 3% 3% 3% 3%
0%
5%
10%
15%
20%
25%
30%
35%
40%
45%
50%
PurpleBricks Rightmove Zoopla Your Move Tepilo Connells Savills Reeds Rains Yopa
Sep '16 Mar '17 Sep '17
19
Investing in people and innovation for growth
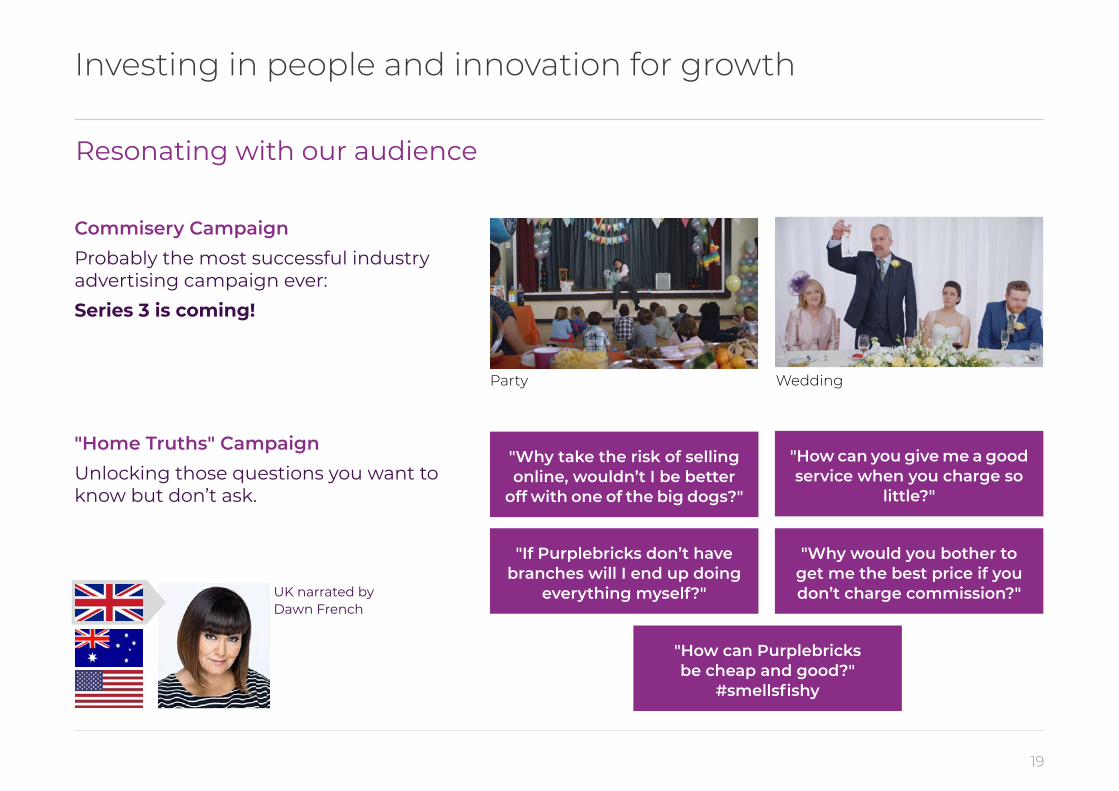
Resonating with our audience
Commisery Campaign Probably the most successful industry advertising campaign ever:Series 3 is coming!
"Home Truths" CampaignUnlocking those questions you want to know but don’t ask.
"Why take the risk of selling online, wouldn’t I be better
off with one of the big dogs?"
"How can Purplebricks be cheap and good?"
#smellsfishy
"Why would you bother to get me the best price if you don’t charge commission?"
"If Purplebricks don’t have branches will I end up doing
everything myself?"
"How can you give me a good service when you charge so
little?"
UK narrated by Dawn French
Party Wedding
20
Investing in people and innovation for growth
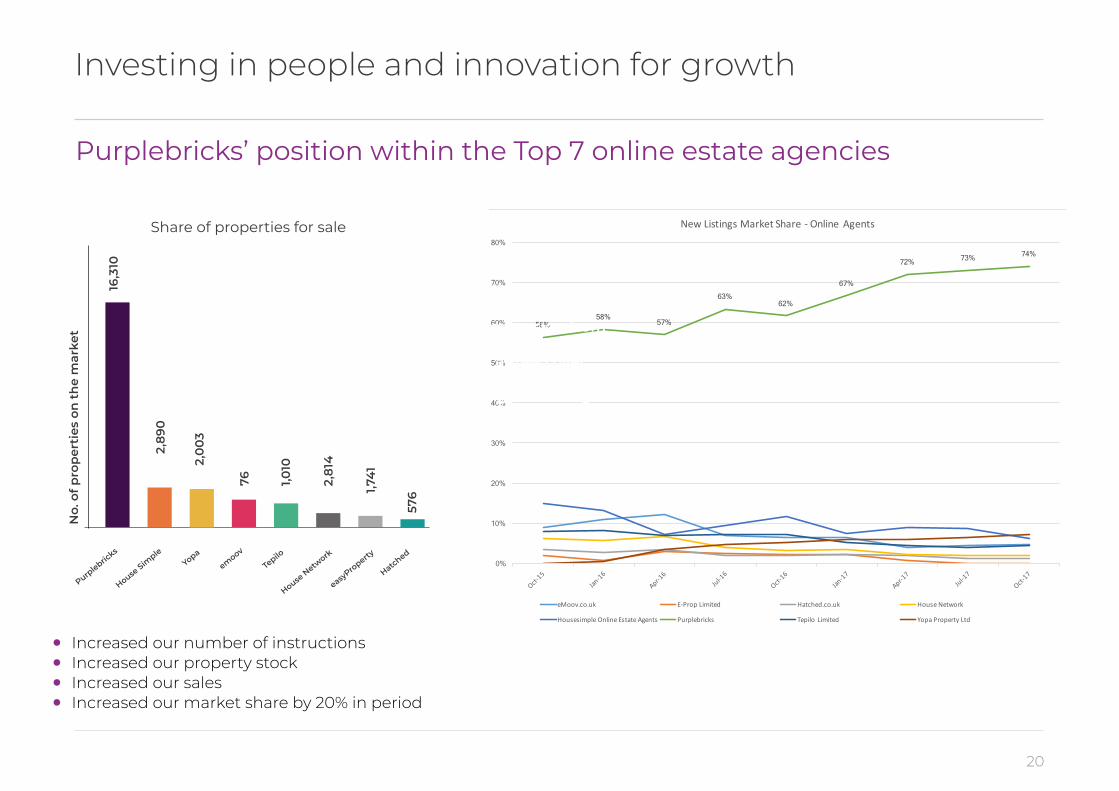
56% 58%
57%
63% 62%
67%
72% 73% 74%
0%
10%
20%
30%
40%
50%
60%
70%
80%
NewListingsMarketShare- OnlineAgents
eMoov.co.uk E-PropLimited Hatched.co.uk HouseNetwork
HousesimpleOnlineEstateAgents Purplebricks TepiloLimited YopaPropertyLtd
Share of properties for sale
Purplebric
ks
No.
of p
rop
erti
es o
n t
he
mar
ket
16,3
10
2,0
03
1,010
1,741
576
76 2,81
4
2,89
0
easyPro
perty
HatchedYopa
House Sim
ple
emoov
Tepilo
House N
etwork
• Increased our number of instructions• Increased our property stock• Increased our sales• Increased our market share by 20% in period
Purplebricks’ position within the Top 7 online estate agencies
Conversion frominstruction to sale
agreed over2
[85.5%]
21
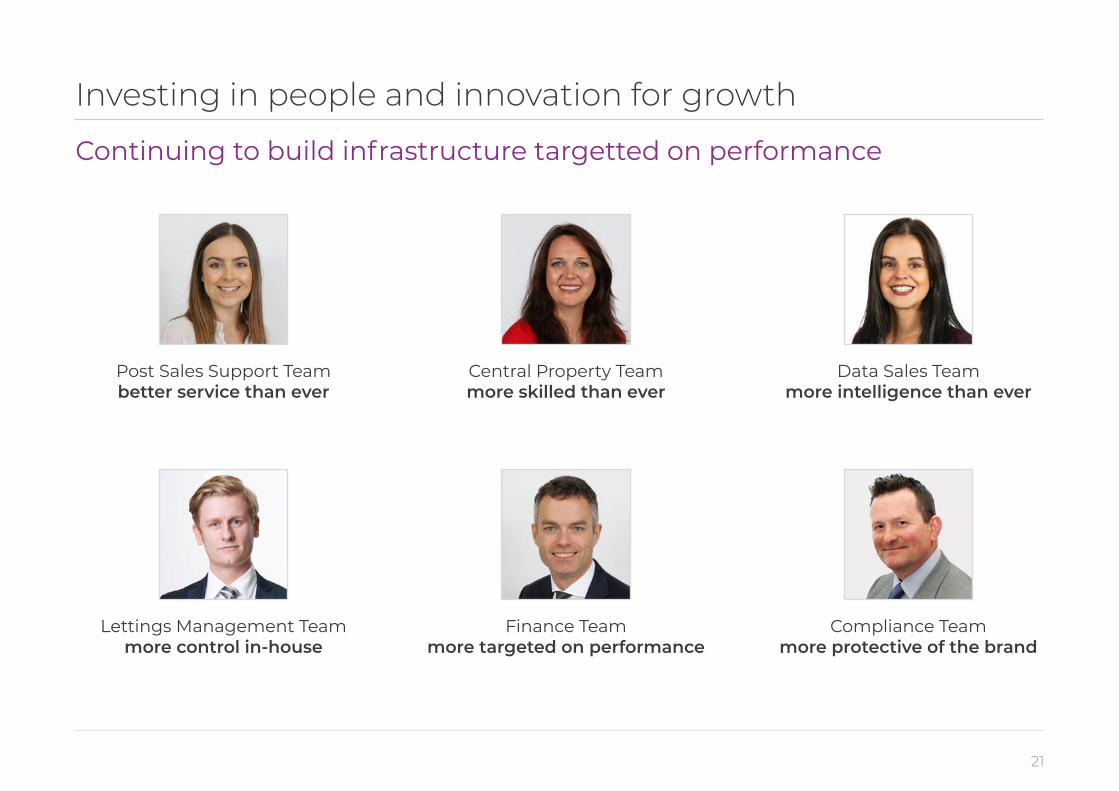
Investing in people and innovation for growth
Continuing to build infrastructure targetted on performance
Post Sales Support Teambetter service than ever
Central Property Teammore skilled than ever
Data Sales Teammore intelligence than ever
Lettings Management Teammore control in-house
Finance Teammore targeted on performance
Compliance Teammore protective of the brand
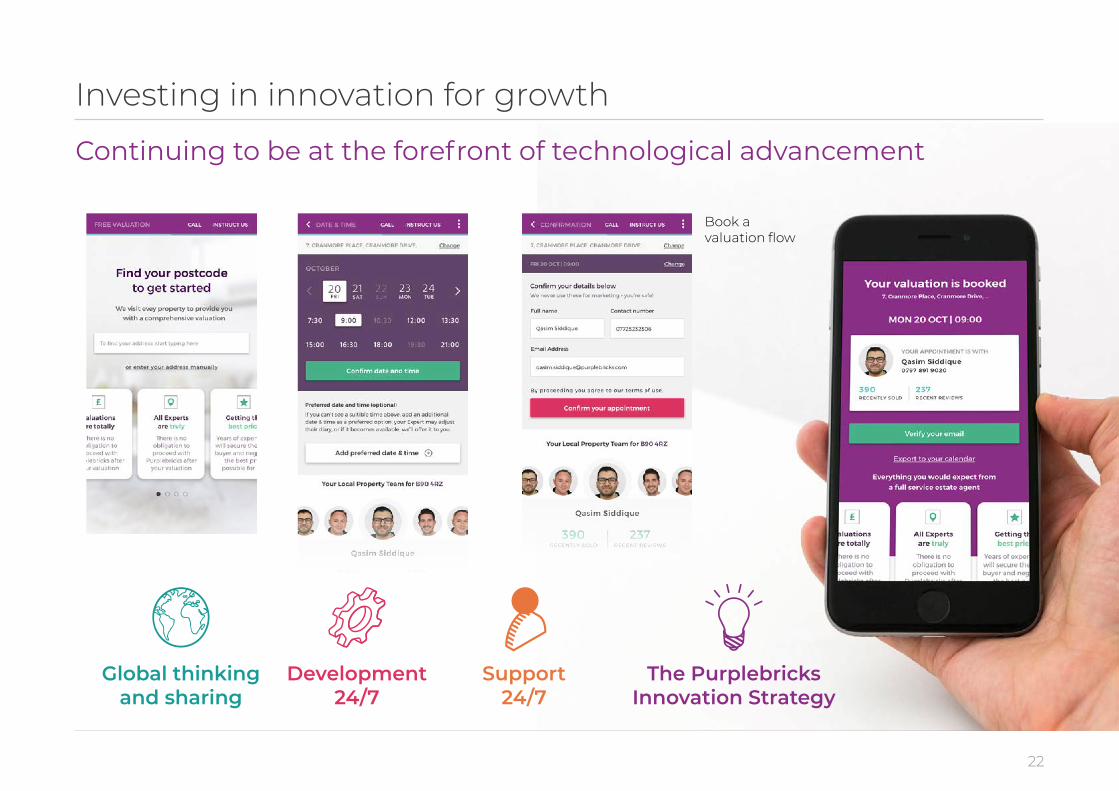
Book a valuation flow
22
Investing in innovation for growth
Continuing to be at the forefront of technological advancement
The Purplebricks Innovation Strategy
Global thinking and sharing
Development 24/7
Support 24/7
23
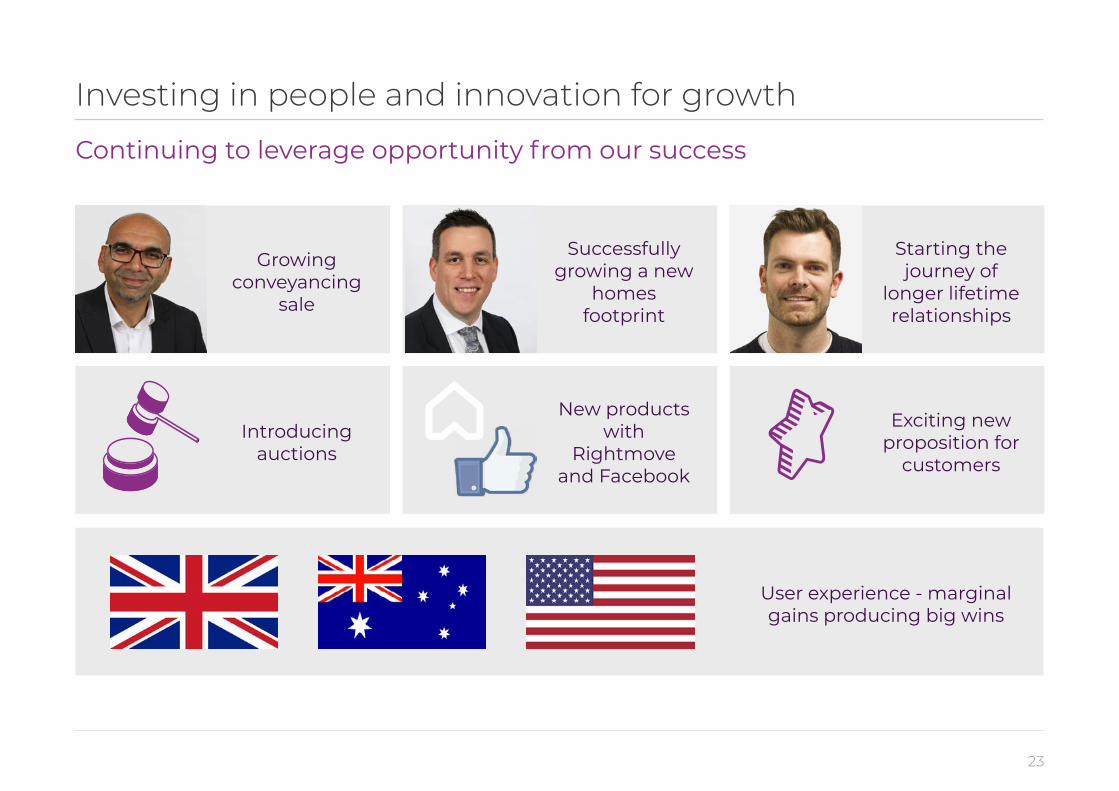
Investing in people and innovation for growth
Continuing to leverage opportunity from our success
Growing conveyancing
sale
Introducing auctions
Successfully growing a new
homes footprint
New products with
Rightmove and Facebook
Starting the journey of
longer lifetime relationships
Exciting new proposition for
customers
User experience - marginal gains producing big wins
24
0.0%
0.5%
1.0%
1.5%
2.0%
2.5%
3.0%
3.5%
4.0%
4.5%
£0£1,00
0,000£2,00
0,000£3,00
0,000£4,00
0,000£5,00
0,000
Apr-15 Ju
n-15Aug-1
5 Oct-15 Dec-15
Feb-16 A
pr-16 Jun
-16 Aug-16
Oct-16 Dec-16
Feb-17 A
pr-17 Jun
-17 Aug-17
Purp
lebr
icks
Ove
rallM
arke
tSh
are(%
)
Med
iaS
pend
MediaSpen
dandMarket
ShareGro
wth
Purplebric
ksCom
Yopa
HousesimpleL
td
Tepilo
Easyproper
tyCom
YourMoveE
stAgntLead
ersLtd
HomeSeller
Emoov
Cubbyhole
SavillsEst
Agnt
%Purplebric
ks
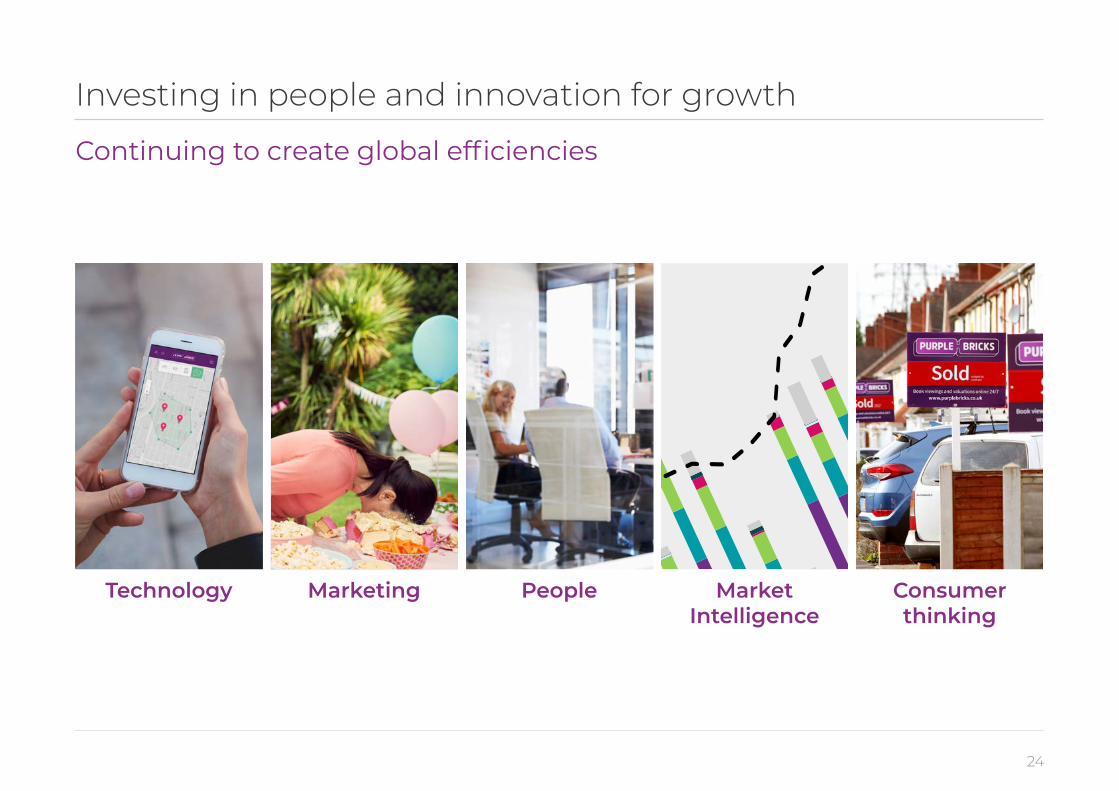
Investing in people and innovation for growth
Continuing to create global efficiencies
Technology Market Intelligence
Marketing Consumer thinking
People

25
Investing in people and innovation for growth
Continuing to invest in better informing our investors
26
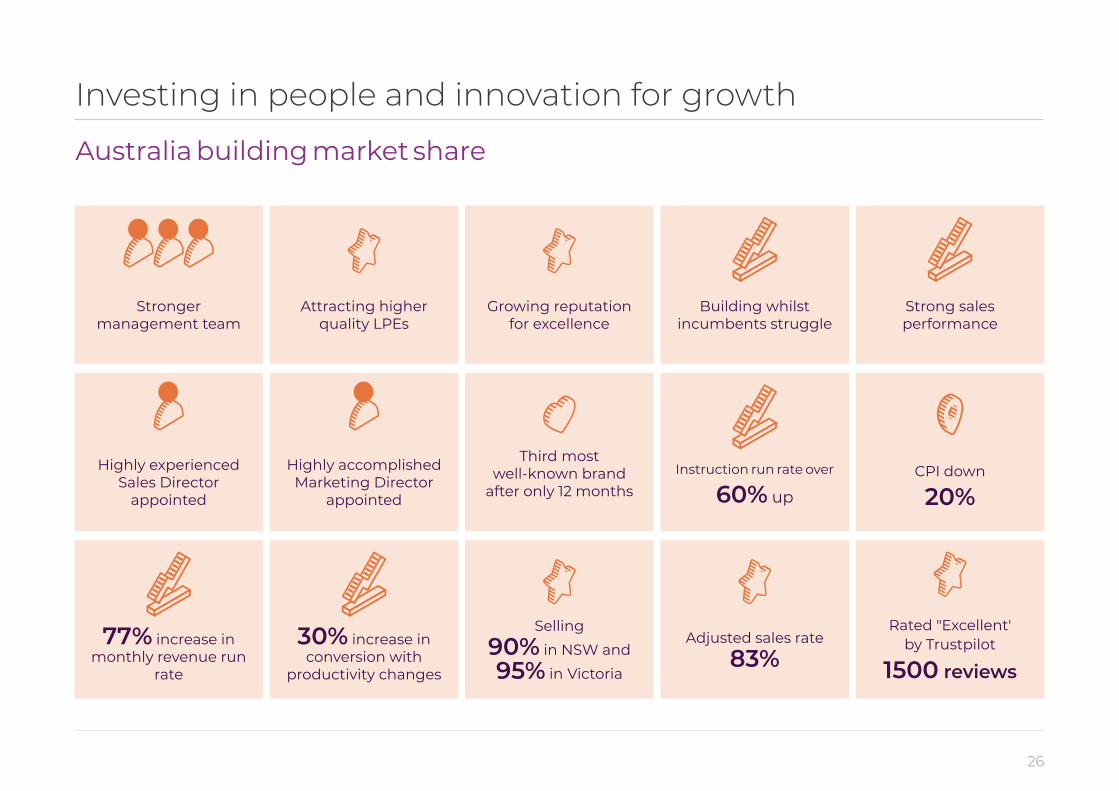
Investing in people and innovation for growth
Australia building market share
Stronger
management team
Highly experienced
Sales Director appointed
77% increase in
monthly revenue run rate
Attracting higher
quality LPEs
Highly accomplished
Marketing Director appointed
30% increase in
conversion with productivity changes
Building whilst
incumbents struggle
Instruction run rate over
60% up
Adjusted sales rate
83%
Growing reputation
for excellence
Third most well-known brand
after only 12 months
Selling
90% in NSW and
95% in Victoria
Strong sales performance
CPI down 20%
Rated "Excellent'
by Trustpilot
1500 reviews
27
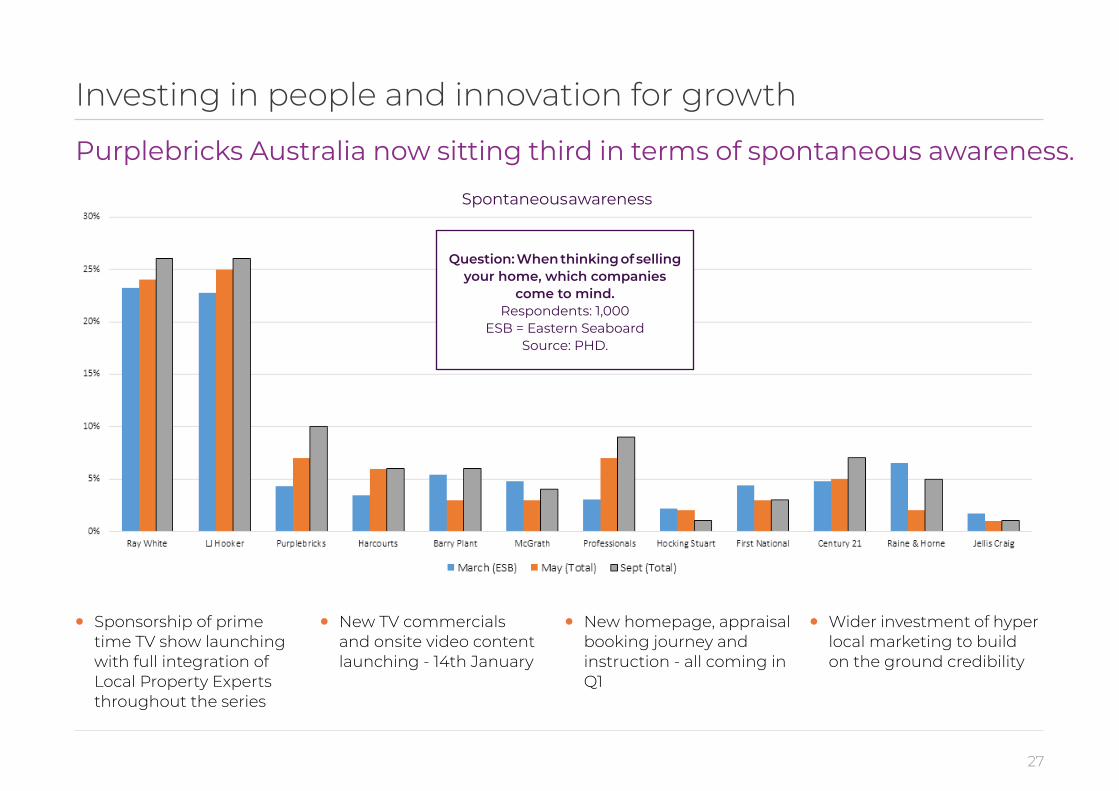
Investing in people and innovation for growth
Purplebricks Australia now sitting third in terms of spontaneous awareness.
• Sponsorship of prime time TV show launching with full integration of Local Property Experts throughout the series
• New TV commercials and onsite video content launching - 14th January
• New homepage, appraisal booking journey and instruction - all coming in Q1
• Wider investment of hyper local marketing to build on the ground credibility
Question: When thinking of selling your home, which companies
come to mind.Respondents: 1,000
ESB = Eastern SeaboardSource: PHD.
Spontaneous awareness

28
Headline: The US: An enormous opportunity
US real estate brokerage economics
£500,000
6% Sales Commission paid by seller to Listing Agent
$30,000
75% to Seller Agency $11,250
25% to Seller Broker $3,750
75% to Buyer Agency $11,250
25% to Buyer Broker $3,750
3% to Seller Agency $15,000
3% to Buyer Agency $15,000
• In the US, a real estate brokerage firm can monetise both sides of a transaction - buy and sell-side
• Typically, a real estate commission is 5-6% of the home's sale prices, paid by the seller
• In California, comparable to other states, it can be the same agent that represents a buyer and seller in the smae transaction, retaining 100% of the commission through a dual agency relationship
• In a traditional real estate model in the US, the broker will share a portion of the commission with real estate (independent contractors) that operate under their license
• It's estimated, the average commission payout is 75% to agents under a traditional real estate brokerage
29
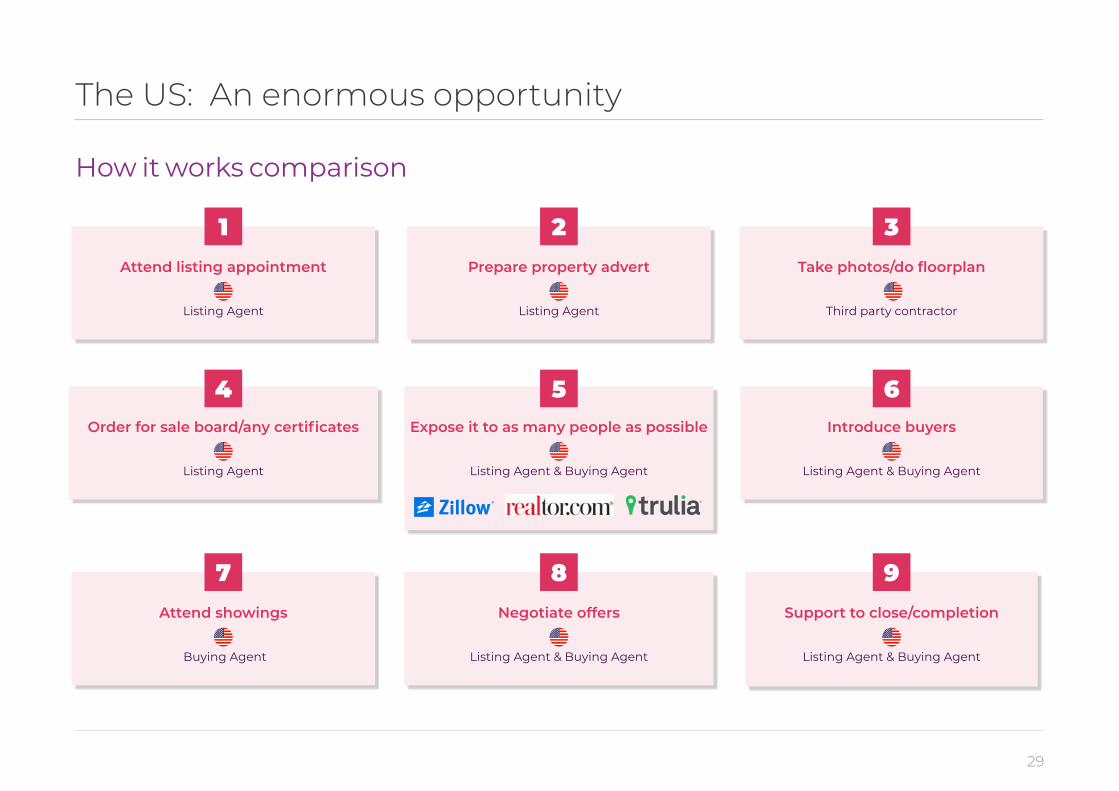
The US: An enormous opportunity
How it works comparison
Attend listing appointment
Listing Agent
Expose it to as many people as possible
Listing Agent & Buying Agent
Prepare property advert
Listing Agent
Take photos/do floorplan
Third party contractor
Attend showings
Buying Agent
Order for sale board/any certificates
Listing Agent
Negotiate offers
Listing Agent & Buying Agent
Support to close/completion
Listing Agent & Buying Agent
1
5
2 3
7 9
4
8
Introduce buyers
Listing Agent & Buying Agent
6

30
• Successfully developed our technology
• Attracted first class Local Real Estate Experts
• Launched Real Misery Campaign
• Significant web traffic and interest
• Converted traffic to listing appointments
• Conversion from appointment to listing ahead UK
• Secured listings
• Sales agreed with our LREEs and via third party agents
• Closed on a number of properties via our escrow business
• Feedback on people, model and technology all very positive
• Optimising: • Website and messaging • Book a listing appointment flow • The power of the technology
• We have a strong and growing management team
The US: An enormous opportunity
Early days: a really positive start
31
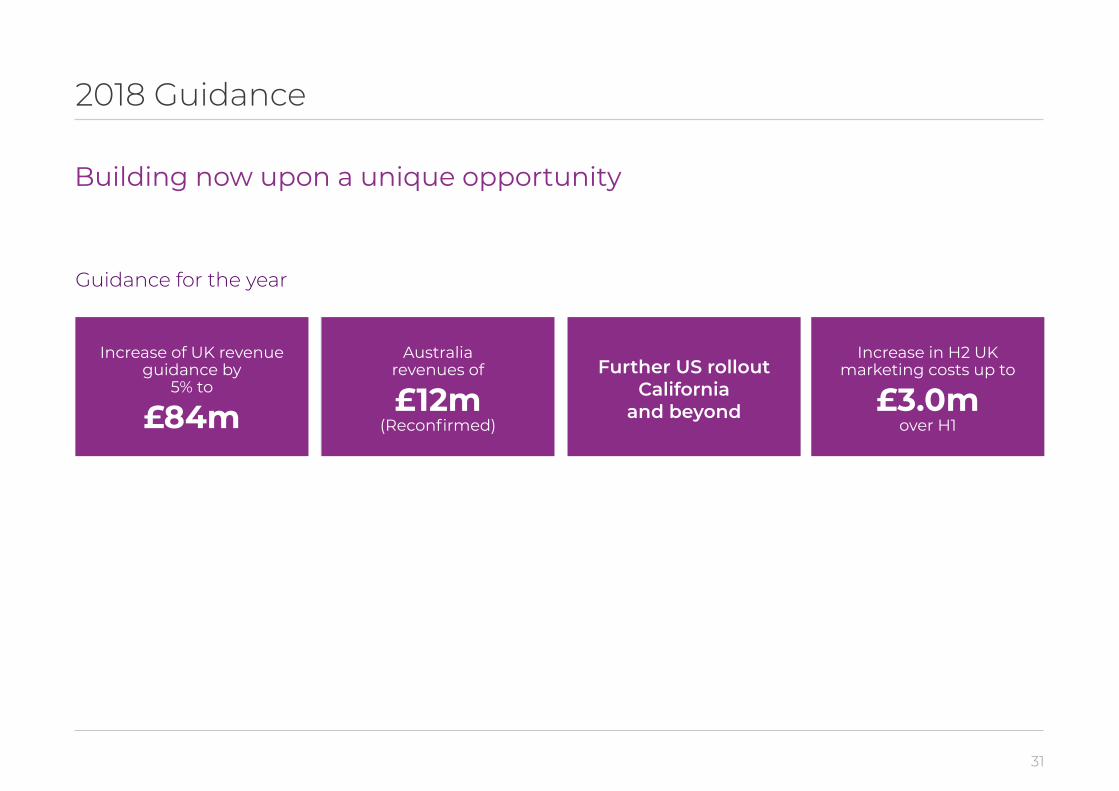
2018 Guidance
Increase of UK revenue guidance by
5% to
£84m
Increase in H2 UK marketing costs up to
£3.0m over H1
Guidance for the year
Australia revenues of
£12m(Reconfirmed)
Further US rolloutCalifornia
and beyond
Building now upon a unique opportunity

32
4 Summary
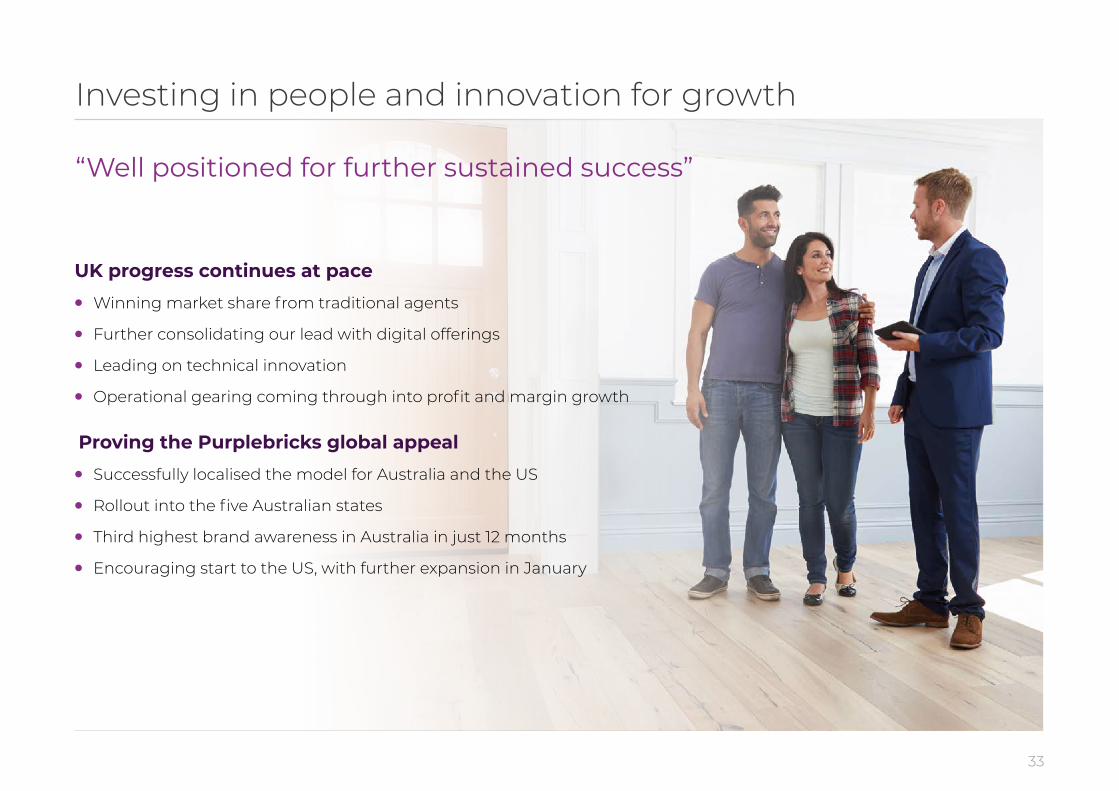
33
UK progress continues at pace
• Winning market share from traditional agents
• Further consolidating our lead with digital offerings
• Leading on technical innovation
• Operational gearing coming through into profit and margin growth
Proving the Purplebricks global appeal
• Successfully localised the model for Australia and the US
• Rollout into the five Australian states
• Third highest brand awareness in Australia in just 12 months
• Encouraging start to the US, with further expansion in January
Investing in people and innovation for growth
“Well positioned for further sustained success”

5 Q&A
Your opportunityto question
management
35
6 Appendix
36
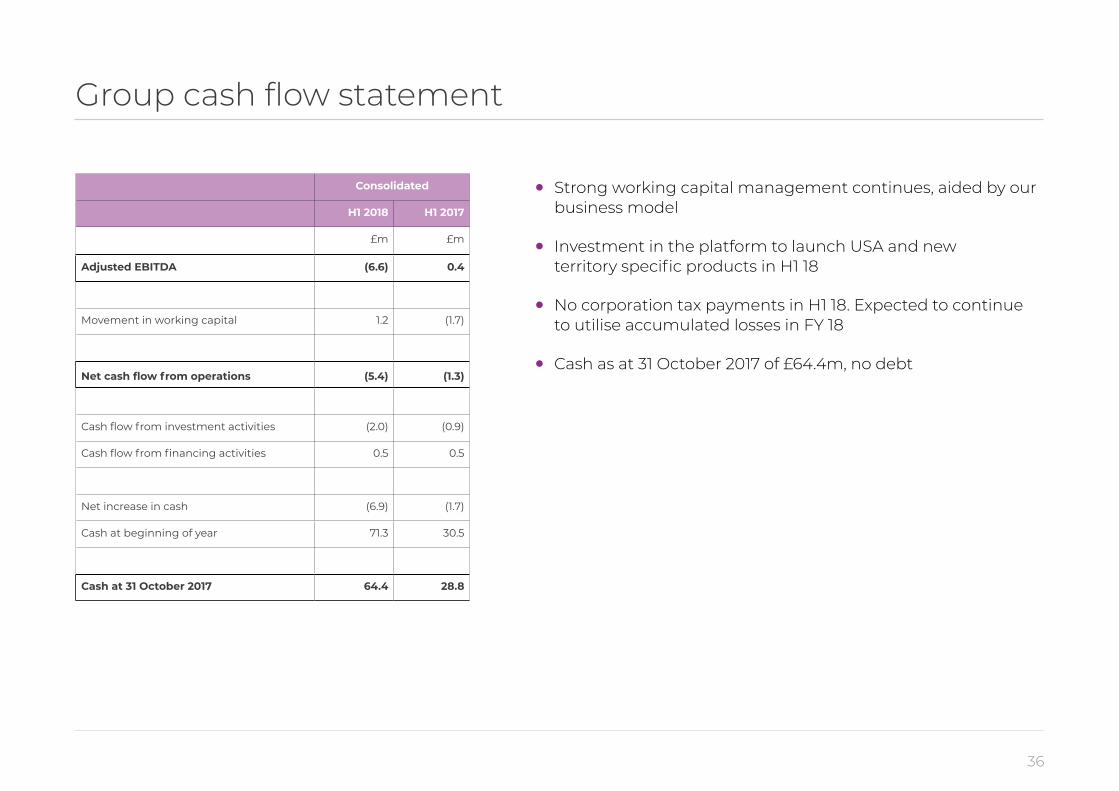
Group cash flow statement
Consolidated
H1 2018 H1 2017
£m £m
Adjusted EBITDA (6.6) 0.4
Movement in working capital 1.2 (1.7)
Net cash flow from operations (5.4) (1.3)
Cash flow from investment activities (2.0) (0.9)
Cash flow from financing activities 0.5 0.5
Net increase in cash (6.9) (1.7)
Cash at beginning of year 71.3 30.5
Cash at 31 October 2017 64.4 28.8
• Strong working capital management continues, aided by our business model
• Investment in the platform to launch USA and new territory specific products in H1 18
• No corporation tax payments in H1 18. Expected to continue to utilise accumulated losses in FY 18
• Cash as at 31 October 2017 of £64.4m, no debt
37
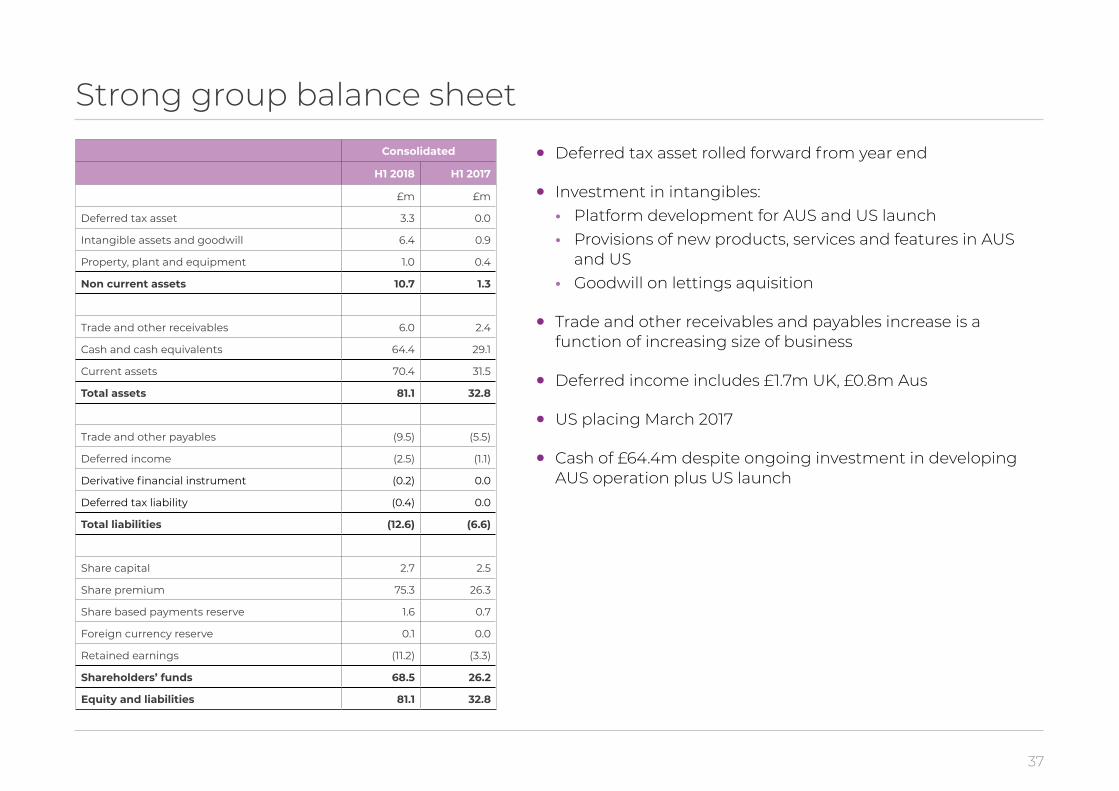
Strong group balance sheetConsolidated
H1 2018 H1 2017
£m £m
Deferred tax asset 3.3 0.0
Intangible assets and goodwill 6.4 0.9
Property, plant and equipment 1.0 0.4
Non current assets 10.7 1.3
Trade and other receivables 6.0 2.4
Cash and cash equivalents 64.4 29.1
Current assets 70.4 31.5
Total assets 81.1 32.8
Trade and other payables (9.5) (5.5)
Deferred income (2.5) (1.1)
Derivative financial instrument (0.2) 0.0
Deferred tax liability (0.4) 0.0
Total liabilities (12.6) (6.6)
Share capital 2.7 2.5
Share premium 75.3 26.3
Share based payments reserve 1.6 0.7
Foreign currency reserve 0.1 0.0
Retained earnings (11.2) (3.3)
Shareholders’ funds 68.5 26.2
Equity and liabilities 81.1 32.8
• Deferred tax asset rolled forward from year end
• Investment in intangibles: • Platform development for AUS and US launch • Provisions of new products, services and features in AUS
and US • Goodwill on lettings aquisition
• Trade and other receivables and payables increase is a function of increasing size of business
• Deferred income includes £1.7m UK, £0.8m Aus
• US placing March 2017
• Cash of £64.4m despite ongoing investment in developing AUS operation plus US launch