interisland wind programmatic eis - hawaii state energy office
TRANSCRIPT

The Future is Bright Creating a Clean Energy Economy
Mark B. Glick, Administrator Hawaii State Energy Office
20th Annual Conservation Conference Hawaii Conservation Alliance August 1, 2012

Overview
• State Energy Office purpose & role
• Clean energy as an economic
development strategy for Hawaii

3
Alaska: 3,022 mi
U.S. Mainland: 2,471 mi
Mexico: 3,397 mi
Costa Rica: 4,822 mi
Colombia: 5,551 mi
Chile: 6,698 mi
Ecuador: 5,450 mi
New Zealand: 4,613 mi
Taiwan: 5,285 mi
Fiji: 3,157 mi
Australia: 5,205 mi
Japan: 4,036 mi
China: 5,251 mi
Russia: 5,312 mi Canada: 3,550 mi
Indonesia: 6,276 mi
Papua New Guinea: 4,492 mi
Hawaii
Most Isolated Population Center on Earth

US vs Hawaii Electricity Prices State electricity prices are currently approximately 22 cents higher than US average
4
Reta
il El
ectr
icity
Pric
es-A
ll Se
ctor
s (¢
/kW
h)

Oahu Energy Cost Fuel oil at $132/BBL
5
PPA - Power Purchase Agreement FIT - Feed-in Tariff NEM - Net Energy Meeting

7-years at Office of Hawaiian Affairs •Office of Board Services •Economic Development
3 terms as Chair of Sierra Club Hawaii Chapter Executive Committee
•Lifetime Member
Energy Administrator Background

LAWS & REGS • RPS & EEPS Goals codified as law • FIT, Net Metering, Decoupling, RSWG • Transportation Goals
INCENTIVES & TTA • Tax Credits • Public Benefits Fee Administrator • US Dept. of Energy – formula grants,
ARRA, technical assistance
Carrots & Sticks

Hawaii Clean Energy Initiative Scenario Analysis
8
Scenario Analysis 2008-2009 • US DOE effort with input from
Hawaiian energy stakeholders and US DOE National Labs.
• Techno-economic evaluation of clean energy alternatives.
• Strategies added to HCEI Roadmap. Scenario Analysis Updates – 2012
• Updated analysis based on latest RE technology and market information.
• Incorporate several new scenarios. • To be updated routinely.

9
Scenario Installation & Capital Requirements
Renewable Energy Sources ($ / kWh) Scenario 8 Capital Cost Range
Solid Biomass 83 MW $2,000 - $6,000
Wind 1,060 MW $2,400 - $2,800
Geothermal 102 MW $3,000 - $5,000
Small Hydro 24 MW $2,500 - $4,000
Solar - Residential Roofs 179 MW $8,125 - $9,375
Solar PV (large roof/utility scale) 651 MW $6,500 - $7,500
MSW/Landfill Gas 77 MW $2,100 - $3,500
Ocean Energy (wave) 53 MW $2,000 - $7,600
Energy Efficiency 495 MW $70 - $100
Assumes $16 billion NPV CAPEX &“ break-even” when oil is $65 to $85 per barrel (bbl).

A Focused Strategic Plan
Mission: Deploy clean energy infrastructure as a
catalyst for economic growth, innovation, and test bed investments.
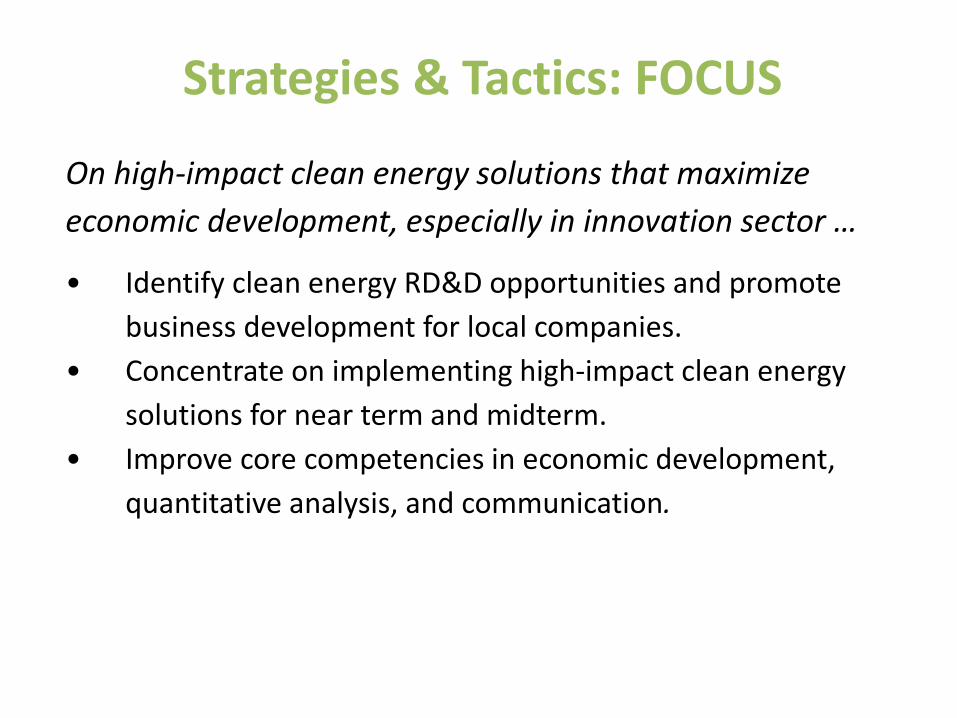
Strategies & Tactics: FOCUS
On high-impact clean energy solutions that maximize economic development, especially in innovation sector …
• Identify clean energy RD&D opportunities and promote business development for local companies.
• Concentrate on implementing high-impact clean energy solutions for near term and midterm.
• Improve core competencies in economic development, quantitative analysis, and communication.

Smart Grid: A Promising Innovation
12
Benefits • Allows for increased renewable energy penetration • Demand response/load shedding reduces the need for
spinning reserves Reduces the amount of oil imported
• Allows for quicker voltage balancing Increases grid reliability
Strong Market Potential • $3.4 billion in recent DOE grants for smart grid projects &
grid upgrades
Oahu Hawaii Maui Lanai Molokai Kauai Total Capacity (MW) 1672 270 261 9.3 11.8 128 Statewide Capacity (%) 71.1% 11.5% 11.1% 0.4% 0.5% 5.4% Net peak demand (MW) 1216 203 204 5.4 6.3 78 Total Reserves (MW) 456 67 57 3.9 5.5 50
Peak Electricity Demand and Total Generation Capacity

Solar: Shining Bright in Hawaii
13
Solar industry growing at rapid rate as a result of incentives and component price drops.
Solar generation increased from less than 1% of total renewable generation in 2007 to more than 8% in 2011. Solar generation is approximately 1% of total electricity generation.
0.8% 1.5% 3.8%
5.9% 8.1%
0%
5%
10%
2007 2008 2009 2010 2011
% of
Ren
ewab
le
Gen
erat
ion
Source: 2007-2011 Annual RPS Reports, PUC
Biomass Waste 31%
Geothermal 20%
Solar 8%
Hydro 7%
Wind 29%
Biofuels 5%
Annual Capacity Installed (MWs)
Cost per watt for PV installation has dropped by half in the past decade. Estimated Cost $/Watt Installed 2002 2012 %∆
Residential PV $ 10.60 $ 5.50 -48%
Commercial PV $ 8.82 $ 3.75 -57%

Wind: Advancing
14
Existing and Under Development Projects • Wind currently makes up 31% of total renewable generating capacity. • 2012 will see the addition of 3 new wind farms, totaling over 100 Mw
of new capacity doubling Hawaii's installed capacity. Challenges of Wind In Hawaii
• Small non-interconnected electrical grids make adding additional intermittent generating capacity harder and more expensive then traditional generators.
• Limited land, cultural and social issues are challenging. • Hawaii's endangered birds and plants complicate sitting a wind farm.
Solutions • Undersea cable linking electricity grids will make adding more
intermittent wind easier as well as bring the outer island resources to the load center on Oahu.
• Increased battery storage and greater EV use can stabilize local grids. • Habitat conservations banks will reduce the cost of mitigating for
incidental endangered species takes.
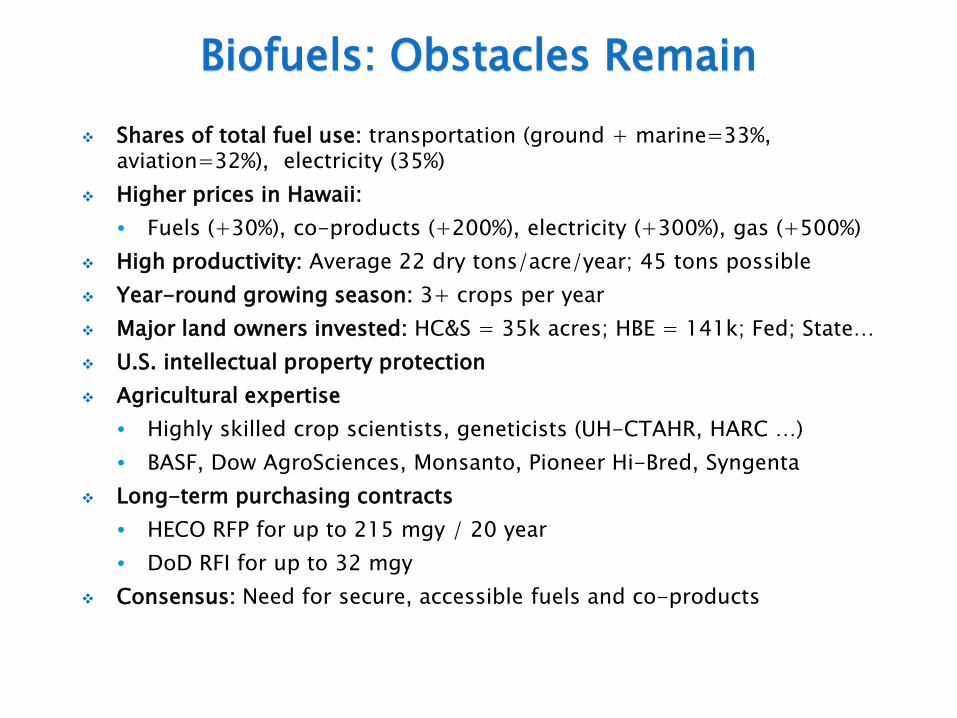
Biofuels: Obstacles Remain
15
Shares of total fuel use: transportation (ground + marine=33%, aviation=32%), electricity (35%)
Higher prices in Hawaii: • Fuels (+30%), co-products (+200%), electricity (+300%), gas (+500%)
High productivity: Average 22 dry tons/acre/year; 45 tons possible Year-round growing season: 3+ crops per year Major land owners invested: HC&S = 35k acres; HBE = 141k; Fed; State… U.S. intellectual property protection Agricultural expertise
• Highly skilled crop scientists, geneticists (UH-CTAHR, HARC …) • BASF, Dow AgroSciences, Monsanto, Pioneer Hi-Bred, Syngenta
Long-term purchasing contracts • HECO RFP for up to 215 mgy / 20 year • DoD RFI for up to 32 mgy
Consensus: Need for secure, accessible fuels and co-products

Geothermal: Enormous Potential
16
Cheaper than oil and most other renewable resources • LCOE estimated $0.08-$0.12 / kWh
Utility Scale potential only on Big Island and Maui with potential to provide 74%-210% of the state’s 2030 RPS target if islands were interconnected
Fully commercial & mature industry: Ormat is industry leader • Operates only geothermal power plant in Hawaii (since 1993) 30 MW Puna Geothermal Venture; permitted for 60 MW total 8 MW addition dispatchable
Local developers: Innovations Development Group; Moku Power High upfront costs
• Exploration costs as much as 42% of development expenses • Production wells cost up to $10 million each; initial success rate only 25% • Estimated 5 year minimum lead time to production
Demand Constraints • Limited need for base load power • Resource is greater than island grids can accept

Strategies & Tactics: LEVERAGE
Resources through federal, county and private sector partnerships using HCEI as a key driver …
• Serve as business systems integrator, resolve project implementation and permitting barriers. • Advocate for programs, policies and incentives to make clean energy development cost-effective. • Connect partnerships and resources to develop business opportunities, resolve policy barriers, and technical hurdles. • Seek federal funding and private investment opportunities.

Interconnection/Reliability Standards
18
KIUC Proposed Tariff Docket – Doc. No. 2006-0498 (closed 2008) • Created KIUC Tariff 2 Distributed Generation Interconnection Policies and Procedures
Feed-in Tariff – Doc. No. 2008-0273 (open) • Created HECO FIT, Reliability Standards Working Group (RSWG), Tech Supp Group, Tech Review Comm
PUC to re-examine FIT Program Fall 2012
Hawaiian Electric Rule 14H – Doc. No. 2010-0015 (open) • Requires IRS review/approval by HECO companies for distribution grids w/ high renewable penetration
IRS process streamlined by PUC in 2011
Implementation of Reliability Standards – Doc. No. 2011-0206 (open) • Following FIT, directs HECO to develop standards to reliably integrate high renewable penetration
RSWG (Independent Facilitator) to recommend by end of 2012 streamlined interconnection screening processes for HECO Incorporate different KIUC and HECO screening processes
SB2787 (2012) • PUC to (1) develop, adopt, enforce reliability standards and interconnection requirements, (2) contract 3P
Hawaii Energy Reliability Administrator, and (3) create electricity reliability surcharge HERA to implement RSWG/IRS docket findings, new interconnection Hawaii Admin Rules likely req’d
Integrated Resource Planning – Doc. No. 2012-0036 (open) • HECO to incorporate scenario planning to capture variations in planning assumptions/forecasts
RSWG to ID overlaps between IRS and IRP dockets RSWG to develop recommended list of reliability issues and/or related studies Created Advisory Group to represent interests affected by HECO resource plans

Permitting: Breaking Down Barriers
19
Legislative Actions (recent) • Act 97 (2012) – Removes Geothermal Subzone designation, impacts county geothermal resource permit • Act 217 (2011) – Allows solar on limited B and C agricultural lands (10% or parcel/20 acres) • HRS 201N (Renewable Energy Facility Siting Process) HSEO developing REFSP to assist projects responding to HECO 200MW RFP
Regulatory/Policy Actions • Ongoing HSEO consultation and coordination w/ agencies, developers, stakeholders • Priority permit processing for renewable energy projects by all state agencies • Priority to place renewable energy projects on State-owned lands, can directly negotiate leases w/out RFP • City & County of Honolulu: 2012/INT-1 (guidance for utility-scale solar installations) • Maui County: Procedure No. DSA 18.0 (guidance on ground and roof mounted solar/wind) • Hawaii County: 2012 Ordinance (guidance for alternative energy project permitting) • Counties developing policies to appropriately assess renewable energy project property taxes
Electronic Processing • HSEA Online Permitting Wizard (ARRA) – Beta form available, expected completion Summer 2012 Creates electronic Permit Plan for individual projects, compliments DRAFT Permitting Guidebook
• DOH ePermitting Portal (ARRA/ESSF) – Beta form available, expected completion Summer 2012 DOH/Windsor refining tool after initial public testing period, uploading all DOH permit applications
• DPP Online Building Permits Obtain solar and electric vehicle Building Permits from City and County of Honolulu
• HSEO/Office of Planning GIS for Renewable Energy Resource Mapping - expected completion Winter 2012 BEI Consulting to develop GIS to ID energy resource layers and relevant development information
• Electric Vehicle Website/Application - under procurement HSEO developing website/mobile application to identify EV charging stations and relevant information

Strategies & Tactics: REACH
Objectives and maintain strong communication and outreach to key stakeholders and public …
• Analyze data and results to identify best practices and ensure goals are met. • Provide access to clean energy data, tools and information online. • Communicate achievements and provide outreach through mass media, select events and public briefings.

21
2012 Asia Pacific Clean Energy Summit and Expo
High-level global networking:
Present your technology, initiative or company
Find project support from DOD, Hawaii, Korea, Japan, China & Global Partners
Participate in Defense Energy Challenge

22
Energy Office International Agreements
22
Projects Japan-US Island Grid Project Korea Smart Grid Project Clean Energy Investment and Deployment Program
Description Smart grid community demo involving Kihei residential and commercial utility customers
Micro smart grid demo and EV sharing program involving Oahu hotels and resorts
Program facilitating Chinese investment and deployment of clean energy projects in Hawaii
Objective Test Bed of the Asia-Pacific Test Bed of the Asia-Pacific Clean Energy Deployment
Partner NEDO KSGI CCPIT
Participating Organizations
Japan Hitachi, Mizuho, CyberDefense Hawaii US DOE & national labs, HECO, MECO, HNEI, MEDB, Maui County
Korea LG Electronics, Nara Controls, Hyundai, Hyosung, KT Hawaii US DOE & national labs, HECO, HNEI, Royal Hawaiian Hotel, Moana Surfrider Hotel
TBD CCPIT will vet and forward companies interested in investing or deploying clean energy projects in Hawaii, DBEDT to facilitate companies
Status MOU Completed Nov. 2011 Volunteer Recruitment to Begin Shortly
MOU Expected Oct. 2012 Korean Consortium visiting Hawaii in June to negotiate MOU
MOU Expected Aug. 2012 DBEDT completing draft MOU for review
International agreements advance Hawaii’s clean energy infrastructure deployment and solidify Hawaii as the clean energy test-bed of the Asia Pacific.

Midterm Goals & Objectives (2015)
23

• Meet 15% Renewable Portfolio Standard (RPS) target. • Meet 2015 Energy Efficiency Portfolio Standard (EEPS) target. • Displace 50 Million Gallons/Year of oil in the transportation sector.
Implement HCEI 70% Clean Energy Benchmarks
24

25
Grow Hawaii’s Clean Energy Innovation Sector
• Develop clean energy RD&D sector with annual revenues of $100 M.
• Attract $100 M in project financing for emerging technologies between 2011 and 2015.
• Add 400 clean energy RD&D jobs between 2011 and 2015.

26
Expand on Hawaii’s Position as a National Clean Energy Leader
• Maintain top 5 national ranking in renewable energy penetration, performance contracting, and green job growth.
• Receive A rating for net metering and interconnection in national ranking.
• Complete interisland undersea cable project- specific EIS in preparation for permitting and construction.

27
Short Term Objectives (1 Year)
• Facilitate selection of cable developer.
• Contribute to comprehensive policy on net metering, interconnection and reliability standards.
• Increase federal funding opportunities.
• Serve as online clearinghouse for clean energy information and self-help permitting tools.
• Increase international clean energy trade, investment & RD&D possibilities.

28
Hawaii Renewable Energy Potential (GWh)
0 2000 4000 6000 8000
Biomass
Wind
Geothermal
Hydro
Solar
MSW
Ocean
Annual Use, GWh
Kauai Demand
RE Potential
Oahu Demand
RE Potential
Molokai Demand
RE Potential
Lanai Demand
RE Potential
Maui Demand
RE Potential
Hawaii Demand
RE Potential
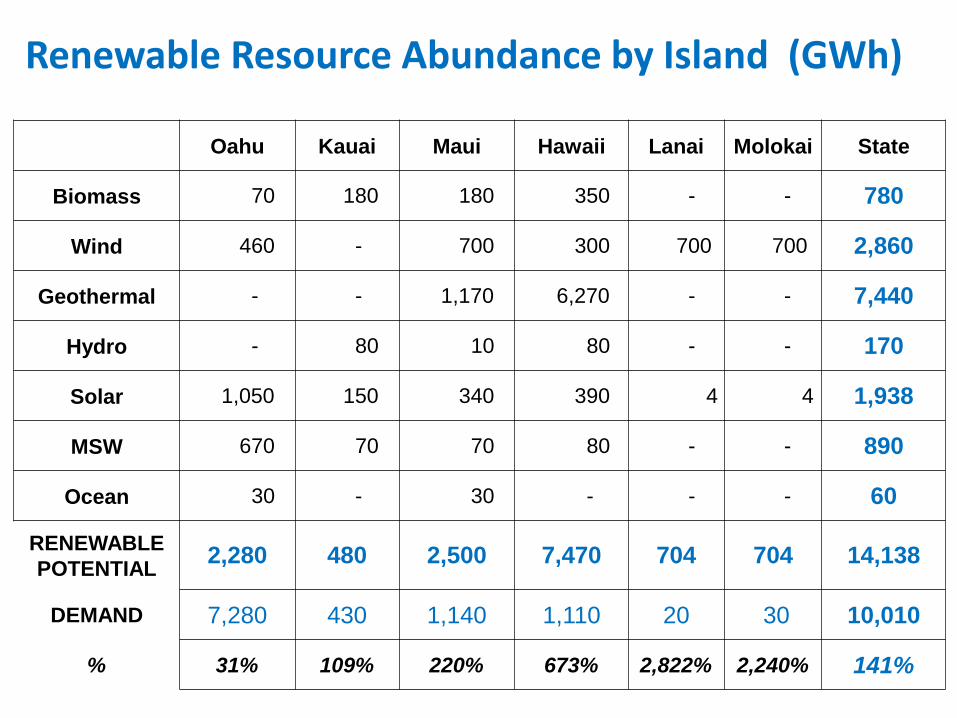
Oahu has the most energy demand, but most renewable energy sources are on the neighbor islands.
Oahu Kauai Maui Hawaii Lanai Molokai State
Biomass 70 180 180 350 - - 780
Wind 460 - 700 300 700 700 2,860
Geothermal - - 1,170 6,270 - - 7,440
Hydro - 80 10 80 - - 170
Solar 1,050 150 340 390 4 4 1,938
MSW 670 70 70 80 - - 890
Ocean 30 - 30 - - - 60
RENEWABLE POTENTIAL 2,280 480 2,500 7,470 704 704 14,138
DEMAND 7,280 430 1,140 1,110 20 30 10,010
% 31% 109% 220% 673% 2,822% 2,240% 141%
Renewable Resource Abundance by Island (GWh)

Integrating Hawaii’s Renewable Potential Interconnection for Grid Reliability & Greater Penetration of RE
Palilo Channel between Moloka‘i &
Maui 9 miles across 850 feet deep Kalohi Channel
between Moloka‘i & Lāna‘i 9 miles across 540 feet deep
‘Au‘au Channel between Lāna‘i & Maui
9 miles across 250 feet deep
Kaua‘i Channel between Kaua‘i &
O‘ahu 72 miles across 10,890 feet deep
Kaiwi Channel between O‘ahu &
Moloka‘i 26 miles across 2,200 feet deep
‘Alenuihāhā Channel between Maui &
Hawai‘i 29 miles across 6,810 feet deep
O‘ahu
Kauai
Hawai‘i
Lāna‘i
Moloka‘i
Maui
Ni‘ihau
Kaho‘olawe

Legislation (SB 2785)
Reduce financing costs for inter-island undersea power cables by having a clear regulatory structure in place
Programmatic EIS
NEW effort, to be led by USDOE (not yet announced) Broad scope: all energy resources, state-wide
HECO RFP
200 MW Intermittent, includes cable (PUC order from 2011) Firm power RFP (300 MW) and geothermal RFPs are related PUC may re-consider 2011 order
Interisland Undersea Power Cable

More than 70 High voltage direct current (HVDC) cables in service worldwide
BritNed (Britain – Netherlands) 162 miles undersea: 1000 MW installed in 2011. Gotland (Sweden) (1st commercial HVDC submarine cable) 60 mi: 20 MW in 1954; 260 MW in 1987.. Inter-Island (New Zealand) 26 miles undersea: 700 MW installed in 1965. Neptune (US, New York-New Jersey) 50 miles undersea: 660 MW installed in 2007. NorNed (Netherlands – Norway) (longest HVDC submarine cable) 360 miles: 700 MW in 2008. SAPEI (Italy) (deepest HVDC submarine cable, at 5380 feet) 261 miles: 1000 MW installed in 2011. Trans Bay Cable (US, California) 53 miles undersea: 660 MW installed in 2010.
Proven Technology

How are we doing?
33

34
Renewable Energy Vision
0%
5%
10%
15%
20%
25%
30%
35%
40%
45%
2010 2015 2020 2030
RPS
Existing RE
RE added 2011-2015
Range of Biofuels
Existing RE
RE added 2011-2015
Interisland Wind
RE added 2016-2020
Range of Biofuels
Existing RE
RE added 2011-2015
Interisland Wind
Incremental RE added 2016 thru
2030 Biofuels
Geothermal
Existing Renewable Energy Renewable Energy Strategies to comply with RPS goals
* Counts towards RPS through 2014
Biomass Wind
Goal of 10%
Goal of 15%
Goal of 25%
Goal of 40%
Hydro Solar
Geothermal
Energy Efficiency*
Hawaiian Electric Company, Inc.
On track to meet 2015 targets – Viable Scenarios for the future.

35
3 1 2 2 3
1 3
12
3 1
3
7
1 1 1 1
1
10
5
4
9
1
0
5
10
15
20
25
30
Hawaii Kauai Lanai Maui Molokai Oahu TBD
Num
ber o
f Pro
pose
d Re
new
able
Ene
rgy
Proj
ects
Island
Currently Proposed Renewable Energy Projects in Hawaii
BioenergyCombinationGeothermalHydroOTECSolarWind
75
Proposed Projects
Source: Department of Business, Economic Development and Tourism, December 2011

Power Purchase Agreements at Four Airports Decrease Electricity Costs Nearly 20%

37
33,450,480 kWh 29,865,600 kWh 27,691,520 kWh 26,171,560 kWh 0
5
10
15
20
25
30
35
2007 2008 2009 2010
Elec
tric
ity C
onsu
med
(GW
h)
Year
Decreased Electricity Consumption in Lead-By-Example State Buildings (2007-2010) Kalanimoku
State Capitol
Princess Ruth Ke‘elikolani
Queen Lili‘uokalani
No. 1 Capitol District(Hemmeter)
Leioopapa-A-Kamehameha (StateOffice Tower)Kinau Hale
Kekaunaoa(Territorial Office)
Keoni Ana (CapitolCenter)
Kekauluohi (StateArchives)
Source: State Energy Office

38
First in Nation Energy Savings Performance Contracting Per Capita
State Dollars per Capita ($)
Total Performance Contracting ($) Jobs Created (Job Year)
1. Hawaii $117.09 $159,278,011 1,731
2. Kansas $90.81 $259,094,503 2,816
3. Idaho $90.27 $129,000,000 1,402
4. Massachusetts $71.53 $457,696,106 4,975
5. Utah $66.89 $165,195,000 1,796
National Average $31.46 $130,846,670 1,379
Source: Performance Contracting Impacts - State Comparison, December 2011 (Energy Services Coalition)

39
Hawaii Green Jobs
Hawaii is expected to have over 14,000 green jobs by 2012

40
Distributed Renewable Energy Systems As of 2011, over 9,000 distributed renewable energy systems have been installed
statewide, totaling over 58 MW in capacity.
7 18 21 23 30 108 207 567
1,168
2,189
5,266
29 kW 52 kW 65 kW 76 kW 166 kW 647 kW 1,920 kW
5,863 kW
7,555 kW
12,321 kW
29,658 kW
0
5,000
10,000
15,000
20,000
25,000
30,000
35,000
0
1,000
2,000
3,000
4,000
5,000
6,000
2001 2003 2005 2007 2009 2011Incomplete
Tota
l Cap
acity
of S
yste
ms I
nsta
lled
(k
W)
Num
ber o
f Dis
trib
uted
Ren
ewab
le E
nerg
y Sy
stem
s
HECO HELCO MECO KIUC
Source: Net Energy Metering Status Reports, 2011 (Public Utilities Commission) 2011 Data incomplete, missing KIUC installations
9,000+ Distributed Renewable Energy Systems Total
58+ MW Installed Statewide

41
Solar-Related Construction Expenditures Solar-related construction expenditures reached nearly 17% of total private building
permit value in 2011

42
Second in the Nation Cumulative Installed Photovoltaic Capacity per Capita
State Cumulative Through 2010 (WDC/person) 2010 Installations (WDC/person)
1. Nevada 38.8 25.3
2. Hawaii 32.9 13.6
3. New Jersey 29.6 15.1
4. California 27.4 6.8
5. Colorado 24.1 12.3
National Average 7.0 2.9 Source: 2010 U.S. Solar Market Trends, July 2011 (IREC)

Visit energy.hawaii.gov for a more comprehensive look at Hawaii’s clean energy future.
Mahalo