intermediaries in international trade: direct … in international trade: direct versus indirect...
TRANSCRIPT
Intermediaries in International Trade:direct versus indirect modes of export
Andrew B. Bernard(1) Marco Grazzi(2) and Chiara Tomasi(3)
(1) Tuck School of Business at Dartmouth, CEPR & NBER,
(2) LEM, Scuola Superiore Sant’Anna, Pisa,
(3) Università di Trento & LEM, Scuola Superiore Sant’Anna
University of Notre DameOctober 7th 2011
1 / 57

New Perspectives
From trade flows at country and industry level to the centralrole of firms
Interaction of firm characteristics and export status play animportant role in shaping aggregate productivity, industrydynamics, and firm performance
Characteristics of trading firms also matter for aggregatetrade
2 / 57

Intermediaries in International Trade
Who is Trading?- Manufacturers (Ms) and Intermediaries (Wholesalers - Ws) exporters
Role of Intermediaries in aggregate trade
Help solving country specific fixed costs
Exports respond differently to trade costs depending on thetype of firms
3 / 57

Intermediaries in International Trade: Our Contribution
What do they look like?- Differences between Wholesalers and Manufacturers
What are the product and destination marketscharacteristics that determine the choice of Ws versus Ms?
What are the implications for aggregate trade flows?- Adjustments of product portfolio – product adding and dropping- Response to exogenous shocks
4 / 57

Intermediaries in International Trade
Wholesale firms account for:
23% of US firms and 25% of US employment in 2000 (Bernard, Jensenand Schott, 2009)
10% of exports in the US (Bernard, Jensen and Schott, 2009)
14% of exports in Sweden (Akerman, 2010)
20% of exports in China (Ahn, Khandelwal, and Wei, 2011)
10% of exports in Italy
5 / 57

Related Literature: Empirics
Wholesalers are smaller and have lower exports
- Bernard, Jensen, Redding and Schott (2010) [US]; Ahn, Khandelwal andWei (2011) [China]; Akerman (2010) [Sweden]
Wholesalers help solving fixed export costs- Ahn, Khandelwal and Wei (2011); Akerman (2010)
Wholesalers exports positively related to distance andnegatively to GDP
- Akerman (2010); Ahn, Khandelwal and Wei (2011)
6 / 57
Related Literature: Theory
International trade as an outcome of search and networks- Rauch, Watson (2004); Petropoulou (2007)
Wholesalers facilitate the matching between exporters incountry of origin and importers in destination countries
- Blum, Claro and Horstmann (2011)
Intermediary as an alternative technology to direct exporting- Akerman (2010), Ahn, Khandelwal and Wei (2011), Felbermayr, Jung
(2011)
7 / 57

Intermediary technology
“Technology”- based model (Ahn et al, Akerman)
- Domestic single-product firms can either export directlyor indirectly
- Producers and intermediaries are distinct firms
- Intermediary technology offers the potential to lower thefixed costs of exporting by spreading the country/industry components across varieties
8 / 57
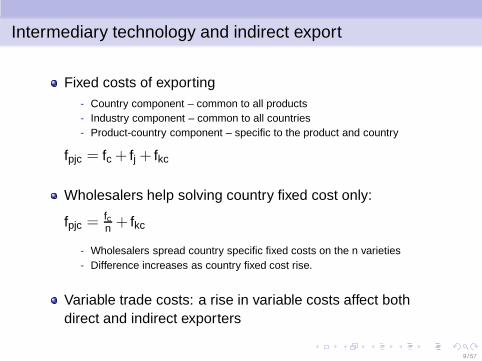
Intermediary technology and indirect export
Fixed costs of exporting- Country component – common to all products- Industry component – common to all countries- Product-country component – specific to the product and country
fpjc = fc + fj + fkc
Wholesalers help solving country fixed cost only:
fpjc =fcn + fkc
- Wholesalers spread country specific fixed costs on the n varieties- Difference increases as country fixed cost rise.
Variable trade costs: a rise in variable costs affect bothdirect and indirect exporters
9 / 57

Direct Exporters
αα
d
xd
xα d
fd
fx
π
π
π
i
f
α i
i
π
αxd
- Export occurs only directly
10 / 57

Direct Exporters
αα
d
xd
xα d
fd
fx
π
π
π
i
f
α i
i
π
αxd
- Productivity sorting: direct exporters and non exporters
11 / 57
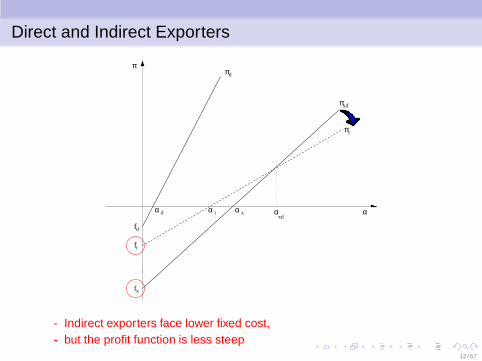
Direct and Indirect Exporters
αα
d
xα d
fd
fx
ππ
iπ
xd
f
α
i
α
πxd
i
- Indirect exporters face lower fixed cost,- but the profit function is less steep
12 / 57

Direct and Indirect Exporters
αα
d
xα d
fd
fx
ππ
iπ
xd
f
α
i
α
πxd
i
- Three productivity thresholds: αd , αi and αxd
- Firms whose productivity is too low for exporting directly (greensegment), can do it through intermediaries 13 / 57

Italian Data
Statistiche del Commercio Estero (COE) Custom data- Transactions level data: export values and quantity of the firm for HS6
product-country destination pairs- All cross-border transactions, 2000-2007
Archivio Statistico delle Imprese Attive (ASIA)- Census of all operating businesses: sales, employment, main activity of
the firm (NACE code)- Manufacturers (M) and Wholesalers (M) defined according to their primary
NACE 3 digit industry
14 / 57

Country data
GDP – World Bank Development Indicators
Distance – CEPII
Market Cost (cost of Exporting) – World Bank Doing Business
Governance – World Bank governance dataset
15 / 57
Product data
Entry/Exit Rate: min (entry, exit) (Source: computation on custom data)
Coefficient of Variation (Source: computation on custom data)
Relation Specificity (Source: Nunn, 2007)
Tariffs: HS6 product-country level import tariffs (Source: WITS)
16 / 57

Export volumes and Number of Exporters
Table 1
Year Total Exports Manuf Whol Retail Others(billion) Share (%)
2000 246.79 85.09 9.85 0.74 4.32... ... ... ... ... ...... ... ... ... ... ...2007 350.57 85 11.27 0.84 6.91
Year Exporters Manuf Whol Retail Others(N. of firms) Share (%)
2000 137347 57.3 26.43 7.67 8.6... ... ... ... ... ...... ... ... ... ... ...2007 128472 54.77 27.91 6.88 13.3
17 / 57

Differences between type of exporters
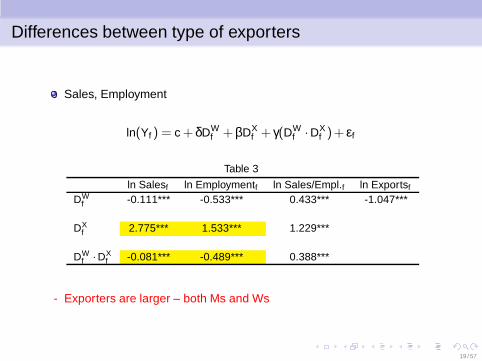
Sales, Employment
ln(Yf ) = c + δDWf +βDX
f + γ(DWf ·DX
f )+ εf
Table 3
ln Salesf ln Employmentf ln Sales/Empl.f ln Exportsf
DWf -0.111*** -0.533*** 0.433*** -1.047***
DXf 2.775*** 1.533*** 1.229***
DWf ·DX
f -0.081*** -0.489*** 0.388***
- Ms are 12% larger in terms of sales and 70% in terms of employment
18 / 57
Differences between type of exporters
Sales, Employment
ln(Yf ) = c + δDWf +βDX
f + γ(DWf ·DX
f )+ εf
Table 3
ln Salesf ln Employmentf ln Sales/Empl.f ln Exportsf
DWf -0.111*** -0.533*** 0.433*** -1.047***
DXf 2.775*** 1.533*** 1.229***
DWf ·DX
f -0.081*** -0.489*** 0.388***
- Exporters are larger – both Ms and Ws
19 / 57

Differences between type of exporters
Sales, Employment
ln(Yf ) = c + δDWf +βDX
f + γ(DWf ·DX
f )+ εf
Table 3
ln Salesf ln Employmentf ln Sales/Empl.f ln Exportsf
DWf -0.111*** -0.533*** 0.433*** -1.047***
DXf 2.775*** 1.533*** 1.229***
DWf ·DX
f -0.081*** -0.489*** 0.388***
- Sales per employee are higher at Ws, especially for exporters
20 / 57

Size Distribution: Wholesalers and Manufacturers
Figure 2 (a)
.0001
.001
.01
.1
1
Pro
babi
lity
Den
sity
2 4 6 8 10Log(Number of Employees)
ManufacturersWholesalers
Size Distribution
.0001
.001
.01
.1
1
Pro
babi
lity
Den
sity
5 10 15 20 25Log(Sales)
ManufacturersWholesalers
Size Distribution
- Ws are much smaller in terms of employment
- Difference is reduced for sales
21 / 57

Size Distribution: Ws and Ms exporters
Figure 2 (b)
.0001
.001
.01
.1
1
Pro
babi
lity
Den
sity
2 4 6 8 10Log(Number of Employees)
ManufacturersWholesalers
Size Distribution for Exporting firms
.0001
.001
.01
.1
1
Pro
babi
lity
Den
sity
5 10 15 20 25Log(Sales)
ManufacturersWholesalers
Size Distribution for Exporting firms
- Same ranking when focusing on Ws and Ms exporters
22 / 57

Wholesalers and Manufacturers exporters
Figure 3
1
1.5
2
2.5
3
3.5
4
4.5
5
5.5
6 8 10 12 14 16 18
ln E
mpl
oym
ent
ln Exports
Employment per level of exports
ManufacturersWholesalers
- Wholesalers require fewer employees to attain any given export value
23 / 57
Differences Between Export Types
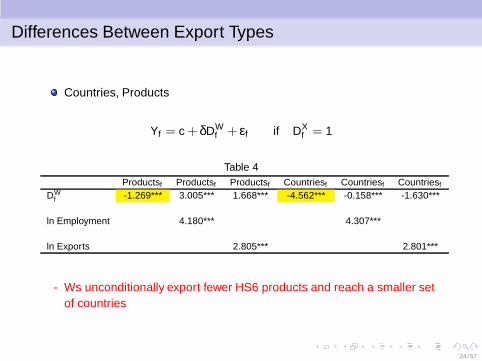
Countries, Products
Yf = c + δDWf + εf if DX
f = 1
Table 4Productsf Productsf Productsf Countriesf Countriesf Countriesf
DWf -1.269*** 3.005*** 1.668*** -4.562*** -0.158*** -1.630***
ln Employment 4.180*** 4.307***
ln Exports 2.805*** 2.801***
- Ws unconditionally export fewer HS6 products and reach a smaller setof countries
24 / 57

Differences Between Export Types
Countries, Products
Yf = c + δDWf + εf if DX
f = 1
Table 4Productsf Productsf Productsf Countriesf Countriesf Countriesf
DWf -1.269*** 3.005*** 1.668*** -4.562*** -0.158*** -1.630***
ln Employment 4.180*** 4.307***
ln Exports 2.805*** 2.801***
- Controlling for size, coefficient for number of HS6 products is positive
- Ws serve fewer countries also when adjusting for firm size
25 / 57
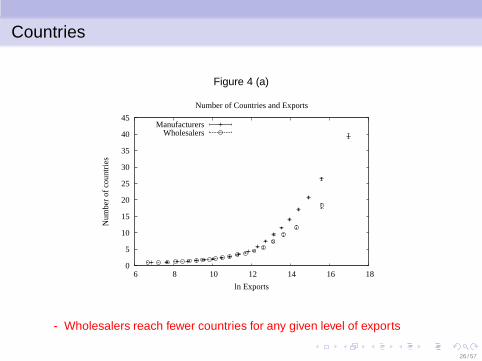
Countries
Figure 4 (a)
0
5
10
15
20
25
30
35
40
45
6 8 10 12 14 16 18
Num
ber
of c
ount
ries
ln Exports
Number of Countries and Exports
ManufacturersWholesalers
- Wholesalers reach fewer countries for any given level of exports
26 / 57

Products
Figure 4 (b)
0
5
10
15
20
25
30
35
40
6 8 10 12 14 16 18
Num
ber
of p
rodu
cts
ln Exports
Number of Products and Exports
ManufacturersWholesalers
- Wholesalers export more products for any given level of exports
27 / 57

Export Within Product-Country (PC)
The theory predicts differences in shipments to PC pair among Ws andMs
lnYfcp = c + δDWf +β lnSales+ dpc + εfcp
Table 5
ln Exportsifcp ln Quantityi
fcp ln UnitValueifcp
(2) (4) (6)DW
f -0.113*** -0.115*** 0.002
ln Sales 0.196*** 0.201*** -0.005
- Wholesalers have lower exports within product-country pairs
28 / 57

Export Within Product-Country (PC)
The theory does not address the issue of differences in Unit Valuebetween Ws and Ms
lnYfcp = c + δDWf +β lnSales+ dpc + εfcp
Table 5
ln Exportsifcp ln Quantityi
fcp ln UnitValueifcp
(2) (4) (6)DW
f -0.113*** -0.115*** 0.002
ln Sales 0.196*** 0.201*** -0.005
- Lower Wholesalers exports entirely driven by lower Q
29 / 57

A dynamic extensions
The existing frameworks only consider single-product firmsin a static environment
What happen in a dynamic setting given that sunk exportcosts vary across firm types?
Lower per unit sunk costs should result in higherprobabilities of both entry into exporting and exit fromexporting
Are Wholesalers more likely to add and drop products thanManufacturers?
30 / 57

Product Dropping
Unconditional firm-product drop rate: 48% Manufacturersand 53% Wholesalers
Probability of dropping conditional on firm-productcharacteristics:
Dropifpt = c+δDW
ft +β1 lnSalesft +β2Deviationfpt +β3 lnProductsft +dp+dt +εfpt
Firm-Product level regression
Deviation captures the relative importance of the firm in theexports of the product
31 / 57

Product Dropping
Table 6
Dropifpt Dropi
fpt Dropifpt Dropi
fpt
(1) (2) (3) (4)DW
ft 0.069*** 0.043*** 0.017*** 0.021***
ln Salesft -0.034*** -0.010*** -0.004***
Deviationfpt -0.099*** -0.099***
ln Productsft -0.013***
- Ws are more likely to drop a product (6.9 percentage points)
32 / 57

Product Dropping
Table 6
Dropifpt Dropi
fpt Dropifpt Dropi
fpt
(1) (2) (3) (4)DW
ft 0.069*** 0.043*** 0.017*** 0.021***
ln Salesft -0.034*** -0.010*** -0.004***
Deviationfpt -0.099*** -0.099***
ln Productsft -0.013***
- Robust to inclusion of controls
33 / 57

Product Adding
Who is more likely to add products?
Add ift = c+δDW
ft +β1 lnSalesft +β2 lnProductsft +dind +dt + εft
Firm level regression
Controlling for industry (HS2) mix dind
Single Vs Multi-Product firms
34 / 57

Product Adding
Table 7
All firms SPF MPF All firms MPFAddi
ft Addift Addi
ft Addift Addi
ft(4) (5) (6) (7) (8)
DWft 0.031*** 0.071*** 0.017*** 0.036*** 0.022***
ln Salesft 0.023*** 0.009*** 0.026*** 0.013*** 0.012***
ln Productsft 0.057*** 0.085***
- Ws more likely to add products than Ms
35 / 57

Product Adding
Table 7
All firms SPF MPF All firms MPFAddi
ft Addift Addi
ft Addift Addi
ft(4) (5) (6) (7) (8)
DWft 0.031*** 0.071*** 0.017*** 0.036*** 0.022***
ln Salesft 0.023*** 0.009*** 0.026*** 0.013*** 0.012***
ln Productsft 0.057*** 0.085***
- The effect is more pronounced when comparing Ws and Ms among SPF
36 / 57

Export by Intermediaries
Product dropping and adding regressions suggest thatWholesalers face lower per unit sunk costs of participationin the export market
Which are the implications in terms of the countries theyserve and the products they export?
Are the country and product specific fixed costs relevant forthe choice of export mode?
37 / 57

Intensity map of Wholesalers shares around the world
Google Chart Tools - Intensity map
38 / 57

Markets characteristics
What market characteristics make it more likely that Ws arechosen for exporting?
Market characteristics
- Size - GDP
- Distance
- Markets specific costs of exporting - Market Costs
- Contracting environments - Governance Indicator
39 / 57

Intermediary Export Share: markets size and distance
Figure 5
b=−0.011 (0.003)
0.1
.2.3
.4.5
Inte
rmed
iary
Exp
ort S
hare
15 20 25 30Log (GDP)
Linear Fit Observed Value
Wholesale Export Share & Market Size
b=−0.0013 (0.008)
0.1
.2.3
.4.5
Inte
rmed
iary
Exp
ort S
hare
6 7 8 9 10Log (Distance)
Linear Fit Observed Value
Wholesale Export Share & Market Distance
- Ws export share is declining in GDP→ in smaller markets fixed costshave to be spread over fewer units
- No relationship with distance
40 / 57

Intermediary Export Share: market costs and governance
Figure 6
b=0.033 (0.007)
0.1
.2.3
.4.5
Who
lesa
le E
xpor
t Sha
re
−2 0 2 4ln (Market Costs)
Linear Fit Observed Value
Wholesale Export Share & Market Costs
b=−0.035 (0.005)
0.1
.2.3
.4.5
Inte
rmed
iary
Exp
ort S
hare
−2 −1 0 1 2Governance Indicator
Linear Fit Observed Value
Wholesale Export Share & Governance Indicator
Wholesalers export share
- increases with the market specific fixed costs
- falls with the level of contracting environments
41 / 57
Product characteristics
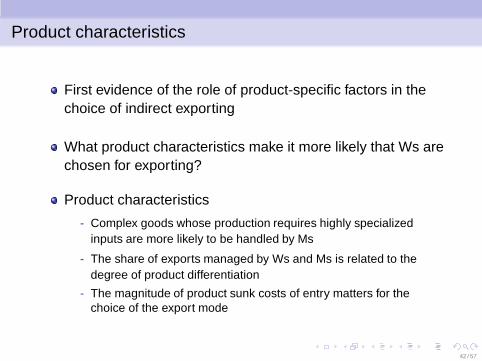
First evidence of the role of product-specific factors in thechoice of indirect exporting
What product characteristics make it more likely that Ws arechosen for exporting?
Product characteristics
- Complex goods whose production requires highly specializedinputs are more likely to be handled by Ms
- The share of exports managed by Ws and Ms is related to thedegree of product differentiation
- The magnitude of product sunk costs of entry matters for thechoice of the export mode
42 / 57
Intermediary Export Share and relation-specificity
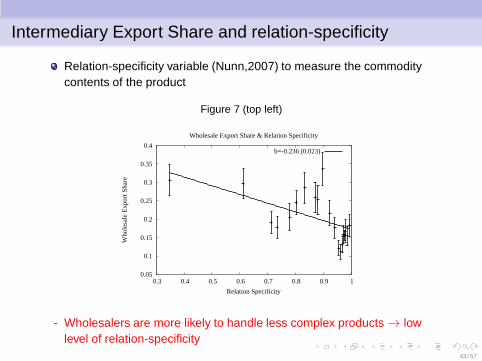
Relation-specificity variable (Nunn,2007) to measure the commoditycontents of the product
Figure 7 (top left)
0.05
0.1
0.15
0.2
0.25
0.3
0.35
0.4
0.3 0.4 0.5 0.6 0.7 0.8 0.9 1
Who
lesa
le E
xpor
t Sha
re
Relation Specificity
Wholesale Export Share & Relation Specificity
b=-0.236 (0.023)
- Wholesalers are more likely to handle less complex products → lowlevel of relation-specificity
43 / 57
Intermediary Export Share and price dispersion
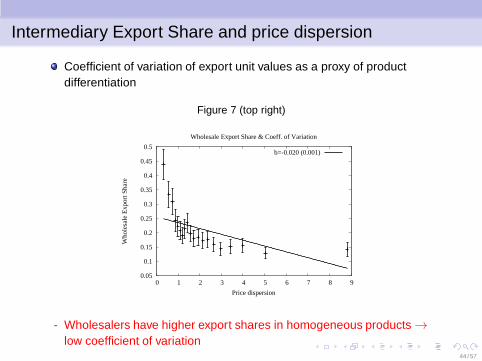
Coefficient of variation of export unit values as a proxy of productdifferentiation
Figure 7 (top right)
0.05
0.1
0.15
0.2
0.25
0.3
0.35
0.4
0.45
0.5
0 1 2 3 4 5 6 7 8 9
Who
lesa
le E
xpor
t Sha
re
Price dispersion
Wholesale Export Share & Coeff. of Variation
b=-0.020 (0.001)
- Wholesalers have higher export shares in homogeneous products →low coefficient of variation
44 / 57

Intermediary Export Share and entry/exit
Min(entry, exit) to measure product sunk costs of entry
Figure 7 (bottom left)
0.1
0.15
0.2
0.25
0.3
0.35
0.4
0 0.1 0.2 0.3 0.4 0.5 0.6 0.7 0.8 0.9
Who
lesa
le E
xpor
t Sha
re
Entry/Exit rate
Wholesale Export Share & min(entry,exit)
b=-0.116 (0.017)
- Wholesalers export share increases with the sunk costs of entry → lowrates of entry/exit
45 / 57

Product-Country Exports
The effects of country and product characteristics on the level of exportsof M and W:
lnX icp = c + δDW +β1Cc + γ1Cc ∗DW +β2Pp + γ2Pp ∗DW +β3τpc +
+ γ3τpc ∗DW + dj + εcp
- Cc : GDP, Distance, Market Costs, Governance
- Pp : Min(entry, exit), Price dispersion, Relationship Specificity
- τpc : Tariff
- Full set of interactions with wholesale dummy
- dj : Product or Country Fixed effects
46 / 57

Country Characteristics
Table 9 column 1
lnX ipc
DW 3.208***
ln GDPc 0.487***
∗DW -0.189***
ln Distancec -0.503***
∗DW -0.012
Market Costsc -0.117
∗DW 0.111*
Governance Indicatorc 0.264***
∗DW -0.181***
Regression includes Product FE
Wholesaler exports:
- rise less with market size
- increase with higher country fixedcosts
- rise less with improved countrygovernance
47 / 57

Product Characteristics
Table 9 column 2
lnX ipc
DW -0.869***
min(entry,exit)p -0.710***
∗DW -0.305**
Coefficient of Variationp 0.101***
∗DW -0.028***
Relation. Specificityp 1.212***
∗DW -0.798***
Regression includes Country FE
Wholesaler export less inproducts with lower sunk entrycosts, i.e.
- greater min(entry, exit)
- higher price dispersion
- higher relation specificity
48 / 57

Product and Country Characteristics
Table 9 column 3
lnX icp Cont’
DW 4.432***
ln GDPc 0.370*** min(entry,exit)p -0.660***
∗DW -0.194*** ∗DW -0.309**
ln Distancec -0.276*** Coefficient of Variationp 0.103***
∗DW 0.003 ∗DW -0.040***
Market Costsc -0.100 Relation Specificityp 1.223***
∗DW 0.103* ∗DW -0.929***
Governance Indicatorc 0.134**
∗DW -0.189***
Tariffcp -0.165**
∗DW 0.058
Results hold including all the available country/product characteristics
49 / 57

Intermediaries and exogenous shocks
Do Ws and Ms respond differently to exogenous shock? Along whichmargins Ws and Ms adjust?
Fluctuations in real exchange rates as measures of exogenous changes
RERct = ERctCPItCPIct
Extensive and intensive margins of firm’s exports to a destination:
lnXfc = lnProdfc + lnavgXfc
The estimation equation:
∆lnY ifct = c1 + δ1DW
ft +β1∆lnRERct + γ1∆lnRERct ∗DWf + dj + ε1
ct
50 / 57
Intermediaries and exogenous shocks
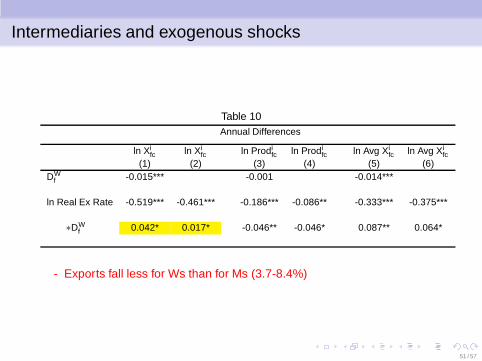
Table 10Annual Differences
ln Xifc ln Xi
fc ln Prodifc ln Prodi
fc ln Avg Xifc ln Avg Xi
fc(1) (2) (3) (4) (5) (6)
DWf -0.015*** -0.001 -0.014***
ln Real Ex Rate -0.519*** -0.461*** -0.186*** -0.086** -0.333*** -0.375***
∗DWf 0.042* 0.017* -0.046** -0.046* 0.087** 0.064*
- Exports fall less for Ws than for Ms (3.7-8.4%)
51 / 57

Intermediaries and exogenous shocks
Table 10Annual Differences
ln Xifc ln Xi
fc ln Prodifc ln Prodi
fc ln Avg Xifc ln Avg Xi
fc(1) (2) (3) (4) (5) (6)
DWf -0.015*** -0.001 -0.014***
ln Real Ex Rate -0.519*** -0.461*** -0.186*** -0.086** -0.333*** -0.375***
∗DWf 0.042* 0.017* -0.046** -0.046* 0.087** 0.064*
- For Ws the adjustment on the extensive margin of the number ofproducts is greater → Ws face lower fixed costs
52 / 57

Intermediaries and exogenous shocks
Table 10Annual Differences
ln Xifc ln Xi
fc ln Prodifc ln Prodi
fc ln Avg Xifc ln Avg Xi
fc(1) (2) (3) (4) (5) (6)
DWf -0.015*** -0.001 -0.014***
ln Real Ex Rate -0.519*** -0.461*** -0.186*** -0.086** -0.333*** -0.375***
∗DWf 0.042* 0.017* -0.046** -0.046* 0.087** 0.064*
- For Wholesalers the response of average exports is more muted
53 / 57

Intermediaries and exogenous shocks
What is the sensitivity of the firm’s response within a country-productpair to annual exchange rate movements?
Export value, quantity (Q) and unit value (UV)
The estimation equation is:
∆lnY ifpct = c1 + δDW
ft +β1∆lnRERct + γ∆lnRERct ∗DWf + dj + εfct
54 / 57

Intermediaries and exogenous shocks
Table 11Annual Differences
ln Xifcpt ln Xi
fcpt ln Qifcpt ln Qi
fcpt ln UVifcpt ln UVi
fcpt
(1) (2) (3) (4) (5) (6)DW
ft -0.020*** -0.018*** -0.002***
ln Real Ex Ratect -0.321*** -0.385*** -0.287*** -0.353*** -0.035*** -0.032***
∗DWft 0.072* 0.065* 0.092** 0.090** -0.020* -0.025*
- Exports within a country-product pair fall less for Ws than for Ms(15-30%)
55 / 57

Intermediaries and exogenous shocks
Table 11Annual Differences
ln Xifcpt ln Xi
fcpt ln Qifcpt ln Qi
fcpt ln UVifcpt ln UVi
fcpt
(1) (2) (3) (4) (5) (6)DW
ft -0.020*** -0.018*** -0.002***
ln Real Ex Ratect -0.321*** -0.385*** -0.287*** -0.353*** -0.035*** -0.032***
∗DWft 0.072* 0.065* 0.092** 0.090** -0.020* -0.025*
- Ws drop their quantities less and their unit values more than Ms
56 / 57
Conclusion
The work on intermediaries points out that there are multiple ways toaccess foreign markets
The results highlight the importance of the joint determination offirm-type, product mix and destination country
The evidence indicate that intermediary exporters face lower sunk costsof participation in the export market
- Wholesalers are less responsive to common external shocks to profitabilitybecause they are better able to adjust along the extensive margin
If we want to understand the short and long run responses of trade flowsto aggregate shocks and policy, we must understand who is trading
57 / 57