intermediate algebra - wasatch county school district / · web view2x + 3y = 12 5x – 2y...
TRANSCRIPT

Algebra II NotebookWasatch High School
2011-2012
Student Name _______________________Teacher Name _______________________

Algebra 2
Standard I: Students will use the language and operations of algebra to evaluate, analyze and solve problems.
Objective 1: Evaluate, analyze, and solve mathematical situations using algebraic properties and symbols.a. Solve and graph first-degree absolute value equations of a single variable.b. Solve radical equations of a single variable, including those with extraneous roots.c. Solve absolute value and compound inequalities of a single variable.d. Add, subtract, multiply, and divide rational expressions and solve rational equations.e. Simplify algebraic expressions involving negative and rational exponents.
Objective 2: Solve systems of equations and inequalities.a. Solve systems of linear, absolute value, and quadratic equations algebraically and graphically.b. Graph the solutions of systems of linear, absolute value, and quadratic inequalities on the coordinate plane.c. Solve application problems involving systems of equations and inequalities.
Objective 3: Represent and compute fluently with complex numbers.a. Simplify numerical expressions, including those with rational exponents.b. Simplify expressions involving complex numbers and express them in standard form, a + bi.
Objective 4: Model and solve quadratic equations and inequalities.a. Model real-world situations using quadratic equations.b. Approximate the real solutions of quadratic equations graphically.c. Solve quadratic equations of a single variable over the set of complex numbers by factoring, completing the square, and using the quadratic formula.d. Solve quadratic inequalities of a single variable.e. Write a quadratic equation when given the solutions of the equation.
Standard II: Students will understand and represent functions and analyze function behavior.
Objective 1: Represent mathematical situations using relations.a. Model real-world relationships with functions.b. Describe a pattern using function notation.c. Determine when a relation is a function.d. Determine the domain and range of relations.
Objective 2: Evaluate and analyze functions.a. Find the value of a function at a given point.b. Compose functions when possible.c. Add, subtract, multiply, and divide functions.d. Determine whether or not a function has an inverse, and find the inverse when it exists.e. Identify the domain and range of a function resulting from the combination or composition of functions.
Objective 3: Define and graph exponential functions and use them to model problems in mathematical and real-world contexts.a. Define exponential functions as functions of the form , b > 0, b ≠ 1.b. Model problems of growth and decay using exponential functions.c. Graph exponential functions.
2

Objective 4: Define and graph logarithmic functions and use them to solve problems in mathematics and real-world contexts.a. Relate logarithmic and exponential functions.b. Simplify logarithmic expressions.c. Convert logarithms between bases.d. Solve exponential and logarithmic equations.e. Graph logarithmic functions.f. Solve problems involving growth and decay.
Standard III: Students will use algebraic, spatial, and logical reasoning to solve geometry and measurement problems.
Objective 1: Examine the behavior of functions using coordinate geometry.a. Identify the domain and range of the absolute value, quadratic, radical, sine, and cosine functions.b. Graph the absolute value, quadratic, radical, sine, and cosine functions.c. Graph functions using transformations of parent functions.d. Write an equation of a parabola in the form y = a(x − h)2 + k when given a graph or an equation.
Objective 2: Determine radian and degree measures for angles.a. Convert angle measurements between radians and degrees.b. Find angle measures in degrees and radians using inverse trigonometric functions, including exact values for special triangles.
Objective 3: Determine trigonometric measurements using appropriate techniques, tools, and formulas.a. Define the sine, cosine, and tangent functions using the unit circle.b. Determine the exact values of the sine, cosine, and tangent functions for the special angles of the unit circle using reference angles.c. Find the length of an arc using radian measure.d. Find the area of a sector in a circle using radian measure.
Standard IV: Students will understand concepts from probability and statistics and apply statistical methods to solve problems.
Objective 1: Apply basic concepts of probability.a. Distinguish between permutations and combinations and identify situations in which each is appropriate.b. Calculate probabilities using permutations and combinations to count events.c. Compute conditional and unconditional probabilities in various ways, including by definitions, the general multiplication rule, and probability trees.d. Define simple discrete random variables.
Objective 2: Use percentiles and measures of variability to analyze data.a. Compute different measures of spread, including the range, standard deviation, and interquartile range.b. Compare the effectiveness of different measures of spread, including the range, standard deviation, and interquartile range in specific situations.c. Use percentiles to summarize the distribution of a numerical variable.d. Use histograms to obtain percentiles.
3

Utah State Standards4.1.a Distinguish between permutations and combinations and identify situations in which each is appropriate4.1.b Calculate probabilities using permutations and combinations to count events
ACT Warm up:
**Exploration – Permutations and Probability
Outcome-
Ex. Possible outcomes to flipping a coin.
Sample space-
Event-
Independent events-
Ex.
Dependent events-
Ex.
Fundamental Counting Principle
Ex for Independent Events. A sandwich menu offers customers a choice of white, wheat, or rye bread with one spread chosen from butter, mustard, or mayonnaise. How many different combinations of bread and spread are possible?
4

Ex for more than 2 Independent Events. Many voice mail systems allow owners to call from another phone and get their messages by entering a 3-digit code. How many codes are possible?
Ex. for Dependent Events. Carla wants to take 6 different classes next year. Assuming that each class if offered each period, how many different schedules could she have?
Factorials-
Notation
On a calculator, look for the ! in the MATH button menu.
By definition, 0! = 1.
Permutation-
Ex.
Notation-
Formula for Permutations
Ex. Eight people entered the Best Pizza Contest. How many ways can blue, red, and green ribbons be awarded?
Formula for Permutations with Repetitions.
Ex. How many different ways can the letters of the word BANANA be rearranged?
Ex. How many different ways can the letters of the word MISSISSIPPI be rearranged?
Combination-
Ex.
Notation-
Formula for Combination
5

Ex. Five cousins at a family reunion decide that three of them will go to pick up a pizza. How many ways can they choose the three people to go?
Ex. Six cards are drawn from a standard deck of cards. How many hands consist of two hearts and four spades?
**Exploration – Winning the Lottery
Homework Problems. p. 635 #11-19 oddsHomework Problems. p. 641 #13-19 odd, 23-29 odd
Utah State Standards4.1.d Define simple discrete random variables4.2.c Use percentiles to summarize the distribution of a numerical variable4.2.d Use histograms to obtain percentiles
ACT Warm up:
Probability-
Notation
(different than permutation notation)
*you need to calculate the possible number of outcomes!(sometimes this involves the Fundamental Counting Principle)
6

Practice Problems.1. When two coins are tossed, what is the probability that both are tails?
2. When three coins are tossed, what is the probability that all three are heads?
3. Roman has a collection of 26 books- 16 are fiction and 10 are nonfiction. He randomly chooses 8 books to take with him on vacation. What is the probability that he chooses 4 fiction and 4 nonfiction?
Random variable-
Ex. D represents the number showing when rolling a die.Possible values:
NotationP(X=n)
Probability distribution-
Ex. Probability distribution for rolling a die.
Histogram-
Ex. Probability distribution of the sum of the numbers of two dice rolled.
S=Sum 2 3 4 5 6 7 8 9 10 11 12Probability 1/36 1/18 1/12 1/9 5/36 1/6 5/36 1/9 1/12 1/18 1/36
Draw a histogram.
7

Using the histogram, which outcome is most likely? What is the probability?
Use the table and histogram to find P(S=9). What other sum has the same probability?
Homework Problems. p. 648 #19-29 all, 57-60.
Utah State Standards4.1.c Compute conditional and unconditional probabilities in various ways, including by definitions and probability trees
ACT Warm up:
Probability of Independent EventsIf two events, A and B are independent, then the probability of both events occurring P(A and B) is
________________________.
*This formula can be applied to any number of independent events.
Ex. Gerardo has 9 dimes and 7 pennies in his pocket. He randomly selects one coin, looks at it, and replaces it. He then randomly selects another coin. What is the probability that both of the coins he selects are dimes?
Ex. When three dice are rolled, what is the probability that two dice show a 5 and the third die shows an even number?
8

Probability of Dependent EventsIf two events, A and B, are dependent, then the probability of both events occurring P(A and B) is
___________________________.
*This formula can be applied to any number of dependent events.
Ex. The host of a game show is drawing chips from a bag to determine the prizes for which contestants will play. The host draws from a bag of 20 chips, of which 11 say computer, 8 say trip, and 1 says truck. Drawing at random and without replacement, find each of the following probabilities.
a. What is the probability that the host draws a trip, then a computer.
b. What is the probability that the host draws a truck, then two trips.
Homework Problems. p.655 #15-23 odd, 31, 33
CDAS: Probability
Utah State Standards4.2.a Compute and compare different measures of spread, including the range, standard deviation, and interquartile range4.2.b Compare the effectiveness of different measures of spread, including the range, standard deviation, and interquartile range in specific situations
ACT Warm up:
9

Measures of Central Tendency
Mean-
Use when the data are spread out and you want an average of the values.
Median-
Use when the data contain outliers or points that are extremely high or low.
Mode-
Use when the data are tightly clustered around one or two values.
Ex. A new Internet company has 3 employees who are paid $300,000, 10 who are paid $100,000, and 60 who are paid $50,000.
1. Find the mean, median and mode.
2.Which measure of central tendency best represents the pay at this company?
3. Which measure of central tendency would recruiters for this company be most likely to use to attract job applicants?
Measures of Spread, Variation, or Dispersion
Range-
*Only gives information of the high and the low values including outliers!
*Does not give information on the majority of values
Variance-
Notation
10

Steps to Calculate Variance1. Find the mean2. Find the difference between each value in the set of data and the mean.3. Square each difference.4. Find the mean of the squares.
Standard Deviation-
*The typical variation for the data items from the mean.
Ex. The following table shows the length in thousands of miles of some of the longest rivers in the world. Find the standard deviation for these data.
Interquartile Range-
*Should be used when data set contains outliers
Steps to Calculate1. Find the median of the data set.2. Find the median of the 1st half of the data Q1 (lower quartile)3. Find the median of the 2nd half of the data Q3 (upper quartile)4. Find the difference between Q3 and Q1
Ex.A year ago, Angela began working at a computer store. Her supervisor asked her to keep a record of the number of sales she made each month.
The following data set is a list of her sales for the last 12 months:
34, 47, 1, 15, 57, 24, 20, 11, 19, 50, 28, 37
Use Angela's sales records to find:
a) the median
b) the range
c) the upper and lower quartiles
River Length(thousands of miles)
Nile 4.16Amazon 4.08Missouri 2.35Rio Grande 1.90Danube 1.78
11

d) the interquartile range
Box Plots:
Draw a box plot for Angela’s sales records above.
**Exploration – Pulse Rates
Homework Problems. p. 667 #11, 13, 17,18, 24-26, worksheet on interquartile range
CDAS: Percentiles and Variability
Utah State Standard I: Students will use the language and operations of algebra to evaluate, analyze, and solve problems
ACT Warm up:
Properties of Real Numbers
Identity Properties:
Identity Property of Addition:
Ex: can be written as . (I know, it seems silly, but wait!)
12

Ex: Why is the same as ?Identity Property of Multiplication:
Ex. Simplify: (Show two ways)
Ex. Simplify:
Inverse Properties:
Inverse Property of Addition:
Ex. What are the additive inverses of the following numbers?
a. 4 b. c. – 5
Inverse Property of Multiplication:
are called multiplicative inverses or reciprocals of each other.
13

a
b
Ex. What are the multiplicative inverses of the following numbers?
a. 10 b. c.
Properties of Equality
Commutative Property of Addition: For any real numbers
Ex. 4 + 3 =
Commutative Property of Multiplication: For any real numbers
Ex. The array shows a representation of the product .
How might this array also represent the product ?
Explain why is there no Commutative Property of Subtraction or Commutative Property of Division? Illustrate with specific examples.
Associative Property of Addition: For any real numbers a, b, and c,
Draw a diagram that illustrates this property.
Associative Property of Multiplication: For any real numbers a, b, and c,
Distributive Property: For any real numbers
Ex: a. 5(3 + 4) = b. x(2 – y) =Using what we know about Properties of real numbers, answer the following questions:
14

1. How can we write as a multiplication problem?
2. Explain why .
Homework
Match each equation with the property it illustrates?
1. ________ A. Commutative Property ofMultiplication
2. 2 + 5 + (-5) = 2 + 0 ________ B. Identity Property of Multiplication
3. ________ C. Associative Property of Addition
4. ________ D. Commutative Property of
Addition5. 3 + (2 + 8) = 3 + (8 + 2) ________ E. Identity Property of Addition
6. 7 + 4 + 0 = 11 ________ F. Associative Property of Multiplication
7. 5(2) + 7(2) = ( 12)(2) ________ G. Inverse Property of Multiplication
8. ________ H. Inverse Property of Addition
Use the Properties of the real numbers to simplify each expression. Please NO calculators.
9. 10.
11. 12.
15

13. 14.
Utah State Standard I: Students will use the language and operations of algebra to evaluate, analyze, and solve problems
ACT Warm up:
Order of OperationsStep 1Step 2Step 3Step 4
Ex. Simplifying an expressionFind the value of [18 - 3(6-5)3] / 3
Variables-
Algebraic expressions-
Ex. Evaluating an expressionEvaluate g – t(g2 – t) if g = 2 and t = 6
Ex. Evaluating an expression
Evaluate if x = 5, y = -2, and z = -1
*Be careful using a calculator. Sometimes parentheses are necessary to get the correct answer.
16

Ex. To evaluate , you must enter 4*12/(5*4).
Number Types and an example of eachReals Wholes
Rationals Naturals
Integers Complex
Irrationals
Map of relationship of number types
Ex. Classify NumbersName the sets of numbers to which each number belongs
1.
2. 9.99999
3.
4.
5. -23.3
6. 7 + 3i
Turning words into algebraic expressions
Key phrases: Sum of Difference betweenProduct of Quotient ofMore than Fewer than
17

Is Opposite
Ex. Write an expression for each phrase1. a number
2. 5 more than a number
3. six times the cube of a number
4. a number decreased by 7
5. the square of a number decreased by 11
Equation-
*Neither true nor false until all the variables have been replaced by numbers.
Solution-
Solving equations: think of the order of operations in reverseIsolate the chosen variable.
Ex. Solve the equation and check your solution.1. a – 5.48 = 0.02
2.
3. 53 = 3(y – 2) – 2(3y – 1)
Ex. Solving an equation or formula for a chosen variable. 1. Solve for
(this is the formula for the surface area of a cone)
18

x
y
Ex. Writing an equation from a word problem and then solving for a chosen variable.1. in-class ex. #8 p.23 2. p.26 #66
Cartesian Coordinate System (created by ________________________)
horizontal axis _____________ vertical axis ______________ The point where the axes meet is called ________________ and has coordinates ( , ) Broken into four regions called ___________________. Label these on the coordinate system
below.
Homework problems. P.9 #19, 29, 39, 49, 53, 57 p.15 #19-25 odds, 51,53,65
p.25 #45,49,59, 67
Utah State StandardsStandard II: Students will understand and represent functions and analyze function behavior.
ACT Warm up:
19

x
y
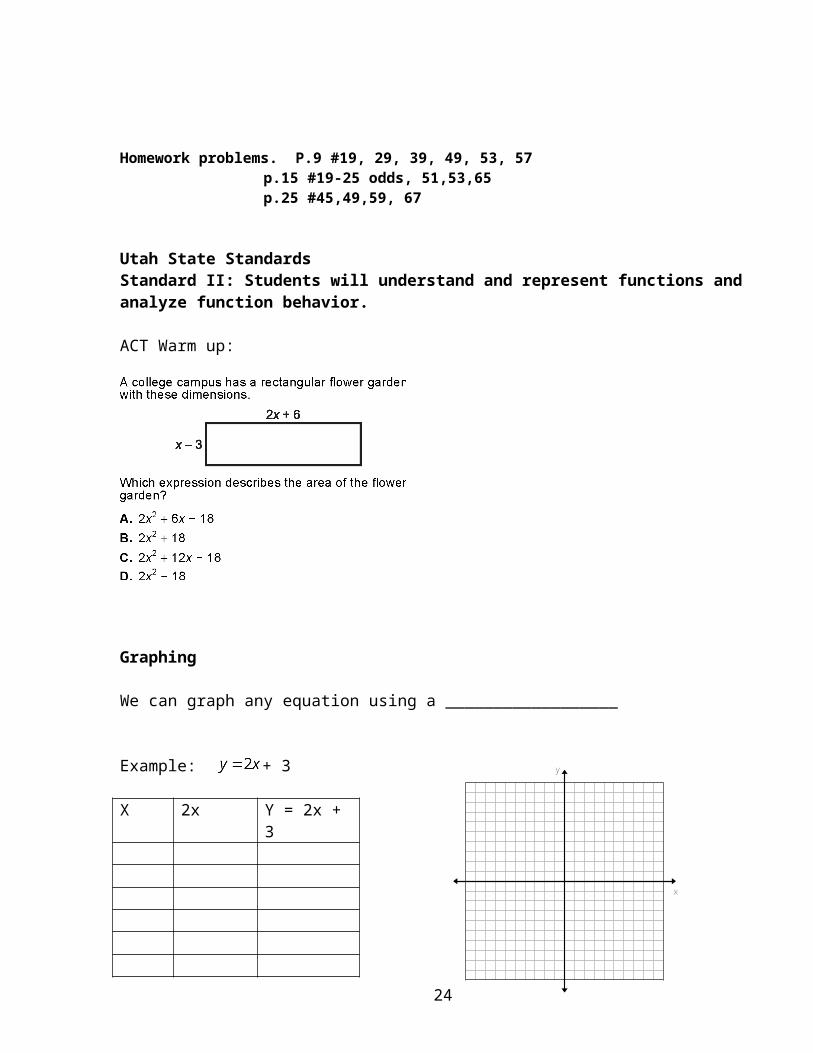
Graphing
We can graph any equation using a __________________
Example: + 3
X 2x Y = 2x + 3
Some rules that will help when graphing:
Always follow order of operations when solving for y.
Exponent rules:
Examples:
Negative exponents:
20

x
y
x
y
Examples:
Absolute Value:
Examples:
Practice graphing:
Graph each of the following equations by making a T-chart.
1.
x 5x y = 5x – 1
2.
x x + 2 y = |x + 2|
21

x
y
x
y
x
y
3.
x x + 1
4.
x y =
5.
x y =
22

x
y
x
y
x
y
6.
x y =
7.
x y =
8.
x y =
23
x
y
x
y
9.
x y =
10.
x y =
Group the 10 graphs above into categories based on similarities or differences. Explain the reasoning for your categories.
Domain -
Range -
Do the equations give us any clues as to what the graph might look like? Explain.
24

Types of equations:
Homework Problems: Worksheet
Utah State Standards2.1.b Describe a pattern using function notation2.1.c Determine when a relation is a function2.1.d Determine the domain and range of relations2.2.a Find the value of a function at a given point
ACT Warm up:
Functions –
A collection of data, or a set of ordered pairs is called a _____________________.
The _______________ is the set of all the first coordinates.
The ______________ is the set of all the second coordinates.
** Supplemental Reading 4.2 Function Notation p.178 & 181
25

A ________________ is a special kind of relation in which each element of the domain is paired with exactly one element of the range.
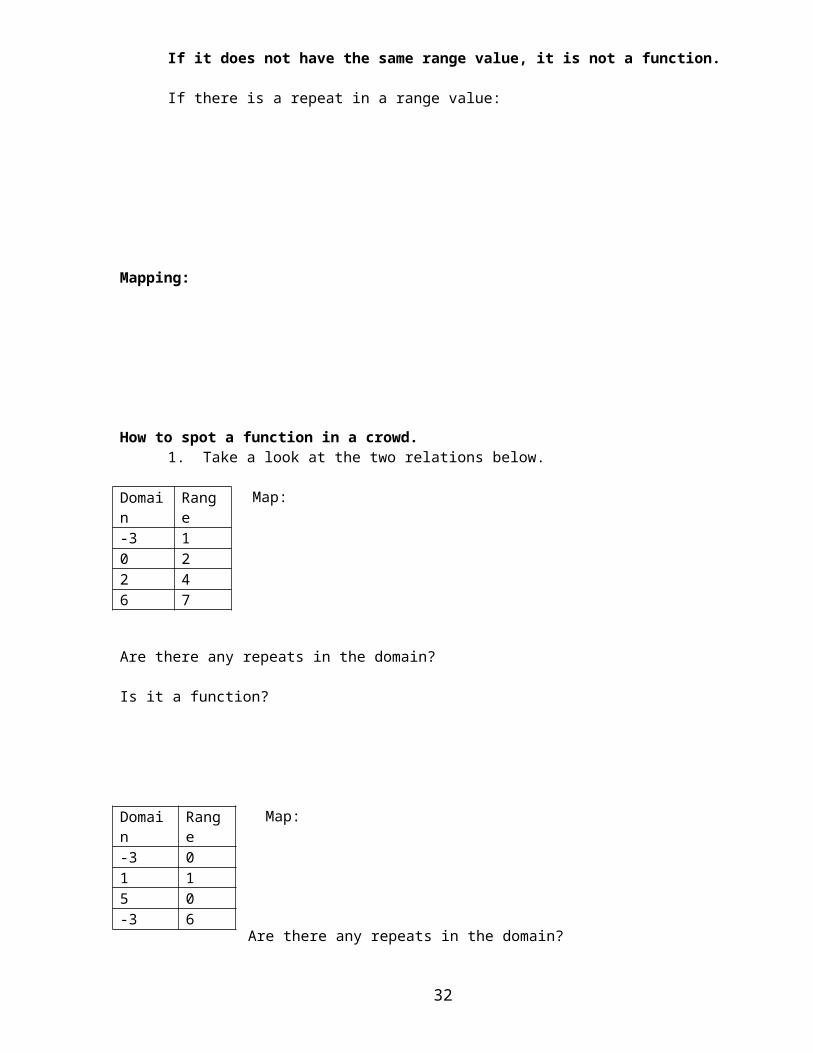
If you have a number that repeats in the ____________ (x-coordinates), it has to have the same range value (y-coordinate). If it does not have the same range value, it is not a function.
If there is a repeat in a range value:
Mapping:
How to spot a function in a crowd.1. Take a look at the two relations below.
Map:
Are there any repeats in the domain?
Is it a function?
Map:
Are there any repeats in the domain?
Do the repeats have the same range value?
Domain Range-3 10 22 46 7
Domain Range-3 01 15 0-3 6
26

Is it a function?Ex. The chart below gives the average and maximum lifetime for some animals. Determine if the data in this chart represents a function. Explain your reasoning.
Animal Average Lifetime (years)
Maximum Lifetime (years)
Cat 12 28Cow 15 30Deer 8 20Dog 12 20Horse 20 50Source: The World Almanac
2. Take a look at the graphs of the two relations shown below.
Ex.1 Ex.2
In the second relation, we had a repeat domain value of -3. Do you notice anything about the two points that have the same domain value of -3?
*We can use something called the ___________________________ test on a graph, to see whether a set of points is a function.
Use your pencil as a vertical line.If no vertical line intersects a graph in more than one point, the graph represents a __________________.
If some vertical line intersects a graph in two or more points, the graph does _________ represent a function.
Ex. Problems using the vertical line testUse the vertical line test to determine whether a graph represents a function or simply a relation.
Hint: Remember graphs are made up of a gazillion ____________!
1. 2. 3.
27

x
y
x
y
When we have a lot of data, we can sometimes come up with a general way to describe the relationship of the information. The way we describe a relationship in math is with an ____________________.
The solution(s) of an equation: The set(s) of ___________________ that make the equation true.
*A graph is the scatter plot of all the points that make the equation true.
Finding a graph without a calculatorMake a T-Chart.
Ex. Make a t-chart with at least 5 points, graph the relation, and decide whether it is a function or not.1. Many of the equations we work with will have a domain (x-values) that is made up of all real numbers. So when we make a t-chart, we can usually pick any numbers we want and put them in the x-column.
y = 3x-1
t-chart:
2. Sometimes it’s easier to start with y-values.
t-chart:
28

For functions only:
The domain values (usually x-values) are represented in an equation by the _________________ variable.
The range values (usually y-values) are represented in an equation by the _________________ variable. (Because its values depend on the x).Function notation-
Naming a function
The function depends on ______
Sometimes we say ______ is a function of _______.
We shorten it to __________. How do we say it out loud?
* This does not mean multiplying.
This new symbol takes the place of _____ in the equation of a function.
The equation y = 5x + 7, can be written as _____________________.
We can use this notation when making our t-charts, or finding out range (y-values) for a given x-value.
Ex. 1 f(x) = 5x+7
Find f(2) means that the function depends on x = 2. Plug in 2 for x and solve.f(2)=
Tryf(-1)=
Ex. 2 g(x)=x2 +1
g(1)=
g(0)=
Ex. 3
29

Homework Problems: p. 61 #17-33 odd, 46-53 all, 57, 58
Utah State Standards2.2.b Compose functions when possible2.2.c Add, subtract, multiply, and divide functions2.2.e Identify the domain and range of a function resulting from the combination or composition of functions
ACT Warm up:
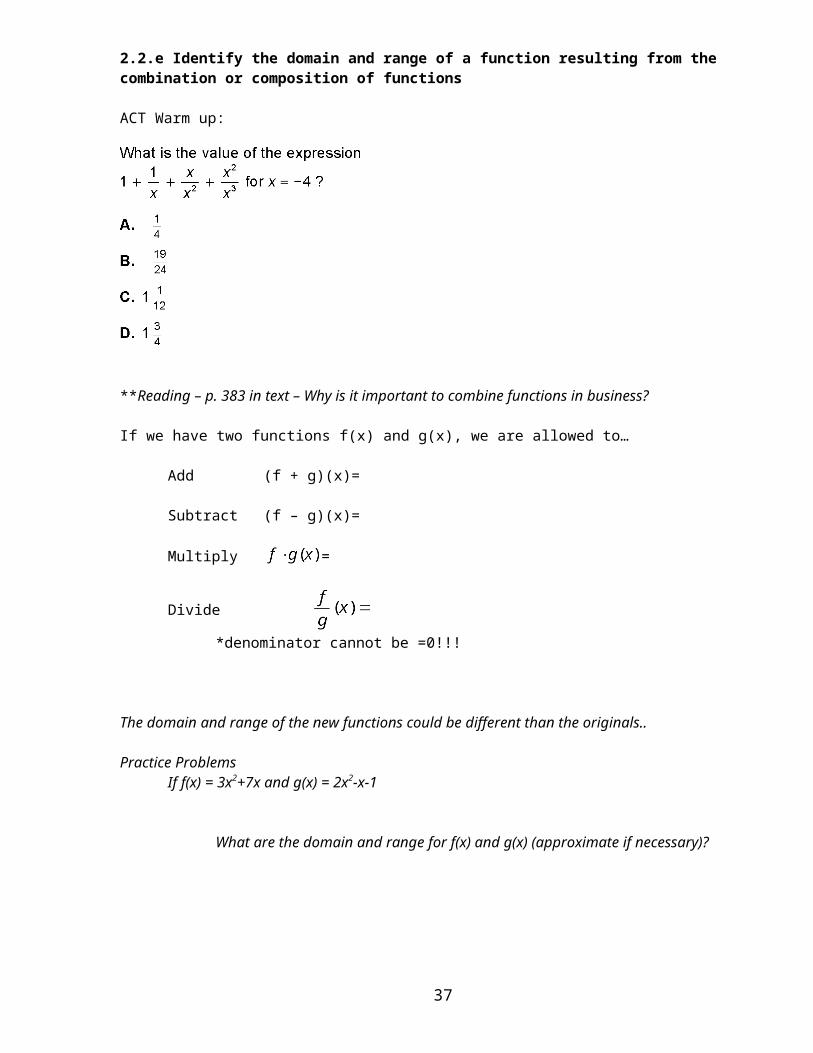
**Reading – p. 383 in text – Why is it important to combine functions in business?
If we have two functions f(x) and g(x), we are allowed to…
Add (f + g)(x)=
Subtract (f – g)(x)=
Multiply =
Divide
*denominator cannot be =0!!!
The domain and range of the new functions could be different than the originals..
Practice ProblemsIf f(x) = 3x2+7x and g(x) = 2x2-x-1
30

What are the domain and range for f(x) and g(x) (approximate if necessary)?
1. find (f+g)(x). Find the domain and range.
2. find (f-g)(x). Find the domain and range.
If f(x) = 3x2-2x+1 and g(x)=x-4
What are the domain and range for f(x) and g(x)?
3. find . Find the domain and range.
4. find . Find the domain and range.
**Reading – Compositions of Functions
Composite Functions*Plugging a function into another function.
Notation:
How do you say this out loud?
*Order is important
31
Practice problems.
For f(x) = 3x2-x+4 and g(x)=2x-1
What are the domain and range for f(x) and g(x)?
1. Find . Find the domain and range.
2. Find . Find the domain and range.
3. Find
4. Find
Homework Problems. p. 387 #17-21 odd (determine domain and range for each), 29-41 odd
CDAS: Operations with Functions
Utah State Standards2.2.d Determine whether or not a function has an inverse, and find the inverse when it exists
ACT Warm up:
32

Inverse functions
Notation
Domains and Ranges are switched.
Ex. f(x) f-1(x)
Finding the inverse of a function algebraically
*remember: the domain (x) and the range (y) are switched for inverse functions.
Ex. Find the inverse.
Look at the top row of the t-chart:
We want to undo the order of operations.
X Y3 72 91 05 8-3 3
X Y
x 4x y = f(x) = 4x + 6
33

Write the answer in inverse notation:
Ex. Find the inverse.
Ex.
How to Verify if two functions are inverses.*Use the composite function.
Two functions are inverses if and only if
Ex Determine whether the two functions are inverses.
**Exploration – Application of Inverse Functions
Homework Problems. p. 393 #14-36 even, 53, 55
Utah State Standards.2.1.a Model real-world relationships with functions
ACT Warm up:
34

Linear Regression
**Supplemental Reading – Fitting a Line to Data
*All the equations come from sets of data (relations).
Ex. Finding an equation from data:
The median income of U.S. familes for the period 1970-1998.
Rewrite this information as ordered pairs:
Why do we have these ordered pairs? They represent ____________ that we can study and use to make predictions.
This collection of data, or set of ordered pairs is called a ___________________ .
Plotting the points forms a __________________ plot.
How to put a scatter plot in your calculator.
We will put our data into lists. So first, we need to clear the lists of anything that might already be in there!
Use the buttons Your screen should look like
Then hit . Your screen will say “done”.
Year Income1970 98671980 21,0231985 27,7351990 35,3531995 40,6111998 46,737
35

To enter the data into columns, use the button and select the Edit option1.
You should now have lists ready for entering data.
We will use L1 as our x-coordinates or first coordinate, and L2 as our y-coordinates.Press a number you’d like to input and press enter. The cursor moves down the column. Use the arrow keys to get to move between columns.
Enter the data from the table above. Your screen should look as follows.
To graph the data you have entered, hit the buttons .
Your screen should look like this.
36
Hit the Enter button to enter Plot1. And hit enter when your cursor is sitting on the the word “On”. We also want to double check that our list of x-coordinates (Xlist) comes from L1 and our y-coordinates (Ylist) comes from L2. *If it doesn’t, we can select those! Ask me!
If we hit the the button, our data would not show up in our calculator window. We would see a blank coordinate system.
We need to set the window size so we can see our information! Hit .And now we need to think about our data.
Our x-values vary. The smallest number in L1 is ______The greatest number in L1 is ______.
Our y-values vary. The smallest number in L2 is ______.The greatest number in L2 is ______.
We’ll change our min and max x-values to correspond to our L1.
We’ll change our min and max y-values to correspond to L2.
Make your window look like the one at the left.*Don’t touch the Xscl, Yscl, or Res.
Then hit the button. You should see a scatter plot of your data.
If we want to start again and create another plot, we need to clear out the values from out lists. Hit the
buttons . We now need to specify which lists we want to clear. Hit the buttons
to specify L1 and L2. Then hit enter. Your screen will say “done”.
Before we start an example, we need to tell our calculator how to round decimals.Press . Next to the word “float”, select the #2. We are telling the calculator to round to 2 decimal places. Then press and we are ready to roll.
37

Make sure your StatPlot is on. The graph of our data.
To let our calculator work for us, we use something called________________.
We’re going to tell our calculator to draw a line that best fits our data points. This process is called ____________________________.
*We have to tell our calculator where to find the x-values, the y-values, and where it should store the equation it comes up with.
Use the buttons to get to this menu.
We will select #4 LinReg (ax+b).
LinReg stands for ________________________.
The following buttons will get you to the complete command for the calculator.
Your screen should look like this.
Hit Enter twice.
The calculator will spit out the equation of a line that best fits the data.
We could write this as y= 1304.19x + -2560335.07or f(x) = 1304.19x + -2560335.07
This equation describes the relationship between our data points.
What is x in our data?
What is f(x) or y in our data?
If we hit the button, we should see a line go through our points.
38

We can use the equation to make predictions!
For example, what will the average income of US families be in 2010?
First, we need to adjust our window, to make sure we our predicted year is in view. Press . We will be changing our Xmax value.
Hit the buttons to get the following menu.
We will select #1, the value option. We should see the following screen.
We can input any year and hit enter.
We want to find the income in 2010.Enter 2010 and hit enter.
We get the following screen. We are interested in what y = at the bottom of the screen.
Average income in 2010 ________
Summary: data is used to make an equation. Equations can be used to make predictions.
*Our information is only as good as the fit of our line! Meaning, our line should go through the points on our graphs.
39

Homework Problems p.88#1-15
CDAS: Relations and Functions
Utah State Standards.2.1.a Model real-world relationships with functions
ACT Warm up:
Linear Function Review**Exploration – 1) Lines in Motion & 2) Activity 1 – Calorie Consumption
We used our calculators to do linear regression- find the equation of a ____________.
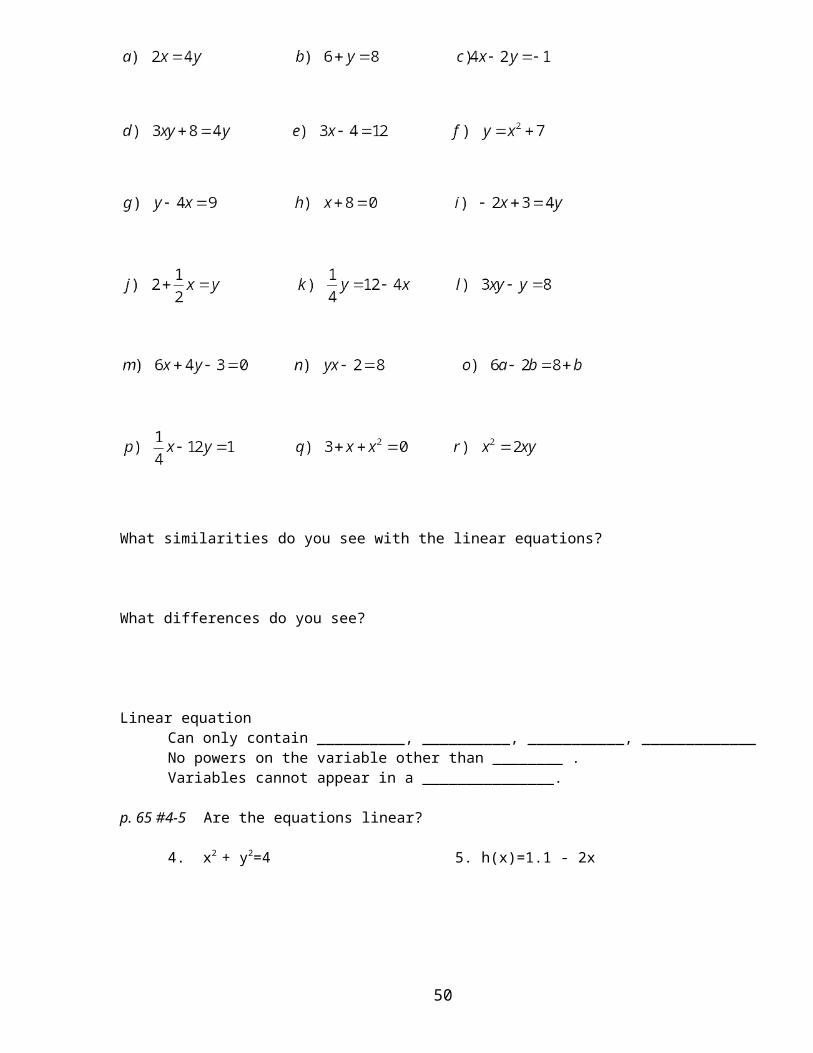
Determine whether each of the following equations is linear or not. Explain your reasoning.
40

What similarities do you see with the linear equations?
What differences do you see?
Linear equationCan only contain __________, __________, ___________, _____________No powers on the variable other than ________ .Variables cannot appear in a _______________.
p. 65 #4-5 Are the equations linear?
4. x2 + y2=4 5. h(x)=1.1 - 2x
Slope-Intercept form-Formula
m
b
41

x
y
x
y
coordinates of y-intercept are actually (____,____)*that’s a point on the graph of the line!
Point Slope form-
Need coordinates of any point on the line and the slope!
Standard Form
No fractions!No common factors!
Intercepts:
x-intercept:
y-intercept:
Ex. 2x – 3y = 6
Find the y-intercept. (0,b)If the equation is in slope-intercept form, the y-intercept is ______.
If not, plug in 0 for x, and solve for y. Why can we do this?
Find the x-intercept. (#,0)Plug in 0 for y, and solve for x.
What type of equation is in our example?
Graph the equation.
Find the x and y- intercepts for the following equations:
a. x – 5y = 10 b. 8x – y = 16
Constant Function
42

f(x) = ____________
ex. f(x) = 12
Slope = ______
Graph: __________ lineex. f(x) = 12 or y = 12
Homework Problems. p. 66 #15-23 odd, 39-47 odds 56, 71, 72
Utah State Standards1.1.c Solve absolute value and compound inequalities of a single variable
ACT Warm up:
Inequalities
**Exploration – Quality Control
Properties of InequalityAddition and Subtraction Properties
Multiplication and Division Properties
Solving an Inequality Isolate the variable using inequality properties
Ex. Solving an Inequality1. Solve . Report your answer and then graph the solution set on a number line.
*Three different ways to report your solutions!A graph on a number line
Open dot-Closed dot-
Set-builder notation-43

Interval notationUse of
Use of ( vs. [
Ex. Solve . Report your answers and graph the solution set on a number line.
Ex. 3.Solve . Report your answers and graph the solution set on a number line.
Keep your eyes open for these tricks!*When you are a solving an inequality, the variable disappears, and you arrive at a false statement, like 2>8, then the solution set for that inequality is the empty set
* When you are a solving an inequality, the variable disappears, and you arrive at a true statement, such as 5<9, then the solution set for that inequality is the set of all real numbers.
Key phrasesLess than, fewer than
Greater than, more than
At most, no more than, less than or equal to, maximum
At least, no less than, greater than or equal to, minimum
Ex. Writing and solving an equalityp.36ex4. Craig is delivering boxes of paper to each floor of an office building. Each box weighs 64 pounds, and Craig weighs 160 pounds. If the maximum capacity of the elevator is 2000 pounds, how many boxes can Craig safely take on each elevator trip?
44

2. Alida has at most $15.50 to spend at a convenience store. She buys a bag of potato chips and a can of soda for $1.55. If gasoline at this store costs $2.85 per gallon, how many gallons of gasoline can Alida buy for her car, to the nearest tenth of a gallon?
Homework problems: p. 37 #17, 27, 31, 35, 37, 39, 41, 43, 48, 49, 59, 69
Utah State Standards1.1.c Solve absolute value and compound inequalities of a single variable
ACT Warm up:
Compound Inequality-
*You must solve each part of the inequality!
Intersection of the solution sets of the two inequalities-
*A compound inequality containing the word and is true if and only if both inequalities are true. (where they overlap)
Ex. Solving an “And” compound inequality.Solve . Graph the solution set on a number line. Report solutions.
* this doesn’t have the word “and”. What should we do?
Union of the solution sets of the two inequalities-
*A compound inequality containing the word or is true if one or more of the inequalities is true. (any covered areas).
Ex. Solving an “or” compound inequalitySolve or . Graph the solution set on a number line.
45

x
y
Report your answer in interval notation as well.
Homework Problems: p.44 #8, 9, 27 – 32 all, 45 – 47 all, 51, 52
Utah State Standards1.2.a Solve systems of linear, absolute value equations algebraically and graphically
ACT Warm up:
**Exploration – Systems of Linear Inequalities**Reading – Linear Inequalities
The graph of a linear inequality is a ______________ region.
This region is made up of a gazillion ____________.Every point in the shaded region makes the inequality “true”.
To graph the inequality, follow these steps:1. Determine whether you will use a dashed or solid line.
If we have or , use a dashed line.If we have or , use a solid line.
2. Change the inequality sign to an = sign, and graph the line.
3. Choose ANY POINT that does not lie on the line you just graphed.Write down the coordinates.Plug the coordinates into the original inequality.
4. Determine where to shade your graph.If the test point made a true inequality, shade the region of the graph that contains your point.
If the test point made a false inequality, shade the region that does NOT contain your point.
Ex. Graphing Linear InequalityGraph x – 2y < 4
46

x
y
x
y
Ex. Graph 4x – y > 8
Homework: p.98 #13 – 23 odd, 35 – 37 all
Utah State Standards1.2.a Solve systems of linear, absolute value equations algebraically and graphically
ACT Warm up:
**Exploration – Linear Systems**Reading – System of Linear Equations
Warm Up! Graph the two equations on the same coordinate system.2x + y = 5 x – y = 1
A _____________ of equations is two or more equations with the same variables.
A _____________ to a system of equations is the point or points (x, y) where the lines _______________. (The point or points whose coordinates “work” in all equations.)
In the above warm-up exercise, what is the solution to the system of equations?
What are the possible ways for lines to intersect?1. Consistent Independent System
47

x
y
x
y
2. Consistent Dependent System
3. Inconsistent System
There are different ways to find the solution to a system of equations:1. By graphing and finding the point(s) of ______________.2. Algebraically3. Using matrices (next year!)
Solving systems by graphing
Graph each equation individually on the same coordinate system.
Try to find the coordinates of the point where the lines cross.*This will not always be easy, accurate, or possible.
Ex. Solving systems by graphing.Solve the system of equations and determine what kind of system you have.
1. x - 2y = 0 x + y = 6
2. 9x – 6y = -6 6x – 4y = -4
48

x
y3. 5x – 2y = 10
Solving systems algebraically (using the equations, not the graphs).
Substitution MethodTake one equation and solve for x or y. *Whatever is easier!
Substitute your new expression into the second equation. You will only have one variable, so…You can solve!
Find the second unknown by plugging your answer into an equation.
Ex. Using the Substitution Method
Solve the system using the substitution method.x + 4y = 26x – 5y = -10
49
Practice: Solve the system using the substitution method.2x – y = 133x + y = 2
Elimination MethodWe will add or subtract our equation together to eliminate one variable.
Why is this legal?
Solve for the remaining variable
Using the value you found, plug into an equation and find the other variable.
Ex. Using the Elimination MethodSolve the system using the elimination method.1. x + 2y = 10
x + y = 6
2. 2x + 3y = 125x – 2y = 11
*Weird situations when solving algebraically…
If all your variables cancel out and you get a true equation
50

x
y
Ex. 3 =3 Then your system is Consistent Dependent.What does that mean?
If all your variables cancel out and you get a false equationEx. 0 = 19Then your system is Inconsistent.What does that mean?
Ex. Weird system of equationsSolve the system of equations algebraically.
-3x + 5y = 126x – 10y = -21
**Exploration – Substitution & Elimination
Homework Problems p. 113 #13, 15, 25, 27, 44p. 120 #13, 19, 25, 29, 34, 37, 41, 60, 65
Utah State Standards1.2.a Solve systems of linear, absolute value equations algebraically and graphically
ACT Warm up:
Systems of Inequalities-
**Exploration – Under the Big Top but Above the Floor
Solutions to systems of inequalities- all the points that make the inequalities true.(the area where the shaded solution regions _____________.)
If the shaded regions do NOT ______________, then there is ________________.
You must solve these systems on a graph.
Graph each inequality separately. Determine where the shading overlaps.
Ex. Solving systems of inequalities
51

x
y
x
y
1.
2.
3.
In example 3, we had a shaded region that was a polygon. It had corners or __________.*These corners are important points!!!
How can we find the coordinates of those points?
We solve little _______________ of equations.
Let’s find the corners/vertices in example 3.52

Homework Problems. Worksheet p.133-134
Utah State Standards1.2.c Solve application problems involving systems of equations and inequalities
ACT Warm up:
Linear programming**Reading – Feasible Region**Exploration – Maximizing Profit
We can use a system of linear inequalities to find maximum and minimum values of real-world situations.
Steps to solve linear programming problems1. Define the variables2. Write a system of inequalities.3. Graph the system of inequalities.4. Find the coordinates of the vertices of the feasible region.5. Write (use) a function to be maximized or minimized.6. Substitute the coordinates of the vertices into the function.7. Select the greatest or least result. Answer the problem.
*Important terms:Constraints-Feasible region
Bounded
Unbounded
Vertices*the maximum or minimum value of a related function always occurs at one of the vertices.
53

x
y
x
y
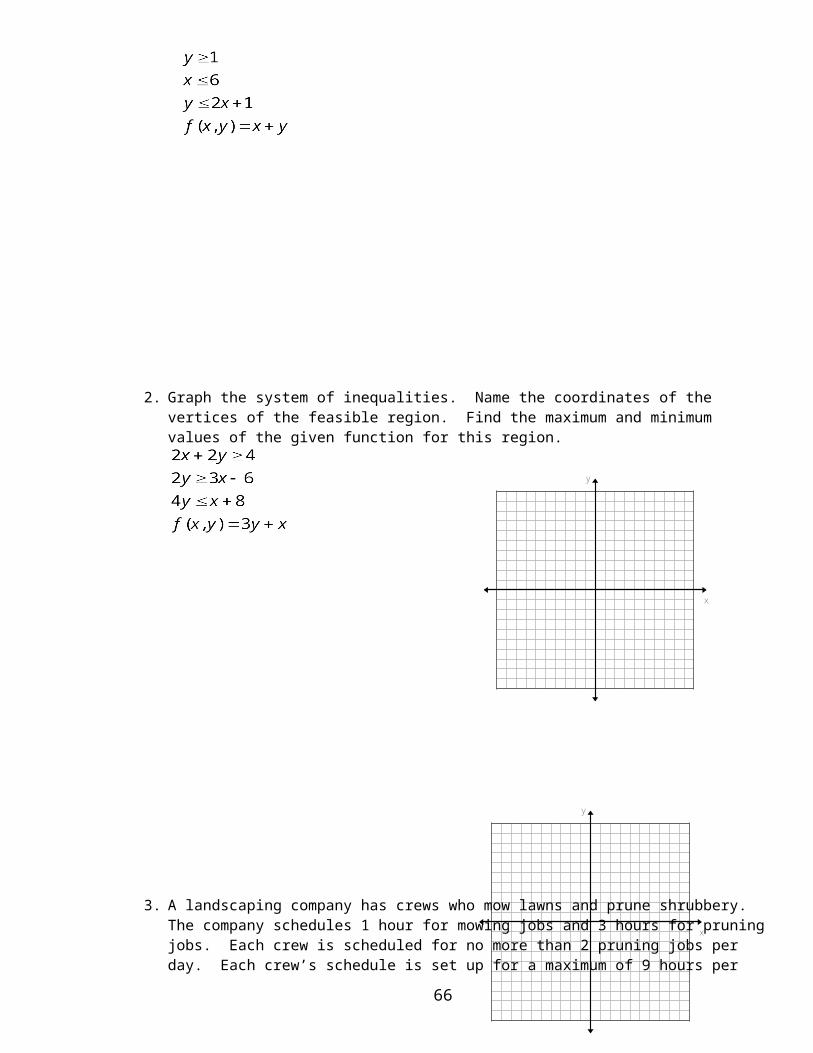
Ex. Linear Programming1. Graph the system of inequalities. Name the coordinates of the vertices of the feasible region. Find
the maximum and minimum values of the given function for this region.
2. Graph the system of inequalities. Name the coordinates of the vertices of the feasible region. Find the maximum and minimum values of the given function for this region.
54

x
y
x
y
3. A landscaping company has crews who mow lawns and prune shrubbery. The company schedules 1 hour for mowing jobs and 3 hours for pruning jobs. Each crew is scheduled for no more than 2 pruning jobs per day. Each crew’s schedule is set up for a maximum of 9 hours per day. On the average, the charge for mowing a lawn is $40 and the charge for pruning shrubbery is $120. Find a combination of mowing lawns and pruning shrubs that will maximize the income the company receives per day for one of its crews.
4. As a receptionist for a vet, one of Dolores Alvarez’s tasks is to schedule appointments. She allots 20 minutes for a routine visit and 40 minutes for a surgery. The vet cannot do more than 6 surgeries per day. The office has 7 hours available for appointments. If an office visit costs $55 and most surgeries cost $125, find a combination of office visits and surgeries that will maximize the income the vet practice receives per day.
55

Homework Problems: Worksheet p.139-140
CDAS Systems of Equations
Utah State Standards1.1.a Solve and graph first-degree absolute value equations of a single variable
ACT Warm up:
Absolute Value-
**Reading – p. 28 in text
*always nonnegative
Symbol for absolute value of a number
Ex. = Ex.
If a number _____ is positive or 0, the absolute value of that number is ______.
If a number _____ is negative, the absolute value of that number is _______.
*The absolute value bars act like parentheses. Remember order of operations!56

Ex. Evaluating an expression with absolute value
1. Evaluate
2. Evaluate if x = 4.
Look at . What are two possible values for x?
Look at |x – 5| = 8. What are two possible values for x?
Solving absolute value equations
1. Isolate the Absolute Value.2. check that the an absolute value is equal to a number greater than or equal to zero. Why?
*If it is equal to a number less than zero, there is NO SOLUTION!The solution set is the empty set
Symbolized by
3. absolute value has two different cases to worry about.
If then or . Two cases to solve!Notice that the two new cases do not have absolute value anymore!
4. check answers. Sometimes we get an answer that is not an actual solution.
5. Report our solutions in a solution set. Use { } and list your solution(s) inside.
Ex. Solving an absolute value equation.
1. Solve for y and check your answers.
2. Solve for t and check your answers.
3. Solve for z and check your answers.
57

Homework Problems: p. 30-31 #21-27 odd, 33-43odd, 53
Utah State Standards1.1c Solve absolute value and compound inequalities of a single variable
ACT Warm up:
Absolute Value Inequalities**Reading – p. 42 in text, examples 3 & 4 There will be two cases to look at for each problem.
*Remember: Absolute value means distance from zero on a number line.
Let’s say (the absolute value is less than a positive number)
Graph :
For this inequality, _________ .
< is an ______________________.
Ex. Solving a “less than” Absolute Value inequalitySolve. Graph the solution set on a number line.
Let’s say (the absolute value is greater than a number)
Graph:
58

For this inequality ________
> is a __________________.
Ex. Solving a “Greater Than” Absolute Value InequalitySolve. Graph the solution set on a number line.
Practice: p.44 #16, 18
Ex. Solve and graph the solution set on a number line.
*Things to watch out forThe solution of an inequality like is the empty set. Why?
The solution of an inequality like is the set of all real numbers. Why?
Homework Problems. P.44 #15-19 odd, 33 – 39 odd, 40, 43
CDAS: Absolute ValueUtah State Standards3.1.a Identify the domain and range of the absolute value function3.1.b Graph the absolute value function3.1.c Graph functions using transformations of parent functions
ACT Warm up:
59

x
y
x
y
x
y
x
y
x
y
The Absolute Value Function
f(x)= ________
Let’s make a t-chart
Basic Shape of the Absolute Value Function _______________
Domain:
Range:
Transformations of the absolute value function.
Investigation
Make a sketch of each function using T-charts.
What happens to the v-shape when we add or subtract a number outside the absolute value bars?
60
x
y
x
y
x
y
What happens to the v-shape when we add or subtract a number inside the absolute value bars?
What happens to the v-shape when we multiply x by a number?
What happens when we multiply by a negative number outside of the absolute value signs?
What do you think the inverse of the Absolute Value would look like? Why? Is the inverse a function?
Homework Problems. p. 94 #30-36 all, #56-57
Utah State Standards1.2a Solve systems of linear, absolute value equations algebraically and graphically.
ACT Warm up:
61

x
y
Graphing an Absolute Value Inequality
Follow the same steps as for linear inequalities.1. Determine whether you will have a dashed or solid line.2. Replace the inequality with an = sign and graph the equation.3. Choose a test point that is NOT an the graph you just drew, and plug into the original inequality.4. Determine where to shade your graph.
Ex. Graphing an Absolute Value InequalityGraph
Dashed or solid line?
Rewrite the inequality with an = sign.And graph!
Choose a test point NOT on the line.Plug into the inequality Determine shading: is the above true or false?
Practice: p.98 #27, 28
Homework Problems: Worksheets p. 95-96
Utah State Standards1.2a Solve systems of linear, absolute value equations algebraically and graphically
ACT Warm up:
62

x
y
x
y
x
y
Systems of Absolute Value equationsGraph each equation
The intersection of the v-shapes represents the solution(s).
Ex. Find the solution(s) to the system of equations.
Ex. Find the solution(s) to the system of equations.
Ex. Find the solution(s) to the system of equations.
63

x
y
x
y
Systems of Inequalies
Solve the following systems graphically:
1.
Where do the maximum and minimumfor this system occur?
2.
Homework: p. 833, Lesson 3-3 #1-12allProject – PicturesUtah State Standards1.1.e Simplify algebraic expressions involving negative and rational exponents1.3.a Simplify numerical expressions, including those with rational exponents
ACT Warm up:
64

**Exploration – Power Equations
Monomial
*Cannot have variables in denominators*Cannot have variables with negative exponents*Cannot have variables under radicals
Examples
Coefficient
Degree
Ex.
Constants
Ex.
Degree
**Exploration – Properties of Exponents
Negative exponents
Ex.1. x-3
65
Ex.2.
To simplify an expression: rewrite the expression without parentheses or negative exponents.
Product of PowersFor any real number a and integers m and n, am∙an = _______.
Ex. x5∙x3
Quotient of Powers
For any real number a (not equal to 0) and integers m and n, ______.
Ex. =
Practice Problems. Simplifying expressions.1. (-2a3b)(-5ab4)
2.
*Remember: any number (except 0) raised to the power 0 is equal to 1a0 = 1 00 = undefined
Properties of Powers (exponents)
1. Power of a Power (am)n = ______Ex.
2. Power of a Product (ab)m = ______Ex.
3. Power of a Quotient ______
Ex.
Practice Problems. Simplifying expressions
66

1. (b2)4 2. (-3c2d5)3
3. 4.
Homework Problems: p. 226 #19-41 odd, 60
Utah State Standards1.1.e Simplify algebraic expressions involving negative and rational exponents1.3.a Simplify numerical expressions, including those with rational exponents
ACT Warm up:
Square Root-
*The square root is the inverse operation of squaring a number
Ex.
Nth Root-
Ex.
SymbolIndexRadical signRadicand
67

Notation
Summary of Real nth Roots
N nth root if b > 0 nth root if b < 0 b = 0Even number One positive root, one
negative rootNo real roots One real root = 0
Odd number One positive root, no negative roots
No positive roots, one negative root
One real root = 0
Practice Problems. Finding roots.1. 2.
**Reading – p. 250 in text – Simplify Radical Expressions
Product Property of RadicalsFor any integer n > 1,
*If n is even, both a and b must be nonnegative.
Ex.
Ex.
More Practice. Finding Roots.1. 2.
3. 4.
To get an approximate answer, you may use a calculator to simplify radicals.To take the square root of a number, press and type in your number. CLOSE THE
PARENTHESES! Hit enter.
To take the nth root of a number, type in the index number. Hit the button and select #5. Then type in the radicand. Hit enter.
Homework Problems: p.248 #17-53 odd, 58,59,62,7568

Utah State Standards1.1.e Simplify algebraic expressions involving negative and rational exponents1.3.a Simplify numerical expressions, including those with rational exponents
ACT Warm up:
**Reading – p. 251 in text (top of page)
Quotient Property of Radicals
For any integer n > 1, and for any real numbers a and ,
Ex.
Summary of Simplifying Radicals1. The index n is as small as possible2. The radicand contains no factors (other than 1) that are the nth powers of an integer or
polynomial3. The radicand contains no fractions4. No radicals appear in denominator
To get radicals out of denominator… you “rationalize” the denominator.*multiply the numerator and denominator by a quantity so that the radicand has an exact root.
Ex. Ex.
69

Ex. Ex.
Operations with Radicals
*We use Multiplication and Quotient properties to work with and combine radicals.Ex.
Ex.
*Does addition work the same way? Does
Addition and Subtraction only work with like radical expressions.(indices AND radicands are alike)
Ex. and are like expressions and can be added.=
Ex. of UNLIKE expressions… cannot be added.
Practice Simplifying.1.
2.
70

3.
Conjugates- pairs of binomials of the form and .Ex.
What happens when you multiply a pair of conjugates?
(what happened in example 3 on the previous page?)
(What happens with example above?)
*The product of a conjugate pair is always a ___________________.
*We can use conjugates to rationalize ugly denominators.
Ex.
Ex.
Homework Problems: p. 254 #15-45 odd, 57, 61, 79
Utah State Standards
71
1.1.e Simplify algebraic expressions involving negative and rational exponents1.3.a Simplify numerical expressions, including those with rational exponents
ACT Warm up:
**Exploration – Rational Exponents and Roots
Rational Exponents- exponents that are fractions
Think about this…
=
For any real number b and for any positive integer n,
Except when b<0 and n is even.
Ex. Ex.
Ex. Ex.
Ex. Ex.
72

For any nonzero real number b and any integers m and n, with n>1, except when b < 0
and n is even.
Ex. = Ex.
*We can use these properties of powers to help us with any kind of rational exponent expressions.
Ex. Ex.
*If a problem is originally written with radicals, write your final answer with radicals.*If a problem is originally written with rational exponents, write your final answer with rational exponents.
Practice Problems
1. 2.
3.
SummaryNo negative exponents!No fractional exponents in the denominator!The index of a remaining radical must be as small as possible.No complex fractions!
Homework Problems: p. 261 #21-61 odd, 76, 81-8273

CDAS: Square Roots and Rational Exponents
**Project – Powers of 10
Utah State Standards1.1.b Solve radical equations of a single variable, including those with extraneous roots
ACT Warm up:
**Reading – p. 263 in text – How do radical equations apply to manufacturing?
Radical equations- equations that have variables under a radical!To solve:
Isolate the more complicated radical
Raise each side of the equation to a power equal to the index of the radical (to eliminate the radical!)
Check your solutions: there may be extraneous solutions (a number that doesn’t work in the original equation)
Ex. Ex.
Ex. Ex.
Ex.
74

**Explore solutions on the calculator – See p. 264 in text
Homework Problems p. 266 #13-27 odd, 45, 59
CDAS: Radical EquationsUtah State Standard1.3.b Simplify expressions involving complex numbers and express them in standard form, a+bi
ACT Warm up:
** Reading – History of Complex Numbers & Applications of Complex NumbersA new number in our lives… i .
When we look at the problem x2= -1, is there any real number that would fit or solve this equation? Why or why not?
__________________________ decided to define a new kind of number that would be a solution to this equation.
He called the number i. i is the principal square root of -1.
i =
It is called the imaginary unit.
i2 =
75

Pure imaginary numbers- square roots of negative real numbers.Ex. 3i, -5i, and all came from taking the square root of a negative real number.
We can use the commutative and associative properties of multiplication to help us simplify pure imaginary numbers.
Ex. Ex. Take the i’s out first!
To simplify big powers of i, we have to think a bit.Ex. i8 remember i2 = -1 Ex. i35
Complex numbers- an expression with both a real number and a pure imaginary number (that cannot be combined).
Ex. 7 + 4i and 2 – 6i and 5 + (-3)i
Standard Form of complex numbers: a + bia is the real part and b is the imaginary part.
What happens if b = 0 ? For example, 5 + 0i
Two complex numbers are equalIf and only if their real parts are equal and their imaginary parts are equal.
Ex. Find the values of g and k that would make this equation true.
Ex. Find the values of x and y that would make this equation true.
Add and Subtract Complex Numbers76

Combine the real parts and combine the imaginary parts.
Ex. (3+5i) + (2-4i) Ex. (4-6i) – (3-7i)
Multiply Complex NumbersUse FOIL. (distribute)Ex. (1+3i)(7-5i)
*(electrical engineers use this kind of number when calculating current and voltage. They use j instead of i to avoid confusion with I used for current)
Complex Conjugates: a + bi and a - biThe product of complex conjugates is always ____________________
Ex. (5 + 3i)(5 – 3i)
Divide Complex NumbersWe use the idea of the product of complex conjugates to help!
Make sure to put answers in standard complex form.
Ex. Ex.
Homework Problems p. 274 #19-41 odd, 49, 55, 62, 73
CDAS: Complex NumbersUtah State Standards1. 4.a Model real-world situations using quadratic equations
ACT Warm up:
77

Quadratic Regression- Modeling Real-World Data
Practice problems p.300
Refresher on Calculator steps for regression.
Things to do first!and and turn on Stat Plot 1.Hit and clear any equations typed in.Hit and clear list. You must then type , to name List 1 and List 2. Hit enter
until your screen says “done”.
To enter data: Hit and select Edit. You will see empty lists. List 1 will be your x-values. List 2 will be your y-values.
To see the graph of your data: You must change the window values (remember to look at your lowest and highest x-values, and lowest and highest y-values). Hit graph.
To find the linear regression equation:Hit and move to the 2nd column “Calc”. Select #4 “LinReg(ax+b)”.
You need to type in L1, L2, and to select the Y1 variable.When your screen looks like this, Hit enter.Write down your linear regression equation.
Hit graph, to see how the new line fits your data.
To find the quadratic regression equation:Hit and move to the 2nd column “Calc”. Select #5 “Quad Reg”.You need to type in L1, L2, and and select the Y2 variable. Hit .
Write down your quadratic regression equation.
Hit graph, to see how the new curve fits your data. (You should still see your linear regression equation on the screen).
Compare which line/curve fits your data better.
To make predictions, remove (clear) the equation that does NOT fit best. (We will keep the quadratic regressions for these exercises).
78

Hit the and select #1, Value. Type in the number for which you are making a prediction. (if you have a problem, make sure your window x-values include the number you are typing) Hit enter to receive the prediction value.
*Before beginning the next problem, make sure to clear your lists and clear out your equations in y = .
Homework Problems: Quadratic Regression Worksheet
Utah State Standards1.4.b Approximate the real solutions of quadratic equations graphically1.4.c Solve quadratic equation of a single variable over the set of complex numbers by factoring, completing the square, and using the quadratic formula1.4.e Write a quadratic equation when given the solutions of the equation
ACT Warm up:
Solutions to a quadratic equation- when a quadratic function is set equal to __________.
Ex.
SolutionsRootsZeros
Ex.
Real Solutions of a Quadratic Equation
79
8
6
4
2
-2
-4
-6
-5 5

One real solution Two real solutions No real solutions
Factoring- (the reverse of multiplying or distributing or FOILing.) Writing the expression as a product.
Step 1. Pull out the Greatest Common Factor of all terms.Ex. 8x2+4
Ex. 12x2 + 9x – 3
Step 2. Look at how many terms are in the expression.
*If there are two terms, see if you have the _______________________
a2 – b2 =
Ex. x2 - 144 Ex. 16x2 – 9 Ex. x2 -
Practice with groupingEx.
*If there are three terms (trinomials)
*Sometimes, it is not possible to factor!
Ex. x2 + 10x + 16 Ex. x2 – 12x + 35
Ex. 3x2 – x – 4 Ex. 2x2 + 7x + 3
Special trinomials: Perfect Square Trinomials
Ex. x2 + 10x + 25 Ex. x2 – 4x + 480

Zero Product Property
We use the zero product property to help us solve quadratic equations.First, make sure everything is to one side of the equation (leave 0 on one side).
Factor.
Set each factor = 0 and solve.
Ex. Solve by factoring.
x2 = 6x 2x2 + 7x= 15 x2 – 16x + 64 = 0
Given the roots, write a quadratic equation in the form ax2 + bx + c = 0Remember:x- root = 0 x – root = 0 Put them together as a product!
And distribute!
Ex. Given the roots -4 and 7, write a quadratic equation (with a, b, and c as integers!)
Ex. Given the roots and , write a quadratic equation (with a, b, and c as integers!)
*make sure a,b, and c are integers.
81

**Application Problems
Homework Problems p. 297 # 14-19Homework Problems. Factor Worksheet, p. 304 #15-31 odd, 35-41 odd, 57, 59
Utah State Standards1.4.c Solve quadratic equation of a single variable over the set of complex numbers by factoring, completing the square, and using the quadratic formula
ACT Warm up:
Square Root PropertyFor any real number n, if x2 = n, then x = .
Examples. Solve using the square root property.1. x2 = 36 2. (x+2)2 = 242
*This Square Root Property only works when the side with the quadratic expression is a perfect square trinomial. Rare!
We can make any quadratic expression a perfect square, by a process called ________________________________.
Let’s look at a perfect square trinomial.(x + 7)2 =
82

**Exploration – Complete the Square
To complete the square for any quadratic expression of the form x2 + bx*The coefficient of x2 must be a 1!!!
1. Find one half of b. (the coefficient of x)2. Square the result of step 1.3. Add the result of step 2 to the original expression.
Ex. Complete the square to make a perfect square trinomial.x2 + 12x
How does this help solve an equation? First, create the form x2 + bx on one side of the equation. Complete the square.Remember: whatever you add to one side, you must add to the other.Write the perfect square.Square root each side.Solve for x.
*We can use completing the square to solve any quadratic equation.
Ex. Solve by completing the square. x2 + 8x – 20 = 0
Ex. Solve by completing the square. 3x2 -2x – 1 = 0
Ex. Solve by completing the square. x2 +2x + 3 = 0.
83

Complete the square for the equation ax2 + bx + c = 0.
We have derived the ____________________________.
Formula:*this formula can be used to solve any quadratic equation.
Ex. Solve using the quadratic formula. x2 - 8x -33 = 0a= b= c=
Sketch.
Ex. Solve using the quadratic formula. x2 + 22x +121 = 0a= b= c=
Sketch.
Ex. Solve using the quadratic formula. 2x2 + 4x -5 = 0a= b= c=
84

Sketch.
Ex. Solve using the quadratic formula. x2 - 4x = -13a= b= c=
Sketch.
Remember: We can solve quadratic equation a number of ways.Graphing (finding the x-intercepts) and factoring only work SOME of the time.Completing the Square and the Quadratic Formula work ALL of the time.
**Exploration – How High Can You Go?
Homework Problems. p. 311 #33-47 odd, 57, 58Homework Problems. p. 318 #17-23 parts b and c odd, 29-35 odd
Utah State Standards3.1.b Graph the quadratic function.3.1.d Write an equation of a parabola in the form when given a graph or an equation
ACT Warm up:
85

Vertex Form of a Parabolay = a(x – h)2 + k Just a different form of the equation y = ax2 + bx + c
(h, k) are the coordinates of the __________________
If a > 0, the parabola
If a < 0, the parabola
Given an equation in vertex form y = a(x – h)2 + k, we can get a rough graph pretty easily.
Example. y = -2(x-2)2 + 3
How do we write an equation in vertex form, given y = ax2 + bx + c.We will use the process of Completing the Square.
Ex. y = 3x2 + 24x + 50
86

What is the vertex, axis of symmetry, and direction of opening of the parabola?
Ex. y = -x2 – 2x + 3Put in Vertex Form. What is the vertex, axis of symmetry, and direction of opening of the parabola?
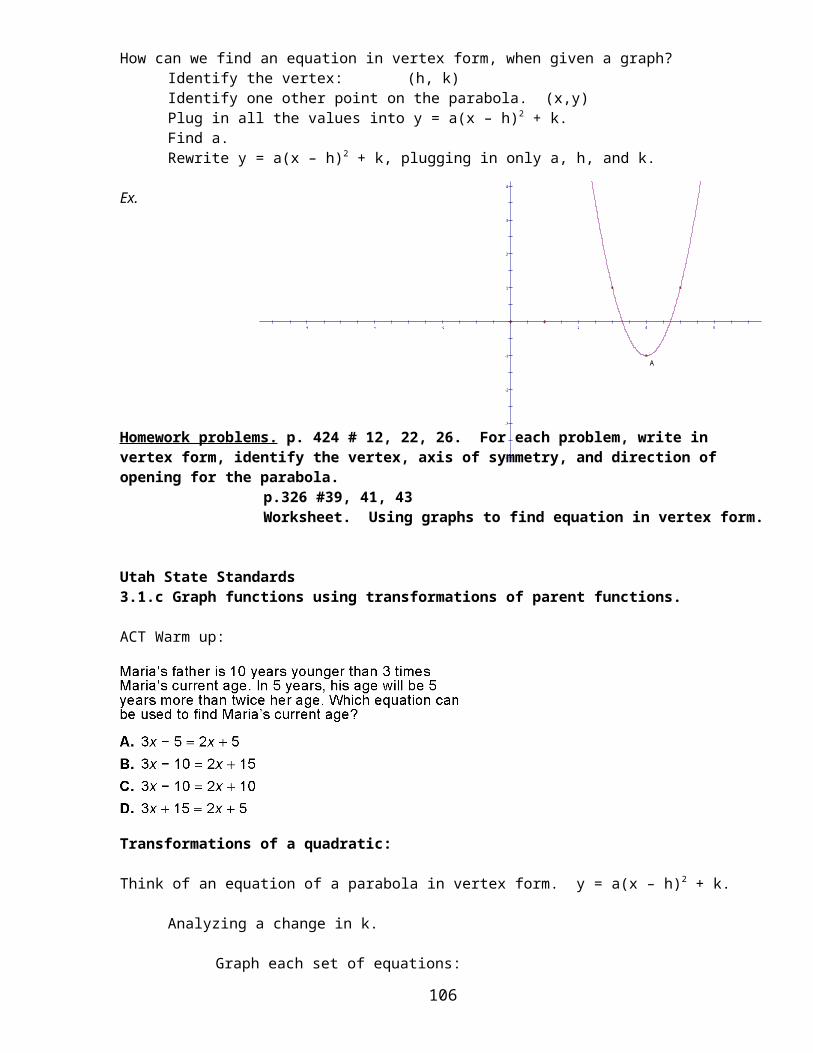
How can we find an equation in vertex form, when given a graph?Identify the vertex: (h, k)Identify one other point on the parabola. (x,y)Plug in all the values into y = a(x – h)2 + k.Find a.Rewrite y = a(x – h)2 + k, plugging in only a, h, and k.
Ex.
Homework problems. p. 424 # 12, 22, 26. For each problem, write in vertex form, identify the vertex, axis of symmetry, and direction of opening for the parabola.
p.326 #39, 41, 43Worksheet. Using graphs to find equation in vertex form.
Utah State Standards3.1.c Graph functions using transformations of parent functions.
ACT Warm up:
87
4
3
2
1
-1
-2
-3
-4
-6 -4 -2 2 4 6
A
x
y
x
y
x
y
x
y
x
y
x
y
x
y
x
y
Transformations of a quadratic:
Think of an equation of a parabola in vertex form. y = a(x – h)2 + k.
Analyzing a change in k.
Graph each set of equations:
y = x2 y = x2 + 3 y = x2 - 5
Sketch:
What does a change in k do to the graph of a parabola?
Analyzing a change in h.
Graph each set of equations:
y = x2 y = (x+3)2 y = (x-5)2
Sketch:
What does a change in h do to the graph of a parabola?Analyzing a change in a.
Graph each set of equations:
y = x2 y = -x2
Sketch:
88

x
y
x
y
x
y
Graph each set of equations:
y = x2 y = 4x2 y = 2
Sketch:
What does a change in a do to the graph of a parabola?
Homework Problems. p. 321 #1-15
CDAS: Solving Quadratic Equations
Utah State Standards3.1.a Identify the domain and range of the absolute value, quadratic, radical, sine, and cosine functions3.1.b Graph the quadratic function.
ACT Warm up:
Quadratic Function
**Reading – p. 286 in text – How can income from a rock concert be maximized?
Graph of a quadratic function:
Basic shape:
*We can graph a quadratic function by making a t-chart! Or we can learn more and save ourselves some time!
89
x
y
Axis of symmetry: x =
*this is a vertical line! ** Reading p. 287 in text
Vertex:
x-coordinate of vertex:
How can we find the y-coordinate of the vertex?
y-intercept-
In a quadratic function, the y-intercept is simply ______.
All these pieces of information can help us graph a parabola.
And we can make a small t-chart or use symmetry to help us make a smooth curve.
Ex. Graphing a quadratic function. Consider the function f(x)=2 - 4x + x2
1. Find the y-intercept, the equation of the axis of symmetry, and the coordinates of the vertex.
2. Use this information to graph the function.
Maximum and minimum values of a quadratic function.
The _______________ of the vertex is the max or min value.
The graph of f(x) = ax2 + bx + c
Opens up when Diagram
The minimum value is the y-coordinate of the vertex.
Opens down when Diagram
90

The maximum value is the y-coordinate of the vertex.
*A quadratic function does not have both a maximum and minimum value.
Example 4, p.289 – 290 in text
Ex. Find max or min of a quadratic function.Consider the function f(x) = -x2+2x+3
Determine whether the function has a maximum or minimum value and find that value!
With the information of max and min, we can discuss domain and range of quadratic functions.Domain (possible x-values)-
Range (possible y-values)-
What do the max/min values and y-intercept mean in our real-world data?
Homework Problems p. 291 #19-27 odd (find the domain and range of each function too!), 33-43 odd, 44, 45, 64, 68
Utah State Standards1.2.a Solve systems of quadratic equations algebraically and graphically1.2.b Graph the solutions of systems of quadratic inequalities on the coordinate plane1.4.d Solve quadratic inequalities of a single variable.
ACT Warm up:
91

Systems of quadratic equationsTo solve, find the point(s) where the parabolas or lines intersect.
AlgebraicallyUse the substitution method to solve.
Ex.
Ex.
Quadratic inequalities of one variableTo solve means to find all the real numbers that make the inequality true.
How to solve. Ex. x2 + x > 61. First solve the related equation.
92

x
y
x
y
2. Plot the solutions to #1 on a number line.3. Test a value in each interval in the original inequality.
4. Summarize results.
Ex. Solve x2 + x 2
Quadratic inequalities of two variables. To solve means to find all the points (x,y) that make the inequality true.
How to solve. Ex. y > -x2 - 6x – 7
1. Graph the related equation.
2. Choose a test a point inside the parabola. Plug into the original inequality.
3. If the test point “works” shade the region inside the parabola.4. If the test point does NOT “work” shade the outside of the parabola.*Your solution is the shaded region!
Ex. Solve. y > x2 – 3x + 2
93

x
y
x
y
Systems of equations
Solve the following system of equations algebraically and graphically.
Systems of quadratic inequalities.To solve means to find the points where the shaded regions overlap.
Graph each inequality separately.
Clearly mark the overlapping regions as the solutions.
Ex.
Homework Problems: p. 333 #15- 35 odds, 49p.458 #11, 12
CDAS: Coordinate Geometry
CDAS: Quadratic Inequalities and Writing Quadratic Equations
Utah State Standards3.1.a Identify the domain and range of the radical function3.1.b Graph the radical functions3.1.c Graph functions using transformations of parent functions
94

x
y
x
y
x
y
ACT Warm up:
**Reading – Application of Square Root Function
Square root function-
*The inverse of a ________________ function.
*There is a restriction on the domain/range.
Graph of y = x2 Graph of y = x2
(no restrictions on domain) (restrictions on domain)
The basic square root function has a graph as follows.Domain:
Range:
95

x
y
x
y
x
y
x
y
x
y
x
y
x
y
To graph more complex square root functions1. Determine the domain 3. Make a small t-chart2. Find the x and y intercepts 4. Determine the range.
Practice. Graph . State the domain, x and y intercepts, and the range.
Investigate transformations to the basic function, its graph, domain and range.
Graph each of the following equations:
SKETCH.
Adding or subtracting a number NOT UNDER THE RADICAL creates a _________________________.
Domain change:
Range change:Graph each of the following:
SKETCH.
96

x
y
x
y
x
y
x
y
x
y
x
y
Multiplying the variable by a number UNDER THE RADICAL creates _______________________.
Domain change:
Range change:
Graph each of the following:
SKETCH.
Adding or subtracting a number UNDER THE RADICAL creates ______________________.
Direction:
Domain change:
Range change:
Graph each of the following:
SKETCH.
Including a negative in front of the variable, UNDER THE RADICAL creates ______________________________.
Including a negative in front of the variable, in front of the radical creates ______________________________.
Domain change:
Range change:
Systems of Equations
97

x
y
Ex. Find the solution(s) to the following system of equations:
**Example – Solving a Square Root Function**Reason and Apply
Homework Problems. p. 398 #15-25 odd, 39,40
Utah State Standards.1.1.d Add, subtract, multiply, and divide rational expressions and solve rational equations
ACT Warm up:
**Reading – Operations with Rational Expressions
Rational expression-
To simplify a rational expression-*just like simplifying a regular fraction.
Ex1. Simplify Ex2. Simplify
When are these expressions undefined?
98

Tricks in simplifyingLook for ways to ___________ the numerator and denominator.
Ex.
See if factoring -1 can help.
Ex. Ex.
Multiplying rational expressions
Ex. Ex.
Dividing Rational ExpressionsRemember dividing by a fraction is the same as ____________________________________________________.
Rewrite the problem first. Then simplify as in a multiplication problem.
Ex. Ex.
99

Simplifying complex fractions (fractions within fractions)*Think of these problems as division problems!
Ex. Ex.
Homework Problems. p. 476 #13-35 odds
Utah State Standards.1.1.d Add, subtract, multiply, and divide rational expressions and solve rational equations
ACT Warm up:
**Reading – p. 479 in text – How is subtraction of rational expressions used in photography?
Adding or subtracting rational expression*you need a common denominator!!!
Tips for finding least common multiples1.Factor each number or polynomial2.The least common multiple contains each factor the greatest number of times it appears as a factor.
Practice Problems4. Finding the LCM of 18r2s5 , 24r3st2 , 15s3t
100

5. Find the LCM of p3+5p2+6p and p2+6p+9
Once the common denominator is found…Multiply each fraction by what is missing (top and bottom).
You are then able to add/subtract the numerators.Denominator stays the same.
Practice Problems
1.
2. 3.
Homework Problems. p.482 #17-35 oddUtah State Standards.1.1.d Add, subtract, multiply, and divide rational expressions and solve rational equations
ACT Warm up:
101

**Reading – p. 505 in text – How are rational equations used to solve problems involving unit price?
Rational equations-
Easier to solve if fractions are eliminated. How do we do that?
Find the LCD
Multiply every term by the LCD.
Solve the resulting equation.
*Check for trouble solutions (extraneous)
Practice Problems.
1.
2.
102
x
y
x
y
Example 5, p. 508 in text
Homework Problems. p. 510 #11-17 odd, 23, 25, 27
CDAS: Rational Expressions and Equations
Utah State Standards2.3.a Define exponential functions as functions of the from 2.3.b Model problems of growth and decay using exponential functions2.3.c Graph exponential functions
ACT Warm up:
**Exploration – Radioactive Decay
Exponential Functionswhere *Only b is raised to a power!
Ex. Graph
What is the domain of the equation?
What is the range?
Ex. Graph
What is the domain of the equation?
103

x
y
x
y
What is the range?
Ex. Graph
What is the domain of the equation?
What is the range?
Ex. Graph
What is the domain of the equation?
What is the range?
In general, the domain of an exponential function is _________________.
The range is _______________________.
The graph contains the point (0, a).(the y-intercept is a).
Exponential Growth- ____________________ from left to right.
Sketch.
If a > 0 and b > 1, the function represents exponential growth.
Exponential Decay- _________________ from left to right.
Sketch.
If a > 0 and 0 < b < 1, the function represents exponential decay.Ex. Determine whether each function represents exponential growth or decay.
1. 2. 3.
Modeling with an Exponential Function104

Use the y-intercept and a given data point to write an equation in exponential form.
Ex. In Decemeber of 1990, there were 5,283,000 cellphone subscribers in the United States. By December of 2000, this number had risen to 109,478,000. Source: Cellular Telecommunications Industry Association
Using x as the number of years since 1990, write an exponential function that could be used to model the number of cellphone subscribers y in the U.S.
Suppose the number of cellphone subscribers continues to increase at the same rate. Estimate the number of U.S. subscribers in 2010.
Homework Problems. p. 528 #21, 23, 27, 29, 57, 58, 59, 60
CDAS: Exponential FunctionsUtah State Standards2.4.a Relate logarithmic and exponential functions2.4.b Simplify logarithmic expressions2.4.e Graph logarithmic functions
ACT Warm up:
**Exploration – Logarithmic Funtions
Logarithmic Functions
The inverse of exponential functions (where a = 1).
105
Domain:Range:
Contains the point (1, 0) The x-intercept is 1.
Sketch
A logarithm is an exponent (a power).
if and only if
Ex. because
Ex. because
Ex. and so
Ex. and so
**Exploration – Properties of Logarithms
Properties of Logarithms
Product Property
Ex.
Quotient Property
Ex.
Power Property
Ex.
Property of Equality
106

Ex. If , then x = _______.
Inverse Property of Exponents and Logarithms
Ex. Ex.
Use properties to solve equation. Check your answers!
Ex. Ex.
Ex. Ex.
Common base:
Usually don’t write the 10.*This is the button on your calculator.
Homework Problems. p. 536 # 21, 22, 24, 27, 30, 47, 50, 51 p. 544 #21-31 odds
Utah State Standards2.4.c Convert logarithms between bases2.4.d Solve exponential and logarithmic equations2.4.e Graph logarithmic functions2.4.f Solve problems involving growth and decay
ACT Warm up:
107

Solving logarithmic equations using exponentiation.Steps used.
1. Identify the base of the logarithm.2. Exponentiate each side with that base.3. Simplify and calculate.
Ex. Ex.
Solving exponential equations using logarithms.Steps used.1. Identify the base of the exponential.2. “Take the logarithm” of both sides, using the same base identified in step 1.3. Simplify and calculate.
a. To use a calculator, use the change of base formula to change to base 10.
Change of base formula from a to b.
Ex. change to base 10 and calculate
Ex. Solve
**Exploration – The Number e
Natural Logarithm. means the same as .
*Using this base can also be helpful in solving equations.
108

Ex. (this is the half-life formula for carbon decay)
Ex. As of 2000, China was the world’s most populous country, with an estimated population of 1.26 billion people. The second most populous country was India, with 1.01 billion. The populations of India and China can be modeled by and respectively. t represents the number of years after 2000. According to these models, when will India’s population be equal to China’s?
Ex. Using the decay formula where t is in hours, r is the percent decrease expressed as a decimal, and a is the original amount. A cup of coffee contains 130 milligrams of caffeine. If caffeine is eliminated from the body at a rate of 11% per hour, how long will it take for half of this caffeine to be eliminated from a person’s body?
Homework Problems. p. 550 #13, 14, 28, 31, 33, 65, 67p. 563 #10, 12
CDAS: LogarithmsUtah State Standards3.2.a Convert angle measurements between radians and degrees3.2.b Find angle measures in degrees and radians using inverse trig functions, including exact values for special triangles3.3.a Define the sine, cosine, and tangent functions using the unit circle3.3.b Determine the exact values of the sine, cosine, and tangent functions for the special angles of the unit circle using reference angles3.3.c Find the length of an arc using radian measure3.3.d Find the area of a sector in a circle using radian measure
109

13
12
5
A
ACT Warm up:
**Reading – Right Triangle Trigonometry
Trigonometry
Basic trig ratios.
Ex. Find the sin, cos, and tan for angle A.
Inverse trig functionsGiven the value of a trig ratio, we can find the actual angle measure.
Ex. Given that , find .
Ex. Given that , find .
Placement of right triangle in standard position on the coordinate system
Unit circleRadius =
110
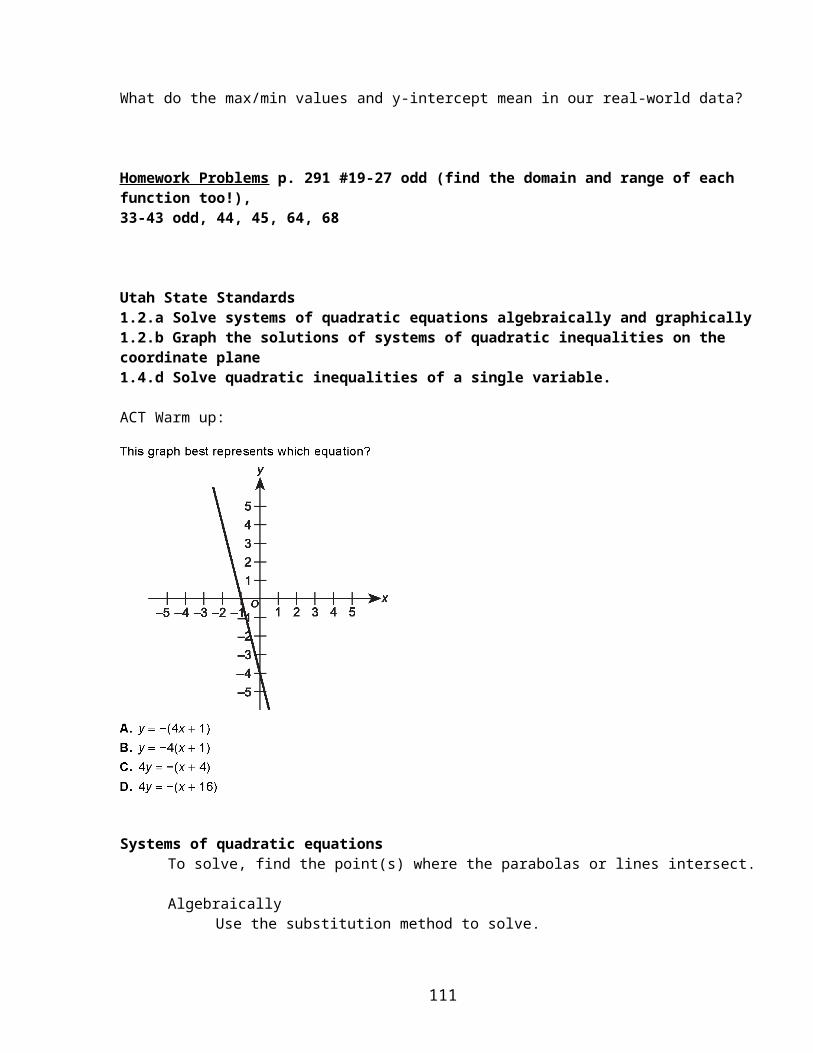
1
(Hypotenuse has length of _______)
Trig ratios when triangle is on the unit circle.
*Use the coordinates from the unit circle to get our trig ratios!
Special angles on the unit circle and their coordinates.
**Exploration – Parametric Equations for a Circle
Ex. Finding trig ratio values given coordinates on the unit circle .
Ex. Find the angle measure given the trig ratio value.
Find when . Find when .
111

Reference Angles-
Ex. Find the reference angle for
Refresher on coordinate values in each quadrant
Finding trig values for angles other than special angles.Steps to determine value.1. Determine which quadrant the angle lies in.2. Determine the positive/negative value for that quadrant.3. Find the reference angle.4. Determine the trig value for the reference angle.5. Apply the correct positive/negative sign.
Ex. Find . Find .
Radian measure of an angle.
Circumference of a circle =
On the unit circle, r =
Circumference of the unit circle =
radians
Converting radians to degrees
112

Ex. Convert to degrees. Convert to degrees.
Converting degrees to radians
Ex. Convert to radians Convert to radians.
*All the trig work we’ve done can be in either radians or degrees.
Arcs and Sectors
Formulas
Arc Length Area of a Sector
Examples
1. Find the length of an arc with the given circle radius and central angle measure.
2. Find the area of a sector with the given circle radius and central angle measure.
**Exploration – Using Trigonometry to Set a Course
Homework Problems. p.706 #15, 17 p.712 #19, 20, 27, 31, 35, 36, 56113

p. 722 #25, 26, 30, 33, 35, 40Utah State Standards3.1.a Identify the domain and range of the sine and cosine functions3.1.b Graph the sine and cosine functions3.1.c Graph functions using transformations of parent functions
**Reading – History of Pendulums
Sine Function
Domain (x): all possible angles:
Range:
Graph of basic Sine Function
Length of one cycle of wave (Period) = _______
Height (Amplitude) =
Changes to Sine Function
Graph and .
114

What change is caused by the 5 in the equation?
In general, causes a changes in the ___________________.
Graph and .
What change is caused by the in the equation?
In general, causes a change in the ____________________.
Graph and .
What change is caused by the in the equation?
In general, causes a ____________________________.
Graph and .*notice that the 3 is not in parentheses!
What change is caused by the 3 in the equation?
In general, causes a ______________________________.Cosine Function
Domain (x): all possible angles:
Range:
Graph of basic Cosine Function
115

Length of one cycle of wave (Period) = _______
Height (Amplitude) =
*Changes to Cosine Function are the same as the changes to Sine Function.
Ex. Graph Graph
Ex. Describe the changes to the basic graph that the equation will cause.
Ex. Describe the changes to the basic graph that the equation will cause.
Homework Problems: p. 767 (15, 16, 19, 21, 28) p. 775 (25, 27)
CDAS: Trigonometry
Utah State Standard III, Objective 3: Students will determine trigonometric measurements using appropriate techniques, tools, and formulas.
ACT Warm up:
116

Trigonometric Identities
Reciprocal Identities:
Quotient Identities:
Pythagorean Identities:
Simplifying Expressions using the Identities:
Example: Simplify
117

Example: Simplify
Example: Simplify
Homework Problems: p.780 (25 – 35 odds)
118