internal assessment (ia) lab report guide...1 internal assessment (ia) lab report guide adapted from...
TRANSCRIPT
1
InternalAssessment(IA)LabReportGuideAdaptedfromMr.ToddMcGee,IBBiology,BrookePointHighSchool,Stafford,VA
Your internal assessment (IA) lab report is a professional document based on your accumulation of
knowledgeandabilitiestoactandfunctionasascientist.Iknowitistimeconsuming,butyouarethescientistandweareexcitedtoseeyourresults!Havefunasyoupartakeinthejoyofbeinganindependentscientist.
Youwillproduceadocument(typically6-12pageslong)thatwillbeassessedbyyourinstructoraswellasa random“externalmoderator,”usually froma foreigncountry,duringthesummermonths.Yourscoreswillbecomparedandaveragedforyourfinalscore.
Remember,theIAlabreportsconstitutes20%ofyourfinal IBscore(80%isfrompapers1,2&3whichwillbetakeninMay)andconstitutesalargepartofyouroverallQ3gradeinthisclassroom.
PersonalEngagementShowevidenceofyourcommitmentanddedicationtosolvingyourresearchquestion. +2Points(8%)
ExplorationProvideawell-designedlabcompletewithbackgroundresearchandfocusoncontrols. +6Points(25%)
AnalysisProcessingdatainatable(s)andgraph(s)aswellasuseofappropriatestatisticstosupportaconclusion. +6Points(25%)
EvaluationConcludinganddiscussingyourdatabasedonyourresearchquestionanditsimplicationstotheworld. +6Points(25%)
CommunicationThefocusofyourlabtotheresearchquestionandyourabilitytoclearlyconveydata,ideasandthoughtstoreaders. +4Points(17%)
Total +24Points(100%)
RequirementsoftheIALabReport:i. Mustbetypedin12pointfontinalegible,professionalfont(nocomic-sans!).
a. Graphsanddatatablesneedtobecreatedonacomputer,preferablyMicrosoftExcel®.b. AfreealternativetoMicrosoftExcel®isOpenoffice.orgofwhichyoucandownload.
ii. Labreportneedstobeorganizedintheproperformatofaformallabreport.iii. Allfactualinformationmustbecitedandproperlysourcedonaseparateworkscitedpage.iv. Ifhumanvolunteersubjectsareused,thelabmusthavetheirsignedconsentsheetsattached.v. Thefinallabreportmustbeelectronicallysubmittedtomebythedeadline(.pdf,.doc,.odtonly)
toturnitin.com.Responsibilities:Makesureyoudevelopalabthatiswithinyourabilitiesandtimetocomplete.Simple,focusedandclearresearchquestionswillsetyouupforsuccess.Itisyourresponsibilitytoappreciatethemeaningofacademichonesty,especiallyauthenticityandintellectualproperty.Youarealsoresponsibleforinitiatingyourresearchquestiononyourownanddevelopingamethodtotestit.Seekinghelpwhenindoubt,demonstratingindependenceofthought,initiativeinthedesignandimplantationofyourinvestigationareimportantforyoutodemonstrateasascientistandasastudent.TheIAisyourresponsibilityanditisyourwork.Plagiarismandcopyingother’sworkisnotpermissible.Youmustclearlydistinguishbetweenyourownwordsandthoughtsandthoseofothers.ItispreferredthatyouuseMLAformatforciting(althoughresearchbiologiststendtouseCSEorCMSformats).KeyDueDates:TBA

2
Videotutorialsontablemaking,graphingandstatisticalanalysiswithMicrosoftExcel®arefoundonmyclass’YouTubeChannel,McGEEmc²
https://www.youtube.com/channel/UC0Myr5ilGtyaemlZfpX1SuA
(OnceIreach1,000subscribers,IcanmakeitacustomURLlink.Untilthen…I’msorry.)
Not copyrighted. Feel free to distribute and modify. Dedicated to the success of the IB Biology Programme. –Todd McGee, Spring 2016

3
“It is the long history of humankind (and animal kind, too) those who learned to collaborate
and improvise most effectively have prevailed.” –Charles Darwin, 1859
STRUCTURE OF THE IA LAB REPORT
I. Title Page
1. Titlea. Descriptivetitlereferringtoyourlabaswellasyournameanddate.
2. Abstracta. <300wordsummaryofyourentirepaper,writteninitalics.
II: Design
3. ResearchQuestion/Aima. Whatareyoutryingtodiscoverorinvestigateinyourlab?
4. BackgroundInformationa. Paragraph(s)discussingthebackgroundofyourexperimentandrelevantdetails.
5. Hypothesis&Explanationa. Predicttheoutcomeofyourinvestigationandexplaintherationaleastowhyyoubelievethis.
6. Variables(Measurementsifdoingabasicinvestigation)a. IdentifytheIndependentVariable(I.V.)andtheincrements/unitsused.Example:
i. “AmountofCornStarchUsed(0.5g,1.0g,1.5g,2.0g,2.5g)”b. IdentifytheDependentVariable(D.V.)andtheunitsused.Examples:
i. “MassoftheCornPlant(g),”or“AmountofBubblesfromPlantStem(min-1)”7. Controls
a. Identifypracticalthingsthatmustbeheldconstantbetweengroupsandhowyouwilldoit.i. “Temperature between experimental groups. Maintained by keeping them in same
roomalwaysincloseproximity.”8. Materials
a. Numberedlistofspecificmaterialswithquantitiesused.9. Procedure/Methods
a. Stepsonhowtoconductyourinvestigation.Mustbeveryprecise,replicableandnotredundant.
III: Data Collection & Processing
10. DataTable(s)/Calculationsa. Anythingshowingdataandhowyoucalculatedthings.Showrawdata,uncertainties,etc.
11. Graphs/Chartsa. Anythingtohelpusvisualizethedataandnotetrends,etc.forconclusion.
IV: Conclusions
12. Resultsa. Citewhattrendsorvaluesyounoticedinthedata.Stateaconclusion“mydataconfirms/rejects
thehypothesisordataisinconclusive.NEVERsay“thedataproved,”oryouwillbemarkeddown.13. Discussion
a. Discussandinterpretthemeaningandimplicationsofyourresults.(Thisisalmostalwayslongerthanyourconclusionanditiswhereyougettospeakyourmind.)
14. Evaluations&Improvementsa. Mustevaluateanysourcesoferrorspresentandidentifyhowtotheycouldbeimproved.
V: Appendix
15. References/WorksCited

4
a. Workcitedpagelistedalphabeticallybyauthorandproperlyformatted.16. InformedConsentForm*(onlyifusinghumantestsubjectsforobtainingdata)17. Miscellaneous
b. (Optional:Canbeanythingfrommaps,glossary,notesmentionedinthelab,etc.)
IALabReportGuideManual-TableofContentsBACKGROUNDINFORMATION
1. StructureoftheIALabReport………………………………………………………………………………32. TypesofInvestigations…………………………………………………………………….…………………..63. AssessmentCriteria(simplified)……………………………………………………………………………6
TitlePage
4. Title………………………………………………………………………………………………………………………75. Abstract………………………………………………………………………………………………………………..7
PARTI:Design
6. ResearchQuestion/AIM……………………………………………………………………………………….87. BackgroundInfo……………………………………………………………………………………………………88. Hypothesis/Explanation……………………………………………………………………………………….89. Variables……………………………………………………………………………………………………………….910. Controls…………………………………………………………………………………………………………….....1011. Materials………………………………………………………………………………………………………………1012. Procedure/Method………………………………………………………………………………………………11
PARTII:DataCollection&Processing
13. DataCollectionIntroduction…………………………………………………………………………………1214. UseofUncertainties……………………………………………………………………………………………..1215. DataTablePresentation……………………………………………………………………………………….1316. ProcessingRawData…………………………………………………………………………………………….15
a. Commonstatisticaltests17. UseofDecimalPoints&SigFigs……………………………………………………………………………1618. Graphs………………………………………………………………………………………………………………….17
PARTIII:Conclusions
19. Results………………………………………………………………………………………………………………….1820. Discussion…………………………………………………………………………………………………………….1821. Evaluation&Improvement…………………………………………………………………………………..18
APPENDIX
1. References/WorkCited………………………………………………………………………………………..192. InformedConsentForm(onlyforthoseusinghumantestsubjects)……………………..193. AltKeysShortcuts(forWindows®users)………………………………………………………………214. AssessmentRubric(Full)………………………………………………………………………………………21
FORMS(tobecompletedandsubmitted)

5
5. ResearchQuestionSubmissionForm…………………………………………………………….. (TBD)6. Draft–DesignSubmissionForm……………………………………………………………………. (TBD)7. Draft–FullReportSubmissionForm…………………………………………………………….. (TBD)8. PersonalReflection……………………………………………………………………………………….. (TBD)
TypesofInvestigations:Afteryouhavecoveredanumberofbiologysyllabustopicsandperformedanumberofhands-onexperimentsinclass,youwillberequiredtoresearch,design,performandwrite-upyourowninvestigation.Asyoucansee,itdoesn’thavetobeatypicalexperimentwitha5x5tableoftrialsandvariables.Youjusthavetoshowusyourabilitytofunctionasascientist.TraditionalHands-OnExperimentalWorkand/orBasicInvestigation(s).Thiscouldinvolveextendingsomeoftheprotocolsthatyouundertookaspartofthesyllabusoryoumightinvestigateinapracticalwayanexperimentrelevanttosomeoftheconceptsyouhavelearnedthroughthecourse.Thismightbeatypicalexperimenttotestavariable’seffectonsomething,oritcouldbeyouinvestigatingacomparisonbetweenthingsinnaturetoseeifarelationshipispresent.DatabaseInvestigationsAdatabaseisamassofinformationthatcansearchedthroughtheuseofquery.Inthistypeofinvestigation,youarenotactuallycollectingdata,butratherusingdatathatscientistshavealreadycollectedtofindsomethingtheymayhaveneverseenbefore.Youmayobtaindata,processandanalyzetheinformationforyourinvestigation.ExamplesmightincludeGenBank,theAlleleFrequencyDatabaseortheAudubonChristmasbirdcount.SimulationsandModelsItmaynotbefeasibletoperformsomeinvestigationsintheclassroom,butyoumaybeabletofindacomputersimulation.Thedatafromasimulationcouldthenbeprocessedandpresentedinsuchawaythatsomethingnewisrevealed.Therearealotofevolution/genefrequencysimulatorsonline.Combinationsoftheabovearealsopossible.Thesubjectmatterofyourinvestigationisuptoyou.Itmaybesomethingwithinthesyllabusoroutsidethesyllabus.Thedepthofunderstandingshouldbe,however,commensuratewiththecourseyouaretaking.ThismeansthatyourknowledgeofIBBiologywillbesufficienttoachievemaximummarkswhenassessed.Youalsoneedtoensurethatthematerialsandequipmentrequiredtoconductyourexperimentcanbeprovidedbyyourschooloryourownfundsbeforeundertakingyourresearch.AssessmentCriteria:(howwillIbegraded?)Personalengagement(+2pointsmax)Thiscriterionassessestheextenttowhichyouengagewiththeinvestigationandmakeityourown.Personalengagementmayberecognizedindifferentattributesandskills.Theseincludethinkingindependentlyand/orcreatively,addressingpersonalinterests,andpresentingscientificideasinyourownway.Exploration(+6pointsmax)Thiscriterionassessestheextenttowhichyouestablishthescientificcontextforyourwork,stateaclearandfocusedresearchquestionanduseconceptsandtechniquesappropriatetothecourseyouarestudying.Whereappropriate,thiscriterionalsoassessesawarenessofsafety,environmentalandethicalconsideration.Analysis(+6pointsmax)Thiscriterionassessestheextenttowhichyourreportprovidesevidencethatyouhaveselected,processed,analyzed,andinterpretedthedatainwaysthatarerelevanttotheresearchquestionandcansupportaconclusion.Evaluation(+6pointsmax)Thiscriterionassessestheextenttowhichyourreportprovidesevidenceofevaluationoftheinvestigationandresultswithregardtotheresearchquestionandthe“widerworld”.

6
Communication(+4pointsmax)Thiscriterionassesseswhethertheinvestigationispresentedandreportedinawaythatsupportseffectivecommunicationofthefocus,processandoutcomesoftheinvestigation.
-Amorespecificandgeneralrubricforassessmentisincludedtowardsthebackofthislabguide-
_______________I.TitlePage_______________
Createacatchytitlepagetogenerateinterest.Ifyouaregoingtouseagraphing,makesureitisnice,professionalandpresentable.Examinesomesamplescholarlyresearcharticlesonmywebsiteoronlinetoseehowtheirtitlepagesappear.Theyusuallyappearverysimplistic.Title:Makesureyoudevelopatitleforyourlabthatrepresentswhatisbeingstudied.Thetitlemustbedescriptiveandinformativeastothepurposeofthestudy.
a. GOODIDEA:(Theseareinformativetitles)i. “AnInvestigationintotheMovementsofDrosophilamelanogasterasaFunction
ofTemperatureinitsEnvironment.”ii. TheEffectofHeartRateonBloodPressureinHomosapiens.
b. BADIDEA:(TheseareNOTdescriptivetitles!)i. “MyCornLab”ii. “AStudyofMicroorganisms”
Abstract:Anabstractissimplyashortessayoflessthan300wordsthatsummarizesyourentirepaper.AnabstractisALWAYSatthefrontofaresearchpaper.Professionaljournalsalwayspublishanabstractofascholarlylabreport,eveniftheydon’tallowyoutoviewtheactuallabifyouarenotasubscriber.Don’toverthinkthis;justsummarizeyourlabreport.Thinkofitassomethingthatonecouldviewiftheydidn’thavethetimetoreadyourentirelab.Theabstractmustbewritteninitalicsandprintedatthebottomofthetitlepage.ItmustFITthetitlepage!Youmayadjustthefontbetween10-12tomakeitfitbutkeeptheabstractsingle-spaced!

7
_______________II:DESIGN_______________
I.ResearchQuestion/AimStateaquestionwhichsummarizestheobjectiveofyourresearch.Thissectioncanbevagueasitsgoalissimplytoidentifytheoverallproblem,butmakesureitclearlyidentifiesyourindependentvariableanddependentvariable!
a. Example:“Thisinvestigationistofindouthow(IV)affectsthe(DV).”b. Example:“Whatistheeffectof(IV)onthe(DV)?”c. Example:“Whatistheeffectofachangingglucoseconcentrationoncellrespirationinyeast?”d. Example:“Howdodifferentsolventscompareintheirabilitytodissolveorganicplantpigments?”
II.BackgroundInformationHereiswhereyouwanttodiscussandsummarizeyourexperimentbeforedoingitaswellasprovideanyrelevantinformationpertainingtoyourstudy.Thispagewillprovidemuchevidenceforyourdepthinpersonalengagementandexplorationintoyourtopic(twoaspectsofyourgrade).Thisshouldideallybedetailed,butconcise.Itdoesn’tnecessarilyhavetobeoverapageunlessyouhavealotofbackgroundtoreport.Themorethebetter,aslongasitisrelevanttoyourtopicandresearchquestion.Donotjustcarryonaboutirrelevantstufftomakeitlookfull,otherwise,itdoesn’tshowyourabilitytostayontopictosolveaproblem.Somethingstheexperimentershouldconsiderbutnotlimitthemselvestowhenwritinguptheirbackgroundinfo:
• Thenameofthespeciesbeingused,includingitsbinomial/scientificname.• Backgroundinformationonthespeciesbeingexperimented.

8
• Considerationoftheethicsofyourexperiment(tolerancesofthespecies,useofconsentforms,etc.)
• Priorresearchintothepossibleoutcomesoftheexperimentpossiblyderivedfromscholarlystudiesinjournals.
• Ifameasurementofadependentvariableisindirectorunclear,explaintheconnection.o (MeasuringdissolvedO2inwaterasaresultoflightintensityonplants.)
Makesureallexternalinformationwhichisnotyourownideasorknowledgeiscitedproperlyandrecordedinaworkscitedpage.Informationthatisnotyourownwhichisn’tcitedisconsideredplagiarism,perIBpolicy.
III.Hypothesis&ExplanationAhypothesisissimplyaphrasefortheexpectedoutcomeofanexperiment.Whatdoyouthinkwillhappen?Makesureyourhypothesisisclearindescribingatrendexpected.Forexample,agood,specifichypothesiswhichclearlyidentifiestheIVandDVshouldbephrased,“Increasingtheamountofglucoseinthewatershouldcauseanincreaseindissolvedoxygeninthewater”.Also,ifyoubelievetheretobealimittogrowth,thenstatethataswellinyourhypothesis.Anexample:“IncreasinglightintensityonAceracaewillcauseittoincreaseinratesofphotosynthesis,butonlytoacertainpointtowhichitwouldbeexpectedtoremainrelativelystable.”AhypothesisshouldNOTbephrased,“puttingsugarinthewaterwillcausetheretobeoxygen.”Noticethisdoesnotspecifywhatkindofsugarisbeingused,doesnotspecifythatwearemeasuringdissolvedoxygeninwateranddoesnotidentifythatincreasingoneshouldincrease/decreasetheamountoftheother.Remember,ahypothesisisjustaguesstoseeifyourideashavepredictivepower.Thatisthestrengththatsciencegivesus.Therefore,yourhypothesismusthaveabasis;thereisareasonforthinkingthatacertainIVwillhaveanimpactontheDV.Yourhypothesisshouldhaveawrittenexplanationastowhyyoubelieveittobetrue,anditshouldhavesomeconnectiontoyourbackgroundknowledgeonthetopic.
• Donotjustmakeupsomethingbizarreinwhichyouhavenobasisforthinkingthereisalink!(ex.puttingnailpolishontoescauseshemorrhoids.)
Agoodexampleofahypothesis&explanation:“IncreasingtheamountoftheglucoseshouldcauseandincreaseintheamountofCO2produced,butonlytoacertainpointatwhichtherateshouldleveloff.ThisisbecauseglucoseisusedbyyeasttomakeATPthroughcellularrespiration.Themoreglucosethatisavailable,thefastertherateofcellrespiration,andthemoreC02thatshouldbemeasurablyproduced.C02isaproductofcellrespirationinyeast,sothemoreC02thefastertherateofcellrespiration.However,sincetherateofcellrespirationisproportionaltotheamountoffactorssuchasenzymeandmitochondrialavailability,whichhasalimit,onewouldexpecttherateofCO2productiontoleveloff.”
IV.Variables(FORCLASSICEXPERIMENTSONLY!Seenotesbelow)

9
Identifythecorrectindependentanddependentvariable,aswellasvariablesthatneedtobecontrolled.Fortheindependentvariable,youneedtoincludeunitsandthesize/amountofincrementsbeingutilized.Forexample:IndependentVariable(IV):Thevariablethatyouareaddingtothetestsubjects.
• Glucose(0.0g,2.0g,4.0g,6.0g)
DependentVariable(DV):ThevariablethatchangesasaresultoftheIV–basically,it’swhatyouaremeasuring.
• CO2concentration(ppm)• Rateofmovement(cm/min)
NOTE:IdentifyinganIVandDVisonlypossibleifyouaredoingatypicalexperiment(whereyouareaddingavariableandmeasuringtheoutcome,suchasaddingsalttomeasureplantheight).Ifyouaredoingabasicinvestigation,especiallyifyouareinvestigatingrelationshipsbetweencollecteddata(usuallyacorrelationstudy),youwillhavenovariables!Inthiscase,thissectionshouldbetitledsomethinglike“Measurements”insteadof“Variables.”Identifyallthingsbeingmeasured.Anexampleisifastudywasconductedcomparingleafsizetodifferentaspectsofatreesize,suchascircumferenceandcanopyspread;therewouldbenoIVorDVpossibleasitisnotanexperimentyouareconducting.Instead,youwouldneedtoidentifyhereallthingsbeingmeasuredandinwhatunitsmeasured.Example:LeafWidth(cm),LeafLength(cm),TrunkCircumference(cm),CanopySpread(m).
V.ControlsYoualsomustidentifycontrolledvariables(thingsthatmustbestablebetweenexperimentalgroups).Then,youmustexplicitlyindicatehoweachcontrolledvariableisgoingtobecontrolled.Ifyoucan’tactivelycontrolavariablethenyourmethod/procedureshouldincludeameansofmonitoringit.Youmustidentifyasmanycontrolledvariablesasarenecessarytoeliminateasmanysourcesofsystematicerrorsaspossible!Examples:ControlledVariables:
• Temperatureoftheair–Plantswillbeheldatroomtemperature,whichissetto22˚C.• Salinityofthewater–Allfishwillbegivenwaterfromthesamefaucet,whichwillhavethesame
salinityconcentrationasitishomogenous.• Probecalibration–Thesameprobebetweenmeasurementstoensurethatthemeasurementsareall
consistent.Thisisjustashortlist.Controlsareoneofthemostimportantaspectsofyourlabreport.Agoodscientistisawareofthingsthatmayaffecthis/herresultsandmakeseveryefforttocontrolthem.Ifyoufindsomethingsareimpossibletofullycontrol,thenyouareingoodcompany.NotallthingsarePRACTICAL.Yourtaskistoidentifyallthingsthatarepracticaltocontrolandtodevelopamethodtocontrolthem.Ifsomethingisnotpracticalduetobudgetconstraints,etc.,thenyoustillneedtoatleastbeawareofthemanddiscusstheminyourevaluationsectionattheendofyourlabreport.
AnexampleisthatofDr.ClarePatterson,whofirstcalculatedtheageoftheearthinthe1950’s.Todothis,heneededtoknowtheratioofuranium-to-leadinmeteoriterocks.However,hefoundhismeasurementsofleadtobewildlyinconsistent,duetoleadcontaminationintheatmospherebyleadedgasolineusedbycarsofthetime.Hismeasurementsweregivinghimestimateddatesnobetterthan10±10billionyears.It

10
tookhimtwoyearsandmillionsofdollarstodeveloptheworld’sfirstultra-cleanroom.Onlythen,withspace-agesuitsandfilteredaircouldhemeasurethetrueamountofleadinrocks.Hefinallywasabletogetconsistentnumbersinalltherockshemeasured,givingearthanageof4.5billionyearsoldwithaprecisionof±0.5billionyears.However,withoutmillionsofdollarsandfacilitiesforhimtouse,hewould’veneverbeenabletoimprovehismeasurements.
Dowhatyoucanwithinyourabilities.Ifyoucan’tgetthebestprecisionduetopracticality,atleastidentifythingsinhibitingyouanddeclarewhatitwouldtakeforfuturescientistswithmorefunding(maybesomeonewilllikeyourworkenoughandgiveyoualargegrantsoyoucancontinue;thatiswhatPattersondid).
VI.MaterialsYouaretoincludeaNUMBERED,specificlistofmaterialsneededforyourexperiment.Thisshowstheessenceofawell-planneddesign.Ifyouneedsomethingextrathatyoudidn’tputonyourlistyouwon’treceivefullcredit.Makesurewhenwritingupyourequipmentlistthatyouinclude:
•Theamountofanythingrequiringmorethanone(ex.“Scissors,x2”or“Gluesick,x5”)•Theconcentrationand/oramountofchemicals(ex.“hydrochloricacid,2.0M”or“magnesium,0.50g”).•Theamountofeachsolutionneededtotal(ex.“Coca-Cola®,200mL”)
Forallmeasuringequipment/probes,youmustincludetheprecision/uncertaintyofthedevice! Example:Electronicbalance(±0.01g);300mlBeaker(±2ml);Analoguethermometer(±0.5°C)
Trivialthingssuchassmallplasticcupscanjustbecalledsuchiftheircapacityisn’tasimportant.Itwon’tbenecessarytomeasuretheircapacityaslongasitisn’tvitaltotheprecisionofthelab.
VII.Procedure/MethodsThinkabouthowtomakeapeanutbutterandjellysandwich.Itissimple,butifyouwanttostandardizeandwantotherstomakeitalmostexactlythesame,itcouldbe1,000stepslong.Themoresteps,themorereplicableitwillbeandthemoreprecise.However,keepinmindmanythingsareredundantandsomestepscanbecombined.Donotincluderedundantstepsinyourmethodssuchas“collectandputonsafetyequipment,”or“cleanupbenchandreturnapparatustothetrolley.”Youwanttheshortestprocedurepossible,yethavingenoughdetailtocontrolenoughaspectsforreplicabilityandprecision.Example:
1. “Ina300mlbeaker,add0.5gMgto200mlof2MHCl.YoudoNOTneedtorecorduncertaintiesofmeasurements(±)requiredintheprocedure,justthevalueofthemeasurement(ex.20ml).However,youwillneedtokeepinmindthedecimalpointsofyourvalues,asthoseindicateprecisionofthemeasurement(ex.20.00ml).Ifyoueverrequiremeasurementstobedoneinyourprocedures,makesureproperdecimalpointsareused.WhendesigningamethodensurethatyouchangetheIVenoughtimestocollectenoughdataforareasonablelineofbestfit.Aminimumoffivedatapointsshouldbeusedasaguidelineforanygraphandevenmoreshouldbecollectediftimeandmaterialsallow.Doingmorethantheminimumcountstowardspersonalengagementpoints!Themethodshouldincludesufficientrepeatsoftrialstoensurethatrandomerrorsareatleastminimized.Icannottellyouwhattodo,butIsuggestnolessthan5trialsforasimpleexperiment,andnolessthan10samplesizesforeachsubjectinabasicinvestigationlab.

11
Remember,atleastfivetrialsareneededtodoastandarddeviation,buttenareneededtodoat-test.Designandplanalabaccordinglydependingonthedepthofaconclusionthatyouwant!Isitwisetoconsiderincludingadiagramofyourexperimentalset-up.Itisn’tnecessary,butwillaidinyourquesttodevelopamethodandinyouraspectofcommunication.However,includingasloppydiagramwillinhibityourworkandcausereductioninpoints.
Truly,IwishIhadadollarforeveryreportwhereI’veseen:“1.Setuptheequipmentasshownbelow:”
…onlytoseebelowabigblankspace,orasloppydiagram.Comparethesetwoset-ups:
__________III:DATACOLLECTION&PROCESSING_________I.DataTable(s)&CalculationsMakesureyourecordallofyourrawdatacollectedfromsubjects.Rawdataandprocesseddatacanbeinthesametable,butmakesureyouhavethemtitledappropriately.Qualitativedatashouldalsobeincludedinthisregion.Makesuretoincludeproperunitsofmeasurement,uncertaintiesofmeasurementsandproperuseofdecimalpoints/significantfigures.Videomanualsontablemaking,statisticsandgraphingonMicrosoftExcel®arefoundonmyclass’YouTubeChannel,McGEEmc²
https://www.youtube.com/channel/UC0Myr5ilGtyaemlZfpX1SuA
UseofUncertainties:Theuncertaintyforameasuringdevice(ex.±0.5g)determinestheprecisioninitsmeasuringcapability.Youcouldalwayslookattheapparatus’instructionsoronthedevice,asoftentheyhaveitprintedsomewhere.Ifnot,youcanstilldeterminetheuncertainty.Therearespecificrulestofollow: AnalogueInstruments:
1. Findtheincrementsofmeasurementusedforlowestresolution(ex.eachtinylineonaruleris1mm).
2. Generally,onananaloguedevice,youruncertaintyisHALFyourlowestresolution(ex.0.5mm).

12
3. Anexception(usedoften):IftheresolutionlinesarefarenoughapartthatyoucanACCURATELYestimatebetweenthelines,thenyoucantodeterminetheuncertainty.Yousimplychoosethelowestresolutionthatyouthinkmostpeoplewouldalsoagreewith.Inthiscase,don’thalftheestimateduncertaintyvalueaswedidabove.
a. Ex.Thisruleristhesameasabove,butwithincrementsofresolutionof0.5cm,farlessprecisethanbefore.Thenewuncertaintywouldnormallybe±0.25cmasitishalfthelowestresolution.However,becauseourresolutionissolowthatwecaneasilyestimatebetweenthelinesdownto0.1cm(1mm),wecanthereforeusethatastheresolution;wedonotusehalfofitasbefore.
DigitalInstruments:1. Examinethedeviceitselforthemanualforaprinteduncertainty.2. Ifyoucan’tfindanythingprinted,thenexaminehowthenumbersmovewhenthedeviceis
used.Assumethelowestvaluesaretheuncertainty.a. (Ex.Adigitalthermometermovesinincrementsof1°C.Therefore,assumeuncertaintyis±1°C.)
Ultimately,thescientistgetsthefinalsayastotheuncertaintyofthemeasuringdevice.Thinkaboutit!Ifyouhaveastopwatch,regardlessoftheprecision,youmaynotbeabletoaccuratelyrelyonyourreactionforapersoncrossingafinishinglineasitoccurstoofast.Astopwatchwithaprecisionof±0.000001sdoesyounogoodwithouthigh-speedcameras.Incertainsituationswhenthepublisheduncertaintyisuntrustworthy,useyourbestjudgmentasascientist.Determineanuncertaintytowhichyouaremostcertain,evenifitisalargeuncertainty.
• OftenwhenIdobreath-holdinglabs,Ihavestudentsrecordtouncertaintiesof±3,asitisimpossibletodeterminetheexactmomentastudentinhaledandbeganholdingtheirbreath.
• Anotherexampleiswhenstudentswatchcoloreddyediffusinginabeakerofwater.Itmaybehardtoeasilyvisualizethecoloreddyereachingequilibrium,soifstudentstimeittheymaydeterminetheyarecomfortablewithloweruncertaintyof±30s.
• MyclassCO2probeshaveanuncertaintyprintedonthepackageas±2ppm.However,theyseem
tofluctuatewildlyinvalueseveninastableclimatejar.Therefore,ItellstudentsthatIdon’ttrusttheprintednumberandtoestimateanuncertaintyof±50ppm,whichisbasedonobservedrandomfluctuations.It’snotexactlyprecise,butit’shonestscience.
Remember,asascientist,yougetthefinalsayastotheuncertainty.Exceptinrarecircumstances,allmeasurementstakenmusthaveuncertaintiesindicated!!!
Thelowestresolutionofthisrulerisinincrementsof0.1cm.Therefore,ouruncertainty,beinghalfofthatis±0.05mm.
Ifthisthermometerskippedbyunitsof2°C,thenwe’dassumetheuncertaintyis±2°C.Inmostcases,digitalinstrumentsare±1.
Thelowestresolutionofthisrulerispoor;wecanhoweverestimatetheresolutionaccuratelyto±0.1cm.

13
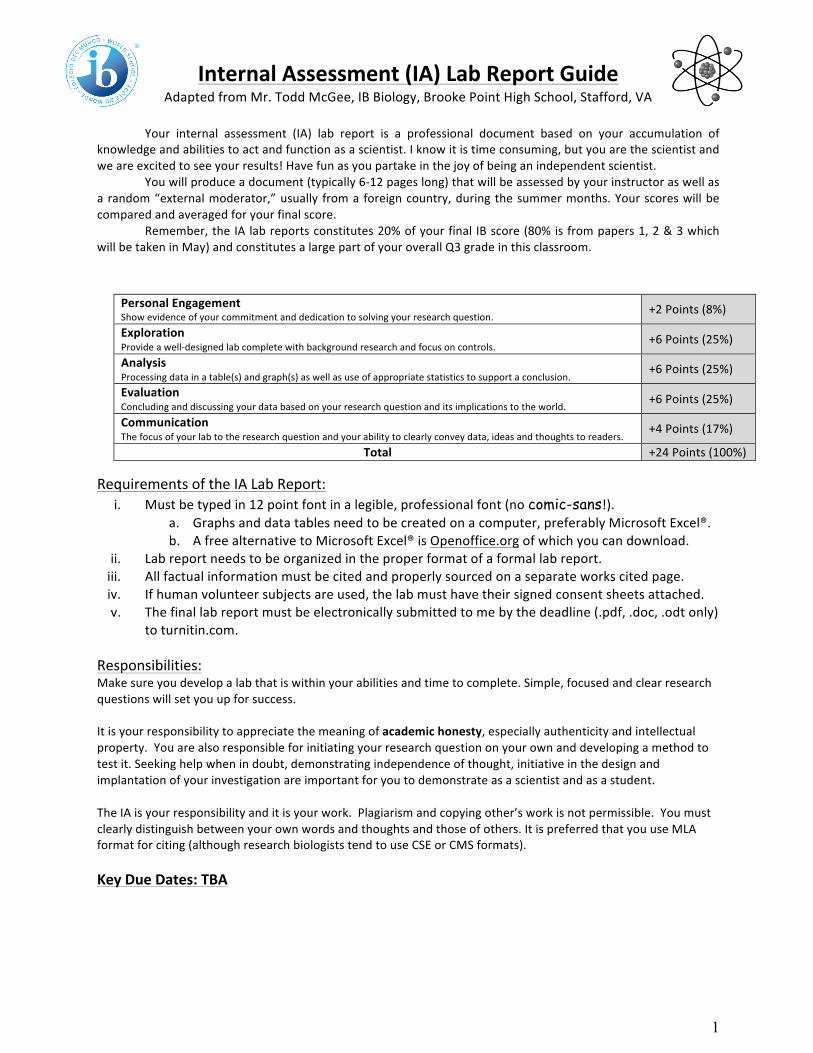
DataTablePresentation:IwillnotgetintotoomuchlengthhereasIextensivelycoverthisonmyYouTubepage(seepage7).Whenpreparingdatatables,considerthefollowing:
•Theunitsanduncertaintymustbeincluded.TheyshouldbecitedONCEinbracketsinthecolumnheadings.Donotputtheunitsaftereachpieceofdata!•Alldatainasetmusthavethesamenumberofdecimalplaces.•Tablesandcolumnsneedbordersaspartofthepresentation.•Thedatainacolumnshouldbecenteredinthecolumn.•Tableforonesetofmeasurementsneedstofitonasinglepage–donotspreadatableoveronepage.•TheentiretableneedsasuitableandDESCRIPTIVEheadingwithvariablesidentified
• (“Table1,”“DataCollection”or“MyResults”areNOTsuitableheadings).Ifthereissomethingpeculiaraboutapieceofdatathatyouwishtodrawthereader’sattentionto,putanitalicizedsuperscriptedletterafterthedataandmakeanoteunderthetable.
Sampleofdifferentwaystopresentyourdatainatable:
14
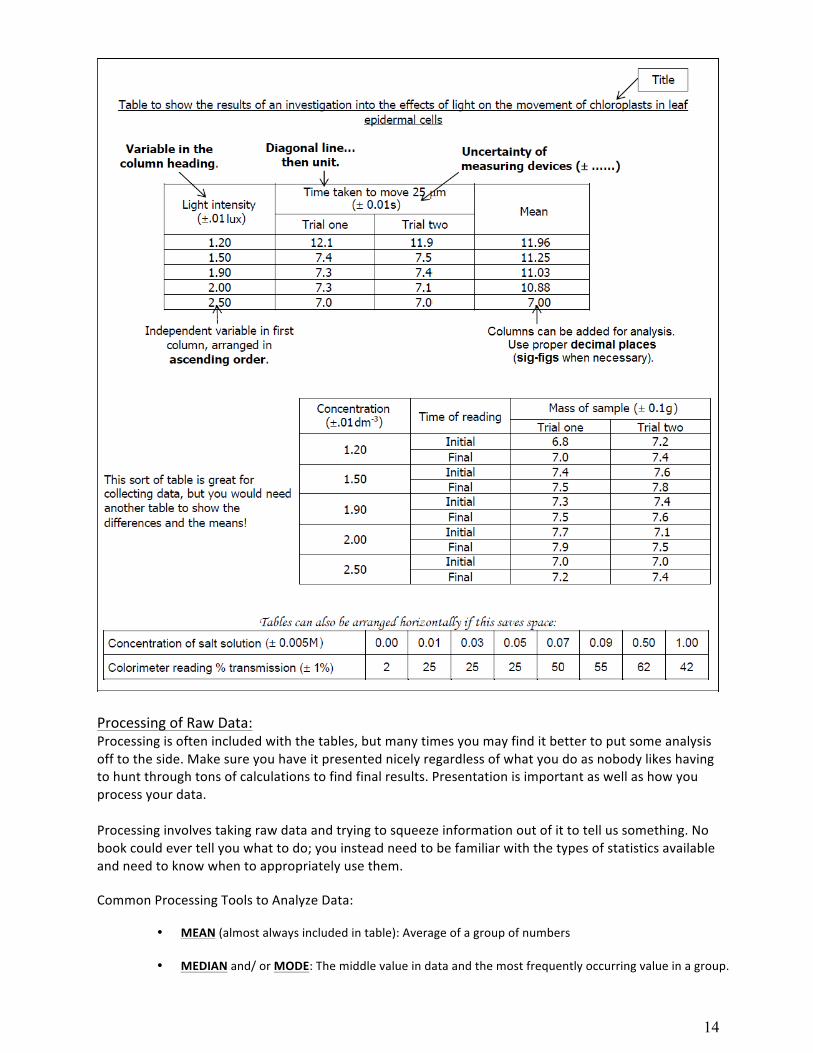
ProcessingofRawData:Processingisoftenincludedwiththetables,butmanytimesyoumayfinditbettertoputsomeanalysisofftotheside.Makesureyouhaveitpresentednicelyregardlessofwhatyoudoasnobodylikeshavingtohuntthroughtonsofcalculationstofindfinalresults.Presentationisimportantaswellashowyouprocessyourdata.Processinginvolvestakingrawdataandtryingtosqueezeinformationoutofittotellussomething.Nobookcouldevertellyouwhattodo;youinsteadneedtobefamiliarwiththetypesofstatisticsavailableandneedtoknowwhentoappropriatelyusethem.CommonProcessingToolstoAnalyzeData:
• MEAN(almostalwaysincludedintable):Averageofagroupofnumbers
• MEDIANand/orMODE:Themiddlevalueindataandthemostfrequentlyoccurringvalueinagroup.
15
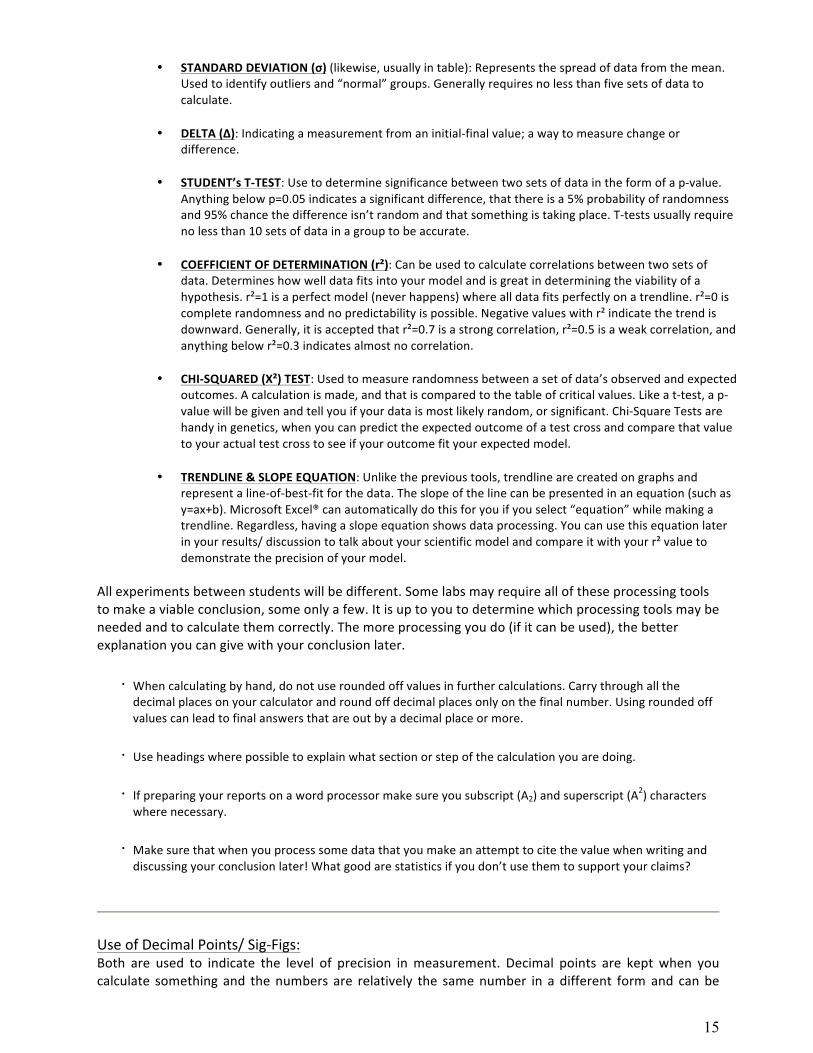
• STANDARDDEVIATION(σ)(likewise,usuallyintable):Representsthespreadofdatafromthemean.Usedtoidentifyoutliersand“normal”groups.Generallyrequiresnolessthanfivesetsofdatatocalculate.
• DELTA(Δ):Indicatingameasurementfromaninitial-finalvalue;awaytomeasurechangeor
difference.
• STUDENT’sT-TEST:Usetodeterminesignificancebetweentwosetsofdataintheformofap-value.Anythingbelowp=0.05indicatesasignificantdifference,thatthereisa5%probabilityofrandomnessand95%chancethedifferenceisn’trandomandthatsomethingistakingplace.T-testsusuallyrequirenolessthan10setsofdatainagrouptobeaccurate.
• COEFFICIENTOFDETERMINATION(r²):Canbeusedtocalculatecorrelationsbetweentwosetsofdata.Determineshowwelldatafitsintoyourmodelandisgreatindeterminingtheviabilityofahypothesis.r²=1isaperfectmodel(neverhappens)wherealldatafitsperfectlyonatrendline.r²=0iscompleterandomnessandnopredictabilityispossible.Negativevalueswithr²indicatethetrendisdownward.Generally,itisacceptedthatr²=0.7isastrongcorrelation,r²=0.5isaweakcorrelation,andanythingbelowr²=0.3indicatesalmostnocorrelation.
• CHI-SQUARED(X²)TEST:Usedtomeasurerandomnessbetweenasetofdata’sobservedandexpectedoutcomes.Acalculationismade,andthatiscomparedtothetableofcriticalvalues.Likeat-test,ap-valuewillbegivenandtellyouifyourdataismostlikelyrandom,orsignificant.Chi-SquareTestsarehandyingenetics,whenyoucanpredicttheexpectedoutcomeofatestcrossandcomparethatvaluetoyouractualtestcrosstoseeifyouroutcomefityourexpectedmodel.
• TRENDLINE&SLOPEEQUATION:Unliketheprevioustools,trendlinearecreatedongraphsandrepresentaline-of-best-fitforthedata.Theslopeofthelinecanbepresentedinanequation(suchasy=ax+b).MicrosoftExcel®canautomaticallydothisforyouifyouselect“equation”whilemakingatrendline.Regardless,havingaslopeequationshowsdataprocessing.Youcanusethisequationlaterinyourresults/discussiontotalkaboutyourscientificmodelandcompareitwithyourr²valuetodemonstratetheprecisionofyourmodel.
Allexperimentsbetweenstudentswillbedifferent.Somelabsmayrequirealloftheseprocessingtoolstomakeaviableconclusion,someonlyafew.Itisuptoyoutodeterminewhichprocessingtoolsmaybeneededandtocalculatethemcorrectly.Themoreprocessingyoudo(ifitcanbeused),thebetterexplanationyoucangivewithyourconclusionlater.
⋅ Whencalculatingbyhand,donotuseroundedoffvaluesinfurthercalculations.Carrythroughallthedecimalplacesonyourcalculatorandroundoffdecimalplacesonlyonthefinalnumber.Usingroundedoffvaluescanleadtofinalanswersthatareoutbyadecimalplaceormore.
⋅ Useheadingswherepossibletoexplainwhatsectionorstepofthecalculationyouaredoing.
⋅ Ifpreparingyourreportsonawordprocessormakesureyousubscript(A2)andsuperscript(A2)characters
wherenecessary.
⋅ Makesurethatwhenyouprocesssomedatathatyoumakeanattempttocitethevaluewhenwritinganddiscussingyourconclusionlater!Whatgoodarestatisticsifyoudon’tusethemtosupportyourclaims?
UseofDecimalPoints/Sig-Figs:Both are used to indicate the level of precision inmeasurement. Decimal points are kept when youcalculate something and thenumbers are relatively the samenumber in a different formand canbe

16
comparedtotherawdata,suchaswhenadding,subtracting,multiplyingordividing.Whencalculatingsomething,addonemoredecimalpointthantherawdatawiththeleastprecision.When the number completely converts and can’t be compared to raw data, such as when usingstandard deviation, t-testing, chi-square testing, etc., then it is necessary to use sig-figs. Keep thenumberofsig-figsthesameasthenumberofsigfigsintherawdatawiththelowestprecision.
II.GraphsGraphingisanimportantaspectincommunicationaswellasanalysis.Besuretomakeyourgraphpreciseenoughtociteexampledatainyourresultsanddiscussionsection.IBdoesnotrequiregraphstobemadeviacomputer,butdoesrequirethemtoexhibitprecisionanddetail.Thatbeingsaid,ifyouhanddrawthem,theymustbecleanandexact.Usearulerwherenecessary.Makesureyourpenciltipissharpenedandthedatapointsaresmall.Iwillnotexplainherehowtomakeagraph–seepage7formyYouTubechannellinkwhereIcoverthisextensively.Thedesignofyourgraphswillbedifferentdependingonthetypeoflabyoudo.Itisyourresponsibilitytounderstanddifferentgraphingoptionsandtowhichtypeisappropriateforwhichsituation.
•BargraphsONLYforsimple,categoricaldata(boysvsgirls;age10-15,age15-20,etc.)•Scatterplotsforshowingatrendinthedata,usuallyfordatawheretheXaxisisincreasinginvalue.•Piechartsaregoodasacomplimentary,notprimarygraph.Goodforshowingsimplecomparisons.
Ensurethefollowingareinyourgraph(ifnecessary,assomegraphsmightnotrequireall):
•Graphneedsdescriptivetitlewhichidentifieswhatisbeingmeasured.•BoththeXandY-axisneedtobelabeled(descriptivetitleorheading).•BoththeXandY-axisincludeunitsofmeasurementsanduncertaintieswherenecessary.•BoththeXandY-axisarescaledappropriatelysothedatafillsthegraphwell. -Ifyourdatarangesfrom600to800,don’tstartyourgraphat0.
-Ifdataisspreadfrom0-1,000units,increasinglabeledincrementsby1wouldbeinappropriate;unitsof100ismuchbetter.-Consideralogarithmicscaleforoneaxisifthedataacceleratestooquickly(bacterialcolonysizeafter20daysinsugarbroth).
•Datapointsaresmallandpreciselylocated.•Whennecessary,includeerrorbarsindicatingthestandarddeviationforeachdatapoint.•Atrendline(line-of-best-fit)isincludedtoshowthetrendindata.(NEVER“connectthedots!”) -Determineifalinearorcurved/polynomialtrendlineisnecessary.•Calculatetheslopeofthetrendlinetogetanequation.MicrosoftExcel®doesthisautomaticallyJ•Calculatether²-valueofthedatatothetrendline.Again,MicrosoftExcel®doesthisautomaticallyJ•Makesureagraphissizedandfitsononepage!(You’dbesurprisedhowmuchI’vedealtwiththis.)Examplesofdecentgraphsforavarietyofscenarios:
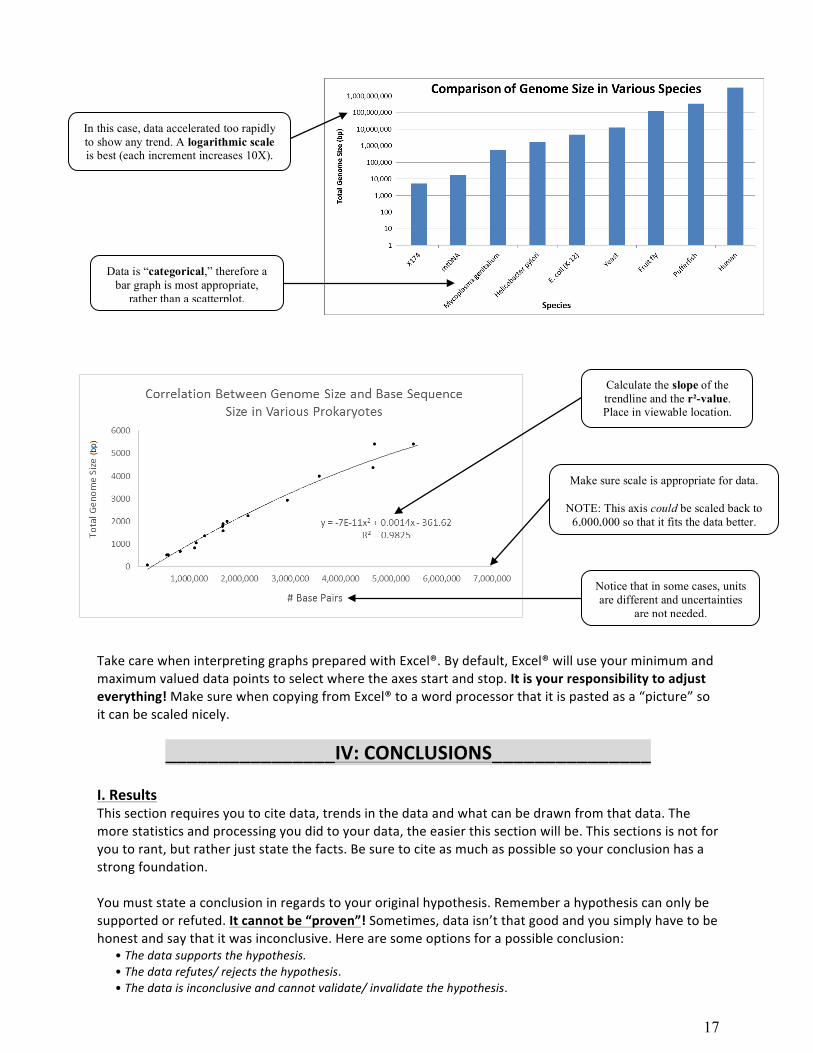
17
TakecarewheninterpretinggraphspreparedwithExcel®.Bydefault,Excel®willuseyourminimumandmaximumvalueddatapointstoselectwheretheaxesstartandstop.Itisyourresponsibilitytoadjusteverything!MakesurewhencopyingfromExcel®toawordprocessorthatitispastedasa“picture”soitcanbescalednicely.
________________IV:CONCLUSIONS_______________
I.ResultsThissectionrequiresyoutocitedata,trendsinthedataandwhatcanbedrawnfromthatdata.Themorestatisticsandprocessingyoudidtoyourdata,theeasierthissectionwillbe.Thissectionsisnotforyoutorant,butratherjuststatethefacts.Besuretociteasmuchaspossiblesoyourconclusionhasastrongfoundation.Youmuststateaconclusioninregardstoyouroriginalhypothesis.Rememberahypothesiscanonlybesupportedorrefuted.Itcannotbe“proven”!Sometimes,dataisn’tthatgoodandyousimplyhavetobehonestandsaythatitwasinconclusive.Herearesomeoptionsforapossibleconclusion:
•Thedatasupportsthehypothesis.•Thedatarefutes/rejectsthehypothesis.•Thedataisinconclusiveandcannotvalidate/invalidatethehypothesis.
Notice that in some cases, units are different and uncertainties
are not needed.
Calculate the slope of the trendline and the r²-value. Place in viewable location.
In this case, data accelerated too rapidly to show any trend. A logarithmic scale is best (each increment increases 10X).
Data is “categorical,” therefore a bar graph is most appropriate,
rather than a scatterplot.
Make sure scale is appropriate for data.
NOTE: This axis could be scaled back to 6,000,000 so that it fits the data better.

18
Donotsqueezeinformationfromthedatatomakeitsaysomethingitdoesn’t.
II.DiscussionHereiswhereyouwillanalyzeyourexperimentalresultsanddiscussandinterprettheimplicationsofyourresults.Thisisalmostalwayslongerthanyourresultssectionabove.Thisisalsowhereyougettospeakyourmindaboutanything.Possiblethingstoconsider:
•Howdoesyourdatacomparetoexpectedresultsandexpectations?•Howdoesyourdatacomparetowhatbackgroundinformationyouinitiallyresearched?Besuretocite.•Thingsthatwerelearnedinthecourseofthisinvestigationthatwereunexpected.•Whataretheimplicationsofyourdatatotheworld?•Suggestafollow-upinvestigationthatcouldbeconductedbasedonyourlab.
Thissectionisreallyawritingpieceandshouldbeatleastapagelong.Wereallywanttoseeyouunderstandtheimpactofyourresearchinyourunderstandingofthetopicandhowitaffectstheworld.
III.Evaluation&ImprovementsSeepage5ofthisguideforfurtherguidanceonwritingthis.Remember,itisimpossibletogetridofallerrors,systematicorrandom,inanexperiment.Theyaresimplyapartofallscience.However,weasscientistscanalwaysfindwaystominimizethem.Wecanusemorepreciseinstrumentsandmonitorthatbymeasurementsofuncertainties,andwealsocanminimizethembyidentifyingandmaintainingbettercontrolsbetweenthingsbeingmeasured.Yourtaskhereistowriteaparagraph(s)evaluatingtheprecisionofyourexperiment.Whatsourcesoferrorwereencounteredthatsimplywerenotpracticaltocontrol,butcould’vebeenwithalargerbudget,etc.?Identifyeachsourceoferrorandevaluateitspossibleimpactonyourexperiment.Afteridentifyingasourceoferror,youmustidentifyawaytoimprovethaterror,evenifitisnotwithinyourabilities.Considerthefollowing:•Arethereflawsintheproceduresusedwhichcouldaffecttheresult?•Wereimportantvariablesnotcontrolled?•Arethemeasurementsandobservationsreliable?•Istheaccuracyofaresultunknownbecauseofalackofreplication?•Whatassumptionsarebeingmade?
SomeofthebiggestissuesIfindwhengradingIA’sarestudentswhosimplywrite“domoretrials,”or“takemoretimetocollectdata,”andeven“bemorecarefulwhenmeasuring.”Thesearenotsourcesoferrorasmuchastheyareissueswithyourdesignandplanning.Theywillnotcountforcreditastheydonotshowmethatyouhaveafundamentalunderstandingofexperimentalerrorandcontrollingit.Ifithelps,youcanusethefollowingtabletohelpyouorganizewritingthissection:
1. Weaknesses/sourcesoferror.2. Impactoftheerrorontheexperiment.3. Suggestionsforimprovementstoreduceorgetridoftheimpactoftheerror.

19
________________V:Appendix_______________References/WorksCitedPageIfyouusesomeoneelse'sideasinyourreport,youneedtoacknowledgethem.Thisincludesuseofin-textreferencesandaworkscitiedpage.Allcitedinformationneedstobealphabetizedwhenlistedinworkscitedpage.Websites,suchaseasybib.com(therearemanyothers)makethisveryeasytodo.
JIn-TextReferencingYourExperiments:Anyinformationyouuseinyouressaytosupportyourideasmustbereferencedwithinyouractualwriting.Todothis,simplyinsertappropriateinformation(usuallytheauthor-pagenumberoryear)inparenthesesafterthewordsorideastakenfromanothersource.Placethemwhereapausewouldnaturallyoccurtoavoiddisruptingtheflowofyourwriting(usuallyattheendofasentence).Thisthenlinkstothefulldetailsofthesesourcesfoundintheworkscited/bibliographysectionattheendofyouressay.Therearetwomethodsonhowtodothis:
1.USINGPARENTHESES:Youneedtoprovidetheauthor’sname(ifknown)andyearinparenthesisattheendofyoursentenceifyoudonotidentifytheauthorinyourtext:e.g.ItisrecommendedthattheU.S.governmentdevelopanewforeignpolicytohelpThirdWorldCountriesovercomepovertyandhunger(Spitzer2002)Ifyoudonotknowtheauthor,usethetitle(shortenedifnecessary):e.g.ItisrecommendedthattheU.S.governmentdevelopanewforeignpolicytohelpThirdWorldCountriesovercomepovertyandhunger(‘NoNeedforHunger’2002)
2.NoUseofParentheses:Youdonotneedaparentheticalreferenceifyouidentifytheauthorinyourtext.(Seethefirstentrybelow.)
WITHAUTHORINTEXT(Thisisthepreferredwayofcitingacompletework.)e.g.In‘NoNeedforHunger’,RobertSpitzerrecommendsthattheU.S.governmentdevelopanewforeignpolicytohelpThirdWorldcountriesovercomepovertyandhunger.WITHOUTAUTHORINTEXTe.g.‘NoNeedforHunger’recommendsthattheU.S.governmentdevelopanewforeignpolicytohelpThirdWorldcountriesovercomepovertyandhunger(Spitzer).
InformedConsentForm*Thisisonlynecessaryifusinghumantestsubjectsforcollectingyourdata.Thiscountstowardstheaspectofexplorationandshowsthatyouareawareandunderstandtheimplicationsofethicalissuesinconductinganexperiment.Youmusthaveeachhumansubjectcompleteaconsentform.However,asampleconsentformmustbecompletedandattachedintheappendixofyourcompletedIAlabreport.Thetemplateisattachedonthenextpage.Mywebsitehasa.docx(Word®)filewiththistemplatethatcanbeedited.Completeitandattachtotheappendixofyourlabreport.

20
INFORMEDCONSENTFORMFORPARTICIPATIONINASCIENTIFICINVESTIGATION
IBBiologyInternalAssessment,___(yourname)____ MeridianWorldSchool
Youhavebeenaskedtotakepartinaresearchprojectdescribedbelow.Theresearcherwillexplaintheprojecttoyouindetail.Youshouldfeelfreetoaskquestions.*Descriptionoftheproject:____________________________________________________________________________________________________________________________________________________________*Procedures:________________________________________________________________________________________________________________________________________________________________________________________________________________________________________________________________________________________________________________________*Risksordiscomfort:____________________________________________________________________________________________________________________________________________________________*Benefitsofthisstudy:______________________________________________________________________________
____________________________________________________________________________________________________________________________________________________________Confidentiality:Yourpartinthisstudyisconfidentialandanonymous.Innowaywillthenameofthesubjectberecordedorbeattachedtoanydata.Alldatawillkeptonlyasevidencethatthestudywasconducted.Voluntaryparticipationandwithdrawal:Participationinresearchisvoluntary.Youhavetherighttorefusetobeinthisstudy.Ifyoudecidetobeinthestudyandchangeyourmind,youhavetherighttodropoutatanytime.Questions,RightsandComplaints:Ifyouhaveanyquestionsaboutthisresearchproject,pleasecontactDrChristinaBowers,IBBiologyteacherat(512)660-5ex.1783orbyemailatmcgeetd@staffordschools.net.ConsentoftheSubject:Ihavereadtheaboveandunderstandmyrightsinvolunteeringforthisexperiment;IherebyacknowledgethatIamawillingparticipantinthisanonymousstudyandamawareofthisimplication.________________________________________________________VolunteerName(printed) _________________________________________________________VolunteerName(signed) Date_________________________________________________________AcknowledgementofLeadScientist Date

21
AltKeysShortcuts:(ForWindows)AltKeySequence SymbolProduced Comments ExampleAlt+945 α Greekletter“alpha,”lower-cased α-GlucoseAlt+946 β Greekletter“beta,”lower-cased β-GlucoseAlt+0174 ® Registeredtrademarkforproductsorcompanies Wal-Mart®Alt+0175 ¯ Superscriptednegative mm¯1Alt+0176 ° Degreesymbol 20°CAlt+0177 ± Uncertainty/precision ±0.5gAlt+0178 ² Superscripted“2”:squared cm²Alt+0179 ³ Superscripted“3”:Cubed cm³Alt+0181 µ Micronsymbol,GreekLetter“Mu” 5µ
Alt+0916 ΔDeltasymbolfor“change”.Greekletter“Delta”. Δg=initial-final
mass
_______________AssessmentRubric:_______________
ThisistheofficialrubricthatwillbeusedtogradeyourIAReport
PersonalEngagementShowevidenceofyourcommitmentanddedicationtosolvingyourresearchquestion. +2Points(8%)
ExplorationProvideawell-designedlabcompletewithbackgroundresearchandfocusoncontrols. +6Points(25%)
AnalysisProcessingdatainatable(s)andgraph(s)aswellasuseofappropriatestatisticstosupportaconclusion. +6Points(25%)
EvaluationConcludinganddiscussingyourdatabasedonyourresearchquestionanditsimplicationstotheworld. +6Points(25%)
CommunicationThefocusofyourlabtotheresearchquestionandyourabilitytoclearlyconveydata,ideasandthoughtstoreaders. +4Points(17%)
Total +24Points(100%)
PERSONALENGAGEMENT(+2pts)
-Referstotheevidencethatastudenttookinitiativetosolvetheirproblemandwascommittedtotheirproject.
Mark 0 1 2DESCRIPTOR Thestudent’sreportdoesnotreacha
standarddescribedbythedescriptors. Theevidenceofpersonalengagementwiththeexplorationislimitedwithlittleindependentthinking,initiativeorcreativity.Thejustificationgivenforchoosingtheresearchquestionand/orthetopicunderinvestigationdoesnotdemonstratepersonalsignificance,interestorcuriosity.Thereislittleevidenceofpersonalinputandinitiativeinthedesigning,implementationofpresentationoftheinvestigation.
Theevidenceofpersonalengagementwithexplorationisclearwithsignificantindependentthinking,initiativeorcreativity.Thejustificationgivenforchoosingtheresearchquestionand/orthetopicunderinvestigationdemonstratespersonalsignificance,interestorcuriosity.Thereisevidenceofpersonalinputandinitiativeinthedesigning,implementationorpresentationoftheinvestigation.
ACHIEVEMENTLEVEL:___________/2

22
EXPLORATION(+6pts) -Referstotheprimarydesign/setupofthelab,includingtopic,background,identificationofvariablesandmethodsforconductingthelab.
MARK 1 1-2 3-4 5-6DESCRIPTOR Thestudent’sreportdoesnot
reachastandarddescribedbythedescriptorsbelow.
Thetopicofinvestigationisidentifiedandaresearchquestionofsomerelevanceisstatedbutitisnotfocused.Thebackgroundinformationprovidedfrotheinvestigationissuperficialoroflimitedrelevanceanddoesnotaidtheunderstandingofthecontextoftheinvestigation.Themethodologyoftheinvestigationisonlyappropriatetoaddresstheresearchquestiontoaverylimitedextentsinceittakesintoconsiderationfewofthesignificantfactorsthatmayinfluencetherelevance,reliabilityandsufficiencyofthecollecteddata.Thereportshowsevidenceoflimitedawarenessofthesignificantsafety,ethicalorenvironmentalissuesthatarerelevanttothemethodologyoftheinvestigation.
Thetopicoftheinvestigationisidentifiedandrelevantbutnofullyfocusedresearchquestionisdescribed.Thebackgroundinformationprovidedfortheinvestigationismainlyappropriateandrelevantandaidstheunderstandingofthecontextoftheinvestigation.Themethodologyoftheinvestigationismainlyappropriatetoaddresstheresearchquestionbuthaslimitationssinceittakesintoconsiderationonlysomeofthesignificantfactorsthatmayinfluencetherelevance,reliabilityandsufficiencyofthecollecteddata.Thereportshowsevidenceofsomeawarenessofthesignificantsafety,ethicalorenvironmentalissuesthatarerelevanttothemethodologyoftheinvestigation.
Thetopicoftheinvestigationisidentifiedandarelevantandfullyfocusedresearchquestionisclearlydescribed.Thebackgroundinformationprovidedfortheinvestigationisentirelyappropriateandrelevantandenhancestheunderstandingofthecontextoftheinvestigation.Themethodologyoftheinvestigationishighlyappropriatetoaddresstheresearchquestionbecauseittakesintoconsiderationall,ornearlyall,orthesignificantfactorsthatmayinfluencetherelevance,reliabilityandsufficiencyofthecollecteddata.Thereportshowsevidenceoffullawarenessofthesignificantsafety,ethicalorenvironmentalissuesthatarerelevanttothemethodologyoftheinvestigation.
ACHIEVEMENTLEVEL:___________/6
ANALYSIS(+6pts) -Referstoobtainingappropriatedataandprocessingitinsuchawaythatasufficientconclusioncanbedrawn.
MARK 0 1-2 3-4 5-6DESCRIPTOR Thestudent’sreportdoesnot
reachastandarddescribedbythedescriptorsbelow.
Thereportincludesinsufficientrelevantrawdatatosupportavalidconclusiontotheresearchquestion.Somebasicdataprocessingiscarriedoutbutiseithertooinaccurateortooinsufficienttoleadtoavalidconclusion.Thereportshowsevidenceoflittleconsiderationoftheimpactofmeasurementuncertaintyontheanalysis.Theprocesseddataisincorrectlyorinsufficientlyinterpretedsothattheconclusionisinvalidorveryincomplete.
Thereportincludesrelevantbutincompletequantitativeandqualitativerawdatathatcouldsupportasimpleorpartiallyvalidconclusiontotheresearchquestion.Appropriateandsufficientdataprocessingiscarriedoutthatcouldleadtoabroadlyvalidconclusionbutthereissignificantinaccuraciesandinconsistenciesintheprocessing.Thereportshowsevidenceofsomeconsiderationoftheimpactofmeasurementuncertaintyontheanalysis.Theprocesseddataisinterpretedsothatabroadlyvalidbutincompleteorlimitedconclusiontotheresearchquestioncanbededuced.
Thereportincludessufficientrelevantquantitativeandqualitativerawdatathatcouldsupportadetailedandvalidconclusiontotheresearchquestion.Appropriateandsufficientdataprocessingiscarriedoutwiththeaccuracyrequiredtoenableaconclusiontotheresearchquestiontobedrawnthatisfullyconsistentwiththeexperimentaldata.Thereportshowsevidenceoffullandappropriateconsiderationoftheimpactofmeasurementuncertaintyontheanalysis.Theprocesseddataiscorrectlyinterpretedsothatacompletelyvalidanddetailedconclusiontotheresearchquestioncanbededuced.
ACHIEVEMENTLEVEL:___________/6
23
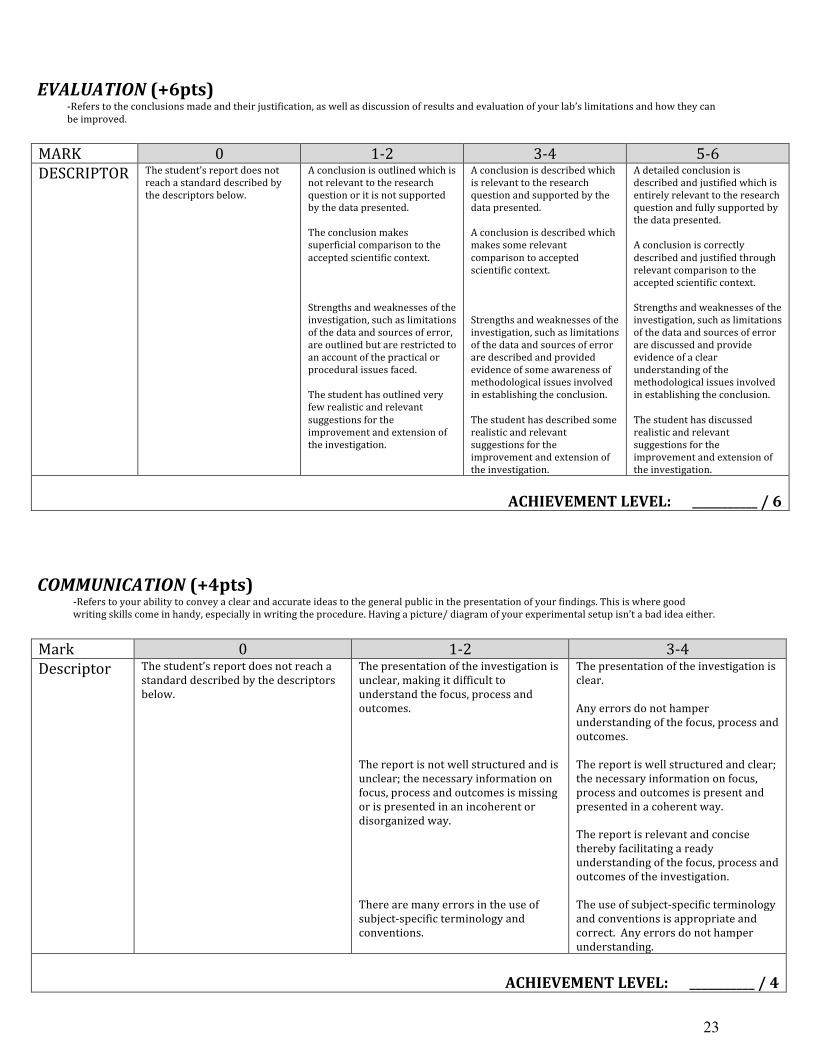
EVALUATION(+6pts)
-Referstotheconclusionsmadeandtheirjustification,aswellasdiscussionofresultsandevaluationofyourlab’slimitationsandhowtheycanbeimproved.
MARK 0 1-2 3-4 5-6DESCRIPTOR Thestudent’sreportdoesnot
reachastandarddescribedbythedescriptorsbelow.
Aconclusionisoutlinedwhichisnotrelevanttotheresearchquestionoritisnotsupportedbythedatapresented.Theconclusionmakessuperficialcomparisontotheacceptedscientificcontext.Strengthsandweaknessesoftheinvestigation,suchaslimitationsofthedataandsourcesoferror,areoutlinedbutarerestrictedtoanaccountofthepracticalorproceduralissuesfaced.Thestudenthasoutlinedveryfewrealisticandrelevantsuggestionsfortheimprovementandextensionoftheinvestigation.
Aconclusionisdescribedwhichisrelevanttotheresearchquestionandsupportedbythedatapresented.Aconclusionisdescribedwhichmakessomerelevantcomparisontoacceptedscientificcontext.Strengthsandweaknessesoftheinvestigation,suchaslimitationsofthedataandsourcesoferroraredescribedandprovidedevidenceofsomeawarenessofmethodologicalissuesinvolvedinestablishingtheconclusion.Thestudenthasdescribedsomerealisticandrelevantsuggestionsfortheimprovementandextensionoftheinvestigation.
Adetailedconclusionisdescribedandjustifiedwhichisentirelyrelevanttotheresearchquestionandfullysupportedbythedatapresented.Aconclusioniscorrectlydescribedandjustifiedthroughrelevantcomparisontotheacceptedscientificcontext.Strengthsandweaknessesoftheinvestigation,suchaslimitationsofthedataandsourcesoferrorarediscussedandprovideevidenceofaclearunderstandingofthemethodologicalissuesinvolvedinestablishingtheconclusion.Thestudenthasdiscussedrealisticandrelevantsuggestionsfortheimprovementandextensionoftheinvestigation.
ACHIEVEMENTLEVEL:___________/6
COMMUNICATION(+4pts) -Referstoyourabilitytoconveyaclearandaccurateideastothegeneralpublicinthepresentationofyourfindings.Thisiswheregoodwritingskillscomeinhandy,especiallyinwritingtheprocedure.Havingapicture/diagramofyourexperimentalsetupisn’tabadideaeither.
Mark 0 1-2 3-4Descriptor Thestudent’sreportdoesnotreacha
standarddescribedbythedescriptorsbelow.
Thepresentationoftheinvestigationisunclear,makingitdifficulttounderstandthefocus,processandoutcomes.Thereportisnotwellstructuredandisunclear;thenecessaryinformationonfocus,processandoutcomesismissingorispresentedinanincoherentordisorganizedway.Therearemanyerrorsintheuseofsubject-specificterminologyandconventions.
Thepresentationoftheinvestigationisclear.Anyerrorsdonothamperunderstandingofthefocus,processandoutcomes.Thereportiswellstructuredandclear;thenecessaryinformationonfocus,processandoutcomesispresentandpresentedinacoherentway.Thereportisrelevantandconcisetherebyfacilitatingareadyunderstandingofthefocus,processandoutcomesoftheinvestigation.Theuseofsubject-specificterminologyandconventionsisappropriateandcorrect.Anyerrorsdonothamperunderstanding.
ACHIEVEMENTLEVEL:___________/4