internal flow measurements of turbomachinery using piv · internal flow measurements of...
TRANSCRIPT

22 Vo l . 4 6 N o . 1 2 013
Internal Flow Measurements of Turbomachinery using PIV
OHUCHIDA Satoshi : Turbo Machinery and Engine Technology Department, Products Development Center, Corporate Research & Development TAMAKI Hideaki : Doctor of Engineering & P. E. Jp, Chief Engineer, Corporate Research & Development KAWAKUBO Tomoki : Manager, Turbo Machinery and Engine Technology Department, Products Development Center, Corporate Research & Development YAMADA Kiwamu : Manager, Testing and Engineering Department, R&D Technology Center, Corporate Research & Development MARUYAMA Masakazu : Testing and Engineering Department, R&D Technology Center, Corporate Research & Development
In the design process of turbomachinery, it is important to understand and predict the internal flow since it directly influences product performance. There are many design tools that can be used to visualize the internal flow and one of the best in recent years is numerical simulation. However, simulation is still not a practically applicable tool for predicting the occurrence of unstable flow, which is of primary concern in turbo compressors. To overcome this difficulty, developing measurement techniques will play an important role in addition to the development of large scale simulations. In this article, a flow velocity measurement technique called PIV developed relatively recently is discussed and measurement results of rotating stall phenomenon in centrifugal compressor vaneless diffusers are introduced.
1. Introduction
In designing the fluid elements of turbomachinery, it is often the case that the geometry of the flow channel is modified while the internal flow is being evaluated using one method or another. In various stages of the design work, parameters are studied to determine the geometry of the flow channel, and various tools are used to specifically evaluate the internal flow, such as fluid experiments and simulations. Recently, a simulation called CFD (Computational Fluid Dynamics), which was developed through the advancement of numerical computation techniques, is gaining in popularity in design work. CFD provides all information about the flow field including physical quantities not measurable in experiments, and is useful in the above-mentioned work where the geometry of the flow channel is modified and the effectiveness of the modification is verified.
Turbomachinery can respond to various operating conditions depending on the combination of rotor rotational speed and flow rate of the working fluid, but in general, its performance decreases if any of the operating conditions deviate from the design operating points. Taking a compressor as an example, as the operating conditions change and the flow rate decreases, a flow vibration or unstable flow such as rotating stall or surge will occur, causing the compressor to stop operating. In reality, compressors are operated under various conditions, and therefore, it is desirable that their operating range be as wide as possible, or in other words, they be as unlikely as possible to cause such an unstable flow. However, speaking
only of such unstable phenomena, CFD is still in its research stage and cannot accurately predict the occurrence of these phenomena.
As the focus has been on numerical computation, we have been reducing the number of classical fluid experiments in the equipment development process, but the measurement technology itself is advancing just as numerical computation is. As with numerical computation, it is theoretically possible with a technique called PIV (Particle Imaging Velocimetry), which is used in this paper, to evaluate the flow at multiple points at once. In other words, in order to compensate for the disadvantages of CFD as a design tool and to collect benchmark data for future development of numerical analysis techniques, it is important to evaluate the internal flow through experiments.
This paper focuses on examples of the measurement of rotating stall in vaneless diffusers, which is known as an unstable flow in centrifugal compressors, by using PIV.
2. Principle of PIV and application of PIV to turbomachinery
Figure 1 is a schematic showing the principle of PIV. Tracer particles (particles for measuring the flow rate) are sprayed over the flow field and a planar light source is used to momentarily illuminate and take images of the field. Two images are taken of the field with a short interval to record the light scattered from the tracer particles with a CCD camera.(1)
Comparison between these two images finds that the locations of the tracer particles differ between the two

23Vo l . 4 6 N o . 1 2 013
images because the tracer particles move with the fluid. The particle velocity (or the flow rate on the plane surface illuminated by laser light) can be obtained by calculating the travel distance of the tracer particles through image processing with a computer and dividing the travel distance by the time difference between when the first and second images were taken. Because the tracer particles are distributed at a certain density, the velocity data can be simultaneously obtained at different points within the image area. Several techniques that use tracers to measure a fluid have been around for a while, among which those using the correlation calculation of two images to obtain the travel distance are often called PIV.
In general, when the internal flow is measured by PIV, two windows need to be machined on the machinery under test: one for guiding the laser light for illuminating the flow field through the flow channel from outside to inside the machinery, and another for observing the illuminated measurement field. In principle, as previously mentioned, the velocity distribution over the entire f ield can be obtained by taking two images, but because it is difficult to distribute tracer particles evenly over the flow field, some
data will be missing. Therefore, it is often the case that two images are taken several times for ensemble averaging (the sum of the velocity data measured at the same point is divided by the number of measurements) (hereinafter called averaging).
The following introduces specific techniques needed for measurement, taking as an example the measurement of the internal flow of turbomachinery with PIV. Figure 2 shows an example of measurement of the flow between the rotating vanes of a centrifugal compressor. The casing was machined so that the leading edges of the vanes were visible through the observation window (Fig. 2-(a)), and the planar laser light was introduced from the suction port of the compressor to illuminate the measurement field (Fig. 2-(b)). As just mentioned, averaging is needed to acquire data for the entire field, but at this time, where the flow channel itself moves, it is important that the vane positions be fixed when images are taken. For this reason, in the measurement shown in the figure, the positions of the rotating vanes were detected by a displacement sensor, at which point measurement was started.(2),(3) Figure 2-(c) shows the final result obtained after averaging. The figure shows that the flow is stagnant around the anterior edges of the vanes and accelerates along the suction side.
In this paper, the technique by which the measurement is performed several times in synchronization with a specific phase of a periodic phenomenon and the results are averaged is referred to as phase synchronization measurement. The same phase synchronization technique was used in the measurement of the rotating stall of a vaneless diffuser of a centrifugal compressor that will be introduced in Chapter 3. However, the measured phenomenon had a different period from that of the rotation of the vanes, and therefore, another technique was used for the operation to determine the measurement timing.
3. Rotating stall of a vaneless diffuser of a centrifugal compressor
Figure 3 shows the components of a common centrifugal compressor. The working fluid flows into the compressor in the rotational axis direction in relation to the impeller
FlowImaging equipment
Planar light
Tracer particle
Fig. 1 PIV measurement principle
Laser irradiation unit Observation window CCD camera Measurement field
(a) Equipment installation (b) Enlarged view of measurement field (c) Measurement result
Fig. 2 Example of measurement in rotating blade passage

24 Vo l . 4 6 N o . 1 2 013
and after being worked on by the rotating vanes, flows out in the radial direction. A diffuser is provided as an element to convert the dynamic component of the energy given to the working fluid by the impeller to static pressure. The diffuser has a circular ring shape and a channel expansion part where the cross section area becomes larger toward the flow outlet. Figure 4 shows the types of diffusers. Some diffusers have multiple stator vanes arranged radially in the channel (Fig. 4-(a)) and others do not have any stator vanes (Fig. 4-(b)). The former is referred to as a vaned diffuser, and the latter is referred to as a vaneless diffuser. The appropriate diffuser is selected according to their characteristics.
The operating condition of a centrifugal compressor is determined by the impeller rotational speed and working fluid flow rate, but the flow rate has upper and lower limits between which the machinery can operate at a specific rotational speed. The upper limit of the flow rate is set to prevent the choking, and the maximum flow rate of the working fluid is restricted by the cross section area of the flow channel. The lower limit is set to ensure that the machinery can operate safely even when self-excited vibration occurs. It is common for turbocompressors to become unable to operate due to flow vibration at a low flow rate, but under what conditions and where this phenomenon occurs depend greatly on the flow channel design. Therefore, one of the goals in compressor development is to design compressors so that the occurrence of such vibration is minimized. The following focuses on the flow field where a flow vibration called rotating stall occurs in the vaneless diffuser of the prototype compressor.
The rotating stall of vaneless diffusers is known as the phenomenon in which a pressure pattern with periodic distribution has a rotational motion when the diffuser is viewed from the axial direction.(4) When the flow rate
is larger at a fixed impeller rotation speed, the pressure distribution in the diffuser is symmetric, but when the flow rate is lower than a certain value, the pressure distribution is asymmetric. This vibration occurs locally in the piping system including the compressor, and is distinguished from surge, in which vibration occurs over the entire piping system. Problems accompanying rotating stall include reduction of pressure recovery, which is the primary function of the diffuser, and adverse effects of pressure vibration on the machinery as a periodic external force.
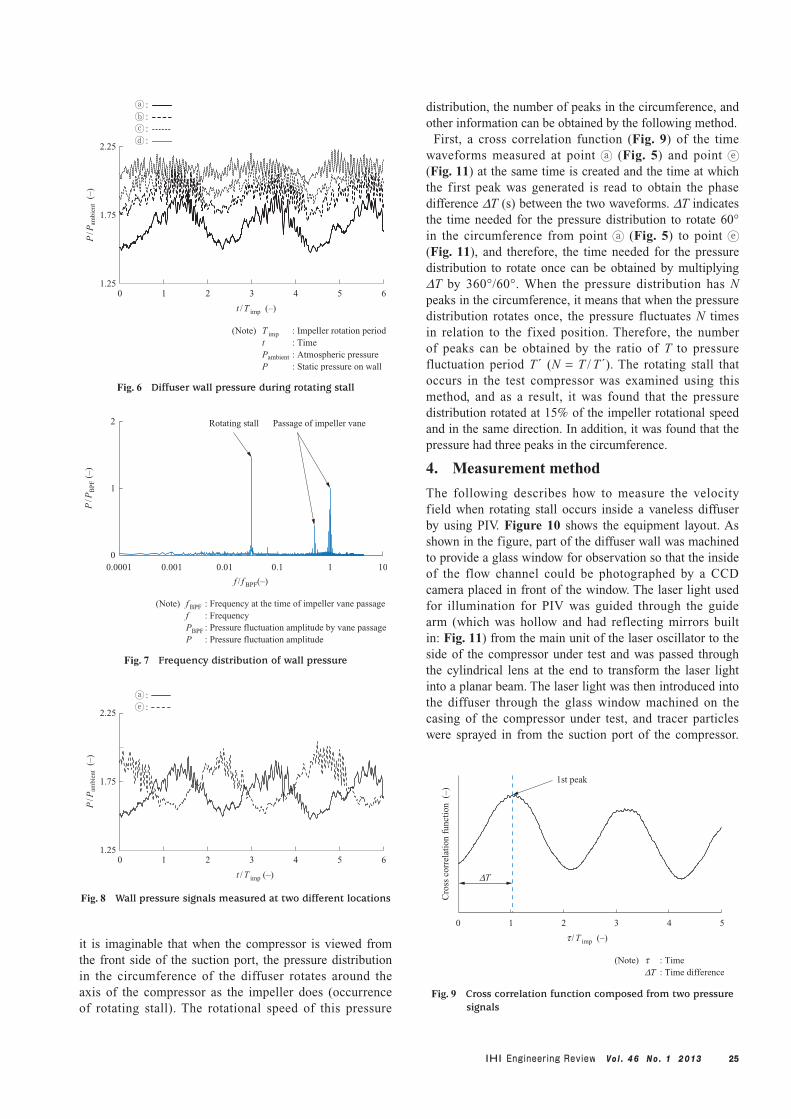
Figure 5 shows a cross section of the compressor under test. To make it easy to measure the flow channel of the diffuser, a collector having a symmetric shape around the rotational axis was used for the test instead of the volute shown in Fig. 3. At points to shown in Fig. 5, pressure transducers are arranged radially in a row so as to measure the wall static pressure at once. After the compressor is started, when the flow rate is gradually decreased with the f ixed impeller rotational speed kept constant and after a certain flow rate is passed, the pressure fluctuates as shown in Fig. 6. Figure 6 shows that the period of these fluctuations is larger than that of one rotation of the impeller and are smaller at a point closer to the outlet of the diffuser (in the machinery, local vibration). The frequency distribution, as shown in Fig. 7, has an extremely large amplitude in relation to the pressure fluctuations accompanied by vane passage.
The pressure was measured in the same manner at point where the radial position was the same as that of in
Fig. 5 and the angular position in relation to the impeller rotational axis is located 60° from that of (the same applies to Fig. 11), and the result was as shown in Fig. 8. The pressure vibration at point (Fig. 11) has the same period and amplitude as that at point (Fig. 5), but they have different phases in the time direction. In other words,
Impeller
Diffuser
Volute
Suction
Fig. 3 Major components of centrifugal compressors
(a) Vaned diffuser (b) Vaneless diffuser
Fig. 4 Diffuser types
:1.0
5 ×
R2
:1.2
5 ×
R2
:1.4
4 ×
R2
:1.6
4 ×
R2
Collector
Impeller
(Note) R2 : Outer periphery radius of impeller
Fig. 5 Cross section of the test compressor
25Vo l . 4 6 N o . 1 2 013
it is imaginable that when the compressor is viewed from the front side of the suction port, the pressure distribution in the circumference of the diffuser rotates around the axis of the compressor as the impeller does (occurrence of rotating stall). The rotational speed of this pressure
distribution, the number of peaks in the circumference, and other information can be obtained by the following method.
First, a cross correlation function (Fig. 9) of the time waveforms measured at point (Fig. 5) and point (Fig. 11) at the same time is created and the time at which the first peak was generated is read to obtain the phase difference DT (s) between the two waveforms. DT indicates the time needed for the pressure distribution to rotate 60° in the circumference from point (Fig. 5) to point (Fig. 11), and therefore, the time needed for the pressure distribution to rotate once can be obtained by multiplying DT by 360°/60°. When the pressure distribution has N peaks in the circumference, it means that when the pressure distribution rotates once, the pressure fluctuates N times in relation to the fixed position. Therefore, the number of peaks can be obtained by the ratio of T to pressure fluctuation period T ́ (N = T / T ́ ). The rotating stall that occurs in the test compressor was examined using this method, and as a result, it was found that the pressure distribution rotated at 15% of the impeller rotational speed and in the same direction. In addition, it was found that the pressure had three peaks in the circumference.
4. Measurement method
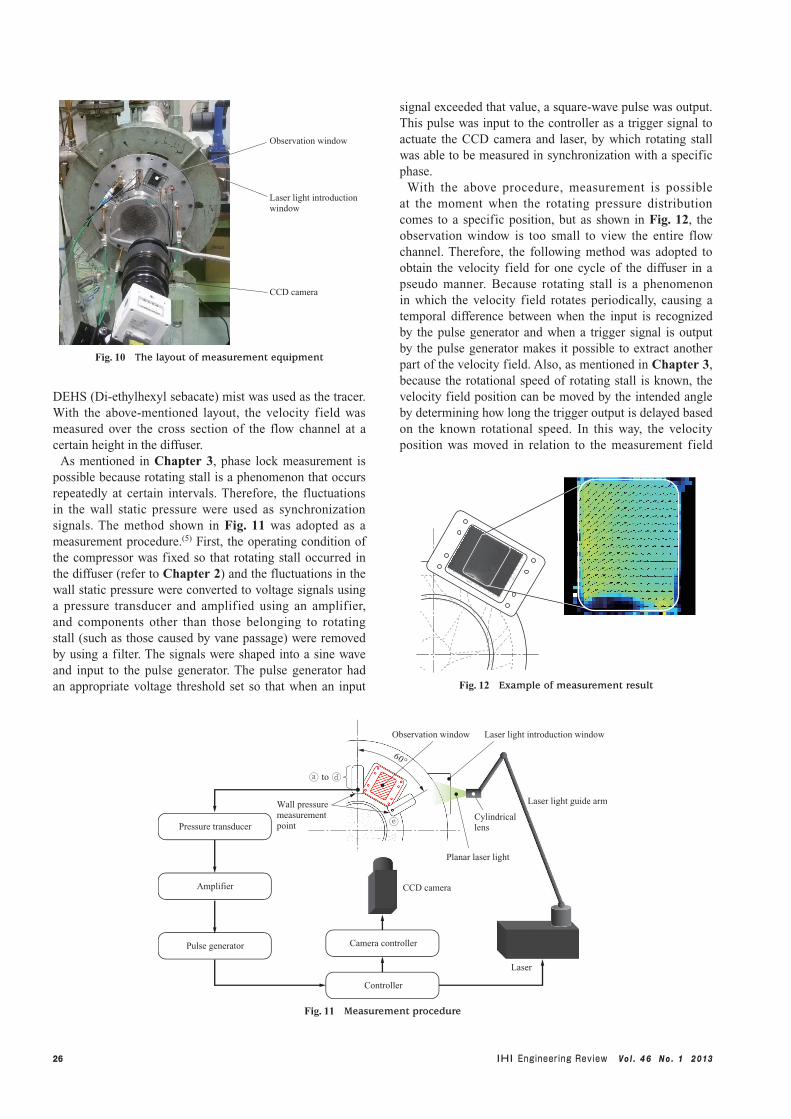
The following describes how to measure the velocity field when rotating stall occurs inside a vaneless diffuser by using PIV. Figure 10 shows the equipment layout. As shown in the figure, part of the diffuser wall was machined to provide a glass window for observation so that the inside of the flow channel could be photographed by a CCD camera placed in front of the window. The laser light used for illumination for PIV was guided through the guide arm (which was hollow and had reflecting mirrors built in: Fig. 11) from the main unit of the laser oscillator to the side of the compressor under test and was passed through the cylindrical lens at the end to transform the laser light into a planar beam. The laser light was then introduced into the diffuser through the glass window machined on the casing of the compressor under test, and tracer particles were sprayed in from the suction port of the compressor.
1.25
1.75
2.25
0 1 2 3 4 5 6
t /T imp (–)
(Note) T imp : Impeller rotation period t : Time Pambient : Atmospheric pressure P : Static pressure on wall
P/P
ambi
ent
(–)
Fig. 6 Diffuser wall pressure during rotating stall
0
1
2
0.0001 0.001 0.01 0.1 1 10
f / f BPF(–)
(Note) f BPF : Frequency at the time of impeller vane passage f : Frequency PBPF : Pressure fluctuation amplitude by vane passage P : Pressure fluctuation amplitude
P/P
BP
F (
–)
Rotating stall Passage of impeller vane
Fig. 7 Frequency distribution of wall pressure
1.25
1.75
2.25
0 1 2 3 4 5 6
t /T imp (–)
P/P
ambi
ent
(–)
Fig. 8 Wall pressure signals measured at two different locations
0 1 2 3 4 5
t /T imp (–)
(Note) t : Time DT : Time difference
DT
1st peak
Cro
ss c
orre
lati
on f
unct
ion
(–)
Fig. 9 Cross correlation function composed from two pressure signals
26 Vo l . 4 6 N o . 1 2 013
DEHS (Di-ethylhexyl sebacate) mist was used as the tracer. With the above-mentioned layout, the velocity field was measured over the cross section of the flow channel at a certain height in the diffuser.
As mentioned in Chapter 3, phase lock measurement is possible because rotating stall is a phenomenon that occurs repeatedly at certain intervals. Therefore, the fluctuations in the wall static pressure were used as synchronization signals. The method shown in Fig. 11 was adopted as a measurement procedure.(5) First, the operating condition of the compressor was fixed so that rotating stall occurred in the diffuser (refer to Chapter 2) and the fluctuations in the wall static pressure were converted to voltage signals using a pressure transducer and amplified using an amplifier, and components other than those belonging to rotating stall (such as those caused by vane passage) were removed by using a filter. The signals were shaped into a sine wave and input to the pulse generator. The pulse generator had an appropriate voltage threshold set so that when an input
signal exceeded that value, a square-wave pulse was output. This pulse was input to the controller as a trigger signal to actuate the CCD camera and laser, by which rotating stall was able to be measured in synchronization with a specific phase.
With the above procedure, measurement is possible at the moment when the rotating pressure distribution comes to a specific position, but as shown in Fig. 12, the observation window is too small to view the entire flow channel. Therefore, the following method was adopted to obtain the velocity field for one cycle of the diffuser in a pseudo manner. Because rotating stall is a phenomenon in which the velocity field rotates periodically, causing a temporal difference between when the input is recognized by the pulse generator and when a trigger signal is output by the pulse generator makes it possible to extract another part of the velocity field. Also, as mentioned in Chapter 3, because the rotational speed of rotating stall is known, the velocity field position can be moved by the intended angle by determining how long the trigger output is delayed based on the known rotational speed. In this way, the velocity position was moved in relation to the measurement field
Pressure transducer
Amplifier
Pulse generator
Wall pressure measurement point
CCD camera
Planar laser light
Observation window
Cylindrical lens
Laser
Laser light introduction window
Laser light guide arm
60°
Controller
Camera controller
to
Fig. 11 Measurement procedure
Fig. 12 Example of measurement result
Observation window
Laser light introduction window
CCD camera
Fig. 10 The layout of measurement equipment
27Vo l . 4 6 N o . 1 2 013
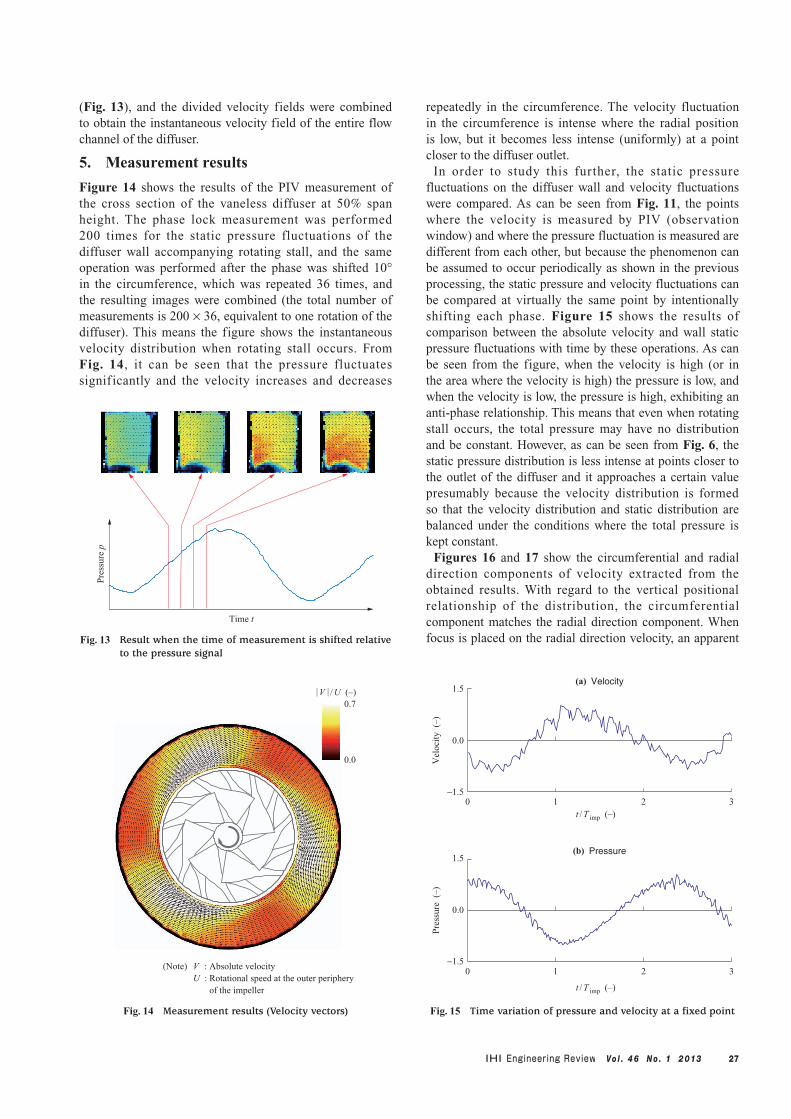
(Fig. 13), and the divided velocity fields were combined to obtain the instantaneous velocity field of the entire flow channel of the diffuser.
5. Measurement results
Figure 14 shows the results of the PIV measurement of the cross section of the vaneless diffuser at 50% span height. The phase lock measurement was performed 200 times for the static pressure fluctuations of the diffuser wall accompanying rotating stall, and the same operation was performed after the phase was shifted 10° in the circumference, which was repeated 36 times, and the resulting images were combined (the total number of measurements is 200 × 36, equivalent to one rotation of the diffuser). This means the figure shows the instantaneous velocity distribution when rotating stall occurs. From Fig. 14, it can be seen that the pressure fluctuates signif icantly and the velocity increases and decreases
repeatedly in the circumference. The velocity fluctuation in the circumference is intense where the radial position is low, but it becomes less intense (uniformly) at a point closer to the diffuser outlet.
In order to study this further, the static pressure fluctuations on the diffuser wall and velocity fluctuations were compared. As can be seen from Fig. 11, the points where the velocity is measured by PIV (observation window) and where the pressure fluctuation is measured are different from each other, but because the phenomenon can be assumed to occur periodically as shown in the previous processing, the static pressure and velocity fluctuations can be compared at virtually the same point by intentionally shifting each phase. Figure 15 shows the results of comparison between the absolute velocity and wall static pressure fluctuations with time by these operations. As can be seen from the figure, when the velocity is high (or in the area where the velocity is high) the pressure is low, and when the velocity is low, the pressure is high, exhibiting an anti-phase relationship. This means that even when rotating stall occurs, the total pressure may have no distribution and be constant. However, as can be seen from Fig. 6, the static pressure distribution is less intense at points closer to the outlet of the diffuser and it approaches a certain value presumably because the velocity distribution is formed so that the velocity distribution and static distribution are balanced under the conditions where the total pressure is kept constant.
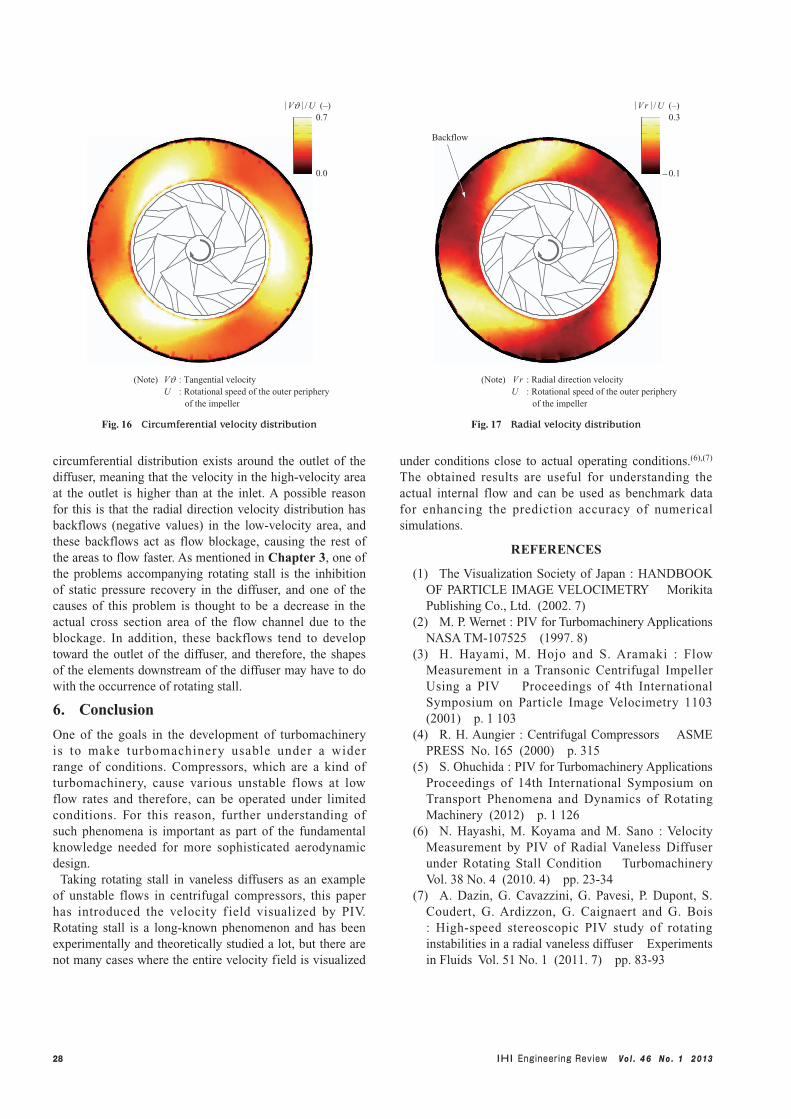
Figures 16 and 17 show the circumferential and radial direction components of velocity extracted from the obtained results. With regard to the vertical positional relationship of the distribution, the circumferential component matches the radial direction component. When focus is placed on the radial direction velocity, an apparent
0.7
0.0
|V | /U (–)
(Note) V : Absolute velocity U : Rotational speed at the outer periphery of the impeller
Fig. 14 Measurement results (Velocity vectors)
Vel
ocit
y (
–)P
ress
ure
(–)
t /T imp (–)
t /T imp (–)
(a) Velocity
(b) Pressure
0−1.5
1 2 3
0 1 2 3
0.0
1.5
−1.5
0.0
1.5
Fig. 15 Time variation of pressure and velocity at a fixed point
Time t
Pre
ssur
e p
Fig. 13 Result when the time of measurement is shifted relative to the pressure signal
28 Vo l . 4 6 N o . 1 2 013
circumferential distribution exists around the outlet of the diffuser, meaning that the velocity in the high-velocity area at the outlet is higher than at the inlet. A possible reason for this is that the radial direction velocity distribution has backflows (negative values) in the low-velocity area, and these backflows act as flow blockage, causing the rest of the areas to flow faster. As mentioned in Chapter 3, one of the problems accompanying rotating stall is the inhibition of static pressure recovery in the diffuser, and one of the causes of this problem is thought to be a decrease in the actual cross section area of the flow channel due to the blockage. In addition, these backflows tend to develop toward the outlet of the diffuser, and therefore, the shapes of the elements downstream of the diffuser may have to do with the occurrence of rotating stall.
6. Conclusion
One of the goals in the development of turbomachinery is to make turbomachinery usable under a wider range of conditions. Compressors, which are a kind of turbomachinery, cause various unstable flows at low flow rates and therefore, can be operated under limited conditions. For this reason, further understanding of such phenomena is important as part of the fundamental knowledge needed for more sophisticated aerodynamic design.
Taking rotating stall in vaneless diffusers as an example of unstable flows in centrifugal compressors, this paper has introduced the velocity f ield visualized by PIV. Rotating stall is a long-known phenomenon and has been experimentally and theoretically studied a lot, but there are not many cases where the entire velocity field is visualized
under conditions close to actual operating conditions.(6),(7) The obtained results are useful for understanding the actual internal flow and can be used as benchmark data for enhancing the prediction accuracy of numerical simulations.
REFERENCES
(1) The Visualization Society of Japan : HANDBOOK OF PARTICLE IMAGE VELOCIMETRY Morikita Publishing Co., Ltd. (2002. 7)
(2) M. P. Wernet : PIV for Turbomachinery Applications NASA TM-107525 (1997. 8)
(3) H. Hayami, M. Hojo and S. Aramaki : Flow Measurement in a Transonic Centrifugal Impeller Using a PIV Proceedings of 4th International Symposium on Particle Image Velocimetry 1103 (2001) p. 1 103
(4) R. H. Aungier : Centrifugal Compressors ASME PRESS No. 165 (2000) p. 315
(5) S. Ohuchida : PIV for Turbomachinery Applications Proceedings of 14th International Symposium on Transport Phenomena and Dynamics of Rotating Machinery (2012) p. 1 126
(6) N. Hayashi, M. Koyama and M. Sano : Velocity Measurement by PIV of Radial Vaneless Diffuser under Rotating Stall Condition Turbomachinery Vol. 38 No. 4 (2010. 4) pp. 23-34
(7) A. Dazin, G. Cavazzini, G. Pavesi, P. Dupont, S. Coudert, G. Ardizzon, G. Caignaert and G. Bois : High-speed stereoscopic PIV study of rotating instabilities in a radial vaneless diffuser Experiments in Fluids Vol. 51 No. 1 (2011. 7) pp. 83-93
(Note) VJ : Tangential velocity U : Rotational speed of the outer periphery of the impeller
0.7
0.0
|VJ | /U (–)
Fig. 16 Circumferential velocity distribution
(Note) Vr : Radial direction velocity U : Rotational speed of the outer periphery of the impeller
0.3
−0.1
|Vr | /U (–)
Backflow
Fig. 17 Radial velocity distribution