internal structure and water transport in endosperm and … · destinée au dépôt et à la...
TRANSCRIPT

HAL Id: tel-00731154https://tel.archives-ouvertes.fr/tel-00731154
Submitted on 12 Sep 2012
HAL is a multi-disciplinary open accessarchive for the deposit and dissemination of sci-entific research documents, whether they are pub-lished or not. The documents may come fromteaching and research institutions in France orabroad, or from public or private research centers.
L’archive ouverte pluridisciplinaire HAL, estdestinée au dépôt et à la diffusion de documentsscientifiques de niveau recherche, publiés ou non,émanant des établissements d’enseignement et derecherche français ou étrangers, des laboratoirespublics ou privés.
Internal structure and water transport in endospermand parchment of coffee bean
Alejandra Ramirez-Martinez
To cite this version:Alejandra Ramirez-Martinez. Internal structure and water transport in endosperm and parchmentof coffee bean. Mécanique des matériaux [physics.class-ph]. Université Montpellier II - Sciences etTechniques du Languedoc, 2011. Français. <tel-00731154>

Marco Antonio SALGADO CERVANTES
Professeur des universités Institut Technologique de Veracruz
Président
Richard AURIA Directeur de Recherche Institut de Recherche pour le Développement
Rapporteur
César I. BERISTAIN GUEVARA Professeur des universités Université de Veracruz Rapporteur
Jean-Claude BENET Professeur des universités Université Montpellier 2 Directeur de thèse
Fabien CHERBLANC Professeur des universités Université Montpellier 2 Examinateur
Miguel A. GARCIA ALVARADO
Professeur des universités Institut Technologique de Veracruz
Co-directeur de thèse
Guadalupe del Carmen RODRIGUEZ JIMENEZ
Professeur des universités Institut Technologique de Veracruz
Examinateur
UNIVERSITÉ MONTPELLIER 2
INSTITUT TECHNOLOGIQUE DE VERACRUZ
- UNIDA-
THÈSE
Pour obtenir le grade de
DOCTEUR DE L’UNIVERSITÉ MONTPELLIER 2 ET DE L’INSTITUT TECHNOLOGIQUE DE VERACRUZ
Spécialité : Mécanique et Génie Civil. Formation doctorale : Mécanique des matériaux et des milieux complexes, des structures et des systèmes. Ecole doctorale : Information, Structures, Systèmes.
INTERNAL STRUCTURE AND WATER TRANSPORT IN ENDOSPERM AND PARCHMENT OF COFFEE BEAN
par :
Alejandra RAMIREZ MARTINEZ
Soutenue publiquement le 7 septembre 2011 devant le jury composé de :


i
DEDICATIONS
I�ll wish to dedicate this work to several people:
To my parents and siblings whom I love infinitely.
To my friends whom make me better person.
To my professors whom showed me the way to think in another way.
To G. and D. whom never leave me alone.

ii
ACKNOWLEDGEMENTS
My recognition to Dr. Miguel Angel García Alvarado who teach me to
think in a more proper way.
My recognition to Prof. Jean-Claude Bénet and Fabien Cherblanc. Thank
you for sharing with me your knowledge and for being not only my
professors but good friends.
My recognition to Dr. Marco Antonio Salgado Cervantes who help me in
many problems throughout my stage at UNIDA.
My recognition to Dr. Guadalupe del C. Rodríguez Jimenes for the good
moments I spent at her laboratory.
To CONACyT for the financial support which made possible this work.

iii
RESUMEN
Ramírez Martínez Alejandra. Dr. En C. Instituto Tecnológico de Veracruz, Septiembre 2011. �ESTRUCTURA INTERNA Y TRANSPORTE DE AGUA EN EL PERGAMINO Y ENDOSPERMA DEL GRANO DE CAFÉ�. Asesores: Dr. Miguel Angel García Alvarado, Dra. Guadalupe del C. Rodríguez Jimenes, Dr. Marco Antonio Salgado Cervantes, Prof. JeanClaude Bénet.
El objetivo de este trabajo es investigar la transferencia de masa del agua en el grano
de café. La estructura interna del grano de café fue estudiada utilizando microscopía y
estereoscopía ópticas. Los resultados dieron evidencia de la heterogeneidad de la
estructura celular del grano de café. También se estudiaron tres estructuras
morfológicas situadas en la superficie del grano: el pergamino, la película plateada y el
endosperma. Se determinaron las isotermas de sorción y valores de difusividad del
agua para estas estructuras sin hallarse diferencia significativa entre ellos a excepción
del pergamino. Una técnica experimental para estudiar la transferencia de agua en el
pergamino fue propuesta. En el endosperma, para humedades mayores a 65%, una
difusividad constante describe la cinética de secado de granos enteros. Por debajo de
este valor de humedad, la difusividad del agua (con y sin la película plateada) fue
significativamente menor que la difusividad efectiva del grano entero, comportamiento
que puede ser atribuido a la reducción del espacio del poro ocupada por el agua y al
aumento de la interacción entre el esqueleto sólido y el agua al disminuir la humedad.
Se propuso un modelo simple para la simulación numérica de la transferencia de agua
en la superficie del grano. La simulación numérica mostró que el valor de la humedad
en la interfase endosperma-pergamino es discontinuo, que el pergamino representa una
barrera a la transferencia de agua y que existe un mayor riesgo para el desarrollo de A.
ochraceus en el secado natural que en el secado artificial.

v
RESUME
STRUCTURE INTERNE ET TRANSPORT D’EAU DANS L’ENDOSPERME ET LA PARCHE DU GRAIN DE CAFE
INTRODUCTION
Le café est le second plus important produit commercial dans le monde (Kouadio et al., 2007). D’après la
FAO (2008) le café est produit dans 78 pays à travers le monde et 20 à 25 millions de familles,
essentiellement des petits cultivateurs, dépendent du commerce du café. Parmi les traitements après récolte, le
séchage, peut être effectué directement au soleil ou/et par l’utilisation de séchoirs. Le séchage a été identifié
comme l’opération au cours de laquelle la contamination par des champignons est la plus commune (Frank,
2000; Paulino de Moraes & Luchese, 2003; Taniwaki et al., 2003; Kouadio et al., 2007). En particulier,
Aspergillus ochraceus, peut se développer pendant le séchage, il se révèle être un bon producteur d’une
toxine, l’ Ochratoxin A (OTA), qui a des propriétés teratogénique, immunotoxique et certainement
neurotoxique et cancérigènes. L’activité de l’eau est un des principaux paramètres qui déterminent la
croissance d’Aspergillus Ochraceus, des études antérieures (Suárez-Quiroz et al, 2004; Kouadio et al. 2007)
ont montré qu’une activité de 0.8 est critique pour la prévention de la production OTA pendant le séchage.
Afin d’étudier et de modéliser la distribution de l’eau et d’en déduire la distribution de son activité dans le
grain, il est essentiel de connaitre les propriétés d’équilibre thermodynamique de l’eau et les mécanismes de
transport de l’eau dans les différentes structures et tissus constituant le grain.
Cette thèse présente trois volets :
- observation macroscopique et microscopique du grain de café pour mettre en évidence les principales
parties du grain, les différentes structures de ces parties et les hétérogénéités de ces structures afin d’identifier
les sites possibles de croissance de microorganismes,
- pour certaines parties qui seront choisies en fonction des observations, étude d’une part de la relation
entre l’activité de l’eau et la teneur en eau et d’autre part des propriétés de transport d’eau en fonction de la
teneur en eau,
- modélisation du champ d’activité de l’eau à la surface du grain au cours d’un processus de séchage.
RESULTATS
Du café fermenté et lavé de la variété Arabica provenant des récoltes de 2008 et 2009 est utilisé dans tous les
essais expérimentaux.
Structure du grain de café et caractérisation des tissus
Les grains de café sont coupés dans différentes sections parallèles aux axes majeur et mineur du grain
(Fig. 26). La photographie de la coupe 1 de la Figure 26 est représentée Figure 27a, on peut observer l’espace
occupé par l’embryon. Sur la Figure 29a une rupture des tissues peut être observée dans la partie supérieure
du grain ; cette figure met en évidence la complexité de la structure interne du grain. Du mucilage (Fig. 49a)

vi
est identifié au sein du sillon. Sur l’axe majeur (coupe 10, Fig. 26), l’endosperme est séparé en deux parties
largement en contact avec l’air (Fig. 47).
Aussi bien dans les sections parallèles à l’axe mineur que dans les sections parallèle à l’axe majeur,
l’arrangement et la forme des cellules ne sont pas uniformes. Suivant l’axe mineur (section 7 de la Fig. 26),
les cellules sont arrondies et la taille est homogène. Dans la partie centrale de la section 8 les cellules
présentent une forme rectangulaire; elles présentent une forme de polyèdre dans le reste de la section
(Fig. 31). L’orientation des cellules change très fortement dans la partie centrale par rapport au reste de
l’endosperme (Fig. 31).
Une photographie du tissus cellulaire est donnée Figure 33. Le diamètre moyen des cellules est compris entre
30 et 60たm et l’épaisseur de la paroi cellulaire est comprise entre 9 et 11 たm. La Figure 47 représente une vue
de la parche. Comme mentionné par Kasser & Kasser (1969) elle est composée de fibres entrecroisées dont le
diamètre varie entre 100 et 200 µm. La parche présente une structure très différente des autres parties, elle est
en grande partie composée de lignine et de pentose.
Suite aux observations une méthode spécifique de prélèvement d’échantillons dans le grain a été développée.
Un échantillon de forme cylindrique est prélevé au moyen d’un emporte pièce (Fig. 52a). Cet échantillon est
ensuite décomposé en : parche, couche argentée, différentes parties de l’endosperme (Fig. 52b) ; il est
également possible de dégager des échantillons aux extrémités du grain.
Activité de l’eau dans différentes parties du grain de café
Les sites de développement d’Aspergillus Ochraceus coïncident avec les zones de forte activité de l’eau. Les
investigations précédentes suggèrent une hétérogénéité de structure et de composition, ce qui, à priori, indique
une hétérogénéité de la relation entre la teneur en eau et l’activité. Afin d’analyser cette relation, des
isothermes sont réalisées pour différentes parties du grain. Cinq isothermes ont été obtenues (Fig. 52): parche,
endosperme (partie 1), endosperme (partie 2), grain entier et extrémité des grains. Les isothermes obtenues
sont représentées Figure 55. Il n’est pas observé de différences significatives pour l’endosperme quelle que
soit sa position dans le grain. Cependant le comportement de la parche est très différent de celui de
l’endosperme et, comme le laisse prévoir sa composition, il se rapproche de celui du bois. Si la majeure partie
des spores est déposée sur la parche cette différenciation par rapport à l’endosperme est d’une importance
particulière dans le mécanisme de contamination ; en absence de déchirures de la parche, c’est elle qui
détermine l’activité de la surface réceptrice des spores. Les isothermes de désorption sont bien approximées
par le modèle de GAB pour des activités inférieures à 0,82 et par le modèle de Ferro-Fontan au dessus de
cette valeur.
Les isothermes de désorption sont ensuite traduites en termes de potentiel chimique. Cette grandeur
thermodynamique permet de quantifier l’énergie nécessaire à l’extraction de l’unité de masse d’eau du milieu.
Pour atteindre une activité de 0,8 il faut augmenter la valeur absolue du potentiel chimique au dessus de la
valeur critique de 30 000J/kg (Fig. 63). On constate sur cette Figure que pour passer d’un potentiel chimique
nul au potentiel critique, il faut faire passer la teneur en eau de 1,3 à 0,35. Ceci représente une énergie pour

vii
évaporer l’eau bien supérieure aux cas du bois et des sols dont les courbes caractéristiques sont représentées
Figure 63.
Transfert d’eau dans un grain de café, dans l’endosperme et la parche.
Une première étude du transfert d’eau dans café à été réalisée sur le grain entier à partir de la solution de
l’équation de diffusion, pour une géométrie ellipsoïdale se rapprochant de la forme du grain de café
(Hernandez-Dias et al., 2008). Cette solution introduit un coefficient de diffusion effectif qui a été mesuré à
partir de cinétiques établies dans un séchoir pilote à 35 °C et 45°C pour une vitesse de l’air de 1,5m/s.
Afin de focaliser l’étude sur la surface du grain, site le plus probable de développement de microorganismes,
des études du transfert d’eau ont été effectuées dans l’endosperme avec couche argentée et sans couche
argenté. Les échantillons utilisés correspondent à la partie 1 de la Figure 52a. Ces mesures ont été réalisées
sur une géométrie de plaque en utilisant la solution de Crank. On s’est attaché à respecter les hypothèses de
cette solution tant au niveau de la géométrique que de l’uniformité des conditions initiales en teneur en eau.
Les résultats représentés Figure 68 montre que le coefficient de transfert dans la parche varie avec la teneur en
eau. Aux fortes teneurs en eau (X>0,6 et aw> 0,95) l’eau à l’intérieur de grain présente des propriétés voisines
de l’eau normale et la mobilité de l’eau est alors maximale ce qui se traduit sur la Figure 68 par un palier du
coefficient de diffusion entre W=1,2 et 0,6. On constate sur cette Figure que le coefficient de diffusion effectif
déterminé sur grain entier correspond au coefficient de diffusion de l’endosperme aux fortes teneurs en eau ;
cette concordance valide les deux méthodes pour X>0,6.
Au dessous de cette teneur en eau, le coefficient de diffusion diminue pour s’annuler lorsque le produit est
sec. On notera que l’activité de 0,8 est atteinte pour X= 0,2, ce qui montre l’intérêt de l’étude du coefficient
de diffusion dans tout le domaine de teneur en eau. Il a été montré que la couche argentée réduit les transferts
d’eau dans une proportion de l’ordre de 10%.
Coefficient de transport de l’eau dans la parche
La parche est très mince, son épaisseur est de l’ordre de 0,1 mm. Pour décrire le transfert dans la parche on
adopte une relation linéaire entre le flux et la différence d’activité de part et d’autre de la parche. Un dispositif
spécifique a été réalisé pour étudier la résistance au transfert de la parche. Un confetti de parche (1) (Fig. 52b)
est fixé dans un tube. On impose une différence d’activité de part et d’autre de la parche par des solutions
salines, le flux d’eau est mesuré par la variation du poids de l’une des solutions salines. Les conditions
expérimentales et les résultats sont résumés dans la table 1. Le coefficient de transfert mesuré, permet,
connaissant le flux d’eau, de quantifier la différence d’activité de part et d’autre de la parche.
Simulation des transferts à la surface du grain
On peut déceler trois surfaces qui, a priori, peuvent se prêter au développement d’Aspergillus Ochraceus. Il
s’agit tout d’abord de la surface de la parche (Surface 1). Lorsque celle- ci est détruite, il y a possibilité de
contamination de la surface de l’endosperme (Surface 2). En cas de rupture des grains, le champignon
pourrait se développer à la surface des discontinuités intérieures au grain ou des surfaces de rupture

viii
(Surface 3). Le dernier cas est analogue au second si l’homogénéité des propriétés de l’endosperme et de la
couche argentée est confirmée. Les sites les plus exposés à la contamination sont ces différentes surfaces.
Dans un premier temps, on a négligé la présence de la couche argentée et on s’est limité à un modèle à une
dimension. De la surface du grain correspondant à la partie 1 de la Figure 52. Le système est constitué par la
parche et l’endosperme sous-jacent. On impose un flux à la surface de la parche ; celui-ci est déduit d’une
cinétique de séchage réelle. Le modèle est constitué par une équation de diffusion dans l’endosperme et par
une équation traduisant la résistance de la parche au transfert d’eau. Ce modèle donne les cinétiques de
séchage de la parche et en divers points de l’endosperme. On en déduit les cinétiques de l’activité de l’eau en
ces mêmes sites. Il apparait que la parche constitue une protection de l’endosperme ce qui n’est pas un fait
nouveau et rejoint les observations de terrain. L’avantage essentiel de ce modèle est que, bien que simple, il
donne des informations quantitatives sur le champ d’activité de l’eau au voisinage de la surface du grain. Il
donne également des informations sur le temps pendant lequel l’activité de l’eau reste supérieure à 0,8 dans
un processus de séchage ce qui correspond au temps pendant lequel Aspergillus Ochraceus peut se
développer.
CONCLUSION
Les travaux présentés ont mis en évidence la complexité de la structure du grain. Les techniques
expérimentales mises en œuvre pourront être utilisées pour une analyse fine des propriétés d’équilibre et de
transfert dans d’autres parties du grain. L’objectif de l’étude a été partiellement atteint par la simulation de la
surface du grain, partie la plus exposée à la contamination. Les couplages entre paramètres géométriques,
structuraux, paramètres thermodynamiques d’équilibre et de transport d’eau, conditions imposés par le
séchage ne peut être réellement appréhendé qu’a travers des modèles numériques locaux des parties des grains
susceptibles d’être contaminés, couplés à des modèles à l’échelle globale décrivant la cinétique de grains
entiers. Outre la distribution de l’activité de l’eau dans le grain, ces modèles permettront d’estimer le temps
pendant lequel les conditions favorable à la croissance du champignon seront présentes. L’objectif final est de
disposer de modules de calcul de l’évolution de l’activité de l’eau dans les zones à risque couplés à des
logiciels de simulation du séchage.
iv
ABSTRACT
Ramírez Martínez Alejandra. Sc. D. Instituto Tecnológico de Veracruz, September 2011. �INTERNAL STRUCTURE AND WATER TRANSPORT IN PARCHMENT AND ENDOSPERM OF COFFEE BEAN�. Advisors: Dr. Miguel Angel García Alvarado, Dra. Guadalupe del C. Rodríguez Jimenes, Dr. Marco Antonio Salgado Cervantes, Prof. JeanClaude Bénet.
The aim of this work is to investigate the water mass transfer into the coffee bean.
Internal structure of coffee beans was studied using optical microscopy and
stereoscopy. The results gave evidence of the heterogeneity of coffee bean cellular
structure. Three morphological structures located at bean surface were also studied: the
parchment, silver skin and endosperm. Sorption isotherms and water diffusivity values
of coffee different structures were obtained and they did not showed significant
difference with the exception of the parchment. An experimental technique to study the
transfer of water into the parchment was proposed. In the endosperm, for moisture
contents above 65%, a mass transfer model with a constant diffusivity describes the
kinetics of the whole bean. Below this moisture content, water diffusivity values (with
and without silver skin) were significantly lesser than the effective diffusivity for the
whole bean. This is firstly due to the reduction of the pore space occupied by water and
to the augmentation of the interaction between the solid skeleton and water when
moisture content decreases.
A simple simulation is proposed for the numeric simulation of the water transfer in the
surface of the grain. The numeric simulation showed that the value of the humidity in
the interface endosperm-parchment is discontinuous, that the parchment represents a
barrier to the transfer of water, and that a bigger risk exists for the development of A.
ochraceus in the natural drying that in the artificial drying.

v
INDEX
INTRODUCTION ............................................................................................................ 1
CHAPTER 1. BACKGROUND ....................................................................................... 4
1.1 Coffee. .............................................................................................................. 4 1.2 Structure of the different parts of coffee bean present at drying. ........................ 5
1.2.1 Description of the overall structure of coffee bean. .................................... 5 1.2.2 Description of the endocarp. ...................................................................... 6
1.3 Post-harvest coffee treatments. ........................................................................ 10 1.4 Factors affecting the toxicity of fungi. ............................................................. 12
1.4.1 Biological factors. ................................................................................... 12 1.4.2 Intrinsic factors. ....................................................................................... 12
1.4.3 Extrinsic Factors. ..................................................................................... 13
1.5 Ochratoxin A (OTA). ...................................................................................... 14
1.5.1 The OTA in green coffee. ........................................................................ 14
1.5.2 Factors affecting the production of OTA by A. ochraceus in coffee. ........ 17
1.6 Water disponibility, activity and chemical potential. ........................................ 20
1.6.1 Chemical potential expression. ................................................................ 21
1.6.1.1 Ideal Gas. ............................................................................................ 22
1.6.1.2 Ideal solutions...................................................................................... 23
1.6.1.3 Chemical potential determination......................................................... 24
1.6.1.4 Water sorption isotherm method. ......................................................... 26
1.6.2 Solution in a complex media. ................................................................... 27
1.6.3 Mechanical method. ................................................................................ 29
1.6.3.1 Validation of the method with saturated salt solutions. ......................... 31 1.6.4 Variation of chemical potential with moisture content in a
heterogeneous media. .. � � � � � � � � � � � � � � � � � � � � � � � � 33 1.7 Mass transfer in coffee bean. ........................................................................... 36
1.7.1 Bean level approach. ............................................................................... 37 1.7.2 Simulation of coffee drying. .................................................................... 38
1.7.3 Determination of the effective diffusivity. ............................................... 41 1.7.4 Approach at the bean tissues level. .......................................................... 43
1.7.4.1 Methods for experimental determination of diffusivity of coffee bean
tissues. � � � � � � � � � � � � � � � � � � � � � � � � � � �
� .44 1.7.4.2 Use of water chemical potential to describe the water transfer in
coffee bean tissues. ............................................................................................. 46 1.8 Background synthesis. ..................................................................................... 51
1.9 Objectives. ...................................................................................................... 54 1.9.1 General objective. .................................................................................... 54
1.9.2 Specific objectives. .................................................................................. 54
2 CHAPTER 2. MATERIALS AND METHODS ...................................................... 55
2.1 Observation of coffee bean internal structure. .................................................. 55
2.2 Characterization of coffee bean general structure............................................. 56
2.3 Determination of sorption isotherms of different parts of the coffee bean and
for the whole bean. ..................................................................................................... 56
vi
2.4 Determination of the effective diffusivity for the whole coffee bean. ............... 57
2.5 Determination of the diffusivity value for a sample from the internal
structure of coffee bean. .............................................................................................. 58
2.6 Transfer coefficient in the parchment. ............................................................. 61
2.7 Moisture content determination. ...................................................................... 63
3 CHAPTER 3. RESULTS ........................................................................................ 64
3.1 Study of coffee bean cellular distribution. ....................................................... 64
3.1.1 Transverse cut slices. ............................................................................... 64
3.1.2 Longitudinal slices................................................................................... 73
3.1.3 Optical microscopy of parchment. ........................................................... 81
3.2 Coffee bean general and internal structure characterization. ............................ 81
3.2.1 Stereoscopic microscopy of fresh coffee beans. ....................................... 81 3.2.2 RMN Imaging. ........................................................................................ 84
3.2.3 Method used to obtain samples from coffee bean. .................................... 86 3.2.4 Characteristic dimensions of coffee bean. ................................................ 86
3.3 Water activity and chemical potential in coffee bean. Coffee bean heterogeneity. . � � � � � � � � � � � � � � � � � � � � � � � � � � � � 89
3.3.1 Water chemical potential at high water activity values in coffee bean. ..... 91 3.3.2 Water chemical potential at high water activity values in other media. ..... 93
3.3.3 Water chemical potential modeling. ......................................................... 98
3.3.4 Consequence of the variation form of chemical potential with moisture
content in coffee bean. .......................................................................................... 102
3.4 Mass transfer in coffee. ................................................................................. 102
3.4.1 Mass transfer in the whole coffee bean. ................................................. 103
3.4.2 Water mass transfer coefficient in a sample of coffee bean endosperm. . 105
3.4.3 Transfer coefficient in the parchment. .................................................... 107
3.5 Numerical simulation of water transfer in the coffee bean interface. .............. 114
3.5.1 Model equations. Initial and boundary conditions. ................................. 116
3.5.2 Model equations discretization. ............................................................. 118
3.5.3 Parameters and functions for the simulation of water mass transfer at
coffee bean surface. .............................................................................................. 119
3.5.4 Model simulation results. ....................................................................... 121 CONCLUSIONS .......................................................................................................... 129
REFERENCES ............................................................................................................. 131
vii
TABLE LISTING
Table 1. Main green coffee producing countries (2000-2004) (FAO, 2008)....................... 5
Table 2. Evaluation of three Aspergillus species commonly found in coffee (Frank,
2000). ..................................................................................................................... 15 Table 3. Incidence of ochratoxin A in green coffee in the world (FAO, 2008). ................ 16
Table 4. Water activity for various saturated salt solutions at 30°C given by standards and measured by the mechanical method (Ouoba et al., 2010)................................. 32
Table 5. Saturated salt solutions used for determining the sorption isotherm of different parts of the coffee bean. (Norm NF X 15-119). ....................................................... 57
Table 6. Maximum moisture content (Xlimit) for different media estimated from Figures 59 and 60. ............................................................................................................... 96
Table 7. Estimated GAB parameters for three types of soils, wood and coffee bean. ....... 99
Table 8. Estimated Ferro-Fontan parameters for three types of soils, wood and coffee
bean. ..................................................................................................................... 100
Table 9. Summary of the estimated water transfer coefficient in the parchment at
different water activity gradients. .......................................................................... 112
Table 10. GAB and Ferro-Fontan parameters used in the numerical simulation of water
transfer in coffee bean surface. .............................................................................. 120
Table 11. Experimental drying air values used in the numerical simulation of water
transfer in coffee bean surface. .............................................................................. 121

viii
FIGURES LISTING
Figure 1. Coffee bean cherry. ............................................................................................ 4
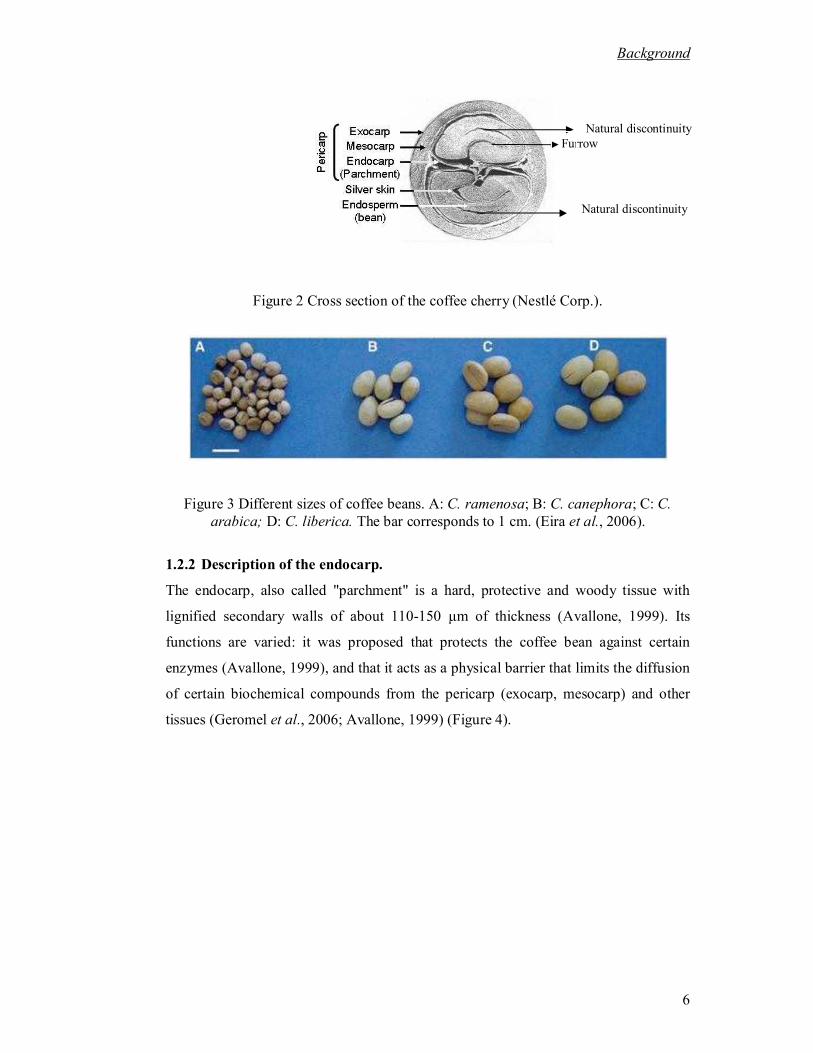
Figure 2 Cross section of the coffee cherry (Nestlé Corp.). ............................................... 6
Figure 3 Different sizes of coffee beans. A: C. ramenosa; B: C. canephora; C: C. arabica; D: C. liberica. The bar corresponds to 1 cm. (Eira et al., 2006). .................. 6
Figure 4 Cross section of the inner pericarp of the coffee berry. Pa: endocarp (parchment), Sc: sclerenchyma, EI: internal epidermis, PC: Cell walls (Avallone,
1999). ....................................................................................................................... 7 Figure 5. Observations of the structure and arrangement of coffee bean cells stained
with Alcian blue (A-D) and made by scanning electron microscopy in a half coffee (E-G) (Sutherland et al., 2004). ...................................................................... 9
Figure 6. Appearance of the embryo in the endosperm coffee bean (Eira et al., 2006). .... 10
Figure 7. Post-harvest coffee treatments.......................................................................... 11
Figure 8. Structure of ochratoxin A (OTA). .................................................................... 14
Figure 9. Chemical shift images of the water distribution in a native coffee bean. ........... 19
Figure 10. Distribution of water in the coffee beans (Frank, 2000). ................................. 20
Figure 11. Schema showing the principle of the tensiometer. .......................................... 25
Figure 12. General device used in the determination of water sorption isotherms. ........... 27
Figure 13. Schema showing the principle for the measure of the chemical potential of a
solution in a capillary media. .................................................................................. 28
Figure 14. Schema of the device used to determine water activity by the mechanical
method (Ouoba et al., 2010). ................................................................................... 30
Figure 15. Schematic representation of temperature, T, and total gas pressure, Pg,
evolutions during an experiment composed of 3 equilibrium stages......................... 30 Figure 16. Variation of measured water activity values by the mechanical method as a
function of the values reported at the norm NF X 15-119. (Ouoba et al., 2010). ...... 32 Figure 17. Local isotherms for the adsorption process of chilies at different
temperatures (Kaleemullah and Kailappan, 2007). .................................................. 34 Figure 18. Variation of chemical potential of water in various complex media based on
moisture content...................................................................................................... 35 Figure 19. Ideal drying curve. ......................................................................................... 37
Figure 20. Moisture content profiles half a prolate spheroid in (a) l = ヾ / 2 and k = 0.15 and (b) l = ヾ / 2 and k = 0.4. Axis x and y are given in meters (Hernandez et al., 2008). ..................................................................................................................... 40
Figure 21. a) Diagram showing the distribution of parenchyma cells at coffee bean endosperm, and mucilage at natural discontinuity; b) Diagram showing the zones
where the diffusivity was measured in coffee bean and its corresponding values. .... 45 Figure 22 Experience carried out in a non uniform sample. ............................................. 50
Figure 23. Diagram of the experimental device used to estimate the diffusivity at different moisture contents. ..................................................................................... 59
Figure 24. Diagrams showing a) the installation and b) the final device conceived to
study the mass transfer in coffee bean parchment. ................................................... 63
Figure 25. Characteristic zones were cross-section (transverse) slices were performed
in coffee bean. ........................................................................................................ 65

ix
Figure 26a and b. Cross section slices of coffee endosperm in the hypothetical Zone A,
Region 1. In these slices, located near the embryo, it can be noticed an important
space where it should be placed at fresh state. ......................................................... 67
Figure 27a and b. Cross section slices of coffee endosperm in the hypothetical Zone A,
Region 2. The shape of the space corresponding to embryo begins to change.
Difference in the cellular shape is more pronounced................................................ 68
Figure 28a and b. Cross section slices of coffee endosperm in the hypothetical Zone A,
Region 3. In this part of the bean near to the middle embryo space is practically
imperceptible. A cellular layer surrounds all sections. ............................................. 69
Figure 29a and b. Cross section slices of coffee endosperm in the hypothetical Zone B,
Region 1. Arrows signals the structures that would form the furrow. ....................... 70
Figure 30a and b. Cross section slices of coffee endosperm in the hypothetical Zone B, Region 2. Natural discontinuity is more evident. Polyhedral and rectangular cell
shapes are also noticed. ........................................................................................... 71 Figure 31a and b. Cross section slices of coffee endosperm in the hypothetical Zone B,
Region 3. ................................................................................................................ 72 Figure 32. Photograph of the endosperm of the coffee bean. 100X objective. .................. 73
Figure 33. Characteristic zones were longitudinal cut slices were performed in coffee bean. ....................................................................................................................... 74
Figure 34. Longitudinal cut slice of the coffee bean from the hypothetical region 1. ....... 74
Figure 35. Longitudinal cut slice of the coffee bean from the hypothetical region 2. ....... 75
Figure 36. Longitudinal cut slice of the coffee bean from the hypothetical region 3. ....... 75
Figure 37. Longitudinal cut performed in a coffee cherry (De Castro and Marraccini,
2006). Upper structure (in) should correspond to Figure 44 and 45. ........................ 76
Figure 38. Longitudinal cut slice of coffee beans from the hypothetical region 4. ........... 76
Figure 39. Longitudinal cut slice of the coffee bean from the hypothetical region 5. ....... 77
Figure 40. Longitudinal cut slice of the coffee bean from the hypothetical region 6. ....... 77
Figure 41. Longitudinal cut slice of coffee bean from the hypothetical region 6. ............. 78
Figure 42. Structure observed in a longitudinal cut slice of coffee bean........................... 78
Figure 43. Longitudinal cut slice of coffee bean from the hypothetical region 7. ............. 79
Figure 44. Longitudinal cut slice of coffee bean from the hypothetical region 7. Part
naturally detached from the section when cut. ......................................................... 79 Figure 45. Longitudinal cut slice of the coffee bean performed at the hypothetical
region 8................................................................................................................... 80 Figure 46. Longitudinal cut slice of the coffee bean performed at the hypothetical
region 8. This slice was performed at coffee bean half. ........................................... 80 Figure 47. Photomicrographs of coffee bean parchment. ................................................. 82
Figure 48a and b. Images showing the presence of mucilage at the space near the furrow in a fresh stage (cross section). .................................................................... 83
Figure 49a and b. Longitudinal cut of coffee bean in a dried state. .................................. 83
Figure 50a and b. RMN images of a coffee bean a)without and b)with the lipid signal. ... 85
Figure 51. a) Schema showing the distribution of the different parts taken from the
coffee bean: (1) parchment, (2) the silver film covering part 1; The Part 1 form a
single piece (3); (4), (5) and (6) are all part of Part 2. b) Photograph of the same
parts. ....................................................................................................................... 87
Figure 52 a, b, c. Images obtained of the coffee bean given by the program
ImageWorks©, 2008. .............................................................................................. 88
Figure 53. Measure examples of internal parts identified in coffee bean. ......................... 88

x
Figure 54a and b. a) Isotherms of different coffee bean parts identified, coffee bean
extremities and the whole coffee bean at 35 °C. b) Isotherms of the coffee bean
parchment, endosperm, wood and agar gel. ............................................................. 90
Figure 55. Water chemical potential vs. moisture content plot for the coffee bean. .......... 91
Figure 56. Chemical potential vs. moisture content plot for the coffee bean in a
logarithmic scale. .................................................................................................... 92
Figure 57. Water chemical potential vs. moisture content plot for the coffee bean at
high moisture content values. .................................................................................. 93
Figure 58. Chemical potential vs. moisture content plot for several media. ..................... 94
Figure 59. Chemical potential vs. moisture content plot for the clay, clay-silty sand and
NASSO soil at the neighborhood of aw = 1. ............................................................. 95
Figure 60. Chemical potential vs. moisture content plot for the wood, the coffee bean parchment and coffee bean at high water activity values. ........................................ 95
Figure 61. Internal structure of hydrated agar gel. White parts represents the solid phase and gray parts represents water. X = 830%. ................................................... 97
Figure 62a and b. Internal structure of hydrated agar gel at a) X = 2000% and b) X = 3000%. ................................................................................................................... 97
Figure 63. Chemical potential vs. moisture content plot for several media. Estimated GAB and Ferro-Fontan (FF) model curves are also represented............................. 101
Figure 64. Experimental drying kinetics for coffee beans at 35 °C and 45 °C. ............... 104
Figure 65. Experimental drying kinetics for whole coffee beans and coffee beans cut in
half at 35 °C and 45 °C. ........................................................................................ 105
Figure 66. Change of the moisture content values of samples with and without silver
skin. Curves are presented in the same order than the labels; w/s skin represents
the samples without silver skin and s skin, with silver skin. Samples equilibrated
with salt solutions. ................................................................................................ 106
Figure 67a and b. Variation of diffusivity as a function of moisture content a) at water
activities lesser than 0.84, b) including high moisture contents. ............................. 108
Figure 68. Weight variation of the parchment with different chemical potential
gradients. Test made in order to discard leaks. ...................................................... 109
Figure 69. Weight variation of the parchment with different chemical potential
gradients. (int) refers to the salt solution that is at the interior of the cell and (ext) to the solution that is at the exterior of cell. ........................................................... 110
Figure 70. Water flux variation vs. time for tests with magnesium chloride and potassium chloride for three and five parchments. ................................................. 111
Figure 71. Variation of transfer coefficient trough parchment as a function of moisture content. ................................................................................................................. 113
Figure 72. Variation of the diffusivity as a function of moisture content for the coffee bean endosperm and parchment. ........................................................................... 113
Figure 73a, b and c. Photographs showing a common coffee bean and its defects: a)
common coffee bean with parchment (FDA, 2010), b) coffee bean with a
damaged parchment, c) coffee bean with a damaged endosperm. .......................... 114
Figure 74. Representation of the geometry and boundary conditions adopted for the
simulation of mass transfer at bean surface. .......................................................... 116
Figure 75. Kinetics of moisture content in different parts of the endosperm and the
parchment. Simulation performed with air experimental conditions. ..................... 121
Figure 76. Water activity values of different parts of the endosperm and the parchment.
Simulation performed with air experimental conditions......................................... 123
Figure 77. Profiles of water activity in the endosperm at experimental conditions. ........ 124

xi
Figure 78. Water activity values of endosperm and the parchment. Simulation
performed considering high relative humidity conditions of drying air. ................. 125
Figure 79. Profiles of water activity in the endosperm simulated considering high
relative humidity conditions of drying air. ............................................................. 126
Figure 80. Simulation of moisture content values of coffee bean endosperm with and
without parchment. ............................................................................................... 126
Figure 81. Simulation of water activity values of endosperm with and without
parchment. ............................................................................................................ 127
Figure 82. Water activity profiles of coffee bean endosperm without parchment. .......... 128

xii
SYMBOL LISTING
aw Water activity
C Concentration in kg m-3
C Molarity in gmol m-3
Dw Diffusivity in m2 s
-1
Dく Diffusivity obtained for each equilibrium moisture content
F Molar free energy in J gmol-1
G Gibbs free energy in J gmol-1
g Gravity in m2 s-1
kc Mass transfer coefficient in m s-1
used in equation 1.23
k Mass transfer coefficient in kg m-2
s-1
Keq Distribution constant between phases
l Thickness in m
L Phenomenological parameter used in equation 1.40
m Mass in kg
M Molar mass in kg gmol-1
n Mol number in mol
N Flux in kg m-2
s-1
P Pressure in Pa
Pveq Equilibrium vapor pressure in Pa
PL Pressure at the pores in Pa
Pvs Saturation vapor pressure in Pa
R Universal gas constant in J gmol-1
K-1
rp Resistance transfer coefficient in kg m-2
s-1
r Radius in m
S Entropy in J K-1
Sm Specific entropy in J K-1
gmol-1
T Temperature in K
t Time in s
V Volume in m3
Vm Molar volume in m3 gmol-1

xiii
v Velocity m s-1
x Molar fraction
X Moisture content in kg water kg dry solid-1
X* Dimensionless moisture content
Y Dry air moisture content in kg water kg dry air-1
SUBSCRIPTS
g , く Indicate different fluid phases
a Air
c Coffee
e Equilibrium state
en Indicates a property of the endosperm
g Gas phase
i Interface
L Liquid state
le Intercellular liquid water
m Mass
p Indicates a property of the parchment
s Saturated vapor
sup Coffee bean surface
se Intracellular liquid water
v Vapor phase
w Water
0 Initial condition
GREEK SYMBOLS
と Apparent mass density in kg m-3
Chemical potential in J kg-1
w* Real water density in kg m-3
j Entropy production in J K-1

xiv
つ Parameter associated with the solid phase
f Superficial tension in N m-1
ぃ Osmotic pressure in Pa
さ Dimensionless groups for the density and the specific heat
し Dimensionless latent heat
に Air viscosity in kg m-1
s-1
SUPERSCRIPTS
+ Reference state
B, C Indicate different values at the compartments in a capillary media
DIMENSIONLESS NUMBERS
Bi Biot number
NGr Grashof number
NSc Schmidt number

1
INTRODUCTION
Coffee is the second most important commercial product in the world (Kouadio et al.,
2007). Coffee cherries are subjected to two different post-harvest treatments where the
main objectives is to remove the various layers surrounding coffee beans and to dry the
beans to a certain value of water activity ( wa ) in order to prevent the growth of
microorganisms (Paulino de Moraes and Luchese, 2003; Suárez-Quiroz et al., 2004).
The most common treatment is called "wet". In this treatment, coffee cherries are first
put in a tank filled with water in order to separate the defective beans and to remove
the cherries pulp and mucilage. Then, the obtained coffee, called �washed coffee� is
dried. At the end of drying the coffee is called �parchment coffee�. In the other
treatment named "dry� the cherries are directly dried, obtaining grayish beans known
as "coffee coke" or �natural coffee�. After drying, the parchment and the other layers
covering the beans are removed with a machine to finally get the green coffee.
Regardless the post-harvest method, drying can be carried out directly to the sun
(natural) and/or artificially (using dryers). Drying has been identified as a step where
fungal contamination becomes more common (Frank, 2000; Paulino de Moraes and
Luchese, 2003; Taniwaki et al., 2003; Kouadio et al., 2007). Particularly, a fungus
identified at the drying of coffee beans, Aspergillus ochraceus (which abbreviates A.
ochraceus) reveals as a common host and a good producer of a toxin which have
teratogenic, immunotoxic and possibly neurotoxic and carcinogenic properties named
Ochratoxin A. Moreover, this toxin has a high thermal stability being stable at
temperatures of 250 ºC (FAO, 2008). Considering the risk that the presence of this
toxin signifies for the human health, fungus development should be avoided in order to
prevent OTA production. Among the factors that make suitable the drying step for the
fungal development, water activity reveals as the most important (Suárez-Quiroz et al.,
2004; Kouadio et al., 2007) meanwhile temperature affects the rate of production of
the toxin, but is not a limiting factor (Suárez-Quiroz et al., 2004). The optimal

2
conditions reported for the growing of A. ochraceus are at a water activity value of
0.95 and a temperature of 35 ºC and the minimal conditions are at a water activity of
0.80 and a temperature of 10 ºC (Suárez-Quiroz et al., 2004). From these conditions it
results that 0.8 is a critical value for the prevention of OTA production at coffee bean
drying for the whole coffee bean. However, during drying a water distribution inside
the bean is produced by the diffusion. Growing of A. ochraceus has been observed at
coffee bean surface; however fungal spores or hyphae develop at the scale of few
micrometers and therefore it seems important to determine the details of water
distribution rather than its average content (Frank, 2000).
In this sense, some works have been made in order to determine the water distribution
in coffee bean by using Nuclear Magnetic Resonance but leading to different results,
due to the fact that this technique can give important information but it should be
carefully interpreted (Mariette, 2004). Toffanin et al., (2001) find that the water
distribution in a rehydrated native green Robusta coffee bean is homogeneous. On the
other hand, Frank (2000) obtains images in a dry bean equilibrated at a water activity
of 0.93 showing that the bean water distribution is heterogeneous. Medias having
anisotropy in its cellular distribution or composition could lead to anisotropy in its
water distribution and/or of its transport properties. Coffee bean tissues have been
extensively studied, usually making cross sections, finding that its cellular structure is
different in different regions of the coffee bean (De Castro and Marraccini, 2006;
Sutherland et al., 2004; Eira et al., 2006) suggesting that coffee bean has an
anisotropic cellular structure. Then the best way to confirm the anisotropy of the
moisture content distribution and/or the transport properties in coffee bean is to
measure them.
From the different transport properties involved at drying, water diffusivity is one of
the most important because it becomes predominant at the internal transfer of water
(Geankoplis, 1998). It is a common practice to estimate the water effective diffusivity
by fitting an adequate Fick's second law equation to experimental drying kinetic
(Mulet, 1994; Maroulis et al., 1995; Wang and Brennan, 1995; Bialobrzewski and
Markowski, 2004; Efremov and Kudra, 2004; Hernández et al., 2008). Sfredo et al.,
(2005) and Correa et al., (2006) determine the water diffusivity in coffee cherries.
Both obtain the diffusivity using the Fick`s second law solution of Crank (1975) for a
sphere, geometry that approximates the coffee cherry shape. The values of water

3
diffusivity obtained by Sfredo were 0.1-1x10⁻¹⁰
m2 s
-1
at 45 °C and 0.3-3x10⁻¹⁰
m2
s-1
at 60 °C and those found by Correa are about 2.91 x 10⁻¹⁰
; 3.57 x 10⁻¹⁰
and 4.96 x 10⁻¹⁰
m2 s-1 at 40, 50 and 60 °C, respectively. Coffee cherries shape can be approximated by
a sphere, however coffee beans have not a spherical shape. Hernández et al., (2008)
investigated Fick�s second law solution considering a non-conventional geometry in
order to approximate the coffee bean shape: a prolate spheroid geometry.
Fick's second law was solved by Crank (1975) under different assumptions: the
diffusivity is constant, the initial water distribution is uniform, there are not
temperature variations, there is no shrinkage and the external mass transfer coefficient
is negligible. In many products with a complex multiphase structure such as wood and
pasta (Mrani I. et al., 2005), agar gel (Mrani et al., 1995), and latex (Auria et al.,
1991), water transfer is controlled by physicochemical and mechanical interactions at
the interfaces between phases: capillarity, osmotic effects, adsorption, mass transfer
between different microscopic structures, such as between liquid and gas phase (Bénet
et al., 2009) or between the cells and the cell walls. The transfer coefficient is not
constant, it depends on moisture content, and particularly it cancels when the moisture
content tends to zero. In this case, the direct use of Crank solutions may be
questionable.
Then the objective of this study is to determine, through microscopic studies and
punctual mass transfer measurements, the possible regions where fungus could
develop and therefore produce the OTA during drying. Therefore this paper deals with
the two following aspects: 1) Microscopic observation of coffee bean in order to
highlight the main parts of the bean, the different structures of these parts and the
heterogeneity of these structures in order to identify possible sites where
microorganisms could develop; and 2) Study of the relationship between water activity
and moisture content and of the transport properties of water depending on moisture
content of the parts that will be selected based on observations.
In a long term this information will be useful to model the water activity inside the
coffee bean during drying process and therefore to identify risk areas where fungus
could develop.

4
CHAPTER 1. BACKGROUND
1.1 Coffee.
Coffee tree is a perennial plant of the family Rubiaceae genus Coffea which can reach
a height of 6-8 m. Seventy botanical species are known, within which the best known
are Coffea arabica and Coffea canephora Pierre Linné ex Froehn, where Coffea
robusta Lindon is a variety (Avallone, 1999). At flowering, the flowers are arranged in
groups and give rise to a fruit commonly called cherries (Figure 1). The coffee tree
requires a hot and humid climate such as that existing in tropical and subtropical
regions.
Figure 1. Coffee bean cherry.
Coffee is the second product marketed worldwide (Kouadio et al., 2007), where
Mexico occupies the fifth position of the global production (FAO, 2008). According to
FAO (2008) coffee is sold in 78 countries around the world and 20 to 25 million
families (mostly small farmers), depend on its trade. Nineteen of these producer
countries (where coffee represents a large proportion of its exports) were responsible
for 90% of total world

Background
5
production and will account for about 15% of the profits from the coffee trade. Table 1
gives the main coffee producing countries as well as the quantity they produce.
Table 1. Main green coffee producing countries (2000-2004) (FAO, 2008)
Country Coffee production 2000 (ton)
Coffee production 2001 (ton)
Coffee production 2002 (ton)
Coffee production 2003 (ton)
Coffee production 2004 (ton)
Brazil 1, 903, 562 1, 819, 569 2, 649, 610 1, 996, 850 2, 475, 780
Vietnam 802, 500 840, 600 699, 500 793,700 834, 600
Colombia 636, 000 656, 160 690, 840 694, 080 663, 660
Indonesia 625, 009 575, 160 698, 589 702, 274 702, 274
Mexico 338, 170 302, 996 313, 027 310, 861 310, 861
1.2 Structure of the different parts of coffee bean present at drying.
1.2.1 Description of the overall structure of coffee bean.
The coffee cherry is classified as a drupe, i.e., within those fruits with fleshy mesocarp
and ligneous endocarp (Figure 2). From a morphological perspective, the coffee cherry
is an ellipsoidal fruit (about 1x2 cm) with two curved sides on one side and flat by the
other (Avallone 1999) having an elliptical or egg geometry, flat-convex, with a
division on the flat surface (Dedecca, 1957). Measures carried out on several seeds
show that the grain has an average length of 10 to 18 mm and 6.5 to 9.5 mm of wide
(Dedecca, 1957). Some species have smaller grains and C. ramenosa (5-7 mm long
and 3 to 3.5 mm wide), while others have larger grains and C. liberica (Figure 3). The
endocarp contains a grain with a green thin seed coat known as spermoderm or "silver
skin" which is a remnant of perisperm (Avallone, 1999). The proliferation of cells
during fruit growth is limited because the thickness of the mesocarp never exceeds 2
mm (Avallone, 1999). During ripening, fruit color changes from bright green to deep
orange-red depending on the species. The fruit is composed, like all berries, by a
pericarp covering the endosperm (seeds). The pericarp is composed of an exocarp
(skin), mesocarp (pulp and mucilaginous tissue) and an endocarp (parchment). The
pericarp corresponds to the fleshy part in drupes and its thickness varies from 1 to 1.7
mm depending on the species of coffee. (Avallone, 1999).
Background
6
Figure 2 Cross section of the coffee cherry (Nestlé Corp.).
Figure 3 Different sizes of coffee beans. A: C. ramenosa; B: C. canephora; C: C.
arabica; D: C. liberica. The bar corresponds to 1 cm. (Eira et al., 2006).
1.2.2 Description of the endocarp.
The endocarp, also called "parchment" is a hard, protective and woody tissue with
lignified secondary walls of about 110-150 たm of thickness (Avallone, 1999). Its
functions are varied: it was proposed that protects the coffee bean against certain
enzymes (Avallone, 1999), and that it acts as a physical barrier that limits the diffusion
of certain biochemical compounds from the pericarp (exocarp, mesocarp) and other
tissues (Geromel et al., 2006; Avallone, 1999) (Figure 4).
Furrow
Natural discontinuity
Natural discontinuity

Background
7
Figure 4 Cross section of the inner pericarp of the coffee berry. Pa: endocarp
(parchment), Sc: sclerenchyma, EI: internal epidermis, PC: Cell walls (Avallone,
1999).
1.2.3 Description of coffee perisperm.
The perisperm or silver skin is also called "integument", "test" or "spermoderm." Its
thickness is about 70 たm (Geromel et al., 2006) and it is formed by sclerenchyma cells
arranged longitudinally (Dedecca, 1957). At the beginning of its development, the
perisperm cells that are in contact with the endosperm cells lose their shape, indicating
cell death. It has been suggested that this is the reason why the perisperm is observed
as a thin layer, i.e. it is formed from the tissues that originally occupied the whole fruit.
The role of perisperm seems the transfer of molecules (whether sugars, organic acids,
and others) however there is some controversy: during growth, perisperm is a greenish
tissue suggesting that it may have important functions, as the translocation of
molecules to the endosperm (De Castro et al., 2005). Some observations have shown
the presence of close contacts between the perisperm and endosperm, which could
facilitate exchanges between these tissues, by passive diffusion or active transport (De
Pa
EI EI
Sc
PC

Background
8
Castro and Marraccini, 2006). However, for others perisperm could not only help but
limit the exchange of solutes (Geromel et al., 2006).
One particular characteristic of the silver skin is that it is highly attached to coffee
beans which make difficult its separation. At beans of high quality this attachment is
more important (Pereira-Goulart et al., 2007).
1.2.4 Description of the endosperm.
The endosperm is the part of the coffee bean which after post-harvest treatments will
be marketed as "green coffee" (De Castro and Marraccini, 2006).
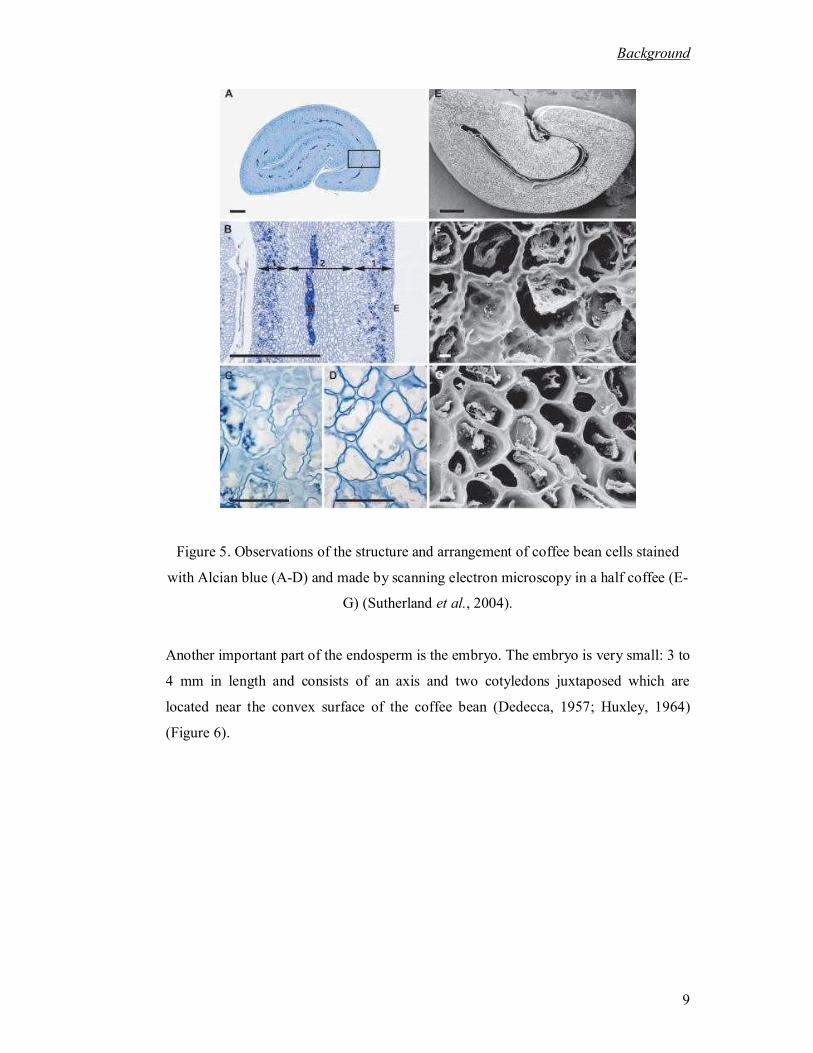
In the stage that includes the 130-190 days after fertilization, the cell walls look thinner
mainly by the deposition of polysaccharides, mainly a く-(1 s 4)-D-mannan, which is
slightly soluble (De Castro and Marraccini, 2006; Dentan, 1985; Redgwell et al.,
2003). This deposition results in the characteristic hardness of the endosperm
(Avallone, 1999).
At maturity (approximately 230 days after fertilization), the endosperm cells have
polyhedral shapes: the external cells have polygonal shapes and internal cells have
rectangular shapes (De Castro and Marraccini, 2006). Cells in the endosperm seem to
be divided into two clear regions based on the characteristics of the cell walls. Region
1, adjacent to the silver skin, has cells with walls of different thickness and can be seen
clearly filled with "points" (Figure 5 C, D and F) (Sutherland et al., 2004). These
"points" contain plasmodesmata connections between cells (Figure 5 C and D).The
axis of these cells seems oriented perpendicular to the silver skin (Figure 5 A, B and E)
(Sutherland et al., 2004). The second zone is situated in the center of this area of the
endosperm. In this region the cell walls have a more uniform thickness and its axis is
parallel to the silver film (Figure 5 A, B, G). As it can be seen cell distribution in
coffee endosperm is heterogeneous.
Background
9
Figure 5. Observations of the structure and arrangement of coffee bean cells stained
with Alcian blue (A-D) and made by scanning electron microscopy in a half coffee (E-
G) (Sutherland et al., 2004).
Another important part of the endosperm is the embryo. The embryo is very small: 3 to
4 mm in length and consists of an axis and two cotyledons juxtaposed which are
located near the convex surface of the coffee bean (Dedecca, 1957; Huxley, 1964)
(Figure 6).

Background
10
Figure 6. Appearance of the embryo in the endosperm coffee bean (Eira et al., 2006).
1.3 Post-harvest coffee treatments.
Coffee can be processed by two different post-harvest treatments, where the objective
is to remove the various layers surrounding the coffee beans and to dry the beans to a
value of water activity (aw) in order to prevent the growth of microorganisms and a
further fermenting process (Paulino De Moraes and Luchese, 2003; Suárez-Quiroz et
al., 2005). From the two different post harvest treatments the most common used is the
"wet" process because is associated with higher organoleptic quality coffee (Guyot and
Duris, 2002) and which name comes from the fact that coffee beans must be washed.
In this method coffee cherries are firstly put in a tank in order to separate the defective
beans. Then the cherries pulp and mucilage are removed. Once external layers
covering the beans are removed, coffee beans are dried. The coffee obtained after
drying, is called green coffee, or parchment coffee. The other treatment is called "dry
method�; cherries treated by the dry method, as its name suggests, are first dried often
using the sun. The beans obtained are grayish and are known as "coffee coke." After
drying, the parchment of the cherry is removed with a machine to finally get the green
coffee. These processes are schematized in the Figure 7:

Background
11
Figure 7. Post-harvest coffee treatments.
Stages of post-harvest treatments may have an influence on the contamination with
certain fungi, which can lead to mycotoxin production with harmful effects on human
health (Guyot and Duris, 2002). Within these fungi A. ochraceus has been identified as
a good producer of a toxin called ochratoxin A (OTA) (Frank, 2000) which possesses
nephrotoxic, carcinogenic and immunotoxic properties (FAO, 2008; Duris and Guyot,
2002).
There is no consensus on the exact stage at which contamination takes place. On the
one hand is considered that bad practices during harvest are responsible for the
contamination (Taniwaki et al., 2003), while for others, the fungus becomes more
common during the drying stage (Frank, 2000; Paulino de Moraes and Luchese, 2003;
Kouadio et al., 2007; Taniwaki et al., 2003; Mburu, 1999).
As shown in Figure 7, drying can be carried out using solar energy (natural) and/or
artificially (using dryers). Small producers do most of the drying using solar energy,
since artificial drying can consume a large amount of energy (Baker, 1998; Kemp,
2004), and raise production costs, condition that can negatively impact the process of
coffee production; however, different studies shows that this type of drying increases
the risk for the growth of fungi (Paulino de Moraes and Luchese, 2003; Taniwaki et
Depulping
Mucilage removal
(Fermentation)
Threshing
Artificial drying
Natural drying
Wet method
Dehulling
Dry method
Artificial
drying
Natural
drying

Background
12
al., 2003; Kouadio et al., 2007), whereas that, the risk decreases in artificial drying,
(Kouadio et al., 2007), making its practice desirable (Sfredo et al., 2005).
What could make drying suitable for toxin production? To answer this question it is
pertinent to consider the factors that affect toxin production in fungi.
1.4 Factors affecting the toxicity of fungi.
Mycotoxin production depends to a large extent in the species of fungus but also the
strain. The same toxin may be synthesized by various fungal species, but not
necessarily for all strains belonging to the species. Extrinsic factors, physical, chemical
and physico-chemical (water activity, temperature and substrate composition) also
influence the degree of toxicity.
1.4.1 Biological factors.
The spread of mycotoxins depends on physical-chemical factors, but also depends on
its potential for infection (intensity of sporulation and longevity of the spores). The
spread may be through air or water. As for the local area, this depends on the linear
growth rate, which means that the amount of toxin produced may be different
depending on the growth of a strain, if belonging to the same genus and species of
fungus.
By associating other species of toxic mold toxic strains in general, there is a depressive
effect on the production of the toxin. This is due to competition for the substrate and
the fact that some strains can degrade the toxin, on the other hand, the presence of
fungi in food is favored by insects or mites.
1.4.2 Intrinsic factors.
Among the toxic species, not all strains are toxic. Each strain is identified by a
potential that is expressed by the logarithm of the maximum concentration of toxin.
The initial amount of a toxic species is important because it reflects the risk of toxemic
impregnation, that is, the greater the presence, the higher the risk. To avoid
contamination, is almost necessary that harvesting, storage and handling where
impeccable.
Background
13
1.4.3 Extrinsic Factors.
a) Water availability
The availability of water or water activity is one of the most important factors resulting
in the toxicity of fungi. In certain mycotoxins it can be seen that after the growth of the
fungus, the toxicity is moderate and appears to be proportional to the water activity
value. If other factors are not limiting, it increases exponentially.
As toxin production depends in the presence of fungi, toxin production will be avoided
if fungi don�t develop.
b) The temperature
The optimum temperature for maximum toxin production is generally slightly lower
than the growth temperature. The temperature acts on the accumulation of toxins by its
direct effect on stability in food. Of all the factors, temperature-humidity ratio is the
most important.
c) pH
The pH directly influences the production of toxins. The optimum pH for maximum
production of toxin is, unlike for the temperature, different optimal growth pH.
d) The gas composition
The reduction of oxygen partial pressure and, above all, increased CO2 content has a
major depressant effect on the toxicity on growth. After foods are preserved in a
controlled atmosphere, where the development of fungi is controlled the presence of
air leads to rapid development of toxicity.
e) The substrate
Substrates, in general, provide the nutrients needed for development of fungi, however,
to use these nutrients must be a breach of natural defenses of the grains allowing
penetration and the rapid development of fungi. The toxicity depends more on this
growth factor.
From the different factors that affect the toxicity of fungi it results that the water
activity (aw) and the temperature have a great influence in toxin production. This
supports the idea that drying is suitable for fungus growing and toxin production. As
mentioned above, the toxin Ochratoxin A has been related with the drying of coffee
beans. In order to better understand its role in coffee bean process a discussion of its
chemical nature and its particular presence in green coffee will be presented.

Background
14
1.5 Ochratoxin A (OTA).
The Ochratoxin A or OTA is a mycotoxin found in various foods such as cereals,
wine, grape juice, beer, cocoa, spices and coffee. Its chemical structure consists of a
polyketide group linked through the 12-carboxy group to a phenylalanine; moreover it
has been identified that possesses teratogenic, immunotoxic and possibly neurotoxic
and carcinogenic properties (FAO, 2008).
Figure 8. Structure of ochratoxin A (OTA).
Due to its chemical structure, is soluble in most solvents, alcohols, ketones, benzene
and chloroform, but is not very soluble in water (FAO, 2008).
Other important feature of the OTA is its thermal stability: it should be kept at
temperatures above 250 °C to reduce its concentration.
The European Community plans to establish a standard for green coffee at 8 ppb (parts
per billion). According to studies made by the ISIC (Institute for Scientific Information
on Coffee) and ICO (International Coffee Organization), the adoption of this standard
quantity could eliminate from the trade, a quantity of coffee equal to the half of the
production of Indonesia, or equivalent to the total production of Ivory Coast and
Uganda, in Africa or from El Salvador and Costa Rica in Central America (Duris and
Guyot, 2002), situation that could affect the economy of these countries.
1.5.1 The OTA in green coffee.
OTA is produced in food by microorganisms such as Penicillinum verrucosum (cereals
in Europe), P. nordicum (flesh) and Aspergillus species, especially A. ochraceus and
related species (A. westerdijkiae and A. steynii), A. carbonarius and A. niger. The fact
that these organisms are commonly found in coffee beans does not mean they are good
Background
15
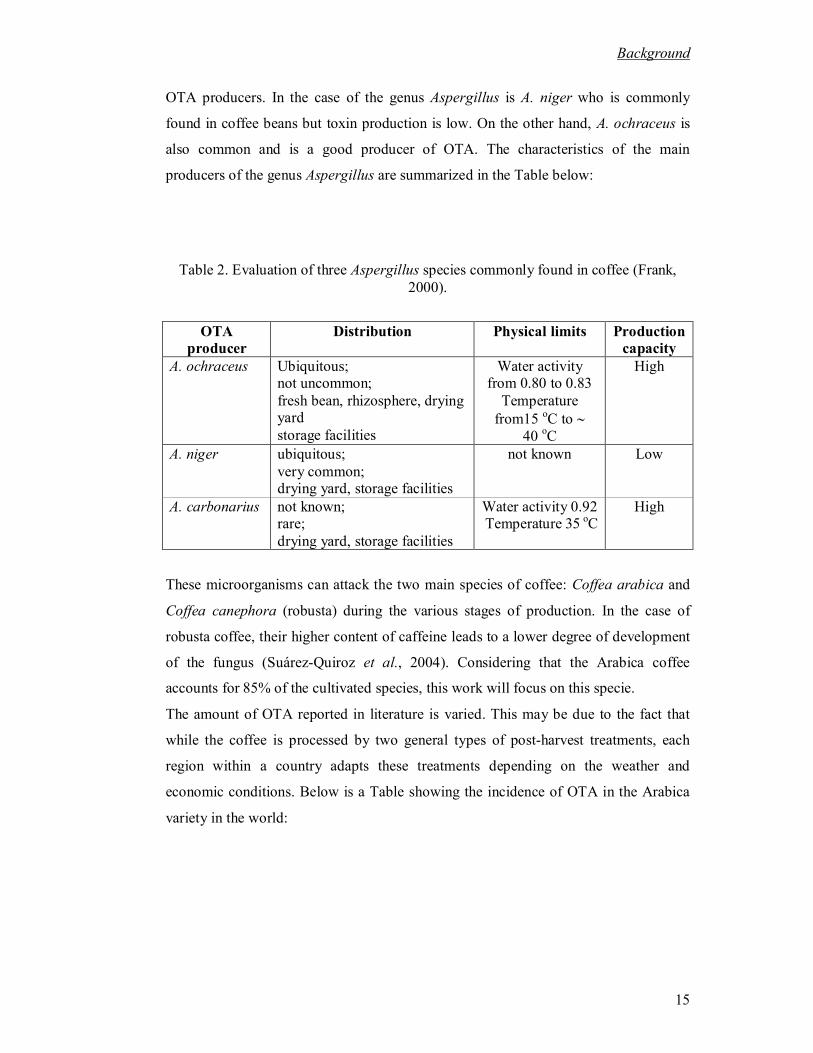
OTA producers. In the case of the genus Aspergillus is A. niger who is commonly
found in coffee beans but toxin production is low. On the other hand, A. ochraceus is
also common and is a good producer of OTA. The characteristics of the main
producers of the genus Aspergillus are summarized in the Table below:
Table 2. Evaluation of three Aspergillus species commonly found in coffee (Frank,
2000).
OTA producer
Distribution Physical limits Production capacity
A. ochraceus Ubiquitous; not uncommon;
fresh bean, rhizosphere, drying yard
storage facilities
Water activity from 0.80 to 0.83
Temperature
from15 oC to
40 oC
High
A. niger ubiquitous;
very common; drying yard, storage facilities
not known Low
A. carbonarius not known; rare;
drying yard, storage facilities
Water activity 0.92 Temperature 35 oC
High
These microorganisms can attack the two main species of coffee: Coffea arabica and
Coffea canephora (robusta) during the various stages of production. In the case of
robusta coffee, their higher content of caffeine leads to a lower degree of development
of the fungus (Suárez-Quiroz et al., 2004). Considering that the Arabica coffee
accounts for 85% of the cultivated species, this work will focus on this specie.
The amount of OTA reported in literature is varied. This may be due to the fact that
while the coffee is processed by two general types of post-harvest treatments, each
region within a country adapts these treatments depending on the weather and
economic conditions. Below is a Table showing the incidence of OTA in the Arabica
variety in the world:

Background
16
Table 3. Incidence of ochratoxin A in green coffee in the world (FAO, 2008).
Country Number of positive samples
from total
Detected amount of OTA (µg kg-1)
Brazil 27 / 132
9 / 135
5 / 40
20 / 60
22 / 54
17 / 37 9 / 11
15 / 30
0.7-47.8
0.2-100
0.4-4.82
0.2-7.3
0.3-160
0.2-6.2 0.01-1.6
1.0-133.7
Colombia 1 / 2 3 / 3
3.3 0.08-0.12
Costa Rica 1 / 2 7 / 9
Traces 0.02-0.12
Kenya 0 / 2 <0.01a
Mexico 1 / 2 1.4
Yemen 7 / 10 0.7-17.4
Tanzania 5 / 9 0.1-7.2
Ethiopia 0 / 1 <0.1a
Central America
0 / 12 <0.1a
United States 31 / 31 1.3-27.7
Different points can be highlighted from this Table. One is the difference in the
amount of OTA reported from the same country as in the case of Brazil. This confirms
the idea of the difference in the manner in which post-harvest is carried out. Also, the
incidence of OTA can be important in consumer countries as in the case of the United
States and Yemen. For other countries the incidence seems low but few samples where
analyzed as in the case of Mexico. Particularly a question arises: it is important the
quantity of OTA produced in coffee? From the published data it seems that the answer
is yes considering the difference in the amount that can be present. Moreover, other
authors report that some strains of A. ochraceus produce up to 16 000 g kg-1
(Palacios-Cabrera et al., 2004). To prevent the production of OTA in coffee the factors
affecting its production in coffee should be well established.

Background
17
1.5.2 Factors affecting the production of OTA by A. ochraceus in coffee.
The OTA was first detected in coffee by Levi et al. (1974) in 22 samples out of 335,
with concentrations between 20-360 mg kg-1. The minimum detection level was 20 mg
kg-1
, i.e., samples with a smaller amount, could not be detected. Later, in another
pioneering study conducted in 1980 (Levi, 1980) no contamination was detected in
coffee bean samples from Italy. However, 201 samples from the United States were
contaminated with quantities varying from 24 to 96 mg kg-1.
In order to establish the conditions in which OTA is produced, several authors have
studied the effects of environmental conditions on the toxicity and growth of A.
ochraceus, taking into account that, by preventing fungal growth, OTA production is
prevented (Suárez-Quiroz et al., 2004; Pardo et al., 2004). As exposed above, among
the factors that affect toxicity, the most important are the water activity and
temperature (Suárez-Quiroz et al., 2004; Kouadio et al., 2007).
Suárez-Quiroz (2004) not only studied the effect of these factors, but also the possible
effect of the post-harvest treatment on growth and toxicity, using a media based on
Arabica coffee beans. This study confirmed that the factors that have greater
significance on growth are aw, temperature and the temperature-aw interaction, and to a
lesser extent, the type of post-harvest treatment. They found that the optimal value of
aw for growth is 0.95 and the minimum value was 0.8. For temperature, maximum
growth was recorded at 35 °C and minimum at 10°C. The same factors were
significant for the fungus toxicity. The minimum value of aw where toxin production
was registered was at 0.9, i.e., conditions for toxin production are more limited than
that for growth, so in order to avoid toxin production, fungus development should be
prevented. On the other hand, the minimum temperature at which the fungus can
develop was at 10 °C, so temperature affects the rate of production of the toxin, but it
is not a limiting factor.
Among the factors that could also affect the presence of OTA in coffee beans there is
the post-harvest treatment. Moreover, specific stages as drying have been identified as
propitious for fungus development. These conditions will be discussed below.
1.5.3 OTA production in relation to post-harvest treatment and drying.
As mentioned above, coffee is subjected to two different post-harvest treatments: the
wet and dry methods. In order to study how the different stages in both processes

Background
18
affect the amount of OTA, Suárez-Quiroz et al. (2005) contaminated coffee bean
cherries and treated them by the two different post-harvest treatments.
In the case of the dry method, where coffee cherries are practically dried at the
beginning of the process (Figure 7), OTA formed in the pulp and skin, during the solar
drying of coffee cherries. This was confirmed by the concentrations of OTA found in
coffee beans which was 100 times lower than in the skin. This suggests that OTA
contamination should be carried out on the surface.
In the case of the wet method, good concentrations of OTA were found during the
fermentation stage (Figure 7), suggesting that the toxin spreads from the outer layers to
the parchment carried by the water. Tests made by the wet method also confirmed that
the contamination of the beans should be carried out on the surface; therefore the
elimination of the external layers that envelop coffee beans (Figure 2) should diminish
considerably the spread of OTA. Even if this is true presence of toxin should be
completely avoided because if it is already present in coffee bean some toxin could
spread to the beans as it has been observed in soluble and roasted coffee (Tsubouchi et
al., 1985; Studer-Rohr et al., 1994a; 1994b; 1995; Koch et al., 1996; Pittet et al.,
1996).
Among the different stages of post-harvest treatment, drying is one that has been
identified as critical to the development of the OTA. This situation is partly due to
environmental conditions in which the drying is carried out, but also to the poor
conditions of the places where drying is carried out. At natural drying several
conditions are identified as suitable for the development of A. ochraceus: the lack of
cleanliness of the areas were the drying is carried out, the insufficient size of drying
areas in some cases; inappropriate drying climatic conditions (drying when fog is
present); the direct drying on the ground. Also at drying some conditions can lead to a
heterogeneous drying as the incorrect distribution of coffee beans and its low removal
at the drying surface areas (Taniwaki et al., 2003; Paulino de Moraes et al., 2003).
Natural drying also takes place at longer times. Mburu (1999) shows that during the
natural drying, the aw diminishes very slowly and the coffee beans remain at aw
between 0.85 to 0.99 for 5 to 7 days with 2 to 4 days at 0.99. Kouadio et al. (2007)
conducted a natural drying, where, for ten days, the aw was over 0.8, i.e. at conditions
propitious for fungal growth.

Background
19
These conditions are different at artificial drying. The decrease of the moisture content
is achieved in less time than in natural drying and the temperatures registered at high
enough (~ 42 °C) to prevent fungal growth.
Fungal growth as exposed before depends on the water activity value at coffee bean.
As 0.8 is the limit value at which growth is registered in the whole bean, it represents a
critical value to prevent fungal growth and therefore OTA production. However 0.8 is
an average value of water activity of coffee bean, i.e. this value could not reflect what
happen with the water distribution at coffee bean endosperm.
In this sense Toffanin et al. (2001) took an image of a rehydrated Vietnamese robusta
coffee bean using Magnetic Resonance Imaging scan (MRI). The image revealed a
homogeneous water distribution (Figure 9). However, Frank (2000) took an image by
the same technique of a rehydrated coffee bean equilibrated at a water activity of 0.93.
The image revealed that the water distribution is not uniform; particularly close to the
"furrow" (Figure 10). The furrow is a natural entry in coffee bean endosperm which is
named in this way for its shape (Figure 2). As moisture content seems higher in this
part and therefore the water activity he considers that this distribution could impact the
contamination by A. ochraceus. No physical explanation is given to explain the
difference in water distribution but if there is one it should be attributed to a difference
in the composition or anisotropy of the tissues.
Figure 9. Chemical shift images of the water distribution in a native coffee bean.

Background
20
Figure 10. Distribution of water in the coffee beans (Frank, 2000).
Medias having anisotropy in its cellular distribution or composition could lead to
heterogeneity in its water distribution and / or of its transport properties. Coffee bean
tissues have been extensively studied, often making cross sections, finding that its
cellular structure is different in different regions of the coffee bean as have been shown
in section 1.2.4 (De Castro and Marraccini, 2006; Sutherland et al., 2004; Eira et al.,
2006). This suggests that coffee bean has an anisotropic cellular structure. Moreover,
anisotropy of cellular distribution can lead to heterogeneity of transport properties. If
heterogeneity of moisture content or transport properties in coffee bean exists it should
be important to study it for the implications it has at drying. One is because possible
zones where suitable conditions for fungus development could be present. Moreover
this would not only impact the drying process but other processes where water transfer
is implicated as in storage. The other is for the approach of drying modeling. When
these heterogeneities are present, the common variable to express the gradient used to
describe the mass transfer at drying, i.e. the moisture content is not enough. Instead of
moisture content, water activity or chemical potential should be considered to better
describe the process (Bénet, 2007). This would be discussed below.
1.6 Water disponibility, activity and chemical potential.
Heterogeneous media as soils, gels and food are characterized by interfacial
interactions (capillarity, adsorption). These interactions literally fix the water at the
media. Therefore plants and microorganisms must expend energy to extract the water
from media.
To characterize the thermodynamic state of a pure liquid phase in a heterogeneous
media we can use the pressure of the liquid phase or, in the case where a gas phase is
present, by the difference between liquid and gas pressure phases. The use of these
Background
21
parameters, derived from the soil mechanics (Fredlund and Xing, 1994), is limited to a
particular geometry of water. In this, the liquid and gas phases are separated by a
curved interface where the concavity is directed towards the gas phase. In this state,
called capillary, the equilibrium state between the liquid and gas phases is governed by
the laws of Laplace (Guggenheim, 1965) and Kelvin (Defay et al., 1966), in which
appears explicitly the radius of menisci. For the gels, foodstuffs, and biological tissues,
properties of the liquid phase are strongly affected by the liquid-solid interfaces and
the pressure of the liquid phase is difficult to measure.
Another way to measure the thermodynamic state of a component is to use the
chemical potential (Edlefsen et al., 1948; Low, 1961). Water activity is an equivalent
term for the chemical potential and both will be used subsequently.
The chemical potential gradient governs the mass transfer of a constituent in the same
way that the temperature gradient governs the thermal energy transfer. It is the driving
force in the mass transport by diffusion and filtration (Müller, 2001). The concept of
chemical potential is not limited by the geometry of liquid phase in the media.
Furthermore, at thermodynamic equilibrium, it can be defined for a constituent
belonging to one or several phases, or to different parts from a heterogeneous media,
as in the case of water in the cellular walls, intercellular water in foodstuffs, and water
vapor.
The chemical potential provides information on water availability and it contributes to
the knowledge of the conditions for development of microorganisms on food products.
In this sense, is a link between physics of heterogeneous media and biology.
Besides the applicability of chemical potential it is necessary to have the possibility to
measure it. Its measure is based in its expression which will be discussed below.
1.6.1 Chemical potential expression.
Considering a phase with one constituent, the extensive entropy (S), the volume (V),
and the constituent mass (mi), are related by the Gibbs-Dunhem equation
(Guggenheim, 1965):
0 mdVdPSdT
(1.1)

Background
22
Where the extensive entropy S is given in J K-1
, T the temperature is given in K, P the
pressure is given in Pa, the mass is given in gmol and the chemical potential is given
in J gmol-1
. Then, the differential expression for the chemical potential is written as:
dPVdTSd mm
Where Sm is the specific entropy in J K-1
gmol-1
and Vm the molar volume in m3 gmol
-1.
In the case of an isothermal transformation, equation 1.10 results in the next
expression:
dPVd m
This is the fundamental equation to express the chemical potential for ideal
thermodynamic systems: ideal gas or solution. How they can be expressed will be
discussed subsequently.
1.6.1.1 Ideal Gas.
The chemical potential of an ideal gas can be calculated from equation 1.3. From the
ideal gas law, Vm results in:
MP
RTVm
Where R refers to the universal gas constant in J gmol-1
K-1
and M refers to the molar
mass in g gmol-1
. If we integrate equation 1.3, considering an isotherm transformation
between a reference state with a pressure denoted by P+
, and another state which
pressure is denoted by P, we obtain:
PM
RTTPT ln,
(1.2)
(1.3)
(1.5)
(1.4)

Background
23
Where +(T) is the reference chemical potential evaluated at the temperature T and at
the reference pressure P+.
1.6.1.2 Ideal solutions.
The determination of chemical potential for ideal solutions is based in the property of
the free enthalpy for a mixture. According to Guggenheim (1965) this property is
expressed as:
ii
iii x
M
RTPTGnG ln,
Where Gi (T, P) is the free enthalpy of the constituent i at the pure state in J gmol-1
K-1
,
evaluated at T and P conditions. The molar fraction of the constituent i is defined by:
j
j
ii
n
nx
And by:
1
1
n
i
ix
As the chemical potential definition depends on property G, chemical potential can be
for an ideal solution can be written as:
i
i
i
jimPTi
i xM
RTPTG
m
G
j
ln,
,,
Combination of the equation 1.5 and 1.9 gives, for the ith constituent of an ideal gas
mixture the expression:
(1.6)
(1.7)
(1.9)
(1.8)

Background
24
ii
i xM
RTP
M
RTT lnln
Where PPx ii . Pi refers to the partial pressure of the constituent i, resulting in the
relation:
ii
ii PM
RTT ln
1.6.1.3 Chemical potential determination.
There are currently no simple devices, as the thermocouple or the pressure sensor,
which can easily measure the chemical potential. Its measure is based in its
fundamental property, for reversible transformations. In this case, the chemical
potential of any specie has the same chemical potential value in every part of the
system where it is present and where its different parts are in contact by permeable
frontiers to the so-called specie. When this condition is achieved, the determination of
chemical potential in one part of the system gives its value in the other parts, so it can
be said that the part of the system used to measure the chemical potential behaves as a
measurement device. Despite the difficulty to build semi permeable membranes
adapted to one chemical specie, different methods to measure the chemical potential
has been successful used at different media. These methods will be discussed below.
1.6.1.3.1 Methods used at capillary media.
The equilibrium of molecules in a liquid-gas interface implies the apparition of
tangential forces, which are higher and affect the molecules near the interface
compared to the forces that affect the molecules at the interior of a liquid. This
behavior results in a modification of the chemical potential of the liquid compared to
that of pure water in the free state. A capillary media is characterized by superficial
liquid-gas layers which by their curvature maintain a pressure difference between the
two fluids. We can suppose as in the Young model, that the thickness of the superficial
layers is very low, so the pressure difference is given by the Laplace relationship:
(1.10)
(1.11)

Background
25
rPP wg
2
Where Pg and Pw are the gas phase and water pressure respectively in Pa, f is the
superficial tension in N m-1
and r is the radius of the meniscus in m.
The tensiometer allows to measure the water pressure, when water pressure is not very
low as in the case of soils. The tensiometer (Figure 11) has a porous stone that acts as a
semi permeable membrane for water. The water chemical potential affected by the
liquid-gas curve interfaces is given by:
*w
ww
PT
Where + depends on temperature, Pw is the water pressure measured at the
tensiometer reservoir and w* is the real water density in kg m-3
.
Figure 11. Schema showing the principle of the tensiometer.
(1.12)
(1.13)
Gas phase Porous stone
Water reservoir
Tarpaulin
Capillary water

Background
26
When moisture content at capillary media diminish, the measurement at tensiometer is
more difficult because the radius of meniscus diminishes and a phenomenon called
cavitation appears. This problem can be partially treated by the augmentation of the
gas phase pressure as shown in equation 1.13. If the superficial tension and the radius
of meniscus are kept constant, and augmentation of gas phase pressure will increase
the water pressure allowing to extend the interval of possible measured pressures.
1.6.1.3.2 Hygroscopic media.
A hygroscopic media is characterized by the deviation of the water vapor pressure
compared to the saturation pressure. This deviation can result from the curvature of
gas- liquid surfaces or by water adsorption at the surface. This case can be
conceptualized as if liquid phase is adsorbed to the surface of solids grains with porous
structure. Kelvin relationship gives the deviation of water vapor pressure compared to
the saturation pressure as a function of the radius of a water vapor bubble (r) in
thermodynamic equilibrium with liquid water:
rRT
V
P
P m
vs
v
2
ln*
Where Pvs is the saturation water pressure in Pa. The Kelvin relationship can be only
applied for a particular media geometry where a convex meniscus is oriented to the
phase of higher pressure, but, in this case, the deviation from Pv compared to Pvs is
small. In other, this condition is achieved at high water activity values which restrict its
application. A more general method is the determination of water sorption isotherms.
1.6.1.4 Water sorption isotherm method.
In this method, the complex media is in contact with a saturated salt solution (Figure
12) at a given temperature. The saturated salt solution fixes the water vapor pressure to
precise values depending on each solution and the media surface acts as the semi
permeable membrane to water. At equilibrium, the chemical potential fundamental
property can be applied, i.e.:
(1.14)

Background
27
vs
v
www
P
P
M
RTT ln
As wvs
v aP
P
equation 1.15 can also be written as:
ww
ww aM
RTT ln
Moreover, equation 1.15b shows that water activity at media is equal to water relative
humidity of the surrounding environment at equilibrium.
Figure 12. General device used in the determination of water sorption isotherms.
1.6.2 Solution in a complex media.
To show this method (Bénet and Mignard, 1985), we will consider a capillary porous
media containing a solution (Figure 13). This media is in contact by a porous stone to
another compartment containing the same solution in capillary media. Both are in
contact with another compartment fill with pure water and separated from B by a semi
permeable membrane to water.
(1.15a)
Water vapor in equilibrium
Media
Saturated salt
solution
(1.15b)

Background
28
Figure 13. Schema showing the principle for the measure of the chemical potential of a
solution in a capillary media.
At equilibrium, chemical potential is the same in the three compartments. The
chemical potential can be calculated at C where it can be expressed as:
*w
Cw
ww
PT
Where PwC
is the pressure at compartment C.
Osmotic pressure () can be found by the pressure difference at C and B
compartments:
Cw
BL PP
The porous stone assures that the pressure is continuous, so that:
*L
BL PP
Where PL* is the pressure of pores at media in compartment A in Pa. By the
combination of equations 1.16, 1.17 and 1.18, we can obtain an expression for the
water chemical potential at compartment A (Ruiz and Bénet, 1998):
*
*
w
Lww
PT
(1.16)
(1.17)
(1.18)
(1.19)
Gas phase
Liquid phase
Solid phase
Porous stone
Semipermeable
membrane to
water
A B C

Background
29
In the case of an ideal solution of several species, is given by:
i
LiCRT *
Where CLi* is the molarity given in gmol m-3 for the i constituent in the media
solution.
1.6.3 Mechanical method.
The chemical potential of the liquid can be evaluated through the chemical potential of
the vapor surrounding the porous sample, given by the relative humidity (RH)
(equation 1.23). The mechanical method allows to determine the direct equilibrium
vapour pressure (Pveq) at media instead of fixing the relative humidity of the
surrounding vapour as in the saturated salt solution method (SSS); and advantage of
this procedure is that the determination time is shorter and that it can be applied for the
other liquids than water (Ouoba et al., 2010).
The device that leads to measure the equilibrium vapour pressure is called �activity-
meter� and is schematized in Figure 14. It consists in a chamber where the sample (a)
is disposed up against a pressure transducer (b) and a temperature thermocouple (c)
(type K). Both the pressure transducer and the thermocouple allow to record the total
pressure of the gas phase, Pg, and its temperature, T, along the process. A piston pump
(d) is placed above the sample to impose a gas pressure below the atmospheric
pressure. The piston chamber volume is controlled by a screw system (e) with a
graduated ruler (f). O-ring gaskets ensure a perfect airtightness so that the system can
be considered thermodynamically closed. The whole device is placed in a thermo-
regulated bath to ensure a constant temperature.
The gas phase enclosed in the experimental device is composed of dry air and the
vapor of the compound adsorbed in the porous sample. In standing conditions, the
vapor is in equilibrium with the liquid, meaning that its partial pressure is equal to its
equilibrium vapor pressure, Pveq. Starting from an equilibrium situation, the principle
of an experiment consists in moving up the piston to a new position by using the screw
system and recording the evolution of the gas-phase pressure and the temperature.
After a while, the gas pressure tends to a constant value that defines a new equilibrium
(1.20)

Background
30
situation. This stage is repeated several times to provide a set of value triplets (Ti, V
i,
Pgi) i [1..ns], where Ti is the measured equilibrium temperature, Vi is the volume
imposed by the piston, Pgi is the measured equilibrium total gas pressure, and ns is the
number of equilibrium stages.
Figure 14. Schema of the device used to determine water activity by the mechanical
method (Ouoba et al., 2010).
The temperature, T, and total gas pressure, Pg, recorded through the data card
acquisition are schematized in Figure 15. This typical experiment is composed of 3
successive equilibrium stages (ns = 3) (Ouoba et al., 2010).
Figure 15. Schematic representation of temperature, T, and total gas pressure, Pg,
evolutions during an experiment composed of 3 equilibrium stages.

Background
31
Considering a sample at a given liquid content (w) the unknown physical quantities are
as follows:
� V0, the gas phase volume in the initial equilibrium position. This includes the pore
space inside the sample as well as the initial volume of the piston chamber and dead
volumes in the pressure transducer.
� na, the mole number of the dry air inside the device that remains constant because it
is a closed system.
� Pve, the equilibrium vapor pressure. Because the liquid amount evaporated during an
experiment is negligible, the liquid content, wl, is considered to be constant. This
assumption has been experimentally checked by measuring the liquid content before
and after each experiment. Therefore, the equilibrium vapor pressure, Pveq, can also be
considered constant.
By assuming that dry air behaves as an ideal gas, the gas pressure can be written for
each equilibrium stage as the sum of partial pressures of vapor and air:
i
i
aveaveig
VV
RTnPPPP
0
The ideal gas description is legitimate since air is far from its liquid-gas phase
transition. To determine the 3 unknown quantities described above, (V0, na, Pveq), 3
equilibrium stages are sufficient: (Ti, V
i, Pg
i ) i [1..3]. However, to increase
accuracy, 6-10 volume increments are performed. Thus, the 3 unknowns are identified
using a nonlinear least-squares minimization procedure based on the standard
Levenberg-Marquadt algorithm (Ouoba et al., 2010).
1.6.3.1 Validation of the method with saturated salt solutions.
In order to validate this method, tests were carried out with different saturated salt
solutions (Ouoba et al., 2010). These solutions samples were placed in a cup in the (a)
part at Figure 14. The different solutions used are shown at Table 4:
(1.21)

Background
32
Table 4. Water activity for various saturated salt solutions at 30°C given by standards
and measured by the mechanical method (Ouoba et al., 2010).
Salt water activity
from NF X 15-119
Measured
water activity
Lithium chloride, LiCl 0.113 0.002 0.1170
Magnesium chloride, MgCl2, 6H20 0.324 0.001 0.3283
Magnesium nitrate, Mg(N03)2, 6H2O 0.520 0.001 0.5213
Sodium chloride, NaCl 0.751 0.001 0.7537
Potassium sulfate, K2SO4 0.970 0.004 0.9692
Figure 16 represents the variation of measured water activity as a function of the water
activity values reported at the norm NF X 15-119. As it can be noticed, the precision of
the mechanical method is very high in all the water activity range of values measured
and it has been submitted to a patent.
Figure 16. Variation of measured water activity values by the mechanical method as a
function of the values reported at the norm NF X 15-119. (Ouoba et al., 2010).
The mechanical method is the last of several methods to measure the chemical
potential. As exposed at the beginning of the discussion about the chemical potential,
there is no simple device to measure it as a thermocouple, i.e. directly. Besides this,
chemical potential can reveal important information about the mass transfer and the

Background
33
state of the water molecules in a heterogeneous media. One way in which this state can
be studied is with the variation of the chemical potential with moisture content.
1.6.4 Variation of chemical potential with moisture content in a heterogeneous
media.
Chemical potential reflects the energetic state of a molecule, and it can describe
sorption. This is assessed by the relationship of chemical potential with moisture
content.
This relationship has been studied by some authors in different media (Rockland and
Nishi, 1980; Kaleemullah and Kailappan, 2007; Ouedraogo, 2008). Sometimes, it is
not called chemical potential but free energy (G) (Rockland and Nishi, 1980;
Kaleemullah and Kailappan, 2007). Despite the term difference, its mathematical
expression is the same than that of equation 1.15b.
In this work the original term proposed by Gibbs, i.e. chemical potential (), will be
adopted instead of free energy (G).
Rockland and Nishi (1980) pointed that the shape of the variation of chemical potential
with moisture content is associated to three straight lines. These straight lines were
defined by breaking points where each break point signified a change on the moisture
content binding characteristics as shown in Figure 17. They called these straight lines
as local isotherms.
The straight lines are obtained by the Henderson model. Other authors (Kaleemullah
and Kailappan, 2007), adopt this representation and agree that it gives information
about the different water sorption characteristics in different foods as chilies. However,
Iglesias and Chirife (1976) studied 176 different food isotherms, concluding that local
isotherms can not be used to give a precise and unequivocal definition of the physical
state of water in foods.
Ouedraogo (2008) studies the variation of chemical potential with moisture content in
other media including two food products. He does not link the curve to a particular
state of water, however he empathizes that in spite of the diversity of media
compaction and structure, the shapes of the curves are similar (Figure 18).

Background
34
Figure 17. Local isotherms for the adsorption process of chilies at different
temperatures (Kaleemullah and Kailappan, 2007).
Based on the similar characteristics in the shape of the different curves, he lists the
properties of the variation of chemical potential with moisture content:
when the moisture content tends to 0, the chemical potential tends to -∞,
therefore the vertical axis results in a vertical asymptote,
the chemical potential is an increasing function of moisture content;
For media with slightly deformable solid phase (soil, wood), when moisture
content (X) tends to the water saturation content (Xsat), chemical potential tends
towards the chemical potential of reference.
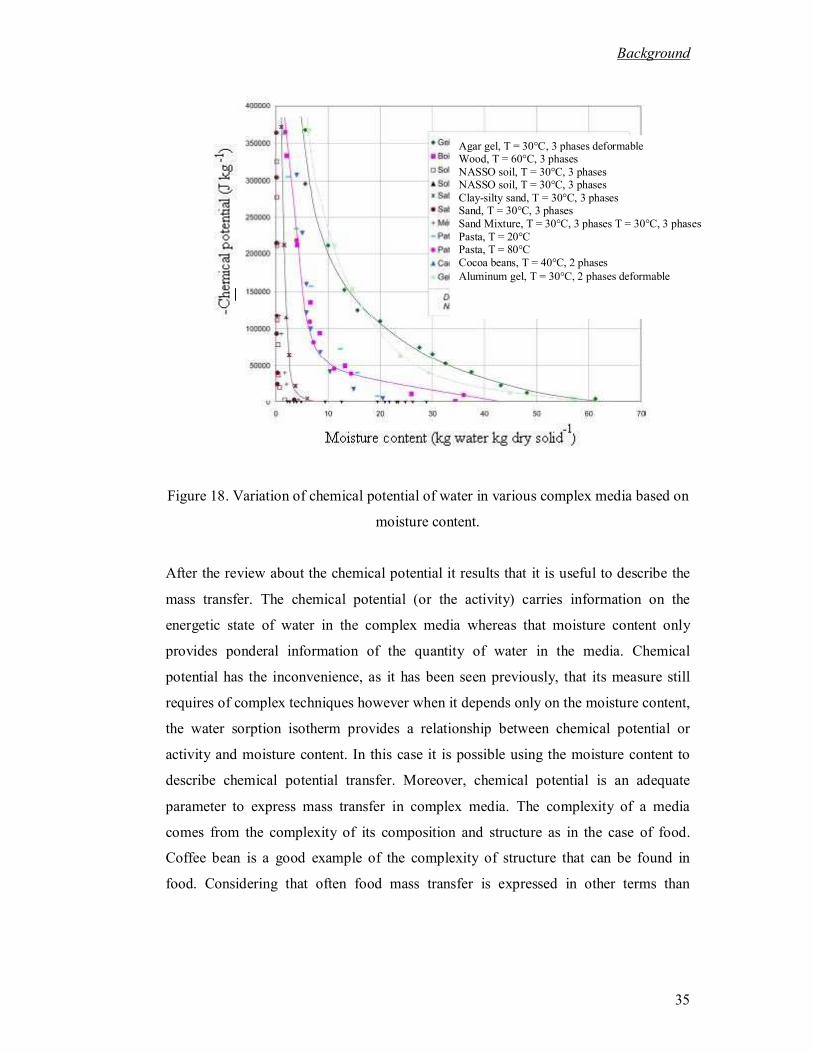
Background
35
Figure 18. Variation of chemical potential of water in various complex media based on
moisture content.
After the review about the chemical potential it results that it is useful to describe the
mass transfer. The chemical potential (or the activity) carries information on the
energetic state of water in the complex media whereas that moisture content only
provides ponderal information of the quantity of water in the media. Chemical
potential has the inconvenience, as it has been seen previously, that its measure still
requires of complex techniques however when it depends only on the moisture content,
the water sorption isotherm provides a relationship between chemical potential or
activity and moisture content. In this case it is possible using the moisture content to
describe chemical potential transfer. Moreover, chemical potential is an adequate
parameter to express mass transfer in complex media. The complexity of a media
comes from the complexity of its composition and structure as in the case of food.
Coffee bean is a good example of the complexity of structure that can be found in
food. Considering that often food mass transfer is expressed in other terms than
Agar gel, T = 30°C, 3 phases deformable Wood, T = 60°C, 3 phases
NASSO soil, T = 30°C, 3 phases NASSO soil, T = 30°C, 3 phases
Clay-silty sand, T = 30°C, 3 phases Sand, T = 30°C, 3 phases
Sand Mixture, T = 30°C, 3 phases T = 30°C, 3 phases
Pasta, T = 20°C Pasta, T = 80°C
Cocoa beans, T = 40°C, 2 phases
Aluminum gel, T = 30°C, 2 phases deformable

Background
36
chemical potential it will be convenient to consider the correct law to describe it. A
particular discussion will be presented subsequently.
1.7 Mass transfer in coffee bean.
Transfer processes are possible by the difference (or gradient) of a particular
parameter. In the case of momentum transfer viscosity is considered as the driving
force of the process. In the case of heat transfer, temperature gradient allows energy
exchanges. At mass transfer the driving force that leads to the mass exchange is the
chemical potential. However, most mass transfer processes, as drying, are usually
considered as governed by a concentration difference, which is expressed by moisture
content (Sfredo et al., 2005; Corrêa et al., 2006). The adoption of a concentration or
moisture content gradient has as advantage that mass transfer parameters, like
coefficient diffusion, could be determined experimentally using well known
methodologies, as in the case of drying experiments. By the other hand, it is
considered that chemical potential measure is complicated in food, situation that has
discouraged its use (Gekas, 2001). Moreover, during drying a water distribution inside
the bean is produced by diffusion. At coffee bean drying this has particular
implications because fungal growth has been observed at this particular stage of the
post-harvest treatment (Frank, 2000; Taniwaki et al., 2003; Paulino de Moraes et al.,
2003; Suarez-Quiroz et al., 2004); therefore it seems important to determine the details
of water distribution rather than its average content (Frank, 2000).
Then, what is the proper way to express mass transfer in coffee bean drying? The
answer seems to lie at media complexity, specifically, when media presents structural
or compositional heterogeneities as could be the case in coffee bean.
By the other hand, diffusion models considering moisture content concentration
provide important information at drying, moreover most drying coffee models are
expressed using this gradient. Its pertinence will be discussed below.
The study and simulation of coffee bean drying can be approached at two different
scopes:
As a whole bean which study is based in dryings curves and leads to the
measure of an effective diffusivity.

Background
37
At the tissue level which leads to the determination of a mass transfer
coefficient at the internal tissues in coffee bean.
These two scopes are complementary. The first one, which is the most developed until
now, allows to dimension the dryers and to analyze what happens at different drying
conditions. However, when considering coffee bean as a homogeneous continuous
media, it does not allow to approach the real field of the moisture content (or water
activity) and to judge the risk for the development of microorganisms in different sites
of the bean.
1.7.1 Bean level approach.
This approach is based in the drying kinetics curves. A drying ideal curve has two
distinct zones: zone I is known as the drying phase of constant rate and as its name
implies that water evaporates independently of moisture content. Zone II, is known as
the falling rate period. At this, drying is divided into two stages: at the first (Figure 19
IIa), wet zones near the surface, dries quickly. When the surface is dry, evaporation
from the center of the solid continues. It is commonly accepted that in zone II, the
mechanism that governs mass transfer is diffusion.
Figure 19. Ideal drying curve.
To simulate this process, equations are proposed to represent these phenomena. Drying
is a complex process because it involves a simultaneous transfer of mass and energy,
and there are different parameters that must be defined such as the diffusion transfer,

Background
38
and the transfer coefficient of mass and energy. Their correct determination is very
important to approximate the results obtained from the simulation of the process with
the experimental data.
1.7.2 Simulation of coffee drying.
Some studies have been carried out to study the coffee drying in different conditions
and approaches. Sfredo et al. (2005) studied the drying of coffee in a vibrating tray
dryer pointing out that this type of driers results in a more uniform drying, which can
reduce the risk of fungal contamination. To calculate the transfer of matter and energy
in this system, they proposed the following equations:
a
ca
ca
YY
TThk
TTA
Bdt
dX
h
sup
)(
Where X refers to the average moisture content of coffee beans in kg water kg dry
coffee-1
; h the coefficient of convective heat transfer W m-2
°C-1
; k the mass transfer
coefficient in kg m-2
s-1
; B is the mass flow of coffee beans in kg s-1
; そ the latent heat of
evaporation in kJ kg-1
; A the surface area of the coffee beans in m2; Ta the air
temperature in °C; Tcf the temperature of the coffee beans in °C; Ysup the absolute
moisture content on the surface of the coffee beans in kg water kg dry air-1 and Ya the
absolute humidity of air in kg water kg dry air-1.
As can be seen the equations proposed are issued from general balances used to
calculate the mass and heat transfer coefficients in a particular dryer configuration.
Moreover, the evolution of the air temperature is not considered but measured which is
part of the simplification of the proposed equations.
Hernández et al. (2007) worked on the modeling of heat and mass transfer of green
coffee beans, using a prolate spheroid geometry which resembles the geometry of
coffee beans. On this work, both, the variation of moisture content and temperature are
considered. The equations are expressed in a dimensionless form:
(1.22)
(1.23)

Background
39
2
22
22
2
222
22222
2
*2
22
2
*2*
sinsinh
sin,sin
sinh,sinh
sinsinh
sin,sin
sinh,sinh
1
u
u
uu
u
u
u
u
u
uR
R
cug
R
uuR
ucuguR
X
uR
R
X
cug
R
u
XuR
ucuguR
X
Where X* refers to the dimensionless moisture content; to the Fourier number; u, こ,
and l represent the prolate spheroidal coordinates; さ2 groups the dimensionless density
and specific heat; Ru is the upper limit of the domain u and ょ2 to the dimensionless
temperature. The boundary conditions for the �bottom�, i.e. when u = 0, for a quarter
of the prolate spheroid are given by:
2
*2
*1
,,
,
Biu
X
cugucug
XXXXK
Bi
u
X
cugggi
eoeq
m
Where せ refers to the dimensionless conductivity, Bi is the dimensionless mass Biot
number, し the dimensionless latent heat in J kg-1
, Keq the distribution constant between
phases, ぃ indicates a dimensionless group, Xけi refers to the absolute humidity of air at
the interface in kg water kg dry air-1
and Xけ is the absolute humidity of air in kg water
kg dry air-1 . Boundary conditions at surface are given by:
2
12
0
*1
)sin(sinh)sin(sinh
)sin(sinh
BiuR
R
uR
R
XXXX
BiX
uR
Rgi
e
m
This system of equations leads to the simulation of the evolution of the moisture
content profile in a part of the coffee bean (Figure 20 a, b). The scale that is on the
(1.24)
(1.26)
(1.28)
(1.25)
(1.27)
(1.29)

Background
40
right side of the figures indicates the dimensionless moisture content (1) value. The
results show that at shorter drying times (Figure 20 a, =0.15) a clear difference
between the center of the grain and the surface is present and that a longer times the
profile is more homogeneous (Figure 20 b, = 0.4). This work is an important effort to
represent the evolution of drying; however it still considers the grain as a
homogeneous continuous media with a constant effective diffusivity. Different results
should be obtained if the diffusivity will not be considered as constant.
(a)
(b)
Figure 20. Moisture content profiles half a prolate spheroid in (a) l = ヾ / 2 and k = 0.15
and (b) l = ヾ / 2 and k = 0.4. Axis x and y are given in meters (Hernandez et al., 2008).

Background
41
1.7.3 Determination of the effective diffusivity.
The effective diffusivity (effective diffusivity) can be estimated from Fick's second
law or experimentally. Fick's second law was solved by Crank (1975) for three
different geometries (infinite slab, cylinder and sphere), and under different
assumptions: the diffusivity is constant, the initial moisture content distribution is
uniform, there are not temperature variations, there is no shrinkage and the coefficient
of external mass transfer is negligible. At food area, several authors have adopted this
methodology for calculating the effective diffusivity (Balaban and Pigott, 1988; Banga
and Singh, 1994; Bialobrzewski and Markowski, 2004; Efremov and Kudra, 2004,
Hernández et al., 2000; Maroulis et al., 1995; Mulet, 1994; Ruiz Lopez et al., 2004;
Sapru and Labuza, 1996, Wang and Brennan, 1995). The determination of the effective
diffusivity can be done without making these assumptions; however a great variability
of the effective diffusivity for the same food can be obtained (Zogzas and Maroulis,
1996). Particularly, at coffee drying, effective diffusivity has been studied by several
authors at different levels: as an effective diffusivity in the whole bean (Corrêa et al.,
2006, Hernández et al. 2007; Sfredo et al., 2005), and in four different parts of coffee
bean endosperm (Toffanin et al., 2001).
Sfredo et al. (2005) determine the effective diffusivity in coffee processed by the dry
method, where external layers are not eliminated before drying, i.e. at coffee cherries.
Determination was made using the solution of Crank (1975) for a sphere, geometry
that approximates that of coffee cherry:
1
22
2
22
16
n
r
tDn
eo
e
ef
enXX
XX
Where Xe refers to the equilibrium moisture content in kg water kg dry coffee-1, Xo the
initial moisture content of coffee beans in kg water kg dry coffee-1, n the number of
terms considered in the summation, r the radius and Def the effective diffusivity in m2
s-1
. As a change of cherries radius with moisture content is observed, they propose an
empirical relation between the radius (r) and the moisture content:
(1.30)

Background
42
065296.0106992.121277.181
001249.0006351.0
Xer
Where the radius is given in m. Therefore when this equation is introduced at equation
1.39, they are trying to estimate the effective diffusivity as a function of moisture
content. The values of the diffusivities ranged from 0.1 to 1x10⁻¹⁰
m2 s
-1 at 45 °C and
from 0.3 to 3x10⁻¹⁰ m2 s-1 at 60 °C which are small if compared with that reported by
Correa et al. (2006) which obtained an effective diffusivity about 2.91 x 10⁻¹⁰; 3.57 x
10-10
and 4.96 x 10⁻¹⁰
m2 s
-1 at 40, 50 and 60 °C, respectively. These values were
calculated also from equation 1.39 without considering the variation of coffee cherry
radius with moisture content, i.e. considering that the effective diffusivity is constant
which explains the difference in both results.
Hernández et al. (2007) not only proposed a model to study the variation of moisture
content and temperature with a geometry close to that of coffee bean. They also
investigate Fick�s second law solution considering this geometry (prolate spheroid).
The values for this particular geometry were obtained from the plot of the
dimensionless moisture content vs. Fourier number. The resulting equation is shown
above:
2
3.12exp78.0l
tD
XX
XX ef
eo
e
Where l refers to the prolate spheroid focal distance in m. Dependence of the effective
diffusivity with moisture content and temperature was also considered. In order to
estimate this relationship the slope method was used. In this method experimental
slopes from the drying kinetics are calculated, and tacked as:
2exp
3.12
l
Dm
ef
(1.31)
(1.32)
(1.33)

Background
43
Where mexp is the slope of the experimental kinetics of moisture content in g water g
dry matter-1 s-1. Then, all of the diffusivities obtained are fitted with the Arrhenius
equation in order to model the temperature dependence. The final expression to
calculate the effective diffusivity is:
o
efX
X
RTD 74.1
4.668567085.2exp
As mentioned above this work studied the evolution of moisture content in the coffee
bean; however the complexity of the adopted geometry leads to a simplification for the
model. This simplification consists in considering that diffusivity inside coffee bean
was constant. It should be interesting to estimate the dependence of diffusivity not only
at the bean level but at the internal bean level, i.e. at coffee bean tissues.
1.7.4 Approach at the bean tissues level.
Diffusion is due to the random motions of molecules in a media where there is a
concentration gradient (Cussler, 1997). Diffusion is usually expressed in terms of
solute and solvent, taking into account a homogeneous medium. When the medium is
not homogeneous, it is assumed that there is an "effective" diffusion, which includes
the effects of ignorance of the internal pores geometry of the material in question.
(Cussler, 1997). This is generally accepted (Cussler 1997, Schenker et al., 2000),
however the "effective" diffusion includes many times, a set of transfer phenomena,
therefore, it is desirable to separate these phenomena.
Fick's law was established to describe the diffusion of a component in a solution or a
gas mixture. In this case, the transfer of momentum between the species that diffuses
and other species results from collisions at the molecular level; however this is not the
case in a complex media. A complex media can be represented by a polyphasic
structure, consisting of a solid, liquid and gas phase. At the same time these different
phases can be composed by several components which can exchange mass between
them. Media can have a large variety of structure which can be classified as follows:
Porous media which the solid phase is slightly deformable
Gels which have a strongly deformable solid phase
(1.34)
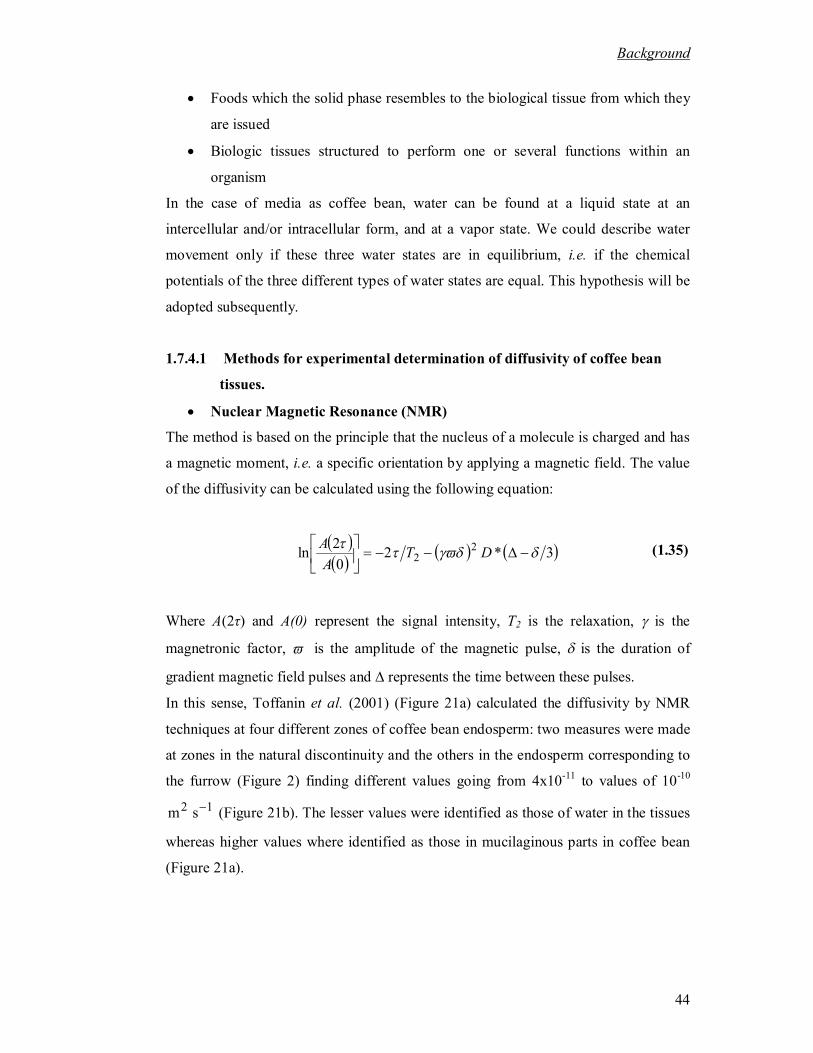
Background
44
Foods which the solid phase resembles to the biological tissue from which they
are issued
Biologic tissues structured to perform one or several functions within an
organism
In the case of media as coffee bean, water can be found at a liquid state at an
intercellular and/or intracellular form, and at a vapor state. We could describe water
movement only if these three water states are in equilibrium, i.e. if the chemical
potentials of the three different types of water states are equal. This hypothesis will be
adopted subsequently.
1.7.4.1 Methods for experimental determination of diffusivity of coffee bean
tissues.
Nuclear Magnetic Resonance (NMR)
The method is based on the principle that the nucleus of a molecule is charged and has
a magnetic moment, i.e. a specific orientation by applying a magnetic field. The value
of the diffusivity can be calculated using the following equation:
3*20
2ln
22
DTA
A
Where A(2k) and A(0) represent the signal intensity, T2 is the relaxation, is the
magnetronic factor, is the amplitude of the magnetic pulse, is the duration of
gradient magnetic field pulses and represents the time between these pulses.
In this sense, Toffanin et al. (2001) (Figure 21a) calculated the diffusivity by NMR
techniques at four different zones of coffee bean endosperm: two measures were made
at zones in the natural discontinuity and the others in the endosperm corresponding to
the furrow (Figure 2) finding different values going from 4x10-11
to values of 10-10
12 sm (Figure 21b). The lesser values were identified as those of water in the tissues
whereas higher values where identified as those in mucilaginous parts in coffee bean
(Figure 21a).
(1.35)

Background
45
Figure 21. a) Diagram showing the distribution of parenchyma cells at coffee bean
endosperm, and mucilage at natural discontinuity; b) Diagram showing the zones
where the diffusivity was measured in coffee bean and its corresponding values.
These lesser values found at cells tissues were attributed to the presence of cell walls,
which implies that they restrict molecular motion in a higher level than the mucilage
present in the other regions were measures were made.
However, mucilage is highly viscous therefore it does not seem the reason for the
difference of the diffusivity values.
Concentration-distance curves
The method is based on the measurement of the distribution of concentrations of the
substance that disseminates as a function of time. To know the distribution of
a
4.5 x 10⁻¹¹
m2 s
-1
5.7 x 10⁻¹¹
m2 s
-1
1.1 x 10⁻¹⁰
m2 s
-1
1.1 x 10⁻¹⁰
m2 s
-1
b

Background
46
concentrations it can be used methods as the light interference or gravimetric methods.
The analysis is based on Fick's equation (Zogzas et al., 1994; Auria and Bénet, 1990;
Auria et al., 1992; Mrani et al., 1995).
Permeation Methods
In this method the sample is placed between two solutions of different concentrations,
so that the sample behaves like a membrane.
After a certain period of time, the surface of the sample will have the concentration of
each solution, i.e., reach a steady state condition. In the case of a slab, this condition is
expressed by:
l
CCDN RBRA
Where N is the flux in kg m-2 s-1, D is the diffusivity in m2 s-1, CRA, and CRB are the
concentrations of the surfaces of the plate in kg m-3 and l is the thickness of the slab in
m. This method will be adopted to measure the diffusivity at some structures of coffee
bean.
1.7.4.2 Use of water chemical potential to describe the water transfer in coffee
bean tissues.
As it has been seen before, coffee bean as the most part of natural products (fruits and
vegetables) have a complex structure with different structures and tissues as the
endosperm and the parchment. The different structures found in coffee bean drying
could lead to discontinuities of the water transfer diffusivity which at the same time
could lead to great differences of the moisture content values. Moreover, progressive
differences of the tissues at the different parts of coffee bean could affect the water
transfer.
For this reason, the use of a diffusion law as Fick�s law with a constant diffusivity
value, uniform in the whole bean and independent from the moisture content seems
insufficient a priori.
On the other hand, chemical potential seems more adapted to describe the water
transfer by its definition and properties. It can describe water transfer in a media which
(1.36)

Background
47
has structure discontinuities and could have a variation of properties at its interior as
coffee bean.
Some of the basic properties of chemical potential have been already described. Now,
its concept would be used to describe the water transfer in the coffee bean tissues.
We will consider a complex environment consisting of a solid phase that can retain
water. In the case of coffee bean, we will consider that water can be at three different
forms: as intracellular liquid water (se), intercellular liquid water (le) and Vapor (v).
We will focus on water transport in the case of an isothermal media.
By neglecting gravity, the entropy production () is written (Bénet and Mignard, 1985;
Müller, 2001):
0)(1 vvvlelelesesese vvvT
Where refers to the apparent mass in kg m-3, v to the velocity in m s-1 and to the
chemical potential.
Assuming that local equilibrium exists between the three phases of water, according to
the fundamental property of the chemical potential:
gelese
This allows writing the equation 1.37 as follows:
0)(1 wwwvT
where とwvw is the total flux of water in its three phases in kg m-2
s-1
and µw refers to
water chemical potential, regardless water phase.
As the entropy production must be positive, we have:
wwww Lv
(1.37)
(1.38)
(1.39)
(1.40)
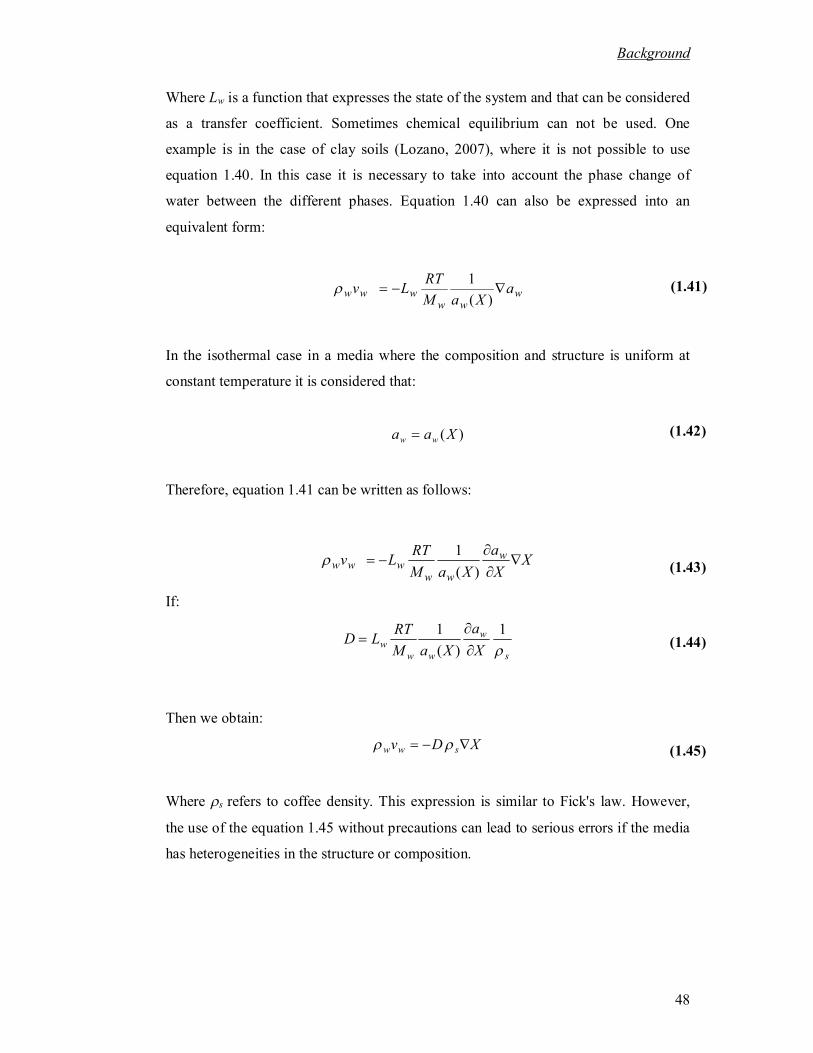
Background
48
Where Lw is a function that expresses the state of the system and that can be considered
as a transfer coefficient. Sometimes chemical equilibrium can not be used. One
example is in the case of clay soils (Lozano, 2007), where it is not possible to use
equation 1.40. In this case it is necessary to take into account the phase change of
water between the different phases. Equation 1.40 can also be expressed into an
equivalent form:
www
www aXaM
RTLv
)(
1
In the isothermal case in a media where the composition and structure is uniform at
constant temperature it is considered that:
)(Xaa ww
Therefore, equation 1.41 can be written as follows:
XX
a
XaM
RTLv w
wwwww
)(
1
If:
s
w
ww
wX
a
XaM
RTLD
1
)(
1
Then we obtain:
XDv sww
Where s refers to coffee density. This expression is similar to Fick's law. However,
the use of the equation 1.45 without precautions can lead to serious errors if the media
has heterogeneities in the structure or composition.
(1.41)
(1.42)
(1.43)
(1.44)
(1.45)

Background
49
If we consider a non uniformity at the macroscopic level as for example, a difference
of cells size or in the case of a porous media, a non uniformity of the pores size, water
activity can be expressed by:
,Xaa ww
Where refers to a parameter associated with the solid phase. Relationship 1.41 is
written as:
ww
wwwww
a
X
a
XaM
RTLv
),(
1
According to the signs of the terms, this relationships shows that water flux can be
opposite to the moisture content gradient. We could develop other cases by considering
the temperature, vapor phase pressure, and the deformation of the solid phase. Also in
this case, water flux is also opposite to the moisture content gradient.
To illustrate this we will consider a sample placed between two atmospheres
characterized by their activities aw1 and aw2. This sample is not uniform; in particular,
it presents different isotherms on the sides A and B (Figure 22). Two conditions will
be discussed: one where the transfer in the will carry out by the action of the gradients;
in the other one the sample will be turned. We will assume that the sample is thin so
that the gradients of all quantities (moisture content, activity, chemical potential) vary
linearly between A and B:
(1.46)
(1.47)
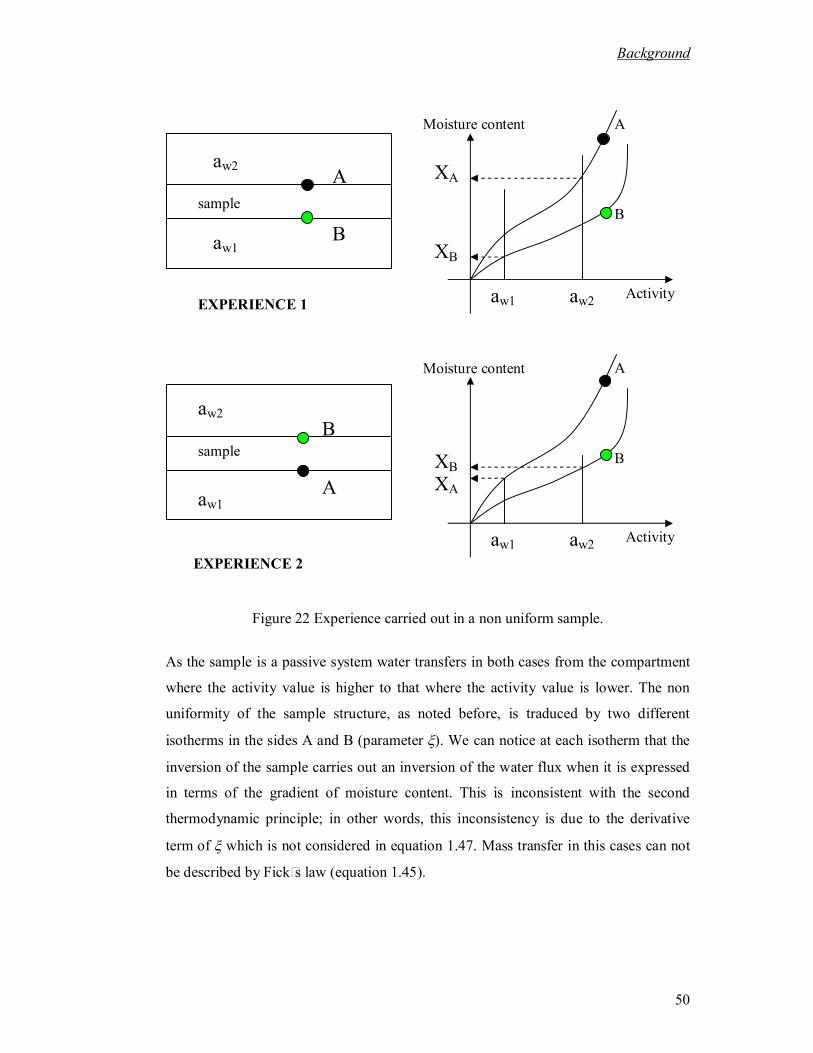
Background
50
Figure 22 Experience carried out in a non uniform sample.
As the sample is a passive system water transfers in both cases from the compartment
where the activity value is higher to that where the activity value is lower. The non
uniformity of the sample structure, as noted before, is traduced by two different
isotherms in the sides A and B (parameter ). We can notice at each isotherm that the
inversion of the sample carries out an inversion of the water flux when it is expressed
in terms of the gradient of moisture content. This is inconsistent with the second
thermodynamic principle; in other words, this inconsistency is due to the derivative
term of which is not considered in equation 1.47. Mass transfer in this cases can not
be described by Fick�s law (equation 1.45).
aw2
aw1
aw2
aw1
A
A
B
B
B
A
Activity aw2 aw1
XA
XB
A
B
Activity aw2 aw1
XA XB
Moisture content
Moisture content
EXPERIENCE 1
EXPERIENCE 2
sample
sample

Background
51
On the other hand, the existence of a discontinuity at media structure is related, if the
isotherms are different in both sides, with a discontinuity of the moisture content
value. Also discontinuity of water activity can be present.
A priori, we can not exclude the existence of non uniformities in coffee bean tissues if
considering the non uniformity of the cells size and its composition. Moreover, there
are evident discontinuities between the parchment and the silver skin; the silver skin
and the endosperm; the endosperm and the furrow.
The knowledge of these discontinuities is necessary to simulate the transfer into coffee
bean.
1.8 Background synthesis.
Coffee, second product marketed in the world, where Mexico is occupies the fifth
place of global production (FAO, 2008) must as all food products, be exempt of any
suspicion of contamination. In the subsequent processing of coffee for marketing
(post-harvest treatment), drying has been identified as one stage where the conditions
under which it is carried out (aw and temperature) may result in the development of
toxic microorganisms.
Among the identified mycotoxins that develop in coffee bean Ochratoxin A (OTA),
produced by fungi of the Aspergillus genre (particularly A. ochraceus), has been
particularly studied by its impact on human health, which includes teratogenic,
immunotoxic and possibly neurotoxic and carcinogenic properties, in addition it is
stable at high temperatures (FAO, 2008).
In the work done on the presence of OTA in coffee, Frank (2000) noted that A.
ochraceus is most common during the drying stage and that the removal of moisture
content is not carried out uniformly in the coffee bean which may pose a risk to fungal
growth if spores are present.
Observations of coffee bean structure highlight several discontinuities not only of the
general structure (furrow, parchment, natural discontinuity) but at the cell level. These
discontinuities could lead to heterogeneities of the moisture content distribution at
drying or storage and hence to zones which could favor the development of
microorganisms.
The development of microorganisms is closely linked to water availability in media.
Water activity quantifies the bonding between water and the solid phase in complex

Background
52
media. Besides the temperature other two thermodynamic terms seem to quantify the
link between water and the media: the chemical potential and the water activity.
On the other hand, drying per se is a relevant operation in the food processing, where
the diffusivity is an important transfer property for optimization, equipment
development and simulation of the process (Balaban and Pigott, 1988; Banga and
Singh, 1994; Bialobrzewski and Markowski, 2004; Efremov and Kudra, 2004;
Hernández et al., 2000; Maroulis et al., 1995; Mulet, 1994; Ruiz-López et al., 2004;
Sapru and Labuza, 1996; Wang and Brennan, 1995), moreover it has been identified as
an operation that consumes large amounts of energy (Baker, 2004; Baker and
McKenzie, 2002; Kemp, 2004; Kudra, 1998; Moraitis and Akritidis, 1996; Strawinski,
1982), which could increase production costs and therefore negatively impact the
coffee production process.
The diffusivity has a key role in drying simulation. The effective diffusivity quantifies
the global water transfer. It leads to dimension the dryers and to calculate the average
moisture content and water activity values at drying.
The effective diffusivity is commonly calculated from the drying curve data using a
solution from Fick's law solved by Crank (1975) for three ideal geometries: a plane
sheet, a sphere and a cylinder. For the implementation of such solution to the drying
data some assumptions are made which are not entirely valid.
Another alternative is to consider the mass transfer by diffusion in different parts of
coffee bean: endosperm, parchment and silver skin. The furrow (Figure 2) would
deserve a specific study considering its complex shape. The experimental study of the
diffusivity requires the proposal of a technique to obtain samples in these different
parts.
The calculation can also be done through thermodynamic expressions, such as water
activity or chemical potential. The latter has been proposed by some authors as a more
rigorous way to find the value for the diffusivity process (Bénet, 2007; Doulia et al.,
2000; Gekas, 2001).
Following the work made at coffee bean transfer, we considered important to describe
experimentally the transfer mechanisms in the different parts of coffee bean. Despite
the foreseeable difficulties that this could imply and effort should be made to try to
clarify the existence of moisture content heterogeneities.

Background
53
Another fact that emerges from literature is the importance of the study of the moisture
content at high values of water activity because it seems that is principally at this range
of values that heterogeneities and microorganisms could develop.
The studies that will be presented later will obey to two major scopes:
The consideration of the heterogeneities and discontinuities in the coffee bean.
The study at the high moisture content range.
In order to achieve these scopes a general objective was proposed.

54
1.9 Objectives.
1.9.1 General objective.
To describe the water mass transfer and the water activity distribution into the coffee
bean.
To achieve this general objective, some specific objectives were followed.
1.9.2 Specific objectives.
The specific objectives are:
To put in evidence the main parts of the coffee bean, its structure differences,
and the homogeneity of these structures in order to identify the possible sites
where the microorganisms could develop. According to the results obtained
experimental studies will be proposed,
Study of the relationship between the water activity and the moisture content
for different parts of the coffee bean. An effort will be made in order to
examine the heterogeneity of this relationship for some tissues. This
relationship will be examined particularly at high water activity values, in the
domain suitable for the development of microorganisms,
Study of the water diffusivity at two different scales: in the whole bean and in
the internal bean tissues. As the external surface of the bean is propitious for
the development of microorganisms, we will focus in the water transfer in the
external coffee bean structures: the parchment, the silver skin and the
endosperm,
Numeric modeling of the water transfer in coffee bean surface in order to put in
evidence the water activity profiles in the outside surface of the parchment and
in the interface between the parchment and the endosperm.
This first experiments should lead to numerical models for the simulation of moisture
content distribution and hence of the water activity in coffee bean during drying.

55
2 CHAPTER 2. MATERIALS AND METHODS
Several experimental devices were set in order to achieve the objectives that have been
fixed. We will distinguish between the experimental methods already known from the
experimental methods that were proposed during this thesis. The first consist in:
The observation and coloration of coffee bean slices and the parchment.
The determination of the effective diffusivity.
The determination of sorption isotherms.
The second consists in:
The method to take different samples from the coffee bean.
The determination of the diffusivity in one part of the coffee endosperm.
The determination of the mass transfer coefficient in the parchment.
The first methods will be discussed subsequently. The second methods will be partially
discussed in this chapter and in the results chapter.
2.1 Observation of coffee bean internal structure.
To observe in detail the internal structure of coffee beans, sections throughout coffee
bean and in both senses (cross-sectional and longitudinal) were performed. All sections
were made with a thickness of 12 たm with a microtome Reichert. In the case of
parchment, small pieces were taken which underwent the same staining process that
endosperm slices. The methodology used to stain the slices was the same proposed by
Chang (2008) for wood. In this methodology the slices must be washed first with
distilled water to be later immerged in safranin for 30 min; then slices should be
washed subsequently with ethanol at different concentrations: 50, 70 and 90 %. After
this step, slices are immerged in "fast green," for 10 min, to finally make a final wash
with pure ethanol. In order to keep the slices for a longer time, an inclusion was made
using a resin based in xylene isomers. The

Materials and Methods
56
application of the resin should be done after leaving each slice in butyl acetate for 1
minute. Coffee slices observations were made using a microscope Leica DMLP.
2.2 Characterization of coffee bean general structure.
In the case of the coffee internal general structure, pictures and measures of the
principal parts revealed by the technique developed in this study and discussed at
section 3.5 were made. For this purpose, coffee beans were cut in a half at its
longitudinal and transversal sense. Images were taken at different parts using a
stereoscope Olympus SZ-CTV in fresh and dried state.
For the characterization of the general structure, measures of the three principal axes of
coffee beans were made. Also a computer representation was made from a real coffee
bean. Three cameras where set up surrounding one coffee bean. All the three cameras
shoot at the same time and pictures taken served to generate the shape of coffee bean
using the software ImageWorks © (2008). All measures were realized with an
electronic Vernier Mitutoyo of high precision.
The moisture content distribution was studied by a RMN image taken on a whole
fermented washed coffee bean at the fresh state using a spectrometer BRUKER
AVANVE III 400 from the Center of Magnetic Resonance and Biological Systems at
Theix, France. The sample was placed in a microimaging probe. The sequence used
was a MSME (Multi Slice Multi-echo) with 16 echoes. The first echo was at 3.578 ms
and the last is at 57.24 ms. A single image centered in the middle of the grain was
selected. The Field of View is 0.96 cm with a matrix of 128x128 (resolution 0.0075 cm
pixel-1
). The number of passages for an acquisition was 2 with a recycle time of 1
second. Two acquisitions were performed with and without fat saturation to provide
proton density images.
2.3 Determination of sorption isotherms of different parts of the coffee bean
and for the whole bean.
The sorption isotherms were established by two different techniques:
The saturated salt solution method (SSS) for the different parts of coffee bean.
The mechanical method (activy-meter) for the high water activity values in the
whole bean.

Materials and Methods
57
The first method was carried out both for the whole bean and the different internal
parts identified. The method used to obtain coffee bean internal parts is discussed at
section 3.2.3. Samples weight was followed over time. Several samples from each part
were taken in order to register a significant weight loss. The equilibrium was achieved
when the weight variation between two successive values was lesser than 1x10⁻⁴
g. Salt
solutions used are listed in Table 5. The principle of the second method, the
mechanical method, is described extensively at paragraph 1.6.3. Only high water
activity values (aw > 0.84) for the whole bean were determinated by this method:
Table 5. Saturated salt solutions used for determining the sorption isotherm of different
parts of the coffee bean. (Norm NF X 15-119).
Salt solutions aw at 35 °C
Lithium chloride 0.12
Potassium acetate 0.21
Potassium carbonate 0.43
Sodium nitrite 0.62
Sodium chloride 0.75
Potassium chloride 0.84
Potassium sulphate 0.96
2.4 Determination of the effective diffusivity for the whole coffee bean.
In order to measure the effective diffusivity, tests were conducted in a plant pilot fixed
bed dryer with transversal air flow of 0 � 2 m s-1, 80 °C of maximum temperature and
with a 0.0024 m2 transversal section drying chamber. Tests were carried at two
temperatures: 35 °C and 45 °C and air velocity of 1.5 m s-1
. These temperatures are
similar to those present at solar drying where the risk of OTA development is higher
(Frank, 2000; Paulino de Moraes and Luchese, 2003; Kouadio et al., 2007; Taniwaki et
al., 2003). At each test, drying kinetics were evaluated by the weight loss. Moisture
content was measured at the end of the tests. Coffee bean effective water diffusivity
(Def) was calculated by fitting equation 1.45 (Hernández et al., 2007) to experimental
drying kinetic.

Materials and Methods
58
2
3.12exp78.0l
tD
XX
XX ef
eo
e
The characterization of the internal structure, deeply discussed at sections 3.1 and 3.2,
showed that there are three internal structures in which is possible evaluate the water
diffusivity: the endosperm with silver skin, the endosperm without silver skin and the
parchment.
2.5 Determination of the diffusivity value for a sample from the internal
structure of coffee bean.
In order to measure the local diffusivity, coffee bean endosperm samples were
obtained as described in section 3.2.3. From these samples part 1 was taken.
Diffusivity was calculated using the solution of Fick�s equation made by Crank (1975)
for an infinite slab of thickness l considering that the water flux occurs only on one
side of the slab:
2
2
2 4exp
8
l
tD
XX
XX w
eo
e
Where Dw represents the diffusivity of the coffee bean endosperm. The proposed
methodology was conceived in order to approach the boundary conditions established
for the resolution of this equation:
The side where water flux is registered has a moisture content equal to the
equilibrium moisture content (Xe).
External mass transfer must be negligible (as calculations have shown).
At the initial state, the moisture content X0 is assumed to be uniform.
In this case the graph of the logarithm of dimensionless moisture content versus time
gives a straight line whose slope is proportional to the diffusivity Dw.
As mentioned above a sample of coffee bean endosperm was used in order to measure
(2.2)
(2.1)

Materials and Methods
59
the local diffusivity. As samples were fixed in a plate (Figure 23), water flux registered
in one side of coffee bean endosperm. In order to study the effect of silver skin in
water diffusion silver skin was removed in some of the tests. The average thickness of
these samples was 0.9 mm. The samples thickness made difficult to carry an
experiment using forced convection, so the tests were carried as described below.
After being taken from coffee bean, the samples with and without silver skin where
glued on an aluminum plate. In order to overcome the variability of the product, 10
samples were placed at each plate. The schema of the experimental device is given in
Figure 23. All tests were carried at 35 °C.
Figure 23. Diagram of the experimental device used to estimate the diffusivity at
different moisture contents.
To accomplish the assumption of uniformity of moisture content in the initial state, the
samples were set in the device of Figure 23 in the presence of salts that regulate the
activity at different values: 0.43, 0.50, 0.62, 0.75 and 0.84. For water activity values
higher than 0.96, samples were left in contact with sulphuric acid solutions at
concentration of 20, 15, 10 and 5 % v v-1
. The equilibrium of the samples was verified
by the stability of the weight over time. Salt solutions were then replaced by a
potassium acetate solution fixing water activity at 21 % while the weight of the plates
was measured over time. At the end of the experiment, the plates are placed in an oven
to determine the dry weight and calculate the moisture content over time for each
Salt Solution
Aluminum plate
Coffee sample

Materials and Methods
60
sample. The moisture content at equilibrium was obtained from the desorption
isotherm at a value of water activity of 0.21.
As the tests were also realised without forced convection, is should be verified the
hypothesis of negligible external mass transfer (Cordova et al., 1996).
External mass transfer coefficient was calculated by the empirical equation for a
horizontal sheet (Geankoplis, 1998):
mScmGr
w
cSh NNa
D
lkN ,
Where
2
3
, gb
N mGr and AB
ScD
N
Where and is the average density of air, g is the gravity, b is the length of the
sample, is the density difference between the sample surface and the air, に is the
air viscosity and DAB is the diffusion of the water in air. The values for the coefficients
a and m are 0.58 and 0.2 respectively.
As the samples were equilibrated at 35 °C, and after a short period of time they were
set at devices at 35 °C, all properties were taken at 35 °C. Also, all kinetic tests were
realized at a water activity of 0.22 and 35ºC; considering that sample�s surface is
saturated we obtain an external mass transfer coefficient of 7.21 x 10⁻³
m s-1
.
Biot number for mass transfer was determined to confirm that drying was diffusion
controlled (second boundary condition). The expression to determine Biot number is
the following (Córdova et al., 1996):
eq
c
a
w
c KD
lkBi
(2.6)
(2.3)
(2.4) (2.5)

Materials and Methods
61
Where l refers to the sample thickness in m, Dw is the water diffusivity obtained for
each equilibrium moisture content, a is the dry air density, c is the dry coffee
density and Keq is the distribution constant between phases. Air and dry coffee density
were obtained from literature and Keq was calculated as the average of the constant
values when coffee samples are saturated and dry, i.e. at equilibrium with the
surrounding environment:
2
X
Y
X
Y
K
i
e
eq
Where Y refers to the dry air moisture content which is obtained from literature, Yi
refers to the dry air moisture content at equilibrium which is obtained from sorption
isotherms. Moisture content X is taken as the saturation moisture content for coffee and
Xe the equilibrium moisture content value at the sample surface is taken from sorption
isotherms.
As example, the values for Biot for the lowest water activity difference (aw = 0.43 at
sample surface, aw = 0.21 at air), and for the highest difference (aw = 0.96 at sample
surface, aw = 0.21 at air) are about 104.9 and 24.3 respectively.
As Biot numbers are higher than 10, we can use equation 2.2 to calculate the
diffusivity values in coffee bean. Moreover Xe samples value is very close to the value
regulated by the saline solution (aw = 0.21) and can be regarded as constant, which
correspond to another assumption made to obtain equation 1.45.
2.6 Transfer coefficient in the parchment.
As detailed in sections 3.2.3 the parchment thickness is negligible with respect to the
coffee bean size, and therefore the evaluation of the water diffusivity values by weight
loss is not adequate. Considering that the parchment is very thin water flux through the
parchment (Nw) can be expressed by the following equation:
(2.7)

Materials and Methods
62
0101 )( XXl
DaarN s
pwwpw
Where rp is the resistance transfer coefficient through the parchment in kg m-2 s-1, Dp.is
the water diffusivity in the parchment in m2 s
-1, aw1 and aw0 are the water activities at
both sides of the parchment each one equilibrated by two different saturated salt
solution, and X1 and X0 are the parchment moisture content at water activities aw1 and
aw0 respectively.
The parchment was placed between two polypropylene tubes (T1 and T2) as shown in
Figure 24.
The tubes used to fix the coffee bean parchment (T1 and T2) have a surface area about
1.26 x 10⁻⁵
m2 and they
are made in polypropylene meaning that this tubes are
deformable.
A pressure F is applied on the two tubes T1 and T2. Then they are maintained in place
by needles (E) and the tube T3. In virtue of the deformability of the tubes, the tubes T1
and T2 seal the parchment forcing the passage of the water flux through the sample of
parchment (P).
Figure 24b represents the device as it was used in the different tests carried out. In the
bottom tube (T2) there is a saturated saline solution of water activity aw1 and the top
tube (T1) was opened to an environmental at water activity aw2.
The water activity gradient produces a moisture content gradient between both
parchment sides as indicated in equation 2.8. The water flux wN was evaluated by the
loss or gain of weight of the device (depending on the gradient direction). Different
water activities at both sides of parchment produce flux values which depend of the
average moisture content of the parchment. In order to improve the precision of the
measures, the device shown in Figure 24b is regrouped by five or three. After
determining the flux to the unit of surface, the resistance rp is determined by equation
2.8.
(2.8)

Materials and Methods
63
Figure 24. Diagrams showing a) the installation and b) the final device conceived to
study the mass transfer in coffee bean parchment.
2.7 Moisture content determination.
Moisture content was determined by the method of AOAC (1990) No. 22 013, in
which samples are introduced into a vacuum oven and subjected to 13.3 kPa and 60 °C
until there is a change of hundredths in the values of the obtained weights.
Parchment
Solution aw1
Solution aw2
T1
T3
E
6 mm T2
P
E
F
T1
T3
6 mm T2
a b
BALANCE

Results
64
3 CHAPTER 3. RESULTS
3.1 Study of coffee bean cellular distribution.
Coffee bean cellular distribution can have a major impact in coffee bean internal water
transfer. One of these impacts is the presence of heterogeneities in the tissue which
could lead to a heterogeneous water distribution inside the bean and therefore affect
the drying process as discussed in section 1.5.3. Coffee bean cellular distribution has
been already studied but most part of the observations are made in the transverse
direction (Pereira-Goulart et al., 2007; Schenker et al., 2000; Geromel et al., 2006; De
Castro and Marraccinni, 2006; Sutherland et al., 2004; Eira et al., 2006). In order to
have a more complete picture of the internal structure of coffee bean observations were
made on the two main directions of coffee bean: transverse and longitudinal.
In order to relate the different sections with the place at coffee bean were they were
made, coffee bean was hypothetically divided into different regions and zones. The
description of the cellular structure was made using the morphology given by De
Castro and Marraccini, (2006). Being totally subjective, and not schematized with a
clear example, the description will focus on the differences of the cellular shape
observed in the different slices obtained.
By the other hand, it will be deduced some characteristic dimensions that will be
useful for drying simulation.
3.1.1 Transverse cut slices.
In order to clarify the way in which coffee endosperm sections were performed a
schema is presented in Figure 25 which shows not only the hypothetical zones in
which observations of cross sections slices (transverse cut slices) were made but the
two edges chosen to perform the slices. This choice was made in order to identify the
sections nearer to the embryo (in this schema corresponding to edge 1), and which
should show structural differences from the rest of the bean (Eira et al., 2006, De

Results
65
Castro and Marraccini, 2006). All cross sections were made beginning from the Edge 1
or 2 and ending into the geometrical half part of coffee bean.
Figure 25. Characteristic zones were cross-section (transverse) slices were performed
in coffee bean.
The slices made in Zone A, the nearer side to the embryo have, in Region 1 a space
that seems correspond to this last one (Figure 26a and b). It is interesting to note that
the area occupied by this space is more significant in the slices near the edge than in
those near the middle part of coffee bean (Figure 27a and b, Figure 28a and b). This
space is accompanied, in all the sections, by a rupture of the endosperm tissue and that
in the fresh bean should correspond to the natural discontinuity (Figure 2). It is
important to notice that the natural discontinuity is not recognized as a relevant
anatomical part of coffee bean endosperm; in fact the name of natural discontinuity is
proposed in the present work.
2
1 3
3
2
2
Zone A
Zone B
Edge 1
Edge 2

Results
66
In region 2 and 3 the discontinuity is more pronounced (Figure 27a and b, Figure 28a
and b). Mucilage remnants were observed at the slices corresponding to Region 1
(Figure 26a and b) identified as the darker areas occupying the natural discontinuity,
but became less evident in deeper sections.
The slices related to these zones also have a different cellular arrangement:
"rectangular" cells which surround the natural discontinuity and "polyhedral" cells in
the rest of coffee bean endosperm. This cellular distribution was also observed by De
Castro and Marraccini (2006). We identify as polyhedral cells to those ones having a
polygon shape and less regular that �rectangular� cells which shape certainly
approaches to this particular geometry.
This cell arrangement differentiation becomes more evident as the cut is closer to the
geometrical bean half (Zone 2, Figure 27a and b, and Zone 3, Figure 28a and b). This
arrangement around the rupture is similar to that described by Eira et al. (2006)
although it corresponds to an early stage in the development of cell walls. Another
interesting observation is that cells appear oriented in terms of the silver skin as
described by Sutherland et al. (2004). Throughout the border region, there is a "layer"
of small cells, which was also identified by Sutherland et al. (2004). This layer was
observed in all slices either longitudinal or transversal.
In every region, the internalization or furrow occupied by the silver skin is easily
identifiable, but in this coffee bean, in particular, it does not have a typical form. (De
Castro and Marraccinni 2006, Sutherland et al., 2004; Eira et al., 2006). It is
interesting to note that this particular morphological form is known as �elephant ear�
and associated with some coffee types.
Mucilage
remnants
Space
corresponding
to embryo
a

Results
67
Figure 26a and b. Cross section slices of coffee endosperm in the hypothetical Zone A,
Region 1. In these slices, located near the embryo, it can be noticed an important space
where it should be placed at fresh state.
Space
corresponding
to embryo
Mucilage
remnants
Polyhedral cells
Rectangular
cells
b
a
Mucilage
remnants

Results
68
Figure 27a and b. Cross section slices of coffee endosperm in the hypothetical Zone A,
Region 2. The shape of the space corresponding to embryo begins to change.
Difference in the cellular shape is more pronounced.
Embryo space Polyhedral cells
Rectangular
cells Natural
discontinuity
Polyhedral cells
Rectangular cells
Natural
discontinuity
Atypical
furrow
b
a
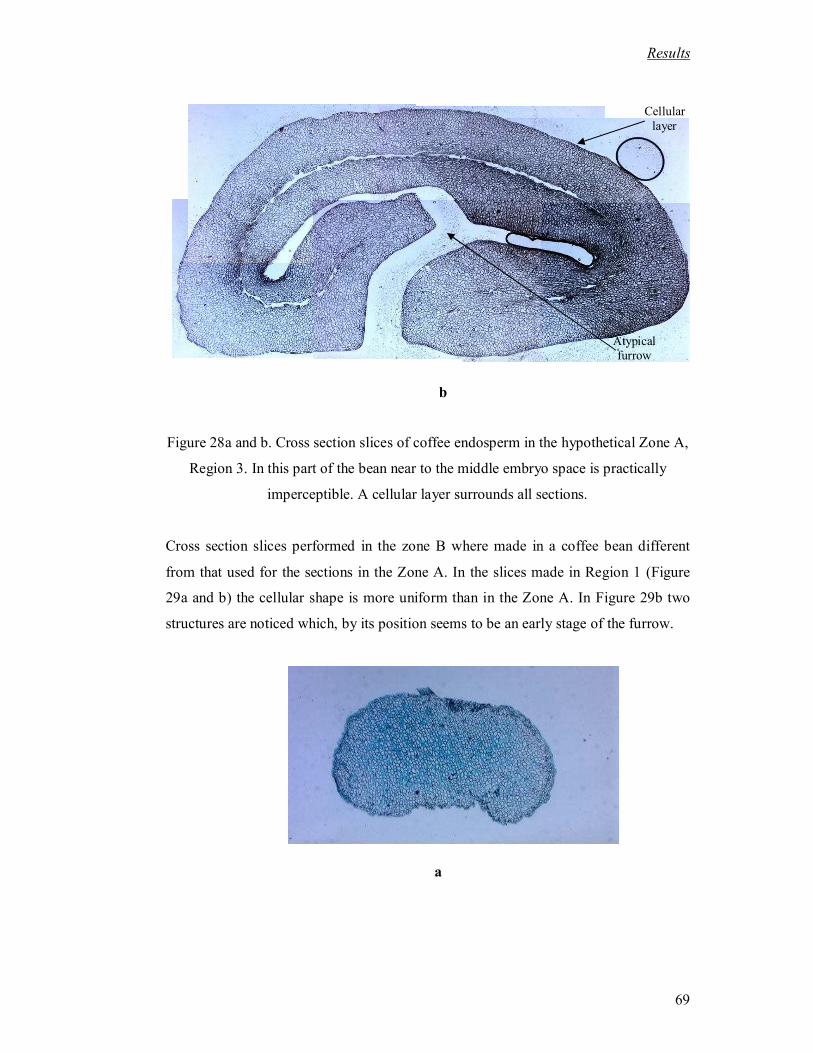
Results
69
Figure 28a and b. Cross section slices of coffee endosperm in the hypothetical Zone A,
Region 3. In this part of the bean near to the middle embryo space is practically
imperceptible. A cellular layer surrounds all sections.
Cross section slices performed in the zone B where made in a coffee bean different
from that used for the sections in the Zone A. In the slices made in Region 1 (Figure
29a and b) the cellular shape is more uniform than in the Zone A. In Figure 29b two
structures are noticed which, by its position seems to be an early stage of the furrow.
b
Atypical
furrow
Cellular
layer
a

Results
70
Figure 29a and b. Cross section slices of coffee endosperm in the hypothetical Zone B,
Region 1. Arrows signals the structures that would form the furrow.
In region 2 (Figure 30a and b), the differentiation of "rectangular" and "polyhedral"
cells is more marked. Particularly Figure 30b rectangular cells are noticed near the
furrow. At the same time, the natural disruption is also perceptible.
As in the case of cross section slices performed close to the geometrical half of coffee
bean in the zone A, slices in the zone B corresponding to region 3 (Figure 31a and b)
show rectangular cells surrounding the natural discontinuity, and polyhedral cells at
the exterior. Natural discontinuity is noticeable. Remnants of mucilage are noticed at
the natural discontinuity.
Figure 32 shows a photograph of a cross section in which cell size is observed as well
as the walls of the grain. The average cell diameter found was between 30 to 60たm and
the walls thickness is above 9 to 11たm.
b
Furrow
Furrow

Results
71
Figure 30a and b. Cross section slices of coffee endosperm in the hypothetical Zone B,
Region 2. Natural discontinuity is more evident. Polyhedral and rectangular cell shapes
are also noticed.
a
b
Natural
discontinuity with some
remnants of
mucilage
Natural
discontinuity with some
remnants of
mucilage
Rectangular
cells
Polyhedral cells

Results
72
Figure 31a and b. Cross section slices of coffee endosperm in the hypothetical Zone B,
Region 3.
x
y
a
b
Natural
discontinuity
with some
remnants of
mucilage
Rectangular
cells
Polyhedral cells
Natural
discontinuity
with some
remnants of
mucilage
Rectangular
cells
Polyhedral cells

Results
73
Figure 32. Photograph of the endosperm of the coffee bean. 100X objective.
3.1.2 Longitudinal slices.
Longitudinal cut slices performed in coffee bean will be also differentiated by relating
the place they were taken to imaginary regions. Eight longitudinal regions will be
proposed. As embryo is present in the half of the coffee beans, no difference should be
found between the two halves, so only one half of coffee bean was considered.
Sections were also effectuated from the lateral border of coffee bean, identified as 1 in
Figure 33, until its geometrical half (identified as the black line at number 8 in Figure
33). The hypothetical regions are schematized in Figure 33.

Results
74
Figure 33. Characteristic zones were longitudinal cut slices were performed in coffee
bean.
As in the cross sections slices, there is no evidence of embryo in the slices near the
edge (Figure 34, Figure 35 and Figure 36). The space occupied by the embryo
becomes noticeable until deeper sections (regions 7 and 8).
Figure 34. Longitudinal cut slice of the coffee bean from the hypothetical region 1.
1
8
8
7
6
5
4 3
2

Results
75
Figure 35. Longitudinal cut slice of the coffee bean from the hypothetical region 2.
Figure 36. Longitudinal cut slice of the coffee bean from the hypothetical region 3.
From the forth to the sixth regions there is a darker central area than in the previous
sections (Figure 38 to 41). Depending on whether the cut is closer to the coffee bean
geometrical half, this part has a greater extension. On the other hand, sections made at
coffee bean half present another configuration (Figure 43 to 46). These observations
correspond with the general structure of the coffee cherry shown by De Castro and
Marraccini (2006) which also has a change of the internal structure of endosperm
(Figure 37) at coffee bean half. The discontinuities in the upper and bottom parts
should be filled by the silver skin.

Results
76
Figure 37. Longitudinal cut performed in a coffee cherry (De Castro and Marraccini,
2006). Upper structure (in) should correspond to Figure 44 and 45.
The cell arrangement also changes according to the region where the section is made.
In region 1 (Figure 34), cell shape is "round" and the size is homogeneous. In the slices
of regions 2, 3, and 4 (Figure 35 to 38), the cells near the surface, show smaller
"polyhedral" cells than in the interior of the tissue, while in regions 5 and 6 (Figure 40
to 42), cells in the detached part have "polyhedral" shape while in the rest of
endosperm cells have round shape. On the other hand cells in Figure 41 have an
orientation to the left: it seems that this orientation is due to a small structure, like an
opening, located in the lower right side (Figure 42). This structure has not yet been
reported in literature.
Figure 38. Longitudinal cut slice of coffee beans from the hypothetical region 4.

Results
77
Figure 39. Longitudinal cut slice of the coffee bean from the hypothetical region 5.
Figure 40. Longitudinal cut slice of the coffee bean from the hypothetical region 6.

Results
78
Figure 41. Longitudinal cut slice of coffee bean from the hypothetical region 6.
Figure 42. Structure observed in a longitudinal cut slice of coffee bean.
In the area closest to the geometrical half part, (Regions 7 and 8, Figures 43 to 46) it
can be noticed the same cell rupture as in the cross section slices. Also, around cell
rupture, there is a drastic change in cell arrangement. Cells shape near the natural
discontinuity is also similar to that of the cross sections: "rectangular" cells
surrounding the discontinuity and polyhedral cells at the external parts. The cell layer
is also present at the tissue limiting with the silver skin. One part of the tissue was
naturally separated when cut. This inferior part has homogeneous round cells (Figure
44).

Results
79
At the geometrical half of the bean (Figure 45 and 46), the space that corresponds to
the embryo becomes evident. The rupture that appears in the bottom part of the
sections is not observed in the general structure (Figure 37), however it doesn�t seems
filled by mucilage as the natural discontinuity. Cell arrangement of the bottom part is
polyhedral. Another structure appears in the left bottom side in Figure 45 and 46 which
can also be identified at Figure 37.
Figure 43. Longitudinal cut slice of coffee bean from the hypothetical region 7.
Figure 44. Longitudinal cut slice of coffee bean from the hypothetical region 7. Part
naturally detached from the section when cut.

Results
80
Figure 45. Longitudinal cut slice of the coffee bean performed at the hypothetical
region 8.
Figure 46. Longitudinal cut slice of the coffee bean performed at the hypothetical
region 8. This slice was performed at coffee bean half.

Results
81
3.1.3 Optical microscopy of parchment.
Kasser and Kasser (1969) studied various characteristics of the parchment. They
mention that its composition consists principally of a large proportion of lignin and
pentose; its thickness varies between 100 to 300 microns, and that their cells shape is
short, steep and irregular. Observations of parchment revealed a high density and high
cross-linking (Figure 47).
From the photographs of the coffee bean endosperm and parchment it can be noticed
that the structure of the parchment is more homogeneous meanwhile the endosperm
has a heterogeneous structure. Observations of the endosperm internal cellular
distribution showed that even the cell arrangement is different throughout coffee bean
endosperm, cells are distributed in a pattern that seems given by two internal
structures: the natural discontinuity and the silver skin. Particularly, the heterogeneity
of coffee bean water distribution at the endosperm seemed linked to the furrow (Frank,
2000). However, the observations do not revealed a particular cellular distribution in
this area. Internal cellular distribution does not reveal the whole coffee bean structure
but the internal one. In order to have more information about the water distribution in
the coffee bean endosperm, tests using RMN imaging were carried out. Also the
general internal coffee bean structure at the fresh state and partially dried was
considered.
3.2 Coffee bean general and internal structure characterization.
3.2.1 Stereoscopic microscopy of fresh coffee beans.
In order to have a global perspective of coffee bean structure, pictures of coffee bean
cut by its half were taken with a stereoscope Olympus SZ-CTV. As in the pictures
made to observe the internal structure of coffee bean endosperm, a transverse and a
longitudinal section at geometrical bean half were made. These pictures confirmed
some observations and revealed new ones.

Results
82
Figure 47. Photomicrographs of coffee bean parchment.
At fresh state, the furrow which has two layers of silver skin in its interior has a
viscous appearance (Figure 48a). This appearance should be due to silver skin
composition which is rich in polysaccharides and hydrates easily. As coffee bean
becomes dryer, it can only be observed the layers of silver skin, and an empty space
(Figure 49a and b) that should be filled with air. Since the water diffusion in air is
higher, we can suppose that water activity is the same on both sides of furrow. If
simulation at the early stage of drying is considered, where water activity is higher,
this should be considered as a boundary condition between furrow and endosperm, i.e.
a hypothesis could be made in which at early stages of drying water activity has a
value of 1 at furrow�s surface.

Results
83
As observed in the transverse and longitudinal sections for the internal cellular
distribution, natural discontinuity has mucilage in its interior (Figure 48b). When
coffee begins to dry, also empty spaces begins to arise.
Figure 48a and b. Images showing the presence of mucilage at the space near the
furrow in a fresh stage (cross section).
Figure 49a and b. Longitudinal cut of coffee bean in a dried state.
After analyzing the internal structure of coffee bean several characteristics arise.
Cellular structure is heterogenic but distributed regularly throughout endosperm. Silver
skin presence is important, moreover, at fresh state it is hydrated having a viscous
appearance and filling the furrow. As coffee bean becomes dryer silver skin present in
the furrow become thinner. The moment when these layers become thinner at drying is
a b
a b

Results
84
unknown; however it seems clear that if silver skin is humid it will almost occupy the
furrow. From these conditions it results that natural discontinuity and the space created
at furrow should impact the water mass transfer in coffee bean endosperm.
Mucilage is also present in the natural discontinuity of coffee bean. Particular tests
should be conducted to quantify its impact in coffee bean endosperm transfer.
One way to confirm the impact of the internal structures that seem have a major role in
coffee bean internal transfer is the study of the water distribution in fresh beans. Some
studies have been carried out with this purpose using RMN techniques (Frank, 2000;
Toffanin et al., 2001) but leading to contradictory results. In this case RMN images
will be also taken in fresh coffee beans in order to confirm the internal water
distribution.
3.2.2 RMN Imaging.
In order to have the water internal distribution in coffee bean endosperm, RMN images
were taken considering the proton signal given by the lipids (Figure 50a and b). When
lipid signal is not considered in food rich in lipid content, mistakes at the interpretation
of the obtained images could be done (Mariette, 2004). Figure 50 b shows a proton
signal where the lipid and the water signal are mixed. Figure 50a shows the proton
signal from the water. As coffee bean is a media where lipid content is important
Figure 50a should be considered to study water distribution instead of Figure 50b. By
the other hand, the images confirm the homogeneity of moisture content distribution
for an Arabica coffee at high values of water activity (Figure 50a). As an example the
proton density for pure water is given beside the images. In the images brighter areas
are with the intensity of water signal and with water concentration. Therefore, brighter
areas imply higher water concentrations and darker areas with lesser water
concentration. In the images the internal space of the furrow seems empty, which
agrees with the observations made in fresh coffee beans and confirming that it is empty
as coffee bean dries. Also this could mean that the internal space of the furrow should
be filled with air. Moreover, the natural discontinuity can be observed which also
seems empty.

Results
85
a) b)
Figure 50a and b. RMN images of a coffee bean a)without and b)with the lipid signal.
This image coincides with some features of the images obtained by Frank (Figure 10).
Figure 10. Distribution of water in the coffee beans (Frank, 2000).
Figure 50a does not show a heterogeneous water distribution if compared with Figure
10 but the furrow has the same behavior. Figure 10 was made in a rehydrated coffee
bean showing that an internal area in the furrow has a higher water concentration. The
opposite is observed at Figure 50a in a similar area. Instead this it is not clear if the
images taken by Frank discriminate the lipid signal. Toffanin et al. image (Figure 9)
show a homogeneous water distribution for a rehydrated bean which for its
presentation can not be easily compared with Figure 50a. It is important to highlight
that this image was taken in a Robusta coffee bean instead of an Arabica coffee as in
the case of Figure 50a.
Until now internal cellular distribution and the internal structure of coffee bean
endosperm have revealed anatomical zones where particular conditions should be
considered. Also RMN imaging showed that water distribution in coffee bean

Results
86
endosperm is homogeneous. Now a study of the water activity, particularly at high
water activities will be presented. This study can support the homogeneity of moisture
content in coffee bean endosperm. Also transfer coefficient values will be determined
in order to propose a scenario for the water mass transfer at coffee bean drying.
3.2.3 Method used to obtain samples from coffee bean.
In order to study any internal structure property it is necessary first to find a
methodology to obtain the samples required. In this case, this was possible by
extracting a part of the center of the grain by using a cylindrical stainless steel cutting
tool. From this central part, different structures are revealed. The resulting structures
were: the parchment, Part 1 and Part 2 (Figure 51a). Parchment is situated at bean
surface (Figure 51a). A photograph showing its external appearance is given at Figure
51b (structure 1). Part 1 and Part 2 are both part of the endosperm (Figure 51a). Part 1
corresponds to the endosperm localized at the bean surface (Figure 51a). Its
appearance when separated from coffee bean is shown at Figure 51b (structure 3). Part
2 comprises the furrow (Figure 51a). It is formed from different layers which are
shown in Figure 51b (structures 4, 5 and 6). Part 2 and Part 1 are naturally separated
by the natural discontinuity (Figure 51a) so they detach easily when manipulated.
3.2.4 Characteristic dimensions of coffee bean.
In order to have characteristics dimensions of coffee bean, general and internal
measures were carried out. The average measures of the three principal axes of coffee
bean performed in 75 different beans are presented in Figure 52c. Figures 52a, b and c
are computer representations of coffee beans which allowed measuring the surface and
volume considering coffee bean real shape. The calculated value for the surface area is
about 2.7x10⁻⁴ m2 and for the volume 3.5x10⁻⁷ m3. The simulation program
(ImageWorks©, 2008) revealed that the geometry of coffee bean can be made from a
revolution ellipse, i.e. a prolate spheroid as proposed by Hernandez et al., (2008).
The volume and surface of coffee bean were also calculated using the formulas for the
prolate spheroid. The calculated surface area is about 1.293x10⁻⁴
m2 and the volume
about 1.99x10⁻⁷ m3 which have the same order than the calculated by the simulation
program. Images obtained from the program simulation are shown at Figure 52.

Results
87
Figure 51. a) Schema showing the distribution of the different parts taken from the
coffee bean: (1) parchment, (2) the silver film covering part 1; The Part 1 form a single
piece (3); (4), (5) and (6) are all part of Part 2. b) Photograph of the same parts.

Results
88
Figure 52 a, b, c. Images obtained of the coffee bean given by the program
ImageWorks©, 2008.
Also measures of the internal structure were carried out from samples obtained with
the methodology described at section 3.2.3 (Figure 51a). An interesting feature is that
there is a proportion in the measure of part 1 and part 2 despite the difference in the
bean thickness. An example of these measures is given at Figure 53:
Figure 53. Measure examples of internal parts identified in coffee bean.
Part 1
Part 2
4.49 mm
0.77 mm
0.55 mm
3.15 mm
x
y
z
1.16cm
0.46cm 0.81cm
10.76 mm
a b c

Results
89
3.3 Water activity and chemical potential in coffee bean. Coffee bean
heterogeneity.
RMN images showed that coffee water distribution is nearly homogeneous throughout
coffee bean endosperm. However other structure present at drying, the parchment, can
not be studied by this technique. In order to confirm the heterogeneity throughout the
bean, and the behaviour of the parchment, isotherms were realised for the different
parts obtained by the methodology exposed at section 3.2.3. The isotherms were
determinated by the standard salt solutions at 35 °C (Table 5) and in the case of whole
bean, water activity values between 0.92 and 0.98 were also obtained by a new
mechanical method (Ouoba et al., 2010) which was deeply described at section 1.6.3.
This method allows determining high water activity values at equilibrium in a very
short time (one day), without risk of moulding growth. For the five parts studied, the
isotherms are given in Figure 54a.
In Figure 54b are represented the isotherms of the agar gel and wood on the same
graphic that for the endosperm and the parchment. It can be noticed that endosperm
and agar gel isotherms have similar shapes at high moisture contents values which
validates the shape found in this study for the coffee bean. On the other hand the
isotherms of the parchment and the wood also have similar shapes. This should be due
for the similarity of their composition which is rich in lignin. Thereafter, the discussion
made for the wood would be also valid for the parchment. In the case of the water
isotherm of the different parts of coffee bean no significant differences between the
isotherms for the whole bean, bean extremities, part 1 (Figure 51b) and part 2 were
found. However the behavior of parchment sorption isotherm was different at higher
water activities. This difference indicates a lower hygroscopic nature in the parchment
and therefore may be attributed to its lignocellulosic composition, with lower
concentration of soluble solids and which can not be studied by the RMN technique.
The interval of the high water activity values of coffee whole bean isotherm is of
particular interest because is at this interval that fungal development can occur. A
particular analysis of this zone using the chemical potential was made.

Results
90
Figure 54a and b. a) Isotherms of different coffee bean parts identified, coffee bean
extremities and the whole coffee bean at 35 °C. b) Isotherms of the coffee bean
parchment, endosperm, wood and agar gel.
a
b
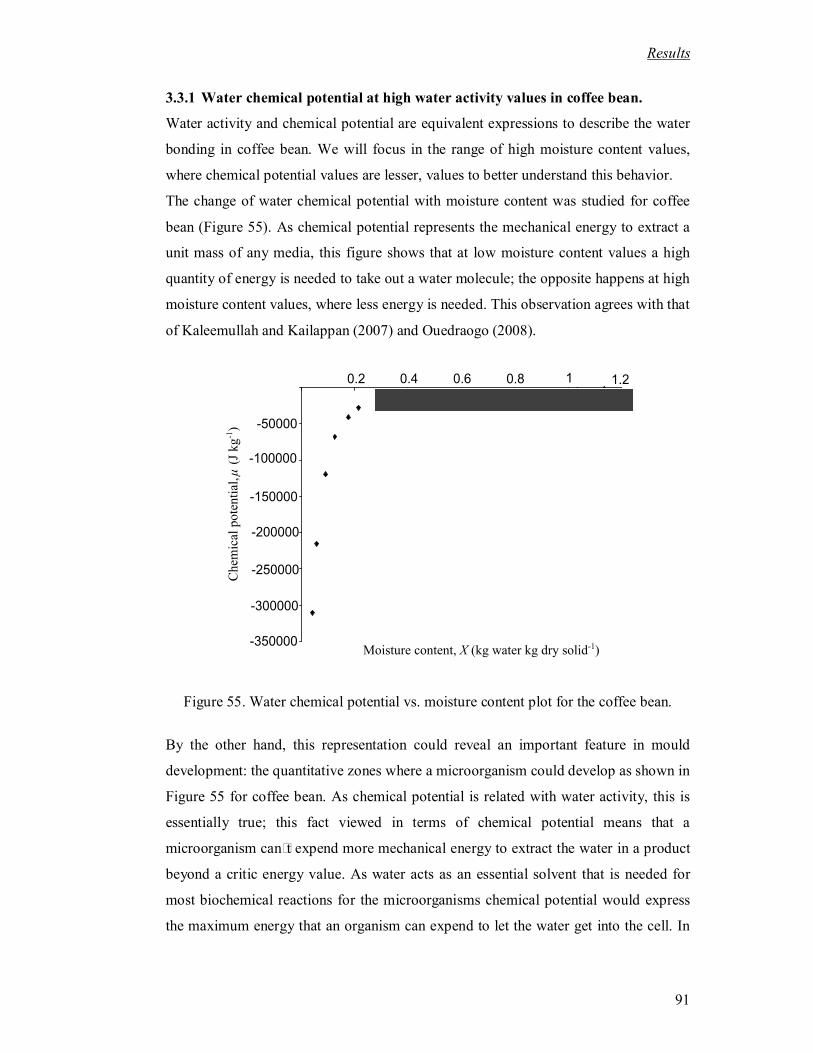
Results
91
3.3.1 Water chemical potential at high water activity values in coffee bean.
Water activity and chemical potential are equivalent expressions to describe the water
bonding in coffee bean. We will focus in the range of high moisture content values,
where chemical potential values are lesser, values to better understand this behavior.
The change of water chemical potential with moisture content was studied for coffee
bean (Figure 55). As chemical potential represents the mechanical energy to extract a
unit mass of any media, this figure shows that at low moisture content values a high
quantity of energy is needed to take out a water molecule; the opposite happens at high
moisture content values, where less energy is needed. This observation agrees with that
of Kaleemullah and Kailappan (2007) and Ouedraogo (2008).
Figure 55. Water chemical potential vs. moisture content plot for the coffee bean.
By the other hand, this representation could reveal an important feature in mould
development: the quantitative zones where a microorganism could develop as shown in
Figure 55 for coffee bean. As chemical potential is related with water activity, this is
essentially true; this fact viewed in terms of chemical potential means that a
microorganism can�t expend more mechanical energy to extract the water in a product
beyond a critic energy value. As water acts as an essential solvent that is needed for
most biochemical reactions for the microorganisms chemical potential would express
the maximum energy that an organism can expend to let the water get into the cell. In

Results
92
the case of water in coffee bean, the limiting energy where A. ochraceus could develop
is in the order of -30 000 J kg-1 (Figure 55).
However it can be noticed that as chemical potential values for high moisture content
are small compared to that at low moisture content values, this particular
representation makes difficult to study the behavior of chemical potential at high
moisture content values. With this purpose the change of chemical potential was
represented in a logarithmic scale obtaining the Figure 56 where chemical potential are
represented as absolute values.
Figure 56. Chemical potential vs. moisture content plot for the coffee bean in a
logarithmic scale.
We can notice that the transition to a logarithmic scale introduces a significant visual
distortion of the graph of )(wfe which from a sigmoid curve reveals an �s�
shape. Figure 57 represents the variation of the absolute values of chemical potential
high moisture content values. This representation reveals an important feature: as
chemical potential tends to zero, moisture content approaches to a value of 1.33 which
coincides with the saturation moisture content reported for coffee bean in literature.

Results
93
This result deserves to be confirmed. To achieve this, the same method was applied to
different media for which moisture content at very high water activity values (near to
one) were known.
In order to confirm this behavior, the same representations were made with other
materials.
Figure 57. Water chemical potential vs. moisture content plot for the coffee bean at
high moisture content values.
3.3.2 Water chemical potential at high water activity values in other media.
In addition to coffee bean, media for which chemical potential variation was studied
include three different soils (clay, clay-silty sand and NASSO), and wood (Figure 58).
These media are well known at the Laboratory of Mechanics and Civil Engineering
(LMGC) where the present work was realized, and in the case of soils, high chemical
potentials values were available (Ouedraogo, 2008; Jamin, 2003; Anoua, 1986).

Results
94
Figure 58. Chemical potential vs. moisture content plot for several media.
For all media, there is a clear augmentation of water chemical potential value as the
moisture content tends to zero which means that water bounding increases as it has
been noticed for the coffee bean (Figure 56). For wood, water activity values greater
than 0.98 were not available by consequence no high chemical potential values were
represented. Despite this, the representation of water chemical potential in these media
in a logarithmic scale have an identical and general shape although the media have
very different structures. Moreover, the final parts of the curves corresponding to the
soils clearly tend to a specific moisture content. In order to estimate this value, the
change of water chemical potential with moisture content at high water activity values
was represented in Figure 59. Also a representation was made for the coffee and wood
(Figure 60). In this representation coffee bean parchment was included in order to
analyze its behavior at high water activity values.

Results
95
Figure 59. Chemical potential vs. moisture content plot for the clay, clay-silty sand and
NASSO soil at the neighborhood of aw = 1.
Figure 60. Chemical potential vs. moisture content plot for the wood, the coffee bean
parchment and coffee bean at high water activity values.

Results
96
Figures 59 and 60 revealed that there is a linear relationship between the chemical
potential and the moisture content at high water activity values. This relationship
allows determining Xlimit. Table 6 shows the value of Xlimit estimated from Figure 59 and
60:
Table 6. Maximum moisture content (Xlimit) for different media estimated from Figures
59 and 60.
Media Xlimit
Nasso soil 0.272
Clay-Silty sand 0.297
Clay 0.336
Wood 0.361
Coffee bean parchment 0.278
Coffee bean endosperm 1.286
Coffee bean 1.395
These values coincide with the values of moisture content at saturation (Xsat) which can
be determined, in undeformable media, by the conventional oven method. The
saturation values for each media are shown in Table 8 (Jamin, 2003; Ouedraogo, 2008;
Anoua, 1986; FDA, 2010). In deformable media as gels, there is a little uncertainty
about the extension of the graph towards Xlimit. In fact, the size of pore space can vary
while the media is already saturated, therefore Xsat is not the same, and it can vary. As
an example, we will mention the agar gel (Figure 61).

Results
97
Figure 61. Internal structure of hydrated agar gel. White parts represents the solid
phase and gray parts represents water. X = 830%.
In these pictures the agar gel is recognized as saturated because its pores seems filled
with water; however as agar gel is composed from hydrophilic molecules and it swells,
it can held more water so it can be said that it is saturated in a long range of moisture
content (300-2000%).Figure 62a and b show two images of agar gel structure at two
different moisture contents: 20 and 30% respectively.
Figure 62a and b. Internal structure of hydrated agar gel at a) X = 2000% and b) X =
3000%.
It can be noticed that saturation value can change if the solid phase (in white in both
images) contracts or dilates. Saturation is more easily identifiable at media with
Water
Solid
phase
a b

Results
98
slightly deformation were the porosity does not change in a large extent. As several
media are considered, and their structure deformation is very low, we will consider
limit moisture content instead of a moisture content saturation.
The variation observed in these pictures reflects molecular interactions at interfaces.
For the moment, it seems difficult to translate these microscopic interactions in the
form of a macroscopic mathematical model given the diversity of pore space geometry
and surface properties of solid phase. At macroscopic level, chemical potential at low
and medium moisture content values can be studied using classical isotherm models as
GAB model (Timmermann et al., 2001). In consequence, it seemed interesting to study
the modelling at low chemical potential values, i.e. at water activity values near 1.
3.3.3 Water chemical potential modeling.
At equilibrium between liquid adsorbed by heterogeneous media and its vapor, the
solid surface is partially or completely covered by adsorbed molecules. The GAB
model describes the multilayer adsorption isotherm resulting in a relationship between
moisture content and water activity:
X = ])1(1)[1( wggwg
ggm
aKCaK
KCX
aw
Given the diversity of structure and nature of the solid phase in heterogeneous media,
it is necessary to introduce adjustment parameters (Cg, Kg, Xm) into the model. By the
other hand, even GAB model is applicable in a large interval of moisture content
values, it fails at values below 0.9 (Baucour and Daudin, 2000). It is also possible to
use models specially developed to take into consideration the water activity variation
at values close to 1. The Ferro Fontan (FF) model (Ferro Fontan et al., 1982) is one
example of such models, which equation is:
r
w
Xa
ln
Where , and r are adjustable parameters. An interesting feature is that Xlimit can be
interpreted as the moisture content value, when chemical potential is equal to 0. As
(3.1)
(3.2)

Results
99
chemical potential depends from water activity this condition also means that Xlimit
should correspond to a water activity equal to 1. So when aw = 1, X = Xlimit. The
relationship 3.2 allows expressing the chemical potential of water as:
)(lim
rre
itXX
M
RT
Ferro-Fontan model parameters (, , r) are calculated by the adjustment of
experimental data. This method does not lead to the knowledge of Xlimit but to an
approximation identified as XlimitFF.
The parameters from GAB model have been adjusted for the soils and wood including
coffee bean (Table 7).
For the isotherms of the internal parts of coffee bean and the whole bean solid lines
until aw ≤ 0.84 represent GAB model. For the whole beans at aw 0.84 the solid line
represents Ferro-Fontan model (Figure 54a). This shift in the selected equation to
model the water sorption isotherm of the whole bean obeys to the fact that GAB model
can not correctly represent water sorption isotherms at aw > 0.9 giving erroneous
results at this range as probed by García-Alvarado et al. (1995). Ferro-Fontan model is
a more adequate to represent the water sorption isotherm at high water activity values
as observed by Baucour and Daudin (2000) for gelatin gel.
Table 7. Estimated GAB parameters for three types of soils, wood and coffee bean.
Media Xm Cg Kg
Nasso 0.00050321 11.3738193 1.10150468
SLA 0.0197384 24.4412497 0.63838456
Clay 0.01407112 57.4857959 0.77615667
Wood 0.06258278 4.71419126 0.85103896
Coffee bean 0.06323387 12.777643 0.87091313
Table 8 gives the parameters g, け and r for the Ferro-Fontan model. There are also
represented the values corresponding to Xsat obtained by the oven method (Jamin,
(3.3)

Results
100
2003; Ouedraogo, 2008; Anoua, 1986; FDA, 2010), the XlimitFF
value deduced from
equation 3.3 when aw = 1, and the value Xlimit calculated from the linear approximation
represented at Figure 59 and 60.
Table 8. Estimated Ferro-Fontan parameters for three types of soils, wood and coffee
bean.
Media r Xsat XlimitFF Xlimit
Nasso soil 0.004168 1.0043 0.022314 0.26 0.278 0.272
Clay-Silty
sand
1.66x10-05
1.0001 1.4832 0.29 0.290 0.297
Clay -0.64199 0.99558 -4.4991 0.34 0.336 0.331
Wood 0.2298 1.5627 0.651 0.4 0.340 0.361
Coffee bean
0.42654
1.5005
0.1496
1-2.3 1.337
1.395
The curves representing the variation of the chemical potential in relation to moisture
content estimated from GAB and Ferro-Fontan model for the three soils, the wood and
the coffee bean are given in Figure 63.
For the three soils, the difference between moisture content value predicted from low
chemical potential (Figures 59 and 60) and the predicted from FF model at aw = 1 is
lesser than 2%. Moreover, the calculated values coincide with the reported as the
maximum moisture content (Xsat) for the three soils. For wood, both GAB model and
Ferro-Fontan model showed a good fit in all range of water activity values. The
difference of the values of Xlimit deduced from Figures 59 and 60 and the values
deduced from Ferro-Fontan model (XlimitFF
) is of 6%, however, no chemical potential
values lesser than -2000 J kg-1
are available. It is interesting to note, that the Xlimit value
considering chemical potential values lesser from -13000 J kg-1 is 0.357 which
corresponds to an error of 1%. Considering the resemblance of the isotherms of the
wood and the parchment, the same remarks can be made for the parchment.
In the case of coffee bean, the difference between Xlimit and XlimitFF
is about 4%. It is
interesting to note that these values are very similar to that reported by Hernandez et
al. (2008) for the same coffee variety.

Results
101
Figure 63. Chemical potential vs. moisture content plot for several media. Estimated
GAB and Ferro-Fontan (FF) model curves are also represented.
The water chemical potential also revealed interesting features about the water state at
coffee bean endosperm. A particular discussion could arise if considering that water
sorption isotherms could give similar information. This is true in the way that chemical
potential is defined by the water activity; however chemical potential also reveals
specific parameters as Xlimit. Moreover, the curve of the variation of the chemical
potential with moisture content allows quantifying the mechanical energy necessary to
extract a unit of water mass meanwhile that this information is qualitative at water
sorption isotherms.
Water sorption isotherms have not revealed a local heterogeneity at coffee bean
endosperm. Therefore moisture content can be used as the parameter to quantify the
mass transfer in coffee bean endosperm. However, at the tissue level, the diffusivity
should depend on moisture content.

Results
102
3.3.4 Consequence of the variation form of chemical potential with moisture
content in coffee bean.
Figure 63 reveals a particular shape for coffee bean when compared with other
materials. In the case of coffee bean the range of variation of moisture content is very
important moreover the range of variation where the water activity value is lesser to
0.8 (た = -30 000 J kg-1
) is very large; it extends from a moisture content of 0.35 to the
saturation moisture content (Xsat ~ 1.3). This means that it must been extracted near
than 100% of the moisture content in order that the product achieve the conditions to
avoid the development of A. ochraceus.
As mentioned before, the decrease from a moisture content of 130% to 30% implies a
significant energy expense and depending in the drying method, a long time to dry.
In other materials the situation is different. For example, in the case of wood, a fungus
which water activity growing limit is about 0.8 would be avoided if, considering that at
the beginning, the product is saturated, by diminishing the moisture content from 35%
to 30%.
It seems that the shape of the variation of chemical potential with moisture content at
low values of chemical potential is very important to judge the risk of microorganism�s
development. This also reveals the practical interest of the graphs in Figure 63. Now,
mass transfer at the whole bean level and at the tissues level will be discussed.
3.4 Mass transfer in coffee.
Locally the mass flux of water in a heterogeneous media can be written as:
)(** XgradDv wsww
where w and z are the bulk densities of the water and the solid phase, swX
is the moisture content, wv is the water velocity, and wD is the water diffusivity
relative to matter.
(3.4)

Results
103
3.4.1 Mass transfer in the whole coffee bean.
When the bulk density of the solid phase is constant, the introduction of equation 3.4
in the mass balance for water for a uniform diffusivity named effective diffusivity
( efD ) gives:
)(XDivDt
Xef
This equation can be solved analytically considering simple boundary conditions and
standard geometries: infinite slab, cylinder and sphere. However, coffee bean has a
complex shape. Hernandez et al. (2008) proposed a geometry of prolate spheroid, to
approach that of coffee bean. A prolate spheroid resembles a rugby ball. In the case of
coffee bean geometry only half of the complete solid will be considered.
The solution of equation 3.5 considering a prolate spheroid geometry is:
23.12exp78.0
L
tD
XX
XX ef
eo
e
Where oX and eX are the initial and equilibrium moisture contents. The left part of
the expression represents the dimensionless moisture content. Drying kinetics obtained
at 35 and 45 °C are shown in Figure 64. This graphic is represented as the logarithm of
the dimensionless moisture content versus time:
(3.6)
(3.5)

Results
104
Figure 64. Experimental drying kinetics for coffee beans at 35 °C and 45 °C.
Effective diffusivity values at 35 °C and 45 °C were (2.84±0.125) x 10-11and
(9.41±0.494) x 10-11
m2 s
-1 respectively (the dispersion represent the 95% confidence
interval). As the prolate spheroid geometry was used to calculate the effective
diffusivity, it is necessary to determine the focal distance a. This wade made by the
simultaneous resolution of the equations for the prolate spheroid geometry:
coscosh
sinsinsinh
cossinsinh
az
ay
ax
The dimension values (x, y and z) were those reported at Figure 53. The obtained focal
distance was about 4x10⁻³ m. The diffusion value at 45 °C agrees with the reported by
Sfredo et al., (2005) which ranged between 0.1x10⁻¹⁰
to 1x10⁻¹⁰
m2 s
-1 for coffee
cherries, but greatly differs with that reported by Correa et al., (2006) at 40 °C,
(2.91x10⁻¹⁰
m2 s
-1). By the other hand coffee beans dry more quickly at 45 that at 35 °C
confirming the dependence of the effective diffusivity with temperature.
Drying experiments were also used to probe the heterogeneity in coffee bean. The
images obtained by Frank (2000), showed that coffee bean moisture content was very
different at a high water activity value; moreover this difference seemed to divide the
(3.7)
(3.8)
(3.9)

Results
105
coffee bean in two halves. In order to confirm this behavior, moisture content at fresh
state and during drying (Figure 65) was determinated:
Figure 65. Experimental drying kinetics for whole coffee beans and coffee beans cut in
half at 35 °C and 45 °C.
Tests at fresh state and during drying did not show a significant difference between the
two differentiated halves in coffee bean. This result suggests again that heterogeneity
in coffee bean does not develop as Frank showed (Figure 10) i.e. there is no one half
drier than the other.
Moreover, these findings put in evidence the dependence of the diffusivity with
moisture content. The dependence of effective diffusivity with moisture content is
widely discussed, however it does not permit to study local phenomenon as at high
water activities in coffee bean. In order to quantify the diffusivity, tests were carried
out at in the part 1 of coffee bean (Figure 51a).
3.4.2 Water mass transfer coefficient in a sample of coffee bean endosperm.
As exposed in the methodology section coffee bean endosperm samples with and
without silver skin where left in contact to assure that the moisture content would be
uniform. As an example, the variation of the moisture content of samples with and
without silver skin is given at Figure 66:
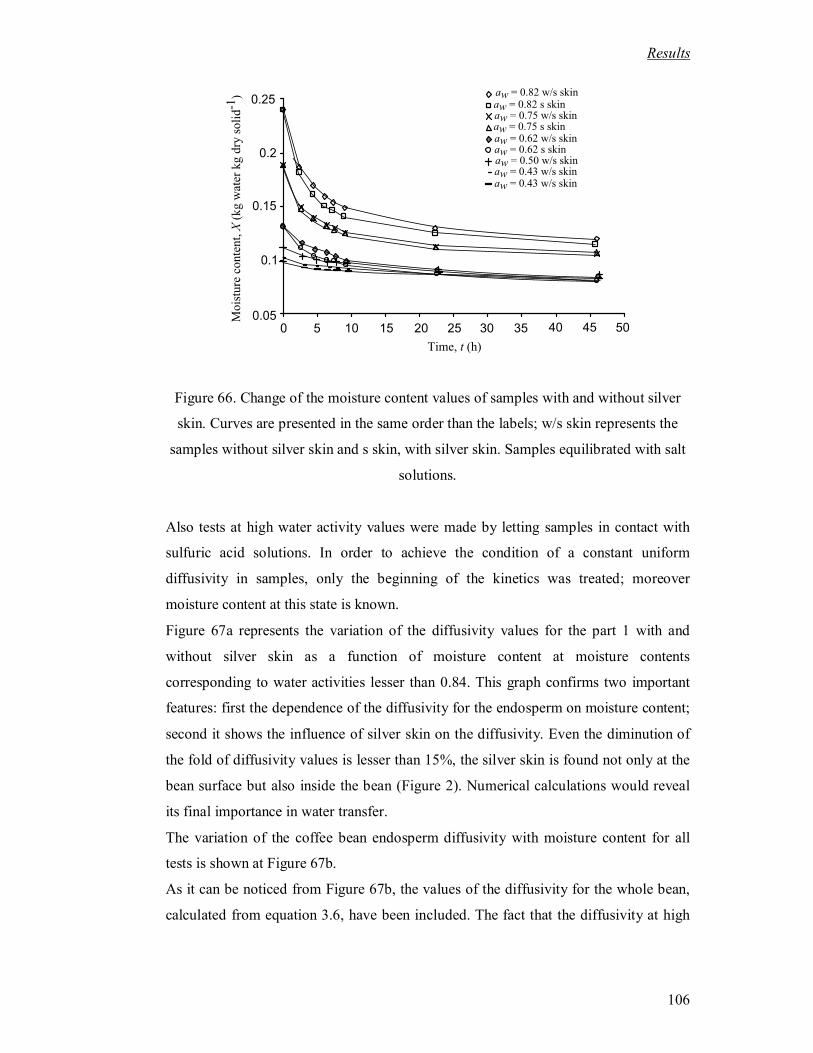
Results
106
Figure 66. Change of the moisture content values of samples with and without silver
skin. Curves are presented in the same order than the labels; w/s skin represents the
samples without silver skin and s skin, with silver skin. Samples equilibrated with salt
solutions.
Also tests at high water activity values were made by letting samples in contact with
sulfuric acid solutions. In order to achieve the condition of a constant uniform
diffusivity in samples, only the beginning of the kinetics was treated; moreover
moisture content at this state is known.
Figure 67a represents the variation of the diffusivity values for the part 1 with and
without silver skin as a function of moisture content at moisture contents
corresponding to water activities lesser than 0.84. This graph confirms two important
features: first the dependence of the diffusivity for the endosperm on moisture content;
second it shows the influence of silver skin on the diffusivity. Even the diminution of
the fold of diffusivity values is lesser than 15%, the silver skin is found not only at the
bean surface but also inside the bean (Figure 2). Numerical calculations would reveal
its final importance in water transfer.
The variation of the coffee bean endosperm diffusivity with moisture content for all
tests is shown at Figure 67b.
As it can be noticed from Figure 67b, the values of the diffusivity for the whole bean,
calculated from equation 3.6, have been included. The fact that the diffusivity at high

Results
107
moisture contents in the endosperm is lesser than that of the whole bean suggests that
empty spaces creates at drying. Moreover the diffusivity at high moisture contents
remains practically constant suggesting that at the beginning of drying, coffee bean
endosperm behaves as a homogeneous structure.
In order to have a more complete scenario of the internal drying of coffee bean the
other structure identified with potential for mass transfer resistance will be presented
below.
3.4.3 Transfer coefficient in the parchment.
The parchment often is not considered at the water coffee bean transfer. In order to
confirm its role in coffee bean transfer, particular tests were carried out. Supposing that
the parchment thickness is negligible, water flux is considered as proportional to the
water activity difference 01 ww aa on both sides of the parchment. The transfer
resistance of the parchment is noted as pr . Therefore, the equation that describes water
transfer in parchment is:
01 wwpw aarN
As there is a relationship between the moisture content X and the water activity wa ,
this equation can be traduced into a gradient of moisture content. As a consequence of
this relationship, equation 3.10 becomes:
01 XXl
DN s
pw
Where pD is the average diffusivity of the parchment. The principle of the
experimental test was to fix a water activity gradient 01 ww aa on both sides of the
parchment and then, to measure the water flux. The experimental device conceived for
its determination was described at section 2.6.
(3.10)
(3.11)

Results
108
Figure 67a and b. Variation of diffusivity as a function of moisture content a) at water
activities lesser than 0.84, b) including high moisture contents.
b
a

Results
109
In order to discard leaks in the experimental set a test with three parchments using a
saturated salt solution of water activity 0.84 at the exterior and 0.50 at T2 was made.
Figure 68 shows the slopes for both tests. If comparing both slopes, we have that the
flux through the five samples is about 5 / 3 of the flux for the three parchments. As
slopes are proportional to the parchments surface, the measured water flux corresponds
well to the flux of matter that crosses the parchment.
Figure 68. Weight variation of the parchment with different chemical potential
gradients. Test made in order to discard leaks.
Figure 69 shows the weight variation of two sets of experiments were at the interior of
the tube conceived to measure the resistance coefficient rp there was a salt solution of
water activity 0.50 and at the exterior two different salt solutions (S2) were set
consecutively: potassium acetate (aw = 0.21) and potassium chloride (aw = 0.84) both
at 35°C.

Results
110
Figure 69. Weight variation of the parchment with different chemical potential
gradients. (int) refers to the salt solution that is at the interior of the cell and (ext) to the
solution that is at the exterior of cell.
As expected the slope for the gradient where the water activity at the exterior was
lower than that at the interior is negative and positive when the water activity at the
exterior is higher. At the beginning of each one, an interval of time to reach the water
activity value at both sides is observed.
Once that the stationary state is achieved, water flux can be calculated from the slope
of the weight change of the cells interior divided by the surface. As parchments were at
the middle of solutions with different water activity, they act as a barrier for water
transfer. Knowing the difference in activity on both sides of the sample, and the flux,
mass transfer coefficient (rp) can be estimated from equation 3.10. It is possible to
determine the diffusivity by converting the water activity at each side of parchment
through the sorption isotherm. Once that the moisture content gradient and the flux are
known diffusivity is determined.
Figure 70 shows the fluxes obtained at three tests given by the slope of the lines in
Figure 68 and 69.

Results
111
Figure 70. Water flux variation vs. time for tests with magnesium chloride and
potassium chloride for three and five parchments.
The calculated water fluxes and transfer coefficients values are reported in Table 9.
Average moisture content is determined supposing that in the surface of both sides of
the parchment moisture content is imposed by the water activity of the saturated salt
solutions. The corresponding moisture content values are given in the sorption
isotherm (Figure 54).

Results
112
Table 9. Summary of the estimated water transfer coefficient in the parchment at
different water activity gradients.
Test Number
of
samples
Internal
activity
aw1
(/)
Internal
moisture
content
X1
(kg water
/ kg dry
solid)
External
activity
aw2
(/)
External
moisture
content
X2
(kg
water /
kg dry
solid)
Average
moisture
content
(/)
Mass flux
(kg m-².s
-1)
x 105
Transfer
coefficient rp
x 105
(kg / m-².s-1)
Average
diffusivity
Dp (m²s-1
)
x 1011
1 5 0.5 0.096 0.21 0.045 0.071 0.54 1.87 1.34
2 5 0.5 0.096 0.84 0.179 0.138 1.18 3.46 1.76
3 3 0.5 0.096 0.84 0.179 0.138 1.03 3.03 1.54
It can be noticed that the tests realized with three and five parchments give similar rp
values despite the variability associated by every natural product. This suggests that, if
there are leaks, they correspond to weak water fluxes in comparison to water flux
through the parchments (Figure 69).
By the other hand, calculations show that the coefficient rp depends on average
moisture content value (Figure 71).
The diffusivity values for these three points obtained using equation 3.11 are
represented in Figure 72. These values are not too distant of the diffusivity values of
the endosperm. These shows that the heterogeneity of the parchment in relation to the
endosperm is more related to the difference of their sorption isotherms that in the
difference of their transfer coefficients.
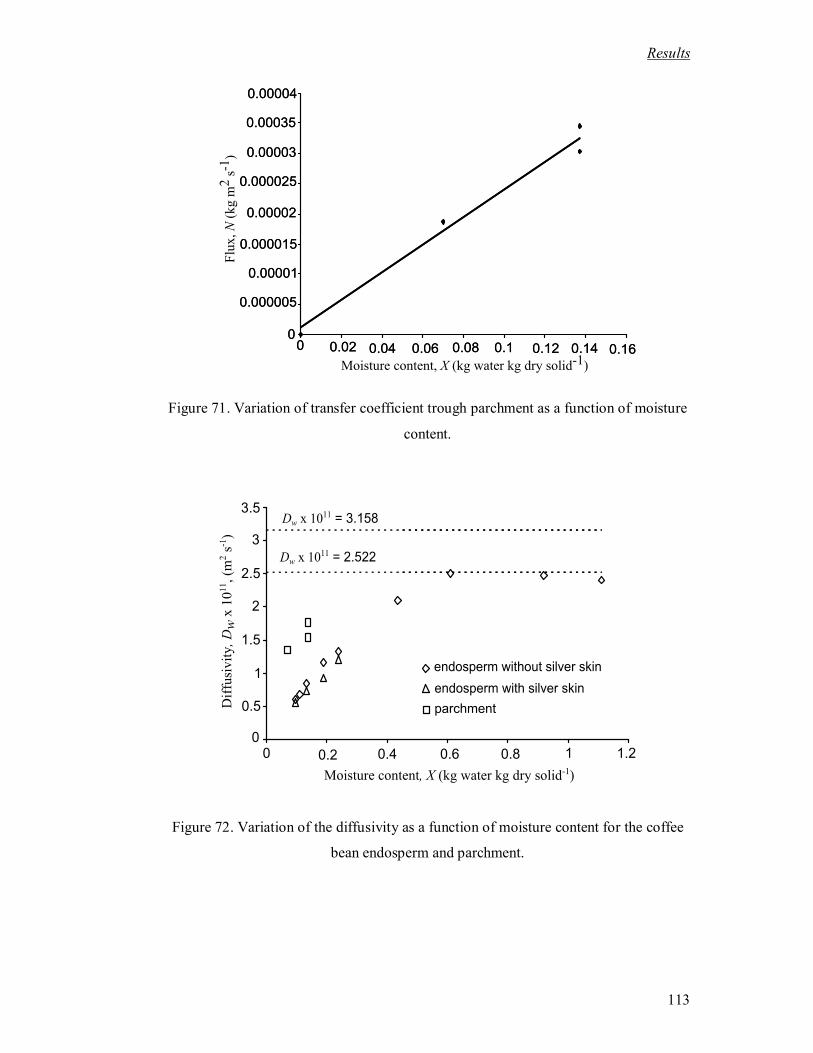
Results
113
Figure 71. Variation of transfer coefficient trough parchment as a function of moisture
content.
Figure 72. Variation of the diffusivity as a function of moisture content for the coffee
bean endosperm and parchment.

Results
114
3.5 Numerical simulation of water transfer in the coffee bean interface.
The behavior of a coffee bean during drying is very complex. This behavior cannot be
really understood until numeric models are used. Numeric modeling allows to
determine the field of water activity. This complexity is largely due to the bean shape
and its internal discontinuities. However microorganisms develop in the bean surface,
either on the parchment when this one envelops the bean entirely, either in the surface
of the endosperm which is situated under the parchment (Figure 73a). When the
parchment is broken (Figure 73b) or the endosperm is broken (Figure 73c) as a
consequence of a bad manipulation during the post-harvest coffee treatments the
microorganisms can develop directly on the endosperm. Therefore it seems appropiate
to model the mass transfer at coffee bean surface when parchment is present. The other
cases that could be present at bean surface can be easily deduced from this condition.
For this purpose, several parameters were determined in this study excepting for the
silver skin. Considering that the diminish of the diffusivity value in the endosperm is
lesser than 10%, we will not consider silver skin for the moment. The proposed model
will consider the mass transfer in the neighborhood of the interface while including the
discontinuity of the parameters due to the parchment.
Figure 73a, b and c. Photographs showing a common coffee bean and its defects: a)
common coffee bean with parchment (FDA, 2010), b) coffee bean with a damaged
parchment, c) coffee bean with a damaged endosperm.
The model inputs are:
a b c

Results
115
The external mass transfer coefficient kc deduced form the experimental drying
kinetics.
The absolute moisture content of the air surrounding the bean Y.
The relationship between the water activity and moisture content for the
parchment and coffee bean endosperm.
The variation of water transfer coefficient as a function of moisture content in
coffee bean endosperm (Dw(X)).
The variation of water transfer coefficient as a function of moisture content
through the parchment (rp(X)).
This model should predict the variation of water activity in the endosperm and
parchment of coffee bean, particularly at drying surface at any drying time.
In order to have a first approach of the model, some hypotheses are made:
Transfer will be considered in one dimension which corresponds to the part 1
of coffee bean.
The temperature at which water activity variation will be studied is 35 °C.
Mass transfer coefficients and isotherm sorption values were obtained at this
temperature.
The natural space existing between the parchment and the endosperm is
negligible, therefore there is a thermodynamic equilibrium of the water in the
parchment and the endosperm, i.e.:
endospermaparchmenta ww
Flux at the middle of the endosperm will be considered as zero.
The geometry and boundary conditions adopted for the simulation of the variation of
water activity at coffee bean surface at schematized at Figure 74:
(3.12)
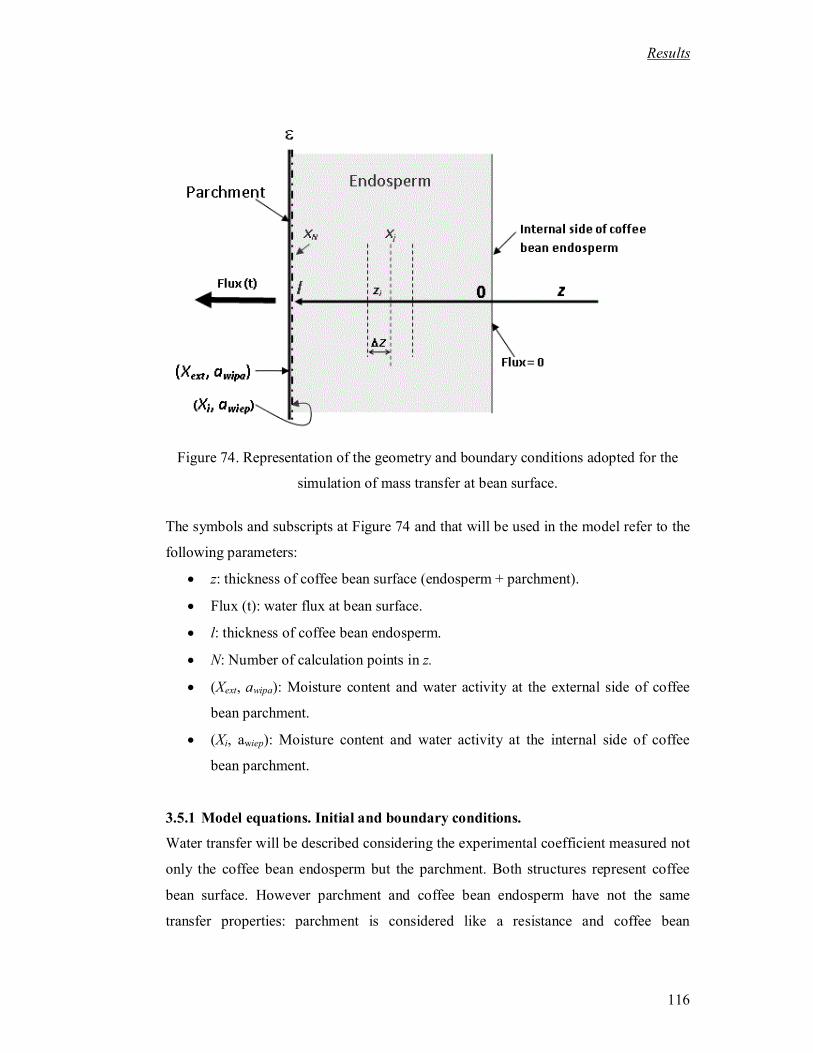
Results
116
Figure 74. Representation of the geometry and boundary conditions adopted for the
simulation of mass transfer at bean surface.
The symbols and subscripts at Figure 74 and that will be used in the model refer to the
following parameters:
z: thickness of coffee bean surface (endosperm + parchment).
Flux (t): water flux at bean surface.
l: thickness of coffee bean endosperm.
N: Number of calculation points in z.
(Xext, awipa): Moisture content and water activity at the external side of coffee
bean parchment.
(Xi, awiep): Moisture content and water activity at the internal side of coffee
bean parchment.
3.5.1 Model equations. Initial and boundary conditions.
Water transfer will be described considering the experimental coefficient measured not
only the coffee bean endosperm but the parchment. Both structures represent coffee
bean surface. However parchment and coffee bean endosperm have not the same
transfer properties: parchment is considered like a resistance and coffee bean

Results
117
endosperm coefficient is calculated from the Crank solution of Fick�s law for an
infinite slab geometry which also depends on moisture content (equation 2.1).
Considering that the relationship between the moisture content and the water activity is
independent from Z (Figure 74), the water transfer at coffee bean endosperm can be
written as:
z
XD
zt
Xw for 0t and lz 0
Where X is the endosperm moisture content and wD is the water diffusivity in the
endosperm. A plot showing the relationship between the diffusivity and the moisture
content in the endosperm is given at Figure 68. At the endosperm-parchment interface:
wipawieppi
cw aarz
XD
at z l and 0t
Where X is the endosperm moisture content evaluated at the endosperm-parchment
interface, pr is the mass transfer resistance of parchment ( -2 -1kg m s ), wiepa is the
water activity of endosperm or parchment at interface, and wipaa is the water activity
of parchment or air at interface parchment-air. At the internal side of coffee bean
endosperm (Figure 74), flux is taken as null, therefore the boundary conditions is:
0dz
XDw at 0z and 0t
Assuming that parchment has not water accumulation, the interface parchment-air
boundary condition can be also written as:
p wiep wipa c a ir a a k Y Y at z l and 0t
(3.13)
(3.14a)
(3.15)
(3.14b)

Results
118
Where ck is the mass transfer coefficient, a is the air density, iY is the air moisture
content at interface and Y is the air moisture content. It is a conventional practice
assuming that water is in equilibrium between phases in both interfaces. Therefore in
the endosperm-parchment interface, water activity value is given by:
1wiep wie wipa a a at z l and 0t
where wiea is the water activity of endosperm at interface and 1wipa is the water
activity of parchment at endosperm-parchment interface.
In the case of parchment-air interface:
2wipa wia wipa a a and 0
0
18
291
wia wi
wia w
a p pY
a p p at z l and 0t
where wiaa is the water activity of air at interface and 2wipa is the water activity of
parchment at parchment-air interface. From equations 3.15 and 3.17:
0
0
18
291
wipa wp wiep wipa c a
wipa w
a p pr a a k Y
a p p
Which is a single (second order) equation for wipaa .
3.5.2 Model equations discretization.
The model equations were solved using a finite element schema. Equation 3.13 which
describes the water transfer at coffee bean endosperm is then transformed in:
z
z
XXD
z
XXD
dt
dXjj
wjjj
wjj
121
121
(3.16)
(3.17)
(3.18)
(3.19)
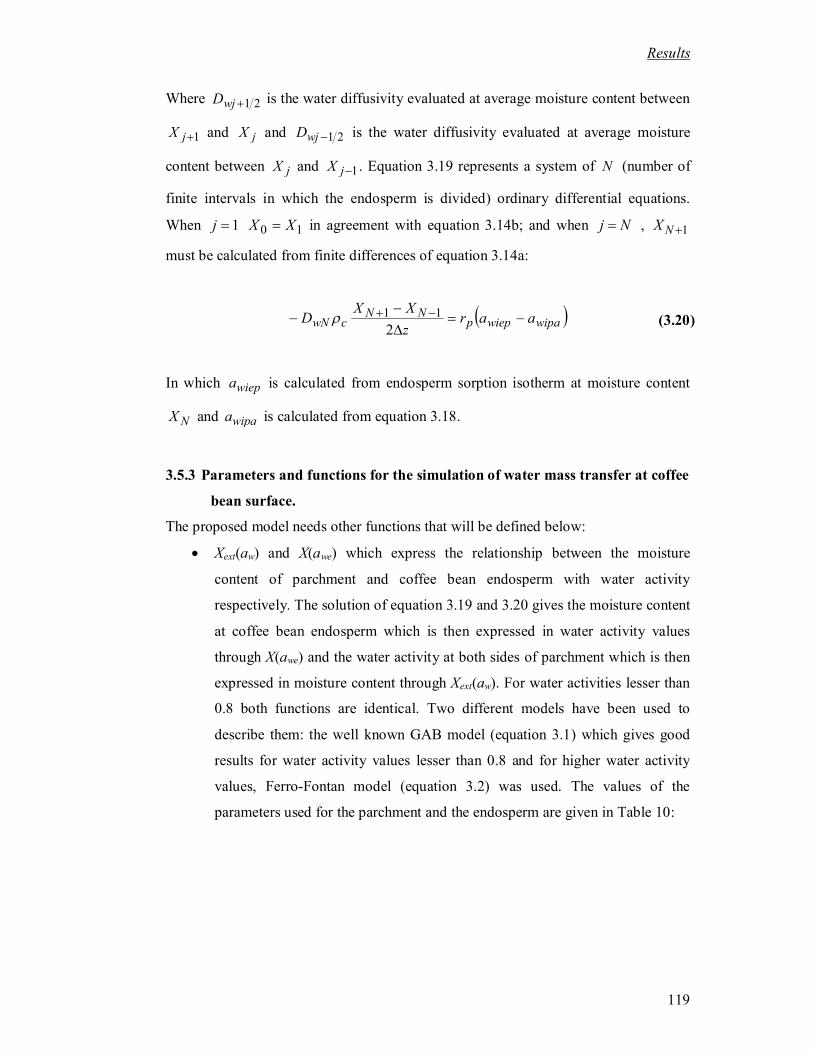
Results
119
Where 21wjD is the water diffusivity evaluated at average moisture content between
1jX and jX and 21wjD is the water diffusivity evaluated at average moisture
content between jX and 1jX . Equation 3.19 represents a system of N (number of
finite intervals in which the endosperm is divided) ordinary differential equations.
When 1j 10 XX in agreement with equation 3.14b; and when j N , 1NX
must be calculated from finite differences of equation 3.14a:
wipawieppNN
cwN aarz
XXD
2
11
In which wiepa is calculated from endosperm sorption isotherm at moisture content
NX and wipaa is calculated from equation 3.18.
3.5.3 Parameters and functions for the simulation of water mass transfer at coffee
bean surface.
The proposed model needs other functions that will be defined below:
Xext(aw) and X(awe) which express the relationship between the moisture
content of parchment and coffee bean endosperm with water activity
respectively. The solution of equation 3.19 and 3.20 gives the moisture content
at coffee bean endosperm which is then expressed in water activity values
through X(awe) and the water activity at both sides of parchment which is then
expressed in moisture content through Xext(aw). For water activities lesser than
0.8 both functions are identical. Two different models have been used to
describe them: the well known GAB model (equation 3.1) which gives good
results for water activity values lesser than 0.8 and for higher water activity
values, Ferro-Fontan model (equation 3.2) was used. The values of the
parameters used for the parchment and the endosperm are given in Table 10:
(3.20)
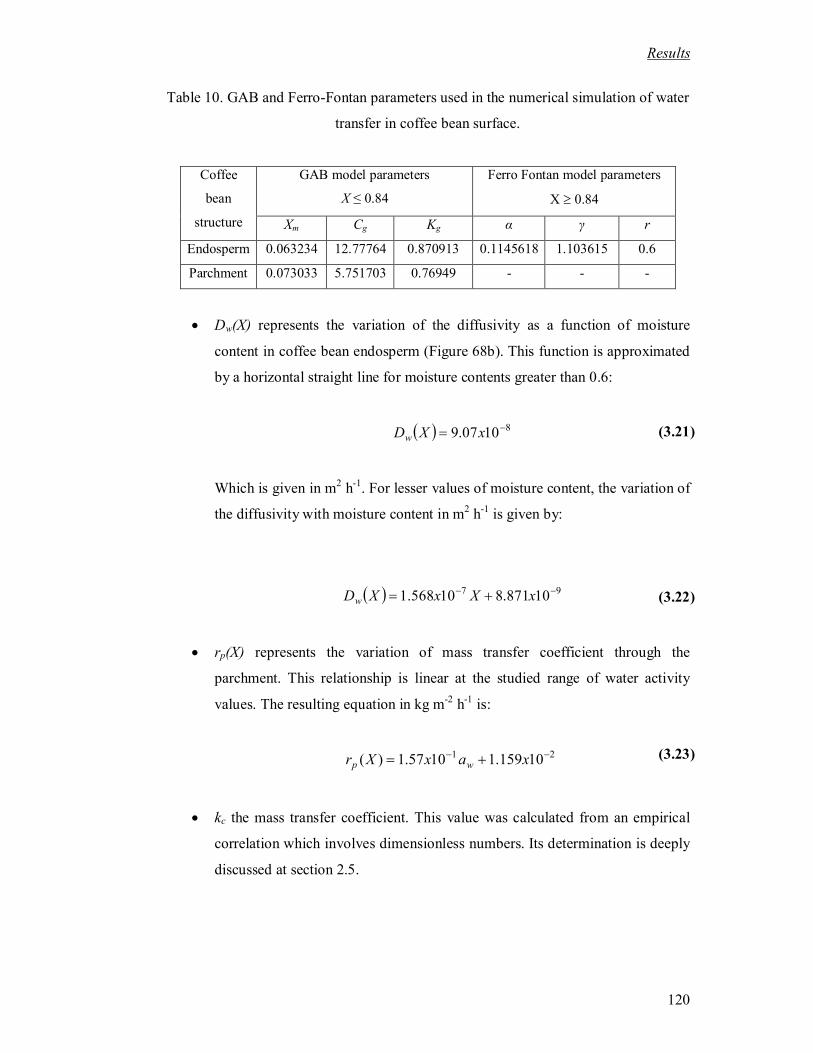
Results
120
Table 10. GAB and Ferro-Fontan parameters used in the numerical simulation of water
transfer in coffee bean surface.
Coffee
bean
structure
GAB model parameters
X ≤ 0.84
Ferro Fontan model parameters
X 0.84
Xm Cg Kg g け r
Endosperm 0.063234 12.77764 0.870913 0.1145618 1.103615 0.6
Parchment 0.073033 5.751703 0.76949 - - -
Dw(X) represents the variation of the diffusivity as a function of moisture
content in coffee bean endosperm (Figure 68b). This function is approximated
by a horizontal straight line for moisture contents greater than 0.6:
81007.9 xXDw
Which is given in m2 h-1. For lesser values of moisture content, the variation of
the diffusivity with moisture content in m2 h-1 is given by:
97 10871.810568.1 xXxXDw
rp(X) represents the variation of mass transfer coefficient through the
parchment. This relationship is linear at the studied range of water activity
values. The resulting equation in kg m-2 h-1 is:
21 10159.11057.1)( xaxXr wp
kc the mass transfer coefficient. This value was calculated from an empirical
correlation which involves dimensionless numbers. Its determination is deeply
discussed at section 2.5.
(3.22)
(3.23)
(3.21)

Results
121
3.5.4 Model simulation results.
Figure 75 shows the simulation results of the moisture content of different parts of the
endosperm and the parchment using the experimental conditions of a drying kinetic of
whole beans at 35 °C (Figure 65). These conditions are listed in Table 11. The
different parts correspond to the coffee endosperm according with Figure 74 to the
surface NX , the internal side of coffee bean endosperm 0X , and the external
extX and internal iX sides of the parchment. Also the experimental kinetic of the
average moisture content in whole coffee beans beanwholeX are represented.
Figure 75. Kinetics of moisture content in different parts of the endosperm and the
parchment. Simulation performed with air experimental conditions.
Table 11. Experimental drying air values used in the numerical simulation of water
transfer in coffee bean surface.
Simulation condition Value
Air temperature (T) 35°C
Air absolute moisture content (Y) 0.017 kg water kg dry air-1
Mass transfer coefficient (kc) 25.96 m h-1
Results
122
As expected, Figure 75 shows a difference between the moisture content at the surface
NX and the internal side of coffee bean endosperm 0X . Parchment also shows a
difference between the moisture content of its both sides revealing an important
resistance to water transfer considering its thickness (0.1 mm). Moisture content of
coffee parchment external side extX sharply decreases at the beginning of drying: it
passes from a moisture content of 1.19 kg water kg dry solid-1
to a value of 0.089.
After 0.5 h this value remains constant i.e. it equilibrates with the relative humidity of
air. This behavior seems logical because is the external side of parchment extX
which is directly exposed to drying air. The time in which the external side of the
parchment equilibrates confirms its lower hygroscopic nature if compared with coffee
bean endosperm and the whole bean. This behavior was already observed in the
sorption isotherm of coffee parchment (Figure 54a) and it is attributed to its
lignocellulosic composition which has lower concentration of soluble solids. On the
other hand, internal side of the parchment iX does not equilibrate so quickly. The
first part of its drying kinetic can not be calculated because data at high water activity
values for coffee parchment were not obtained, however it is clear that moisture
content do not decrease in this period. Moreover its moisture content values are lesser
than those found at the surface of coffee bean endosperm NX . This difference
reveals a discontinuity of the moisture content value at this boundary.
Figure 76 shows the water activity values of the parchment and coffee bean
endosperm. Water activity of the external side of parchment wipaa also equilibrates
rapidly with drying air. At equilibrium, the water activity of media and the relative
humidity of air are the same. Relative humidity of air can be known using a
psychometric diagram. In this diagram two characteristics of drying air should be
known. In this case, the air absolute moisture content and temperature (Table 11) are
known. For these values, the corresponding relative humidity is of 48 %. This
coincidence of the water activity value confirms the good performance of the proposed
model to study mass transfer at coffee bean.
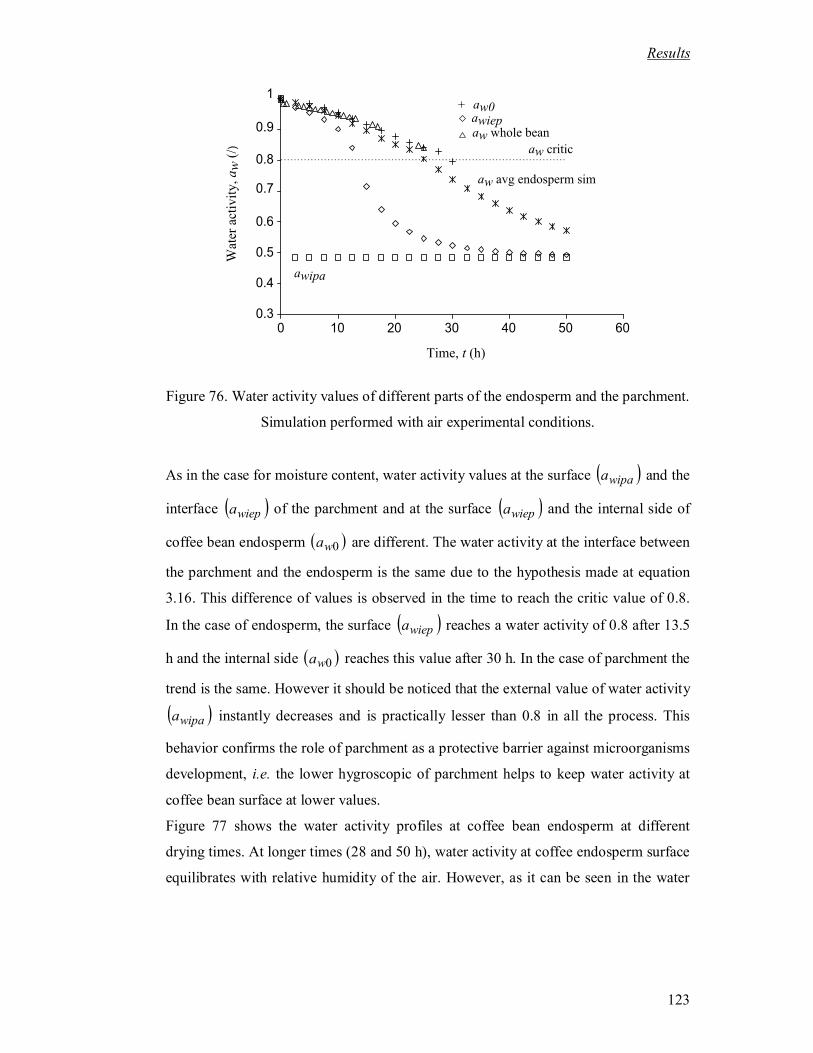
Results
123
Figure 76. Water activity values of different parts of the endosperm and the parchment.
Simulation performed with air experimental conditions.
As in the case for moisture content, water activity values at the surface wipaa and the
interface wiepa of the parchment and at the surface wiepa and the internal side of
coffee bean endosperm 0wa are different. The water activity at the interface between
the parchment and the endosperm is the same due to the hypothesis made at equation
3.16. This difference of values is observed in the time to reach the critic value of 0.8.
In the case of endosperm, the surface wiepa reaches a water activity of 0.8 after 13.5
h and the internal side 0wa reaches this value after 30 h. In the case of parchment the
trend is the same. However it should be noticed that the external value of water activity wipaa instantly decreases and is practically lesser than 0.8 in all the process. This
behavior confirms the role of parchment as a protective barrier against microorganisms
development, i.e. the lower hygroscopic of parchment helps to keep water activity at
coffee bean surface at lower values.
Figure 77 shows the water activity profiles at coffee bean endosperm at different
drying times. At longer times (28 and 50 h), water activity at coffee endosperm surface
equilibrates with relative humidity of the air. However, as it can be seen in the water

Results
124
activity profile at 28 h, surface can be drier but the internal tissue has higher values. At
the beginning of the process, coffee bean surface has high water activity values.
Figure 77. Profiles of water activity in the endosperm at experimental conditions.
Experimental conditions (Table 11) revealed important features. One of them is the
role of the parchment as a protective barrier against microorganisms� development. In
order to probe its behavior in other environmental conditions a simulation was carried
out considering that the relative humidity in the air was 80 %. Figure 78 shows the
water activity values at parchment surface wipaa and in its interface wiepa . Also
the average water activity at coffee bean endosperm (aw avg endosperm sim) and of the
whole bean (aw whole bean) are shown.
In this case the behavior of parchment is the same: water activity at the external side wipaa is drier than interface wiepa . However as parchment external side wipaa
will equilibrate with air relative humidity and in this case it is high, parchment water
activity tends to a high water activity.

Results
125
Figure 78. Water activity values of endosperm and the parchment. Simulation
performed considering high relative humidity conditions of drying air.
Figure 79 shows the water activity profiles in the same conditions. As it can be
expected water activity at coffee bean endosperm is higher than 0.8. As drying air has
a high moisture content value, drying is slow.
Another condition that was considered was the absence of parchment in coffee bean.
Simulations were carried out considering experimental drying air conditions (Table
11). Figure 80 shows the average moisture content of coffee bean endosperm with (X
avg end with parchment) and without parchment (X avg end with parchment) and the
experimental moisture content of a whole bean (X whole bean). Simulation showed
that coffee bean endosperm without parchment dries faster than whole coffee bean.
The same trend is observed for the water activity values: critic water activity value of
0.8 is achieved in lesser time if compared with a whole bean or the endosperm with
parchment (Figure 81).

Results
126
Figure 79. Profiles of water activity in the endosperm simulated considering high
relative humidity conditions of drying air.
Figure 80. Simulation of moisture content values of coffee bean endosperm with and
without parchment.

Results
127
Figure 81. Simulation of water activity values of endosperm with and without
parchment.
Water activity profiles for a coffee bean without parchment (Figure 82) confirms the
behavior of the drying kinetics simulated with experimental values (Figure 75): as
coffee bean endosperm surface equilibrates with drying air in lesser time, mass transfer
is faster. These results show that particular care should be given to beans
commercialized without parchment as green coffee, because the opposite process of
drying, the rehydration would occur faster. This is particular true at transport and
storage conditions where beans are already dry and the environmental air can be moist.

Results
128
Figure 82. Water activity profiles of coffee bean endosperm without parchment.

129
CONCLUSIONS
Internal structure of coffee bean has discontinuities that separate tissues of different
structure and composition. Observations have shown that cellular structure is
heterogenic but distributed regularly. It has not been demonstrated heterogeneity of the
relationship between water activity and moisture content in the endosperm. However,
this result should be confirmed by reducing the sample size and diversifying the
sampling points. The parchment has a specific lignified composition and structure that
results in an isotherm different from that of the endosperm.
Silver skin presence is important, moreover, in the furrow at fresh state it is hydrated
and when it begins to dry it becomes thinner. The exact moment when this happens at
drying is unknown, however it seems clear that meanwhile silver skin is humid it will
almost occupy the furrow. Mucilage is also present in the natural discontinuity of
coffee bean and also when it begins to dry, spaces are created. Particular tests should
be conducted to analyze the possibility of fungal development in the furrow.
Coffee endosperm shows a constant diffusivity value for moisture contents values
higher than 0.65. This constant diffusivity is also found in the tests carried out in the
whole bean. This should be explained considering that at initial states of drying the
whole bean behaves like a homogenous structure. Below this value, the diffusivity
decreases with moisture content and becomes zero when the endosperm is dry. As
drying progresses, water diffusivity in the parchment decreases for two reasons: 1) The
contraction of the cellular structure which is accompanied by a reduction of the water
flux. At the same time the contraction generates the enlargement or the appearance of
macroscopic spaces filled with air; 2) The increase of the bonding between the water
and the solid matrix. This effect is quantified by the sorption isotherm. The binding
energy between water and the rest of the structure increases significantly when the
moisture content and the mobility of water decreases. This results into a diffusivity that
decreases with moisture content until it becomes zero.

Conclusions
130
At the moment a simple one dimension (1D) numeric model was proposed in order to
know the values of water activity and moisture content at coffee bean surface. Results
showed that coffee parchment offers a resistance to water transfer, which joint to the
difference in sorption characteristic, establish a discontinuity on moisture content
between the gas phase locates outside the bean and the gas phase between the
parchment and the endosperm. Therefore, parchment reduces the risk of Aspergillus
ochraceus contamination of the endosperm if compared to a case where it has been
destroyed. Also, the endosperm of damaged coffee beans is more susceptible to
contamination than whole beans because the endosperm at the damaged surface has the
same activity that the intergranular air.
It can be noticed that the activity of the endosperm decreases from 0.95 to 0.8 as
moisture content decreases from 0.6 to 0.2 (Figure 54a). Is in this zone where the risk
of contamination is higher. Also in this zone, the diffusivity in the endosperm varies
with moisture content (Figure 72). This shows the importance of the precise
knowledge of equilibrium and water transfer properties in different parts of the coffee
bean as a function of moisture content.
The experimental techniques proposed in this work should allow proposing a finest
analysis of the equilibrium and transferring properties in other parts of the bean.

References
131
REFERENCES
Anoua, M. (1986). Reconnaissance de coefficients de transferts en milieux poreux :
diffusion (bois) et conduction (sol). Thèse Université Montpellier 2.
AOAC., (1990). Official Methods of Analysis. Washington, DC: Association of
Official Analytical Chemists.
Auria R.,Bénet J.C. (1990). Transport de l'eau dans une feuille de caoutchouc naturel
pendant la période de séchage à vitesse décroissante. International Journal of Heat
Mass Transfer. 33(9): 1885-1893.
Auria R., Bénet J.C., Cousin B., Sainte B. (1992). Drying of natural rubber in a sheet
form. Internal structure and water transfer. Journal of Natural Rubbers Research.
6(4): 215-222.
Avallone, S. (1999). Etude de la fermentation naturelle de Coffea arabica L. et des
mécanismes de fluidification du tissu mucilagineux. Thèse Université Montpellier 2.
Baucour P. and Daudin J.D. (2000). Development of a new method for fast
measurement of water sorption isotherms in the high humidity range, validation on
gelatine gel. Journal of Food Engineering. 44: 97-107.
Baker C.G.J. (1998). Energy consumption of continuous well-mixed fluidized bed
dryers. In Proccedings of the 11th
International Drying Symposium. Halkidiki,
Greece. Vol. A: 488-495.
Balaban, M., & Pigott, G. M. (1988). Mathematical model of simultaneous heat and
mass transfer in food with dimensional changes and variable transport parameters.
Journal of Food Science. 53(3): 935-939.
Banga J. R. and R. P. Singh (1994). Optimization of the air drying of foods. Journal of.
Food Engineering. 23:189-211.
Bénet J.C. and Mignard E. (1985). Sur l'hydrodynamique d'une solution idéale dans un
milieu poreux non saturé. Analyse de la loi de Darcy et de la loi de Fick par la
thermodynamique des processus irréversibles. Comptes Rendus de l�Academie des
Sciences Paris. 20: 1439-1442.

References
132
Bénet J.C., Ouedraogo F., Lozano A.L., Cherblanc F. (2007). Utilisation des potentiels
chimiques en mécanique des milieux complexes. Cas du transport de matière sous
contraintes en milieu biphasique, élastique, hygroscopique. In 18th French Mechanic
Congress, Grenoble, France. CD-ROM.
Bialobrzewski I., and Markowski M. (2004). Mass transfer in the celery slice: Effects
of temperature, moisture content, and Density on Water diffusivity. Drying
Technology. 22(7): 1777-1789.
Chang S. (2008). Tissue differentiation in soft wood. Thesis of the Central South
University of Forestry and Technology.
Córdova, A. V, Ruiz-Cabrera, M.A., García-Alvarado, M. A. (1996). Analytical
solution for mass transfer equation with interfacial resistance in Food Drying. Drying
Technology. 14(7&8): 1845-1826.
Corrêa, P. C., Resende, O., Menezes, D. R. (2006). Drying characteristics and kinetics
of coffee berry. Revista Brasileira de Produtos Agroindustriais. 8: 1-10.
Crank J., (1975). In the Mathematics of Diffusion, 2nd edition. New York, NY:
Editorial Oxford University Press.
Cussler, E. L. (1997). Diffusion. 2nd ed., Cambridge University Press, New York.
De Castro RD, Estanislau WT, Carvalho MLM, Hilhorst HWM. (2005). Functional
development and maturation of coffee (Coffea arabica) fruits and seeds. In
Proceedings of the 20th International Scientific Colloquium on Coffee, Bangalore,
International Scientific Association on Coffee, Paris, 619�635.
De Castro, R.D., and Marraccini, P. (2006). Cytology, biochemistry and molecular
changes during coffee fruit development. Brazilian Journal of Plant Physiology. 18:
175-199.
Dedecca D.M. (1957). Anatomia e desenvolvimento ontogenético de Coffea arabica L.
var. Typica Cramer. Bragantia. 16: 315-355.
Defay, R., Prigogine, P., Belleman,A., Everett,D.,H. (1966). Surface tension and
adsorption, London. Longmans, Green & Co LTD.
Dentan E (1985). Coffee: botany, biochemistry and production of beans and beverage,
The Avi Publishing Company, Westport.
Doulia D., Tzia K., Gekas V. (2000). A knowledge base for the apparent mass
diffusivity (DEFF) of foods. International Journal of Food Properties. 3(1): 1-14.
Edlefsen, N.E., Anderson, A.B.C. (1942). Thermodynamics of soil moisture.

References
133
Hilgardia. (15): 31-298.
Efremov, G., & Kudra, T. (2004). Model-based estimated for time-dependent apparent
diffusivity. Drying technology. 23(12): 2513-2522.
Eira, M.T.S., Amaral da Silva, E.A., De Castro, R.D., Dussert, S., Walters, C., Bewley,
J.D., & Hilhorst, H.W.M. (2006). Coffee seed physiology. Brazilian Journal of Plant
Physiology. 18: 149-163.
FAO (2008). Discussion paper on Ochratoxin A in coffee.
FDA(2010).http://www.google.com/imgres?imgurl=http://www.fda.gov/ucm/groups/f
dagovpublic/documents/image/ucm084344.jpg&imgrefurl=http://www.fda.gov/Food
/ScienceResearch/LaboratoryMethods/MacroanalyticalProceduresManualMPM/ucm
084337.htm
Ferro Fontán C., Chirife J., Sancho E., Iglesias H.A. (1982). Analysis of a model for
water sorption phenomena in foods. Journal of Food Science. 47: 1590-1594.
Frank J.M. (2000). On the activity of fungi in coffee in relation to ochratoxin A
production. In Proceedings of the 10th
International Union of Pure and Applied
Chemists (IUPAC) Symposium on Mycotoxins and Phycotoxins, Sao Paulo, Brazil.
CD-ROM.
Fredlund D. G. and Xing A. (1994). Equation for the Soil-Water Characteristic Curve.
Canadian Geotechnical Journal. 31: 521 � 532.
Garcia-Alvarado M.A., De la Cruz-Medina J., Waliszewski-Kubiak K.N., Salgado-
Cervantes M.A. (1995). Statistical Analysis of the GAB and Henderson Equations
for Sorption Isotherms of Foods. Drying Technology. 13(8): 2141-2152.
Geankoplis, C.J. (1998). Transport Processes and Separation Process Principles, 3th
edition, México, D.F. Compañía editorial continental S.A. de C.V.
Gekas V. (2001). Mass transfer modeling. Journal of Food Engineering. 49(2 & 3): 97-
102.
Geromel C., Pires-Ferreira L., Carmelo-Guerreiro S. M., Cavalari A. A., Pot D.,
Protásio-Pereira L. F., Leroy T., Esteves-Vieira L. G., Mazzafera P., Marraccini P.
(2006). Biochemical and genomic analysis of sucrose metabolism during coffee
(Coffea arabica) fruit development. Journal of Experimental Botany. 57(12): 3243-
3258.
Guggenheim, E. A. (1965). Thermodynamique, Paris, France. Editorial Dunod.
Guyot B. and Duris D. (2002). Café et contamination par l�Ochratoxine A. Plantation,

References
134
recherhe, developpement: Publications du CIRAD. 17-21
Hernández-Díaz, W.N., Ruiz-López, I.I., Salgado-Cervantes, M.A., Rodríguez-
Jimenes, G.C., & García-Alvarado, M.A. (2008). Modelling heat and mass transfer
during drying of green coffee beans using prolate spheroid geometry. Journal of
Food Engineering. 86: 1-9.
Huxley P.A. (1964). Some factors which can regulate germination and influence
viability of coffee seeds. International Procedures of Seed Test Association. 29:33-
60.
Iglesias, H.A. and Chirife, J. (1976). BET monolayer values in dehydrated foods and
food components. Lebensmittel-Wissennschaft und Technologie. 9: 107-113.
Jamin F. (2003). Contribution à l�étude du transport de matière et de la rhéologie dans
les sols non saturés à différentes températures. Thèse Université des Sciences et
Techniques du Languedoc.
Job, G., and Hermann, F., (2006). Chemical potential-a quantity in search of
recognition. European Joural of Physics. 27: 353-371.
Kaleemullah S. and Kailappan R. (2007). Monolayer moisture, free energy change and
fraction of bound water of red chilies. Journal of Stored Products Research. 43: 104-
110.
Kasser A. and Kasser I. M. (1969). Cellulose dissolving pulp produced from grain
parchment. U.S.Patent No. 3,429,771.
Kemp I.C. (2004). Reducing dryer energy use by process integration and pinch
analysis. In Proccedings of the 14th
International Drying Symposium. Sao Paolo,
Brazil. Vol. B: 1029-1036.
Koch M., Steinmeyer S., Tiebach R., Weber R., Weyerstahl P. (1996). Bestimmung
von
Ochratoxin A in Rostkaffee. (Determination of ochratoxin A in roasted coffee.).
Deutsch Lebensmittel Rundschau. 2: 48-51.
Kouadio, A.I., Lebrihi, A., N�zi-Agbo, G., Mathieu, F., Pfohl-Leszkowiz, A., &
Bretin-Dosso, M. (2007). Influence de l�interaction de la température et de l�activité
de l�eau sur la croissance et la production de l�ochratoxine A par Aspergillus niger,
Aspergillus carbonarius et Aspergillus ochraceus sur un milieu de base café.
Canadian Journal of Microbiology. 53: 852-859.

References
135
Levi, C.P., Trenk, H.L., Mohr, H.K. (1974). Study of the occurrence of ochratoxin A
in green coffee beans. Journal of the AOAC. 57: 866� 870.
Levi, C. P. (1980). Mycotoxins in coffee. Journal of the AOAC. 63: 1282-1285.
Low, P.F., (1961). Concept of total potential in water and its limitations: A critique.
Soil Sciences. (91): 303-305.
Lozano, A.-L. (2007). Etude expérimentale du changement de phase liquide/gaz dans
un sol hygroscopique. Evaporation et condensation de l'eau. Dissolution du C02.
Thèse Université Montpellier 2.
Mariette F. (2004). Relaxation RMN et IRM: un couplage indispensable pour l�étude
des produits alimentaires. Comptes Rendus en Chimie. 7: 221-232.
Maroulis, Z.B., Kiranoudis, C.T., & Marinos-Kouris, D. (1995). Heat and mass
transfer modeling in air drying of foods. Journal of Food Engineering. 26: 113-130.
Mateus, M.L., Champion, D., Liardon, R., Voilley, A. (2007). Characterization of
water mobility in dry and wetted roasted coffee using low-field proton nuclear
magnetic resonance. Journal of Food Engineering. 81: 572-579.
Mburu, J.K. (1999). Notes on coffee processing procedures and their influence on
quality. Kenya Coffee. 64: 2861�2867.
Mrani I., Fras G., Bénet J.C. (1995). Numerical study of drying stresses in agar gel.
Drying Technology. 13(3): 551-570.
Mulet, A. (1994). Drying modeling and water diffusivity in carrots and potatoes.
Journal of Food Engineering. 22: 329-348.
Müller, I. (2001). Thermodynamics of mixture and phase field theory. International
Journal of Solids and Structures. 38: 1105-1113.
Ouedraogo, F. (2008). Etude de transfert d�eau à l�interface sol-atmosphère, Thèse
Université des Sciences et Techniques du Languedoc.
Ouoba, S., Cherblanc, S., Cousin, B., Bénet, J.C. (2010). A new experimental method
to determine the sorption isotherm of a liquid in a porous medium. Enviromental
Science & Technology. 44(15): 5914-5919.
Palacios-Cabrera, H., Taniwaki, H.M., Menezes, C.H., Iamanaka, T.B. (2004). The
production of ochratoxin A by Aspergillus ochraceus in raw coffee at different
equilibrium relative humidity and under alternating temperatures. Food Control. 15:
531-535.
References
136
Pardo E., Marim S., Ramos A.J., Sanchis V. (2004). Occurrence of ochratoxigenic
fungi and ochratoxin A in green coffee from different origins. Food Science
Technology. International. 10: 45-50.
Paulino de Moraes, M.H., & Luchese, R.H. (2003). Ochratoxin A in green coffee:
influence of harvest and drying processing procedures. Journal of Agricultural and
Food Chemistry. 51: 5824-5828.
Pereira-Goulart, P.F., Donizeti-Alves J., Mauro de Castro E., Deitos-Fries D.;
Magalhães M.M.; Cabral de Melo H. (2007). Aspectos histoquímicos e morfológicos
de grãos de café de diferentes qualidades. Ciencia Rural. 37(3): 662-666.
Pittet A., Tornare D., Huggett A., Viani R. (1996). Liquid chromatographic
determination of ochratoxin A in pure and adulterated soluble coffee using an
immunoaffinity column cleanup procedure. Journal of Agricultural Food Chemistry.
44: 3564�3569.
Ponsart G., Vasseur J., Frias J.M., Duquesnoy A., Méot J.M. (2003). Modelling of
stress due to the shrinkage during drying of spaghetti. Journal of Food Engineering.
57: 277-285.
Redgwell RJ, Curti D, Rogers J, Nicolas P, Fischer M. (2003). Changes to the
galactose/mannose ratio in galactomannans during coffee bean (Coffea arabica L.)
development: implications for in vivo modification of galactomannan synthesis.
Planta. 217: 316�326.
Rockland L.B. and Nishi S.K. (1980). Influence of water activity on food product
quality and stability. Food Technology. 34: 42-51.
Ruiz T. and Bénet J.C.(1998) Potentiels de transport d'une solution diluée en milieu
poreux. Comptes Rendus de l�Academie des Sciences de Paris. 236: 415-421.
Ruiz-Lopez, I.I., Córdova, A.V., Rodríguez-Jimenes, G.C., & Garcia-Alvarado, M.A.
(2004). Moisture and temperature evolution during food drying: effect of variable
properties. Journal of Food Engineering. 63(1): 117-124.
Sapru, V., & Labuza, T.P. (1996). Moisture transfer simulation of packaged fruit-
cereal systems. Journal of Food Engineering. 27: 45-61.
Schenker S., Handschin S., Frey B., Perren R., Escher F. (2000). Pore structure of
coffee beans affected by roasting Conditions. Journal of Food Science. 65(3): 452-
457.
Sfredo, .M.A., Finzer, J.R.D., Limaverde, J.R. (2005). Heat and mass transfer in coffee

References
137
beans drying. Journal of Food Engineering. 70: 15-25.
Studer-Rohr I., Dietrich D.R., Schlatter J., Schlatter Ch. (1994a). Ochratoxin A im
Kaffee: Neue Erkenntnisse und Toxikologie (Ochratoxin A in coffee: new evidence
and toxicology). Lebensmittel Technologie. 27: 435-441.
Studer-Rohr I., Dietrich D.R., Schlatter J., Schlatter Ch. (1994b). Ochratoxin A and
coffee. Mittel Geb Lebensmittelunters Hygiene. 85: 719-727.
Studer-Rohr I., Dietrich D.R., Schlatter J., Schlatter C. (1995). The occurrence of
ochratoxin A in coffee. Food Chemistry Toxicology. 33: 341-355.
Suárez-Quiroz, M., Gonzalez-Ríos, O., Barel, M., Guyot, B., Schorr-Galindo, S., &
Guiraud, J.P. (2004). Effect of chemical and enviromental factors on Aspergillus
ochraceus growth and toxigenesis in green coffee. Food Microbiology. 21: 629-634.
Suárez-Quiroz, M., Gonzalez-Ríos, O., Barel, M., Guyot, B., Schorr-Galindo, S., &
Guiraud, J.P. (2005). Effect of post-harvest processing procedure on OTA
occurrence in artificially contaminated coffee. International Journal of Food
Microbiology. 103: 339-345.
Sutherland, P.W., Hallett, I.C., MacRae, E., Fischer, M., & Redgwell, R.J. (2004).
Cytochemistry and immunolocalisation of polysaccharides and proteoglycans in the
endosperm of green Arabica coffee beans. Protoplasma. 223: 203-211.
Taniwaki, M.H., Pitt, J.I., Teixeira, A.A., & Iamanaka, B.T. (2003). The source of
ochratoxin A in Brazilian coffee and its formation in relation to processing methods.
International Journal of Food Microbiology. 82: 173-179.
Timmerman, E.O., Chirife, J., Iglesias H.A (2001). Water sorption isotherms of foods
and foodstuffs: BET or GAB parameters ?. Journal of Food Engineering. 48: 19-31.
Toffanin, R., Piras, A., Szomolanyi, P., Vittur, F., Pacorini, R., & Schillani, F. (2001).
NMR microscopy as a non-destructive tool to probe water and oil in green coffee. In
19th International Conference on Coffee Science, Trieste, Italy 19, pp. 271�277.
Tsubouchi H., Yamamoto K., Hisada K., Sakabe A. (1985). A survey of occurrence of
mycotoxins and toxigenic fungi in imported green coffee beans. Proceedings of the
Japanese Association of Mycotoxicology. 19: 16�21.
Wang., N., & Brennan, J.G. (1995). A mathematical model of simultaneous heat and
mass transfer during drying of potato. Journal of Food Engineering. 24: 47-60.
Waananen, K. M. and Okos, M. R. (1996). Effect of porosity on moisture diffusion
during drying of pasta. Journal of Food. Engineering. 28(2): 121-137.

References
138
Zogzas N.P., Matroulis Z.B., Marinos-Kouris D. (1994). Moisture diffusivity: Methods
of experimental determination. A review. Drying Technology. 12(3): 483-515.
Zogzas N.P. and Matroulis Z.B. (1996). Effective moisture diffusivity estimation from
drying data. A comparison between various methods of analysis. Drying
Technology. 14(7&8): 1543-1573.


TITRE Structure interne et transport d’eau dans l’endosperme et la parche du grain de café ____________________________________________________________________________________________ RESUME L’objectif de cette thèse est de contribuer à déterminer les régions possibles de croissance Aspergillus Ochraceus (O.A.) lors du séchage du café. Il est admis que ce champignon qui produit une toxine (Ochratoxine A), se développe pour une activité de l’eau supérieure à 0,8. La structure interne du grain de café est étudiée par microscopie, stéréoscopie et RMN. Ces observations mettent en évidence une grande hétérogénéité de structure à l’échelle du grain et à l’échelle cellulaire. Les isothermes de désorption pour cinq parties du grain sont établies. Mis à part la parche qui présente une structure ligneuse, il n’a pas été mis en évidence de différences notables des isothermes dans les autres parties du grain. L’étude des transferts d’eau est focalisée à la surface du grain, site privilégié de la croissance d’O.A. où trois structures présentent une résistance au transfert d’eau : l’endosperme, la couche argentée, la parche. Dans l’endosperme, le transport est décrit par une loi de diffusion. Pour des teneurs en eau supérieures à 65%, un coefficient de diffusion constant décrit bien la cinétique d’un grain entier. Au dessous de cette teneur en eau, le coefficient de diffusion décroit avec la teneur en eau. Ceci est dû, d’une part, à la réduction de l’espace poral occupé par l’eau et, d’autre part, à l’augmentation de la liaison entre l’eau et le squelette solide lorsque la teneur en eau diminue. Les essais de diffusion avec et sans la couche argentée montrent que la contribution de cette dernière est de l’ordre de 10%. Le flux d’eau dans la parche est supposé proportionnel à la différence d’activité de part et d’autre de celle-ci. Une technique expérimentale originale est proposée pour mesurer la résistance au transfert d’eau de la parche. Les résultats expérimentaux sont utilisés dans un modèle simple décrivant la cinétique et le profil d’activité de l’eau à la surface du grain. En fonction des conditions de séchage imposées, il devrait permettre de juger si l’environnement à la surface du grain est favorable ou non à la contamination du café. RESUMEN El objetivo de este estudio es describir la transferencia de masa del agua en el grano de café. Para lograr este objetivo, la estructura interna del grano de café fue estudiada utilizando microscopía y estereoscopía. Los resultados dieron evidencia de la heterogeneidad de la estructura interna del grano de café. Tambiénestudiaron tres estructuras situadas en la superficie del grano con potencial de resistencia para la transferencia de masa: el pergamino, la película plateada y el endosperma. Se determinaron las isotermas de sorción y valores de difusividad del agua para estas estructuras sin hallarse diferencia significativa entre ellos a excepción del pergamino. Una técnica experimental para estudiar la transferencia de agua en el pergamino fue propuesta. En el endosperma, para humedades mayores a 65%, una difusividad constante describe la cinética de secado de granos enteros. Debajo de este valor de humedad, la difusividad del agua (con y sin la película plateada) fue significativamente menor que aquellos valores calculados para el grano entero. Este comportamiento puede ser atribuido a la reducción del espacio del poro ocupada por el agua y al aumento de la unión entre el esqueleto sólido y el agua al disminuir la humedad. Una simulación simple fue propuesta sin embargo los resultados obtenidos permitirán simular el secado del grano de café y obtener información sobre las zonas a actividad de agua alta. Esta información ayudaría a disminuir el riesgo de desarrollo del hongo A. ochraceus en el secado. La contribución de pergamino en la protección del endosperma es resaltada. SUMMARY The aim of this study is to describe the water mass transfer into the coffee bean. In order to achieve this objective, internal structure of coffee beans was studied with microscopy and stereoscopy. The results gave evidence of the coffee bean structure heterogeneity. Three structures at bean surface with mass transfer resistance potential were also studied: parchment, silver skin and endosperm. Sorption isotherms and water diffusion coefficient values of coffee different structures were obtained and they did not showed significant difference except parchment. An experimental technique to study the transfer of water into the parchment was proposed. In the endosperm, for water contents above 65%, a constant diffusion coefficient describes the kinetics of the whole bean. Below this water content, water diffusion coefficient values (with and without silver skin) were significantly lesser than those for the whole bean. This is firstly due to the reduction of the pore space occupied by water and to the augmentation of the bonding between the solid skeleton and water when water content decreases. A simple simulation is proposed however the set of results will allow to simulate coffee bean drying and to have information about the zones at high water activity. This information would help to diminish the risk of A. ochraceus development at drying. The contribution of parchment in the protection of the endosperm is highlighted. ____________________________________________________________________________________________ DISCIPLINE Mécanique, Génie Mécanique, Génie Civil ____________________________________________________________________________________________ MOTS-CLES Drying, ochratoxin A, internal structure, sorption isotherm, water transport. ____________________________________________________________________________________________ INTITULE ET ADRESSE DU LABORATOIRE Laboratoire de Mécanique et Génie Civil, UMR UM2-CNRS 5508, Cc 048, Place Eugène Bataillon, 34095 Montpellier Cedex 5, France.