international business plan - royal bank of canada
TRANSCRIPT

FITT: International Business Management Royal Bank Of Canada
FITT ID 306549

1 | P a g e
Executive Summary
2 | P a g e
Executive Summary
Royal Bank of Canada is one of the oldest and largest banks in Canada. Its operations are mostly
restricted towards North America and the Caribbean Islands. RBC is a very conservative
financial institution. It stood strong during the subprime crisis in the USA. In 2012 it has been
rated as the safest bank by Moody’s.
South Africa provides huge potential for growth. It is one of the largest economies of Africa and
has grown at a GDP rate of 7% over past 5 years. Most of the world has taken notice of the
potential that South Africa holds and many firms have, especially the automobile sector has set
its operations there.
RBC will be able to maximize its profits and increase its market share if it moves in to South
Africa. It will also be able to use South Africa as a test market to explore other African markets.
Taking into consideration the long term objectives of RBC I recommend moving in to South Africa through acquisition strategy
Corporate Profile
3 | P a g e
COMPANY PROFILE
Royal Bank of Canada (RBC) is a public limited company providing financial services for over a
century. It was founded in 1864 in Halifax, Nova Scotia as Merchant’s Bank of Halifax. In 1901
it changed its name to Royal Bank of Canada and currently all its subsidiaries across the globe
operate under the name ‘RBC’. It currently operates in 20 countries across North America, South
America and the Caribbean Islands. In 2008 it established a representative office in India. It is
listed on the Toronto Stock Exchange (TSE) and New York Stock Exchange (NYSE). It is one of
the largest banks in the world based on market capitalization. Bloomberg Markets magazine in
2013 named RBC as the second strongest bank in North America and the fourth strongest bank
in the world. This global ranking confirms RBC’s financial strength and stability not only in the
domestic market but also in the international market.
VISION
Strive to earn the right to be the customer’s first choice for all their financial needs.
MISSION
To be a top performing diversified financial institution in the emerging markets of the world by
2025.
STRATEGIC GOALS
ϒ To be a dominant leader in providing financial services in the domestic market.
ϒ To be the leading provider of commercial banking services and wealth management
solutions globally.
ϒ To be best in class provider of trade and finance services in select target markets
CORPORATE VALUES
ϒ Excellent services to the internal and external stakeholders.
ϒ Emphasis on team work for success.
ϒ Diversity is the key pillar for growth and innovation.
ϒ Conduct business with trust and integrity.
4 | P a g e
ϒ Responsible corporate citizen of the globe.
ϒ Foster a sustainable business environment.
ϒ Growth fuelled by the growth of the society.
BUSINESS VERTICALS
RBC has come a long way from the traditional banking services it provided decades ago.
Keeping in view its long term objectives RBC’s businesses are broadly classified in five
segments.
Personal and Commercial Banking
Under this segment RBC provides host of savings accounts, chequing accounts, credit and loans,
investments and international trade solutions services for the individuals and the corporates both.
Wealth Management
It serves affluent, high net worth and ultrahigh net worth customers with tailor made investment,
trust and other wealth management products and services.
Investor and Treasury Services
RBC serves the institutional investors by providing them custodial, advisory and financing
services. It also assists them in managing their risks by safeguarding their assets and maximizing
liquidity.
Capital Markets
It provides market research services pertaining to investment banking and trading of stocks to
public and private companies, institutional investors, central banks and governments.
Insurance
RBC provides a wide range of insurance products for travel, life, health, home and auto for
individuals. It also provides insurance to safeguard the businesses. It provides insurance facility
through its operating entities.

5 | P a g e
KEY MILESTONES
ϒ RBC was the first Canadian bank to offer online banking services in Canada in 1995.
ϒ RBC was awarded the “Best Bank” in Canada by The Banker (banking magazine) in
2007.
ϒ RBC re-acquired majority stake in Royal Bank of Trinidad and Tobago.
ϒ Macleans magazine named RBC as one of Canada’s “Top 50 Most Socially Responsible
Corporations” in 2013.
ϒ RBC recognized as a leader in retail banking at the Retail Banker International Awards in
2013.

6 | P a g e
Management and Human Resource

7 | P a g e
ORGANIZATION STRUCTURE
CHAIRMAN OF THE BOARD DAVID O’BRIEN
BOARD OF DIRECTORS
* JACQUES LAMARRE
* BRANDT LOUIE
* KATHLEEN TAYLOR
* MICHAEL McCAIN
* TIMOTHY HEARN
* ALICE LABERGE
* GEOFFREY BEATTIE
* VICTOR YOUNG
* RICHARD GEORGE
* BRIDGET VAN KRALINGEN
* DAVID DENISON
* EDWARD SONSHINE
* HEATHER MUNROE-BLUM
* PAULIE GAUTHIER
PRESIDENT & CEO GORDON NIXON
CFO & ADMIN
JANICE FUKAKUSA
RISK MGMT
CHIEF RISK OFFICER
MORTEN FRIIS
CAPITAL MARKETS CO-GROUP HEAD
MARK STANDISH
HEAD OF HUMAN
RESOURCE
ZABEEN HIRJI
WEALTH MGMT GROUP HEAD
GEORGE LEWIS
US INVESTMENT BANKING HEAD BLAIR FLEMING
CANADIAN BANKING
GROUP HEAD DAVE McKAY
INTERNATIONAL BANKING & INSURANCE
GROUP HEAD JAMES
WESTLAKE

8 | P a g e
LEADERSHIP TEAM
The thinking tank of the bank is fuelled by prudent bankers who have illustrious years of
experience. The leadership team has served the bank in various verticals in different capacities.
President and CEO
Gordon Nixon was appointed as the President and CEO of RBC on April 1, 2001. He has been a
transformational leader, having said so in 2004; he initiated a major change in the organization
structure and management. The restructuring process was undertaken to focus the resources of
RBC towards only one goal i.e. customer satisfaction. The change was symbolically called as
“Client First”. Under the leadership of Mr. Nixon RBC has delivered one of the best shareholder
returns amongst the big five banks of Canada. RBC was able to cruise through the financial crisis
of 2000 because of Mr. Nixon’s unconventional approach towards banking. Mr. Nixon was
awarded the Order of Ontario in 2007. He was also appointed a Member of the Order of Canada
in 2010.
Chief Financial Officer and Chief Administrative Officer
Janice Fukakusa is the CFO and CAO of RBC. She is one of the key members of RBC’s Group
Fukakusa has held key positions in all the businesses of the bank since joining them in 1985. Ms.
Fukakusa has earned the designation of FCA from the Institute of Chartered Accountants of
Ontario and holds a MBA from Schulich School of Buisness.
Group Head International Banking and Insurance
W. James Westlake is the Group Head for RBC’s international banking and insurance initiatives.
Mr. Westlake is responsible for setting the strategic direction for global expansions. He was
previously working with the Metropolitan Life Insurance Company for 19 years, before joining
RBC in 1995.
Risk Management
Mr. Friis was appointed as the Chief Risk Officer in 2004. Mr. Friis is responsible for taking
strategic decisions for mitigating and managing the risks. He has served the bank for more than

9 | P a g e
30 years and has been a motivational leader. Mr.Friis holds an MBA from the Harvard School of
Business.
HUMAN RESOURCES REQUIREMENT FOR SETTING BUSINESS IN NEW TARGET
MARKET
ϒ Research Analysts
ϒ Legal Advisors
ϒ Mergers and Acquisition specialist
ϒ Regional Head
ϒ Underwriters
ϒ Public Relations Personnel
ϒ Product Engineering Specialist
ϒ Marketing and Sales Manager
ϒ Trainers

10 | P a g e
Target Market Environmental Scan
11 | P a g e
SUB-SAHARAN MARKET
Africa’s economic growth has accelerated over the last five years. The robust growth has
attracted attention of global executives and investors as the rate of return on foreign investment
is higher in Africa than in any other developing regions. The major drivers of the African
economy have been countries like South Africa, Nigeria and Ghana, which have contributed
approximately 70% to the real GDP of the continent. The growth figures of the three African
countries put together are higher than their Asian counterparts (India & China).
TARGET MARKET: SOUTH AFRICA
Business Destination
South Africa is referred as the business gateway of Africa. The government policies and the
infrastructure complemented by the consumer spending have made South Africa a quintessential
business hub. The economy is driven through significant contribution made by the mining,
services and manufacturing sector. The services sector contributes approximately 60% to its
GDP, followed by mining and manufacturing at 20% and 15% respectively. Banking and
Financial Sector is the seventh most important sector (see Appendix A) which contributes 4.9%
to its GDP and has grown at an average rate of 3.1% per annum. Since South Africa is a
developing economy the exposure of the Banking and Financial sector towards the GDP shows
ample scope of growth.
Economic Outlook
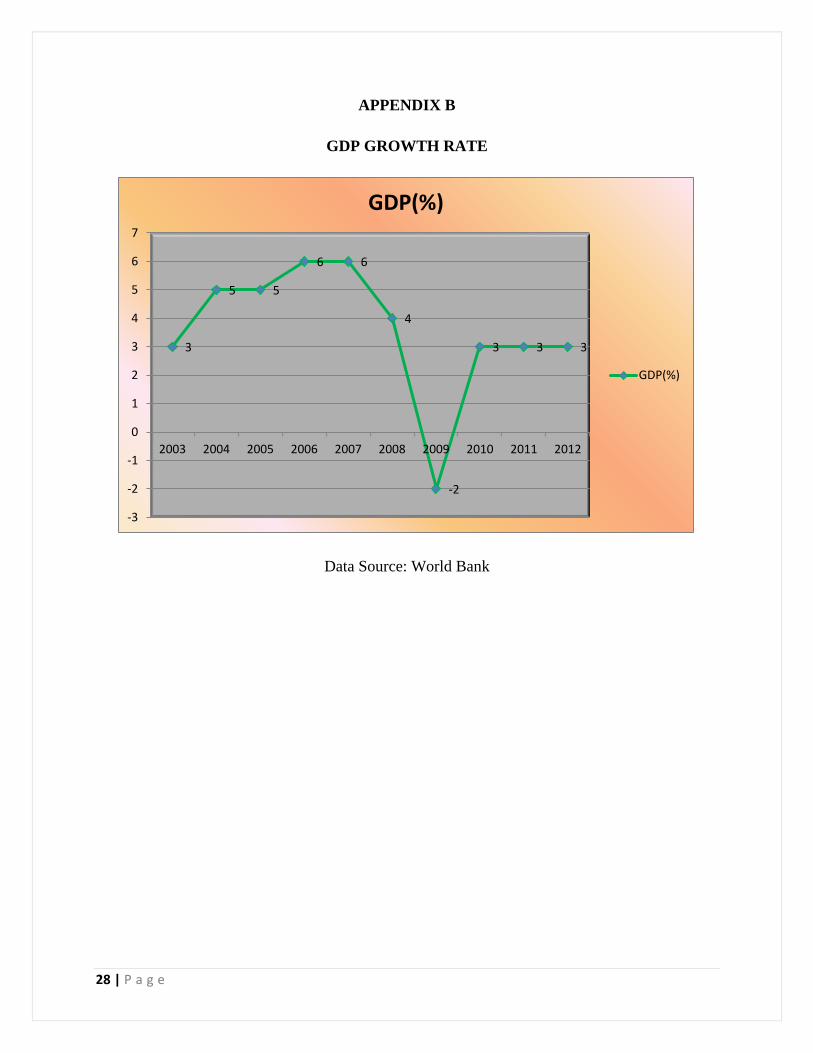
South Africa is quoted as the economic giant of the sub-Saharan economy. Over the last decade
South African economy has consistently grown at an average GDP of 3.6 % (see Appendix B).
The average projected growth rate (GDP) over the next five years is 4.1% (see Appendix C).
South Africa has managed to maintain its inflation at 5.6% in 2012 and as the forecasted data
suggests the Central Bank of South Africa will maintain the inflation around the 5% mark for the
next five years (see Appendix D). The maintenance of inflation just below the upper inflation
band of 6% portrays healthy signs for the economy as it promotes consumer spending driven
economy.
12 | P a g e
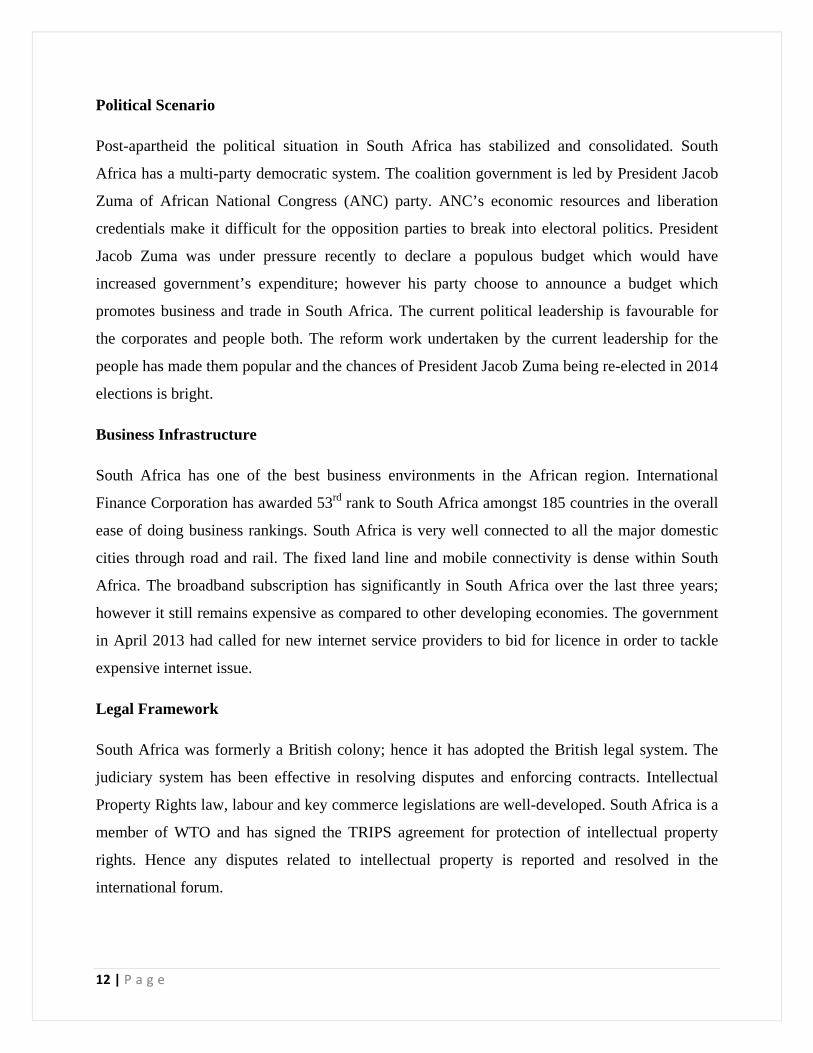
Political Scenario
Post-apartheid the political situation in South Africa has stabilized and consolidated. South
Africa has a multi-party democratic system. The coalition government is led by President Jacob
Zuma of African National Congress (ANC) party. ANC’s economic resources and liberation
credentials make it difficult for the opposition parties to break into electoral politics. President
Jacob Zuma was under pressure recently to declare a populous budget which would have
increased government’s expenditure; however his party choose to announce a budget which
promotes business and trade in South Africa. The current political leadership is favourable for
the corporates and people both. The reform work undertaken by the current leadership for the
people has made them popular and the chances of President Jacob Zuma being re-elected in 2014
elections is bright.
Business Infrastructure
South Africa has one of the best business environments in the African region. International
Finance Corporation has awarded 53rd rank to South Africa amongst 185 countries in the overall
ease of doing business rankings. South Africa is very well connected to all the major domestic
cities through road and rail. The fixed land line and mobile connectivity is dense within South
Africa. The broadband subscription has significantly in South Africa over the last three years;
however it still remains expensive as compared to other developing economies. The government
in April 2013 had called for new internet service providers to bid for licence in order to tackle
expensive internet issue.
Legal Framework
South Africa was formerly a British colony; hence it has adopted the British legal system. The
judiciary system has been effective in resolving disputes and enforcing contracts. Intellectual
Property Rights law, labour and key commerce legislations are well-developed. South Africa is a
member of WTO and has signed the TRIPS agreement for protection of intellectual property
rights. Hence any disputes related to intellectual property is reported and resolved in the
international forum.
13 | P a g e
Foreign Investment Policy and Corporate Tax Structure
South Africa`s monetary policies are structured to attract foreign direct investment. 100%
foreign ownership is permitted in South Africa and the capital repatriation policies are liberal.
No prior approval is required from the government for foreign investment. The South African
Companies Act of 1973 provides guidelines for setting up foreign companies in South Africa.
South Africa`s tax regime is foreign investor friendly. If the foreign investments are routed
through the Strategic Industrial Project (SIP) allowances of 50% or 100% are available. The tax
rate for foreign companies is 34%.

14 | P a g e
Market Entry and Marketing Strategy

15 | P a g e
Market Entry Strategy
Royal Bank of Canada will be offering trade and finance products to the small and medium
domestic and international traders. I recommend RBC to enter the South African market by
acquiring a non-banking financial institution (NBFI). RBC will be able to provide trade and
finance services under the South African law, by holding a non-banking licence.
Rationale for the Proposed Strategy
ϒ South Africa allows 100% foreign direct investment which does not require prior
approval from the government.
ϒ Local presence in the South African market will increase consumer confidence, thereby
attracting more business.
ϒ Through this strategy RBC will get access to the large customer base of the acquired
company.
ϒ RBC will also get access to the immovable assets of the acquired company.
ϒ The trained pool of human resource of the acquired company will enable RBC to save on
the recruitment and training cost.
Marketing Strategy
RBC structures its marketing strategy keeping in view that the customer is the king of the
market. RBC understands that building long term relationship with the customer through prompt
and quality service is valuable and rewarding. The major difference between the marketing
strategy adopted by RBC and its competitors is that RBC concentrates on creating value for the
customer, whereas the competition merely focuses in selling the service.
Product
RBC has engineered the products keeping in view the business requirements of its consumers.
The trade finance products offered are stated as under:-

16 | P a g e
ϒ Pre-Shipment Credit
This product will enable the exporters to meet their working capital requirements from
the date of manufacturing the product till the shipping of the product. The loan will be
provided for a maximum period of 180 days at prime lending rate.
ϒ Post-Shipment Credit
The pre-shipment credit can be converted to post shipment credit for a maximum period
of 270 days at prime lending rate plus 1%. This loan will allow the exporter to meet their
operating expenses from the date of shipment till they receive their payment.
ϒ Letter of Credit
Import and export letter of credit will be provided to the customer at a fixed fee which
will be 0.5% of the letter of credit amount. The consumer will be able to route the
documents, receive or make payment and get the document scrutinized under the letter of
credit.
ϒ Documentary Collection
This product will enable routing of payment and documents through the bank to the
foreign bank or to the foreign trader. The fee charged for this service is US$ 5 per
transaction.
Product Modification
• The interest rate at which credit will be extended to the market will be decided by the
benchmark interest rate set by the Central Bank of South Africa.
• The maximum credit period that can be given to the customer will be governed by the
policies set by the Central Bank of South Africa.
Product Differentiation
• The trade products provided to the customer will be similar in nature to the competition;
however the main differentiating factor is the quality of service provided to the customer.
17 | P a g e
RBC is reputed in the North American market for the prompt and efficient customer
service provided to the customer.
• The trade products will be made available to the customer through online internet
banking, this a special feature of RBC`s trade products. The competition in South Africa
has not yet started offering trade products online.
Price
RBC will deploy value added pricing in the South African market. The customer will be given
the option of paying extra for the value added services availed. The competition currently uses
static pricing method. The value added pricing will be expensive than the competition, however
the customer takes a call for what services he wants to pay. The pay as per your use is the value
statement supporting this pricing strategy.
RBC uses full cost pricing method in order to arrive at the cost of the product. All the direct and
indirect costs and variable and fixed costs are taken into consideration from conceptualizing step
to finally making the product available to the customer. This enables RBC to fully recover the
cost and add its profit margin for the selling price.
Place
Documentary Collection (Import Documents)
The documents received from the overseas party is informed to the customer over a phone call
by the trade desk officer, then depending on the terms of payment stated on the bill of exchange
the documents are handed over to the customer via local courier service or the customer receives
it when he visits the branch.
Letter of Credit (Export LC)
If an export LC is received from the foreign bank, the same is informed by the trade desk officer
over a phone call and simultaneously a soft copy of LC is emailed to the customer with a hard
copy through the local courier services.

18 | P a g e
Online Trade Customers
The internet service must be of high speed in order to facilitate quality service to the online trade
customers.
Promotion
Print Media must be used to in order to promote RBC`s entry in the South African market. A
dinner night for the existing customers of the company acquired by RBC must be arranged, to
promote its products. The dinner invite must state that the existing customers are allowed to get
their business friends as well. This will enable promoting the bank to new prospective customer.
The promotion activity may be outsourced to an advertisement company specialized in arranging
advertisement campaign for companies dealing in financial and trade services.
People
Durban and Cape Town are the port towns of South Africa. The import export trade takes place
though these ports, hence many import export companies are set across this region. RBC is
targeting these customers for its trade and finance services. The South Africa`s trade and finance
market is valued at USD 1.2 billion as quoted by Trade Finance Magazine in 2013.
After Sales Service
The relationship management team of the bank provides after sales service to the customer. In
the banking industry after sales service is more like cross selling a different banking product at
reduced price to the customer for their loyalty. The loyalty benefits will be provided to the
customer till the time it is actively using the banking services.

19 | P a g e
Operations Overview

20 | P a g e
Operations Overview
Software
• Society for Worldwide Interbank Financial Telecommunication(SWIFT)
It is a platform used by all the banks across the globe for communication and transferring
of funds.
• Nostro A/c
It is a dollar a/c maintained by a South African with an American bank.
• Vostro A/c
It is a South African Rand (currency) A/c maintained by a foreign bank with a bank
operating in South Africa
Each and every trade finance products has its unique process. It goes through various check
points where in the documents are first scrutinized to see whether it meets the international trade
rules and then it is compared with the rules of the customers. If the documents comply with both
international and local rules and regulations, the document is cleared for payment by the
importer.
Sample Working of a Letter of Credit (LC) (see Appendix E)
• The importer (applicant) visits his bank (issuing bank) for the issuance of letter of credit
based on the order confirmation received from the exporter (beneficiary).
• The issuing bank issues the LC in favour of the beneficiary and sends the LC to the
exporter’s bank (negotiating bank) via the SWIFT system.
• The negotiating bank informs the beneficiary regarding the receipt of LC.
• The beneficiary ships the goods and sends the documents via negotiating bank to the
issuing bank

21 | P a g e
• The issuing bank scrutinizes the documents to comply with the terms and conditions of
the LC and informs the applicant about receiving of documents
• The applicant agrees to release the documents on immediate payment; concurrently
issuing bank agrees to make the payment to the negotiating bank on behalf of the
applicant.
• The payment is effected by the issuing bank to the negotiating bank via SWIFT.
• The negotiating bank pays the beneficiary by crediting his a/c and deducting the charges
for the entire transaction.

22 | P a g e
Financial Risk and Management Strategy

23 | P a g e
Financial Performance
RBC posted strong results for the second quarter ended 30th April 2013. Its net income increased
by 26% from the first quarter. Its current net income stands at CAD 1,936 million. The stock
price of RBC on the Toronto Stock Exchange is CAD 65.11 as on 29th July 2013. RBC has been
posting good results for the past five years (see Appendix E,F & G). The earnings per share is
CAD 5.40. The stock prices have gone up steadily since July 2012 when it was trading at CAD
50.50
Sourcing of Funds for Acquisition in South Africa
RBC could raise funds in the following way:
• 30% of the capital can be raised through follow up public offer (FPO)
• 30% of the capital can be invested from its profits. As of 2012 its cash flow showed a
balance of CAD 1,239 million
• 10% can be raised through issue of preferential shares
• 20% can be raised through providing a stake to the Non-banking financial institution that
the bank is acquiring in South Africa.
Risks Associated with the Acquisition
• The government may come up with the policy which may make the deal impossible. In
such scenario political risk insurance can be availed from EDC.
• Currency Fluctuation risk may make the deal expensive for RBC. This risk can be
mitigated by hedging the funds.

24 | P a g e
Conclusion and Recommendations

25 | P a g e
CONCLUSION
RBC is one of the largest banks of Canada. Since the 1900’s the Canadian banks have
concentrated on the North American and the Caribbean markets only. The emerging economies
like South Africa, Brazil, India, Thailand and Russia are prospective markets for financial
institutions. The financial system in the emerging economies is evolving and there is a need for
financial enterprises to boost their growth through structured financing.
South Africa is one of the largest economies of Africa; it will also provide RBC an opportunity
to enter other emerging African economies like Nigeria and Ghana. RBC could use South Africa
as a test market to enter the neighbouring African countries.
The major risk involved in South Africa is the political risk. President Zuma has led a campaign
to empower the Black community, which has not been viewed very positively by the gatekeepers
of the world. The regional politics is detrimental to the growth of South Africa. However these
problems are common with most of the emerging world.
Recommendation
I suggest RBC to undertake a detailed research of the competition in the South African market. A
detailed research will assist RBC to understand the driving force of the financial sector. The
report will also flash data about the weak financial institutions, which RBC can decide to acquire
in order to enter the South African market.

26 | P a g e
Appendices:

27 | P a g e
APPENDIX A
TOP 10 SECTORS OF SOUTH AFRICA
2012 Level
(Billion. US$)
2013 Percent Change
(Real Terms)
Percent Share of
GDP
(Nominal Terms)
1. Public Admin. &
Defence
57.6 3.0 16.5
2. Retail Trade-Total 33.2 2.1 9.5
3. Mining 25.2 3.8 7.2
4. Real Estate 21.0 2.7 6.0
5. Wholesale Trade 18.5 3.1 5.3
6. Land Transport 18.1 1.8 5.2
7. Banking &
Finance
17.1 3.1 4.9
8. Construction 13.6 5.0 3.9
9. Business Services 12.9 3.1 3.7
10. Agriculture 9.0 0.6 2.6
Total 226.0 64.8
Data Source: World Industry Service, IHS Global Insight Inc.
28 | P a g e
APPENDIX B
GDP GROWTH RATE
Data Source: World Bank
3
5 5
6 6
4
-2
3 3 3
-3
-2
-1
0
1
2
3
4
5
6
7
2003 2004 2005 2006 2007 2008 2009 2010 2011 2012
GDP(%)
GDP(%)

29 | P a g e
APPENDIX C
FORCASTED GDP
Data Source: IHS Global Insight Inc.
2.9
3.5 4
4.9 5.2
0
1
2
3
4
5
6
2013 2014 2015 2016 2017
GDP(%)
GDP(%)

30 | P a g e
APPENDIX D
INFLATION RATE
Data Source: IHS Global Insight Inc.
0
1
2
3
4
5
6
7
8
9
2010 2011 2012 2013 2014 2015 2016 2017
Consumer Price Index (%change)
Wholesale Price Index (%change)

31 | P a g e
APPENDIX E
Process Flow of Letter of Credit
Data Source: Bank of China (New York)

32 | P a g e
APPENDIX E
Balance Sheet for Five Years
2012 2011 2010 2009 2008
Cash and Due from Banks 12,617 12,428 8,440 8,353 11,086
Fed Funds Sold/Securities Purchased
112,257 84,947 72,698 41,580 44,818
Interest-Bearing Dep at Other Banks 10,255 6,460 13,254 8,923 20,041
Investment Securities, Net 40,828 39,214 38,594 46,210 48,626
Net Loans 378,244 347,530 273,006 280,963 289,540
Premise and Equipment 2,691 2,490 2,139 2,367 2,471
Due from Customers Acceptance - 7,689 7,371 9,024 11,285
Trading Account Securities 120,783 128,128 144,925 140,062 122,508
Other Receivables - - - - -
Accrued Interest - - - - -
Deferred Acquisition Cost - - - - -
Accrued Investment Income - - - - -

33 | P a g e
Separate Account Business Liability - - - - -
Time Deposit Placed - - - - -
Intangible Assets 15,585 9,725 8,370 10,401 12,019
Other Assets 214,202 155,222 157,409 107,106 161,465
Total Assets 825,100 793,833 726,206 654,989 723,859
Liabilities [+] in Millions of Dollars
Oct-12 Oct-11 Oct-10 Oct-09 Oct-08
Non-Interest Bearing Deposits - - - - 43,724
Interesting Bearing Deposits 508,219 479,102 414,561 398,304 394,851
Short Term Debt 40,756 44,284 46,597 41,359 5,402
Other Liabilities 59,960 169,811 162,309 116,792 144,688
Bankers Acceptance Outstanding - 7,689 7,371 9,024 11,285
Fed. Funds Purchased/Securities Sold
64,032 42,735 41,207 35,150 59,560
Accrued Taxes - - - - 2,468
Accrued Interest Payables - - - - 2,925
Other Payables - - - - 10,311

34 | P a g e
Capital Lease Obligations - - - - -
Claims and Claim Expense - - 6,273 8,922 7,385
Future Policy Benefits - - - - -
Unearned Premiums - - - - -
Policy Holder Funds - - - - -
Participating Policyholder Equity - - - - -
Separate Accounts Business - - - - -
Minority Interest 1,761 1,761 2,256 2,071 2,371
Long Term Debt 7,615 8,749 6,681 6,461 8,131
Total Liabilities 780,833 754,131 687,255 618,083 693,101
Preferred Shareholder's Equity 4,813 4,813 4,813 4,813 2,663
Common Shareholder's Equity 39,454 34,889 34,138 32,093 28,095
Total Equities 44,267 39,702 38,951 36,906 30,758
Data Source: TMX Money

35 | P a g e
APPENDIX F
INCOME STATEMENT OF FIVE YEARS
Income [+] 2 3 4 5 Oct-12 Oct-11 Oct-10 Oct-09 Oct-08
Total Interest Income 20,852 20,813 17,746 20,578 25,344
Total Interest Expense -8,354 -9,456 -7,408 -9,037 -15,984
Net Interest Income 12,498 11,357 10,338 11,541 9,360
Loan Loss Provision -1,301 -1,133 -1,240 -3,413 -1,595
Net Interest Income After Loan Loss Provision
11,197 10,224 9,098 8,128 7,765
Non-Interest Income 14,834 16,281 15,744 17,565 12,222
Non-Interest Expense 8,354 -17,525 -17,015 -21,167 -13,982
Special Income/Charges -1,442 - - 1,000 -
Net Income Before Taxes 32,943 8,980 7,827 5,526 6,005
Premium Tax (Credit) - - - - -
Minority Interest 97 -101 -99 -100 -81
Income Taxes -2,100 -2,010 -1,996 -1,568 -1,369

36 | P a g e
Net Income from Continuing Operations
7,590 6,970 5,831 3,858 4,555
Net Income from Discontinued Operations
-51 -526 -509 - -
Net Income from Total Operations
7,539 6,444 5,322 3,858 4,555
Extraordinary Income/Loss - - - - -
Income from Cum. Effect of Acct Change
- - - - -
Income from Tax Loss Carryforward
- - - - -
Other Gains - - - - -
Total Net Income 7,442 6,343 5,223 3,858 4,555
Results [+] in Dollars
(Preferred Dividends in
Millions) Oct-12 Oct-11 Oct-10 Oct-09 Oct-08
Dividends Paid Per Share 2.28 2.08 2 2 2
Preferred Dividends - - 258 233 101

37 | P a g e
Basic EPS from Continuing Operations
5.01 4.62 3.85 2.59 3.41
Basic EPS from Discontinued Operations
-0.03 -0.37 -0.36 0 0
Basic EPS from Total Operations
4.98 4.25 3.49 2.59 3.41
Basic EPS from Extraordinary Inc
0 0 0 0 0
Basic EPS from Cum. Effect of Acct Chg
0 0 0 0 0
Basic EPS from Tax Loss Carryforward
- 15,236 12,494 13,539 14,983
Basic EPS from Other Gains(Loss)
0 0 0 0 0
Basic EPS, Total 4.98 4.25 3.49 2.59 3.41
Basic Normalized Net Income/Share
5.96 4.62 3.85 1.92 3.41
Diluted EPS from Continuing Operations
4.93 4.55 3.82 2.57 3.38

38 | P a g e
Diluted EPS from Discontinued Operations
-0.03 -0.36 -0.36 0 0
Diluted EPS from Total Operations
4.93 4.19 3.46 2.57 3.38
Diluted EPS from Extraordinary Inc
0 0 0 0 0
Diluted EPS from Cum. Effect of Acct Chg
0 0 0 0 0
Diluted EPS from Tax Loss Carryforward
0 0 0 0 0
Diluted EPS from Other Gains(Loss)
0 0 0 0 0
Diluted EPS, Total 4.93 4.19 3.46 2.57 3.38
Diluted Normalized Net Income/Share
5.9 4.55 3.82 1.9 3.38
Data Source: TMX Money

39 | P a g e
APPENDIX G
CASH FLOW FOR FIVE YEARS
6 2 3 4 5
Cash Flow in
Millions of
Dollars
Oct-12 Oct-11 Oct-10 Oct-09 Oct-08
Net Income 7,539 6,444 5,732 3,858 4,555
Provision for Loan Loss 1,418 1,133 1,240 3,413 1,595
Depreciation and Amortization
1,153 958 821 1,851 674
Deferred Income Taxes
123 -124 119 -97 -455
Change in Assets (Receivables)
599 28,942 -1,542 47,894 -44,514
Change in Liabilities (Payables)
21,842 -7,609 -4,376 -52,298 56,787
Investment Securities Gain
-203 -293 -235 -17 1
Net Policy Acquisition Cost
- - - - -
Realized Investment Gains
- 106 2 5 -220
Net Premiums Receivables
- - - - -
Change in Income Taxes
-826 807 -1,748 3,546 -2,705

40 | P a g e
Other Non-Cash Items 1,473 -25,885 11,160 -752 -4,286
Net Cash from Operating Activities
-2,074 4,479 11,173 7,403 11,432
Proceeds from Sale/Mat. Inv.
58,525 53,610 48,178 63,529 23,689
Purchase of Investment Securities
-55,690 -46,877 -34,590 -32,268 -24,864
Net Increase Fed. Funds Sold
- - -31,118 3,238 19,650
Purchase of Property & Equipment
-1,351 -1,452 -960 -700 -1,265
Acquisitions -853 -1,300 -82 -27 -974
Other Investment Changes, Net
N/A 1,221 -33,002 -17,854 -60,889
Net Cash from Investing Activities
3,765 5,202 -51,574 15,918 -44,653
Net Change in Deposits - - 36,104 -40,742 61,271
Cash Dividends paid
-3,364 -3,125 -3,027 -2,748 -2,688
Repayment of Long Term Debt
-1,006 -404 -1,305 -1,659 -500

41 | P a g e
Change in Short Term Debt
21 -615 12,181 14,982 -21,746
Issuance of Long term Debt
- 1,500 1,500 - 2,000
Issuance of Preferred Stock
- - - 2,150 313
Issuance of Common Stock
5,410 6,323 7,068 2,511 223
Purchase of Treasury Stock
-5,261 -6,080 -6,929 -60 -131
Other Financing Activities
N/A -750 -4,167 -217 456
Cash from Financing Activities
-4,200 -3,151 41,425 -25,783 39,198
Effect of Exchange Rate Changes
-18 76 -168 -271 883
Net Change in Cash & Equivalents
-2,509 6,606 856 -2,733 6,860
Cash at Beginning of Period
15,144 8,538 7,584 11,086 4,226
Cash at End of Period 12,617 15,144 9,330 8,353 11,086
Total Risk-Based Capital Ratio
0.15 0 0 0 11.1
Data Source: TMX Money

42 | P a g e
References

43 | P a g e
References
Country Intelligence. (n.d.). IHS Home Page. Retrieved July 24, 2013, from
http://www.ihs.com/products/global-insight/country-analysis/index.aspx
The World Bank DataBank | Explore . Create . Share. (n.d.). The World Bank
DataBank | Explore . Create . Share. Retrieved July 24, 2013, from
http://databank.worldbank.org/data/views/reports/tableview.aspx#
Six months in South African politics — in 2013 | Politics Blog | BDlive
. (n.d.). Home | BDlive
. Retrieved July 24, 2013, from
http://www.bdlive.co.za/blogs/politics/2012/08/29/six-months-in-south-african-politics--
in-2013
Freeland, C. (n.d.). | Analysis & Opinion | Reuters.com. Analysis & Opinion | Reuters. Retrieved
July 24, 2013, from http://blogs.reuters.com/chrystia-freeland/2012/10/19/africa-the-
next-economic-tiger/
Leke, A., Lund, S., Roxburgh, C., & Wamelen, A. V. (n.d.). What’s driving
Africa’s growth | McKinsey & Company. McKinsey & Company | Home Page.
Retrieved July 24, 2013, from
http://www.mckinsey.com/insights/economic_studies/whats_driving_africas_growth
OMD South Africa. (n.d.). OMD South Africa. Retrieved July 24, 2013, from
http://www.omd.co.za
(2013). South Africa Country Monitor. Country Intelligence, 1, 1-25.
South Africa, 2012: A survey that explains a lot | Daily Maverick. (n.d.). Home | Daily Maverick.
Retrieved July 24, 2013, from http://www.dailymaverick.co.za/article/2012-01-24-south-
africa-2012-a-survey-that-explains-a-lot/#.Ue_JJ421H4Z
44 | P a g e
South Africa’s political situation | Green Passport. (n.d.). Südafrika hautnah erleben..
Retrieved July 24, 2013, from http://www.greenpassport.co.za/en/south-africa/south-
africa%E2%80%99s-political-situation/
World Wide Worx - Business Technology Research South Africa. (n.d.). World Wide Worx -
Business Technology Research South Africa. Retrieved July 24, 2013, from
http://www.worldwideworx.com APA formatting by BibMe.org.