international business research and risky...
TRANSCRIPT

International business research and risky investments, an analysis of FDI in conflict
zonesDriffield, NL, Jones, C and Crotty, J
http://dx.doi.org/10.1016/j.ibusrev.2012.03.001
Title International business research and risky investments, an analysis of FDI in conflict zones
Authors Driffield, NL, Jones, C and Crotty, J
Type Article
URL This version is available at: http://usir.salford.ac.uk/19129/
Published Date 2012
USIR is a digital collection of the research output of the University of Salford. Where copyright permits, full text material held in the repository is made freely available online and can be read, downloaded and copied for noncommercial private study or research purposes. Please check the manuscript for any further copyright restrictions.
For more information, including our policy and submission procedure, pleasecontact the Repository Team at: [email protected].

1
International Business Review
International business research and risky investments, an analysis of FDI in conflict zones
Nigel Driffield∗
(Aston Business School; Salford Business School) , Chris Jones & Jo Crotty
ABSTRACT The purpose of this paper is to examine the determinants of a firm’s strategy to invest in a conflict location. To the best of our knowledge, this has not been done before. We examine this using a standard model of international business, overlaid with the fundamental approach to corporate social responsibility. We start with the population of multinationals who have chosen to invest in low income countries with weak institutions. We then split this sample in order to distinguish between firms that have invested in conflict regions compared to those that haven’t. Our analysis then proceeds to explain the decision of those firms to invest in conflict locations by using a simple Probit model. We find that countries with weaker institutions and less concern about corporate social responsibility (CSR) are more likely to invest in conflict regions. Finally, firms with more concentrated ownership are more likely to invest in such locations.
Keywords: Conflict, Corporate Social Responsibility, FDI, Institutions.

2
1. INTRODUCTION The purpose of this paper is to examine investments by largely western firms into areas
of conflict. There is a long history of western companies being willing to invest in
politically unstable locations, and in some cases, such as Shell in Nigeria, it is claimed
that the inward investment has contributed to the instability. These investments receive
little comment. In 2005 a newly formed company received a good deal of hostile press in
both Europe and the US for announcing that it intended to explore the gas and oil
reserves in Sudan. The press reacted as though this was a unique and somewhat
disturbing development in the international business environment1
On July 22nd 2009, four years after the UN set up a Peace-building Commission, the UN
Security Council outlined the issues facing a post-conflict country. “The first is the need
for a strong leader to stop ‘international agencies’ turf wars. The second is for money to
be released in good time. Humanitarian funds come out of emergency budgets; peace-
building usually comes out of development budgets. The UN cannot stop war unless it is
also able to win the peace.”(UN 2009, pp. 12) Yet while, the role of inward FDI in
stimulating development, building capacity and generating growth has been well
investigated, little is known about FDI in the context of corruption, conflict and post
conflict.
. In fact, what was
unusual about the White Nile case was not that a firm from the West was willing to invest
in a war torn region, but simply that a relatively small company had been set up for the
specific purpose of doing so, rather than this being undertaken by one of the world’s
largest firms.

3
Given the importance of this, there is amazingly little on the links between conflict, post
conflict and FDI. There is a large economics literature (see for example Javorcik and
Wei, 2009) on the impact of institutional quality on FDI inflow, and the general
conclusion is that weak institutions adversely affect FDI. At the same time, there is a
more limited international business literature on the impact of institutions on MNE
strategies, see for example Meyer et al (2009). These literatures however seldom inform
each other, the former content to note that FDI is deterred by weak institutions (with the
underlying inference that the Washington Consensus should be adopted to alleviate this
problem), and the latter content to focus on the actions of firms after the investment
decision is taken.
Despite the importance of this interaction between international business, risk and
political capital, and the importance of home country institutions, surprisingly little is
also known about the motivations for firms to invest in such volatile locations. The
purpose of this paper therefore is to seek to address these gaps and thus extend existing
theory of international business to the analysis of firms who seek to invest in conflict
countries.
We build on the analysis of Rodriguez et al (2006), by examining the motivations of
firms to invest in highly volatile climates. While this approach offers some additional
theoretical and conceptual insight, and offers some linkages across the lenses of politics,
corruption and CSR, it does not extend to more extreme cases, such as high levels of
grand corruption (Rose-Ackerman, 2002) or conflict.
This paper proceeds as follows: in section 2 we discuss the very limited literature
available for this area of research. In section 3 we outline our 3 key hypotheses and their
4
theoretical basis. In section 4 we describe our empirical specification. In section 5 we
discuss the empirical results. Finally, section 6 concludes our analysis.
2. LITERATURE REVIEW
The literature in this area is extremely limited. There exists a large literature on the
relationships between international business and institutions, but virtually all of it
addresses the issue in terms of corruption. This is well represented by empirical studies
that seek to examine institutional development in the context of FDI flows, see for
example Javorcik and Wei (2009) or Henisz (2000). Equally Meyer (2004) and
Rodriguez et al (2006) offer conceptual treatments of the links between political and
social institutions, international business, and corporate social responsibility. These issues
are explored in the analysis of Cuervo-Cazurra and Dau (2009) that links institutional
development to firm performance, and indirectly to firm location.
More recently, Branzei and Abeldelnour (2010) examine the extreme cases of terrorism
in developing countries, and the impact from the threat of terrorism in developing
countries. However, their approach is one of a psychological analysis of resilience under
threat, and employs household level information rather than firm level information. The
focus of their paper is on local enterprise development, rather than international business.
Indeed, Czinkota et al (2007) focus on the extreme example of terrorism, highlighting
how terrorism impacts on international business. As they stress however, they are seeking
to set a research agenda, rather than present new empirical work or a further theoretical
framework.
5
The literature on FDI in developing countries views political capital within the context of
the resource based view of the firm. Frynas et al (2006) for example highlight the
importance of first mover advantage in the context of generating political capital.
Equally, there is a relatively large literature seeking to link FDI to corruption (see for
example Cuervo-Cazurra, 2006). Javorcik and Wei (2009) argue that increased risk (in
the form of increased corruption) reduces the likelihood of FDI. However, very little has
been done on analysing the types of firms who invest in systematically risky
environments. Addison and Murshed (2001) highlight the fiscal dimension to conflict
resolution, highlighting the role that inequality can play in stimulating local conflicts.
Multinationals investing in unstable locations run the risk of being seen as more than
innocent bystanders, where their investments serve to increase inequality, or increase the
returns to certain resources. However, analysis of investments in conflict areas presents a
subtle distinction from this literature. The key questions concern the motivation of firms
to engage in FDI in such locations, and the types of firms so motivated. We therefore
seek to extend the existing literature by seeking to explain this FDI decision.
As has recently been noted by the UN (2009), conflict and post-conflict countries are
beset by a large range of problems, including corruption, lack of governance structures
and protection of property rights. Existing literature reflects the obvious, that such
conditions deter FDI, at a time, it may be argued, that new capital investment is crucial
for both infrastructure and private sector development, just as civil society is required for
the rebuilding of the state. This point is also made by Rose-Ackerman (2008) in an
analysis of post conflict countries, highlighting the role that corruption plays in
6
facilitating development in the short term in post conflict countries. However, as Rose-
Ackerman (2008) points out, institutions must replace this informal process, and alleviate
its cause.
However, this literature does not focus on the nature of the firms investing or what their
motivation is. There are two theoretical frameworks that offer some useful insight here.
The first is that offered by Peng et al (2008) which focuses on the institution-based view
of strategy, and stresses the role that institutions can have in making markets work, and
facilitating strategic decisions through information flows. This leaves open the question
of governance at the firm level, and the decision making process that leads a firm to
invest in a location beset by corruption. Standard analysis of governance tends to refer to
principal–agent relationships. This offers an extension of Doukas and Lang (2003) who
highlight the importance of ownership structures in explaining FDI, through this in terms
of the risks associated with FDI, and the returns to “external” shareholders. One could
argue, following the link made by Peng (2006), that FDI into corrupt regions must be
very much a core activity, driven by market considerations.
3. THEORETICAL ANALYSIS AND HYPOTHESES
The stylised literature on foreign direct investment (FDI) by multinational enterprises
(MNEs) has at its basis the ownership-location-internalisation (OLI) framework (Buckley
and Casson, 1976; Dunning, 1979, 1988). The basic proposition of the OLI model
continues to be valid, in the sense that MNEs expand into other countries and continents
to take advantage of local resources and by leveraging their unique capabilities (Luo and
Tung, 2007). Much of the literature on FDI and institutional quality is discussed in
7
Bhaumik et al (2009) who argue that institutions provide location advantages, facilitating
transactions and reducing risk. Similar arguments are made by Javorcik and Wei (2009)
and Daude et al (2007) – who state that increased corruption increases the transactions
costs of the investor, and the level of risk. It is clear that the analysis of institutions with
respect to risk, and possibly transaction costs are directly applicable to the analysis of
FDI in conflict zones, but the extent to which such locations also offer greater rewards,
perhaps through first mover advantage or market power more generally are seldom
discussed.
Our intention therefore is to extend IB theory to the case of FDI in conflict zones. As
Henisz et al (2010) note:
“Questions that remain largely unaddressed but are fundamentally important include:
• What sort of trade or investment is particularly sensitive to conflict?
• What sectors or product markets are particularly susceptible to cross-national or
inter-temporal variations in conflict?
• What approaches do different companies take towards reacting to an increase in
conflict or mitigating their own exposure to existing conflict?”
(Henisz et al 2010 pp762)
Despite the lack of literature in this area, there are two frameworks that offer some useful
insight here. The first is that offered by Peng et al (2008) which focuses on the
institution-based view of strategy. What this therefore suggests is that in conflict zones,
the other parts of the Peng (2006) tripod of industry based competition and firm specific
resources dominate. This however leaves open the question of governance at the firm
8
level, and the decision making process that leads a firm to invest in a location beset by
conflict.
Ownership advantages and investing in conflict
The literature on the importance of institutions for international business assumes that
firms are deterred by weak institutions. Firms are deterred, not merely by corruption or
low levels of law and order protection, but also by the unfamiliarity with this. Both the
eclectic paradigm, and indeed the resource based view of the firm stress the importance
of firm specific assets, and the importance of the ability to coordinate resources across
international boundaries. The experience therefore in operating in countries with weak
institutions, or in risky environments more generally is then an important firm ownership
advantage in the context of investing in conflict countries. Equally, firms from more
stable economic and political environments are therefore less likely to invest in unstable
ones. However, in order to suitably extend the existing theories of IB, one needs to
incorporate the other two lenses of Rodriguez et al (2006), which are CSR and the
political dimension. In order to do this, we borrow from the framework of Carroll (1979,
1991, 1999). The CSR framework can extend IB theory, arguing that society expects
businesses to fulfil their economic responsibilities within the law. In his 1991 refinement
of this model, Carroll also asserts that the rules and regulations of not just the firm’s
country of origin but also those of ‘local governments of the host communities in which
they operate’ (Carroll, 1991, p 41) should be observed. Of course within conflict zones,
‘the law’ within such host communities maybe difficult to define, access or interpret.
This places a greater emphasis on the mitigating effects of home country institutions, and
also the firm’s own corporate social responsibility and governance structures. This builds

9
on Li and Vashchilko (2010), who argue that a major factor in explaining why interstate
conflict deters FDI, while security pacts encourage FDI flows, is because of the implicit
approval or disapproval that firms receive from their home governments.
In addition to highlighting firm level differences in the decision to invest in conflict
locations, this also suggests a country level phenomenon, where firms from countries
with specific types of governance and culture are more likely to engage in FDI in conflict
locations. It has been widely remarked that the strongest institutions are in the developed
countries such as the US, Germany, the UK and Japan, so one may expect to see less
investment from such locations. Within the set of developed country firms, one may
expect to see higher levels of FDI into conflict zones from countries with higher levels of
corruption and weaker institutions, for example Italy2
.
H1 – Firms from countries with weaker institutions are more likely to invest in
conflict regions.
Location Advantage
Henisz (2000) seeks to extend IB theory to the case of FDI and corruption. This
essentially argues that weak institutions generate increased transactions costs, and as such
this deters FDI. One can simply view corruption and potential political interference as
part of Dunning’s “L”, and simply view these as potential deterrents of FDI. However,
these conceptual and theoretical frameworks exist with a relatively standard set of
parameters, focussing on transition economies without reference to particularly extreme
scenarios. Frynas (2006) extend the analysis to more extreme forms of political
10
corruption, and illustrate how collaboration between business and governments can lead
to a first mover advantage or potential attractions.
However, of more significance is the link between sectoral differences and location
advantages. Natural resource extraction for profit in a conflict zone could be interpreted
as responding to a market demand and generating profit – the first responsibility of
business (Carroll, 1979; 1991).
IB theory stresses location advantages, and link directly to Carrolls “Economic
responsibilities”. These are seen by Carroll as the first responsibility of business. Carroll
describes the business institution as the basic economic unit in the society. As such it has
a responsibility to produce goods and services that society wants and to sell them at a
profit.
This suggests that the analysis of FDI in conflict locations needs to include a sectoral
analysis. The company’s CSR image is potentially more important where external
stakeholders are final consumers (i.e. the general public) than other businesses. Also, one
can imagine that certain sectors are more resigned to investing in conflict regions than
others. Extraction of minerals has historically been relatively sanguine about investing in
trouble spots, driven by the location of the resources.
H2: That sectors which are bound by natural resources or geography are more
likely to attract FDI in conflict zones.
Internalisation Advantages
Empirical analysis of internalisation advantages typically focuses on the transactions
costs associated with the alternative mechanisms of facilitating the international
11
transaction. In the context of the sectoral differences discussed above, this may include
arms length trading as opposed to ownership, in terms of either exporting, or access to
raw materials. However, in addition to the sectoral differences, one also has to consider
the ability of the firms to manage the newly created assets. Typical measures of this used
in the literature are the number of subsidiaries a firm already has, and firm age, as well as
firm size.
In the context of FDI in conflict zones, one also has to consider business-state relations,
and overlay the OLI model with the concept of CSR. This has been utilized to explain
how large corporations not only have an economic duty towards their shareholders but
also have wider legal and societal responsibilities. For example, in ‘stakeholder’ theory,
attention is placed on the fact that firms necessarily have a ‘normative’ and ‘moral’
obligation to all stakeholders, including not just its immediate shareholders, but the
wider citizenry (Donaldson and Preston, 1995; Gibson 2000). This suggests that larger
firms may be better placed to invest in conflict zones, having greater bargaining power
with the domestic stakeholders. At the same time however, small firms, less likely to
attract adverse commentary may also be attracted. Wood and Logsdon (2001) on the
other hand see the corporation as having certain rights and responsibilities to various
actors precipitating the need for firms to act as good corporate citizens.
H3 : the relationship between firm size and the propensity to invest in conflict zones
will be a U shaped.
Ethical Responsibilities, Ownership structures and FDI
Carroll describes these as “responsibilities (that) embody those standards, norms, or
expectations that reflect a concern for what consumers, employees, shareholders and the
12
community regard as fair, just, or in keeping with the respect or protection of
stakeholders’ moral rights,” (Carroll, 1991 p. 41) What society ‘expects’ therefore is that
the firm consult stakeholders widely. However, when considering investments where the
morals or ethics of the decision may be brought into question, less, rather than more
consultation may be expected.
While the ‘ethical’ or CSR behaviour will be determined by all, or a combination of (a)
the view the firm has of itself vis-à-vis ethical responsibilities; (b) pressure from
stakeholders outside the host country on its activities; and (c) assumptions made by the
firm of expectations from the host country, these pressures will vary between firms, but
in general, those firms less concerned about ethics or CSR will be more likely to invest in
conflict regions.
In order to operationalise this assertion, we rely on the links between CSR and ownership
concentration. Nazli and Ghazali (2007) demonstrate that ownership concentration is
associated with less attention to CSR at the firm level, consistent the burgeoning
literature on CSR within international business, see for example Luo (2006), Rodriguez et
al (2006), Husted and Allen (2006) and Strike et al (2006). To a large extent, persistence
of concentrated ownership reflects institutional weaknesses, especially absence of
specialised intermediaries in capital markets. Strategic decisions for these companies are
often taken by a closely knit group of controlling owners, without the involvement of
other stakeholders. At the same time, it is often in the interest of this group to diversify its
business interests outside the home country, largely to mitigate location specific risk
13
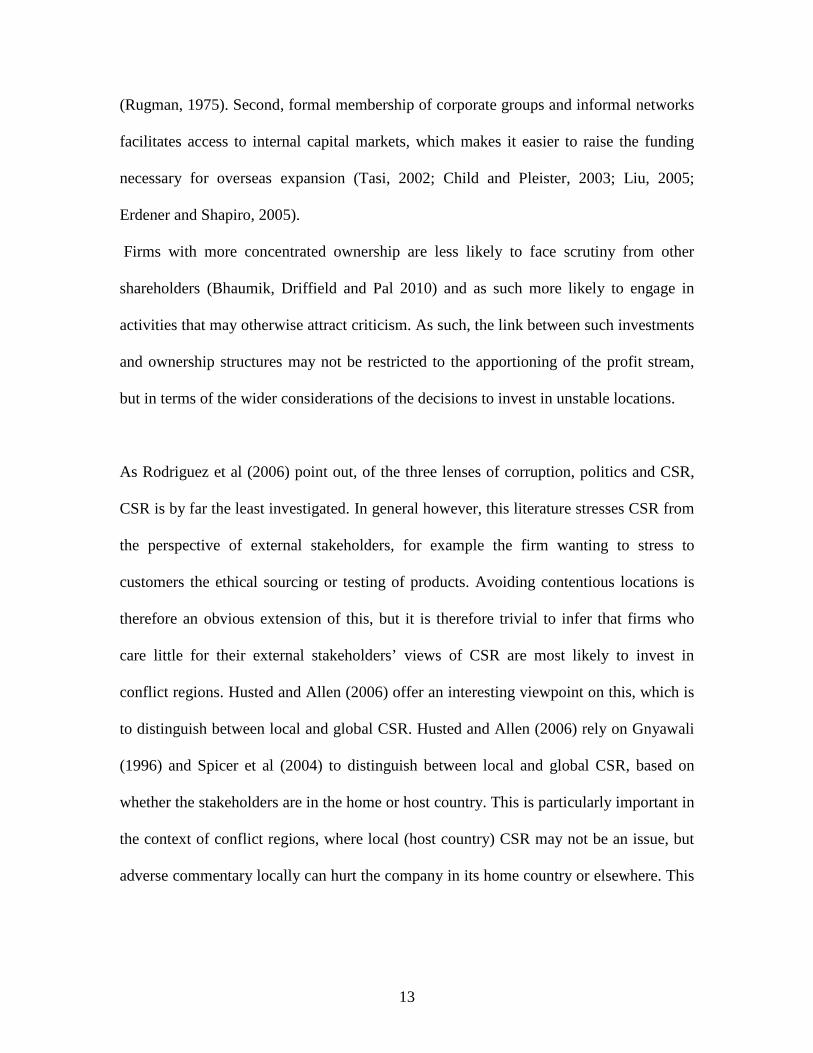
(Rugman, 1975). Second, formal membership of corporate groups and informal networks
facilitates access to internal capital markets, which makes it easier to raise the funding
necessary for overseas expansion (Tasi, 2002; Child and Pleister, 2003; Liu, 2005;
Erdener and Shapiro, 2005).
Firms with more concentrated ownership are less likely to face scrutiny from other
shareholders (Bhaumik, Driffield and Pal 2010) and as such more likely to engage in
activities that may otherwise attract criticism. As such, the link between such investments
and ownership structures may not be restricted to the apportioning of the profit stream,
but in terms of the wider considerations of the decisions to invest in unstable locations.
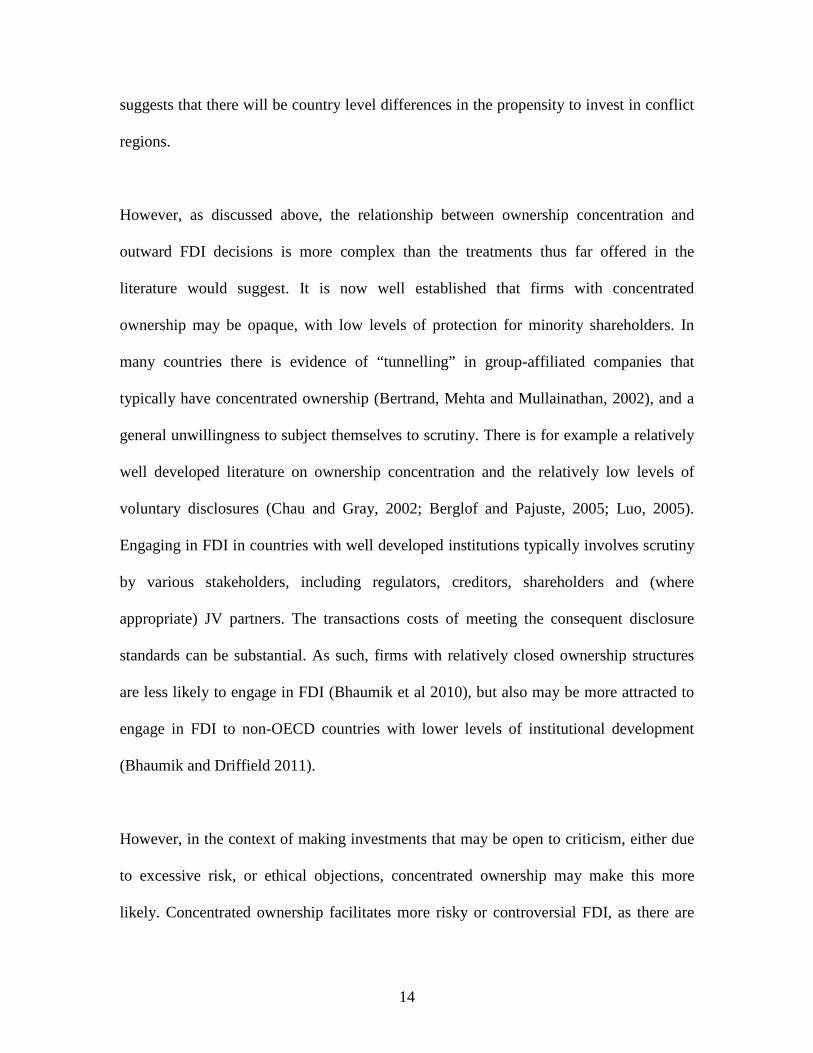
As Rodriguez et al (2006) point out, of the three lenses of corruption, politics and CSR,
CSR is by far the least investigated. In general however, this literature stresses CSR from
the perspective of external stakeholders, for example the firm wanting to stress to
customers the ethical sourcing or testing of products. Avoiding contentious locations is
therefore an obvious extension of this, but it is therefore trivial to infer that firms who
care little for their external stakeholders’ views of CSR are most likely to invest in
conflict regions. Husted and Allen (2006) offer an interesting viewpoint on this, which is
to distinguish between local and global CSR. Husted and Allen (2006) rely on Gnyawali
(1996) and Spicer et al (2004) to distinguish between local and global CSR, based on
whether the stakeholders are in the home or host country. This is particularly important in
the context of conflict regions, where local (host country) CSR may not be an issue, but
adverse commentary locally can hurt the company in its home country or elsewhere. This
14
suggests that there will be country level differences in the propensity to invest in conflict
regions.
However, as discussed above, the relationship between ownership concentration and
outward FDI decisions is more complex than the treatments thus far offered in the
literature would suggest. It is now well established that firms with concentrated
ownership may be opaque, with low levels of protection for minority shareholders. In
many countries there is evidence of “tunnelling” in group-affiliated companies that
typically have concentrated ownership (Bertrand, Mehta and Mullainathan, 2002), and a
general unwillingness to subject themselves to scrutiny. There is for example a relatively
well developed literature on ownership concentration and the relatively low levels of
voluntary disclosures (Chau and Gray, 2002; Berglof and Pajuste, 2005; Luo, 2005).
Engaging in FDI in countries with well developed institutions typically involves scrutiny
by various stakeholders, including regulators, creditors, shareholders and (where
appropriate) JV partners. The transactions costs of meeting the consequent disclosure
standards can be substantial. As such, firms with relatively closed ownership structures
are less likely to engage in FDI (Bhaumik et al 2010), but also may be more attracted to
engage in FDI to non-OECD countries with lower levels of institutional development
(Bhaumik and Driffield 2011).
However, in the context of making investments that may be open to criticism, either due
to excessive risk, or ethical objections, concentrated ownership may make this more
likely. Concentrated ownership facilitates more risky or controversial FDI, as there are

15
fewer constituents to get on board. Thus ownership concentration facilitates more FDI,
but it is also likely to facilitate more FDI in more ethically dubious areas. Equally, such
firms may be less concerned about adverse comment on their actions due to the relative
weakness of other stakeholders.
H4: firms with concentrated ownership are more likely to engage in FDI to conflict
zones.
4. THE MODEL
The probability of a firm entering a location is determined by expectations of future
profits (Πe). In the expression below T is the expected life of the investment, and r is the
discount rate:
Prob(FDI) = φ1 [ ( )1 10
+= +∑ r
p
T p
t peΠ ] (1)
This is clearly unobservable, but this model can be re-written as a function of a vector of
firm and home country characteristics such that:
( )1 10
+= +∑ r
p
T p
t peΠ = φ( ),( jij θφ ) (2)
Where ijφ is a vector of firm level effects and jθ a vector a home country effects.
This then translates into equation (3) - a panel probit model that explains variations in the
propensity to engage in FDI to conflict regions at the firm level. The panel data

16
methodology allows us to control for firm-level heterogeneity via our explanatory
variables which we discuss in detail below. A probit model is ideal for studying data with
an independent variable which is binomially distributed. You can express probit models
in terms of the event probability:
)'()()1('
βxx
Φ=== ∫∞−
β
φ dttFDIP (3)
where Φ is the standard normal cumulative distribution function. The probit model is
essentially a linear regression of the Z score of the event probability on the dependent
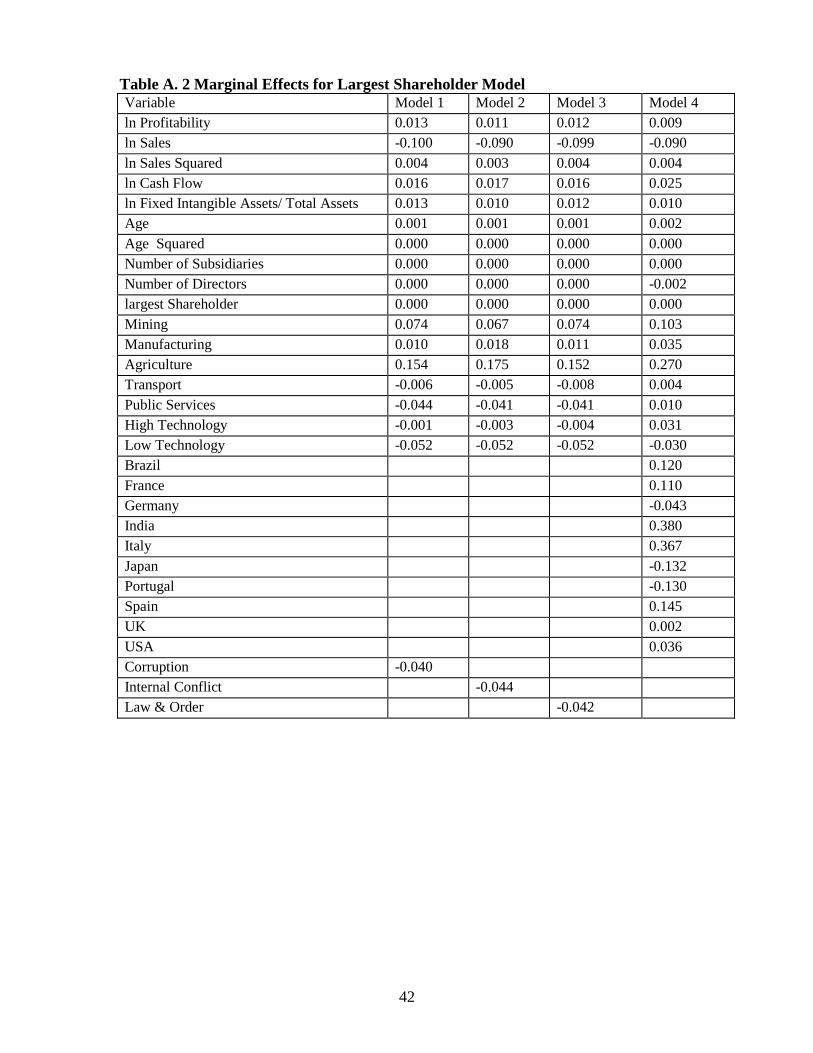
variable (FDI). To interpret the coefficient estimates therefore, researchers generally look
at the estimated signs of the regression coefficients or calculate the marginal effects. We
leave the latter for the appendix and the former are reported in the text. For more
information on probit models see Liao (1994).
Random Effects Probit:
In reality we don’t actually use the simple probit model, we use a random effects probit
model of the following form (see: Arulampalam 1998)
otherwiseandyifyand
uvTtandnivy
itit
ititit
ititit
001
,..,2,1,...,2,1*
=>=
+=
==+=
α
βx
(3)
Where *ity is a latent variable which is unobservable, y is the observed outcome, itx is the
vector of time varying and time invariant variables which are assumed exogenous with

17
their influence on *ity , itβ is the vector of parameters, itα is the individual unobservable
effect and itu is the random error.
The Applied Model
The model that we estimate is then developed from the standard firm level FDI literature
that seeks to construct a specification from standard IB theory. This is discussed at length
in a number of review articles, in economics and regional science, as well as
international business and strategy, see for example Wiersema, and Bowen (2008),
Driffield and Munday (2000), Bhaumik et al (2010) Girma (2002) . We employ a series
of control variables to capture differences in firm specific advantages; size, performance
and intangible assets, and a variable strongly linked to the ability to fund FDI, in the form
of free cash flow3. We also capture the ability of firms to manage overseas assets, with
the number of existing foreign subsidiaries and the number of directors on the board in
20091
. We augment this with variables highlighted in the hypotheses, the host country of
the MNE, a vector of institutional characteristics of the home country, a set of sectoral
dummies, and the ownership concentration of the parent firm. Thus, the model that is
estimated becomes:
)4.........(
sec
1
3
1
7
1987
10
ittiL
l litlw wit
s sitsititk kitkj
it
locationninstitutioownership
torcashflowessubsidiariFSACONFDI
εµαλθϕ
φββββ
++++++
++++=
∑∑∑∑
==
==
1 This variable only being available for the final year in the BvD data
18
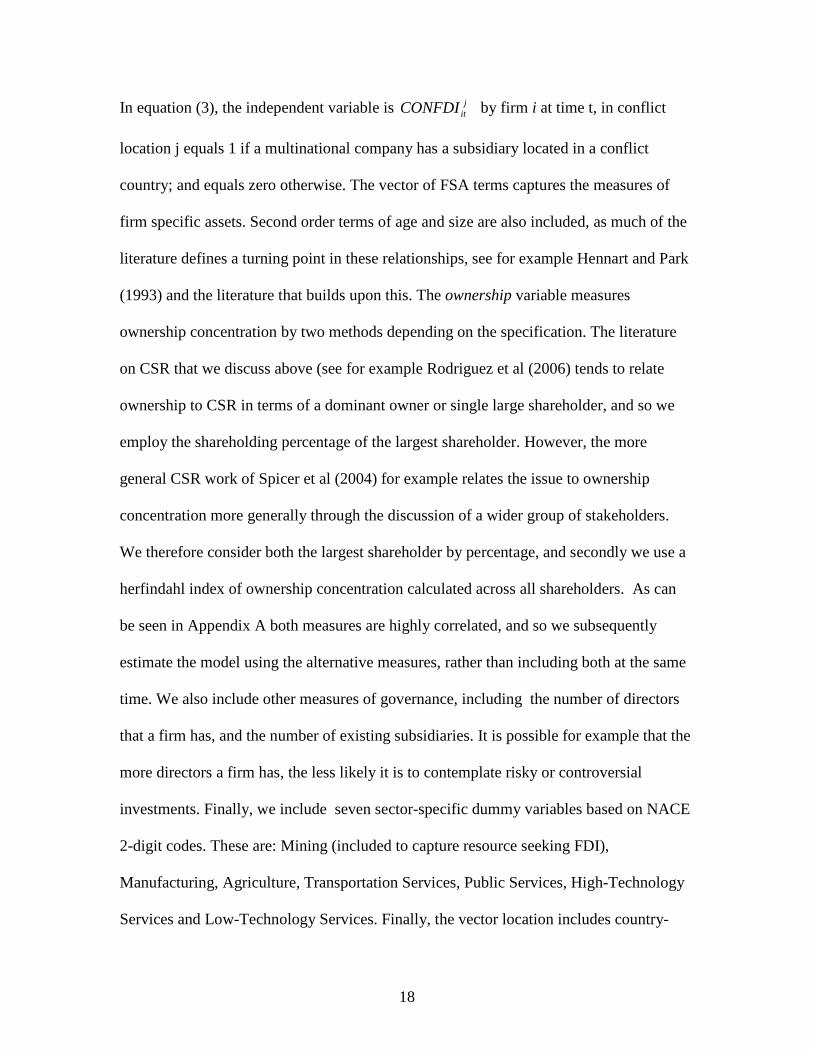
In equation (3), the independent variable is jitCONFDI by firm i at time t, in conflict
location j equals 1 if a multinational company has a subsidiary located in a conflict
country; and equals zero otherwise. The vector of FSA terms captures the measures of
firm specific assets. Second order terms of age and size are also included, as much of the
literature defines a turning point in these relationships, see for example Hennart and Park
(1993) and the literature that builds upon this. The ownership variable measures
ownership concentration by two methods depending on the specification. The literature
on CSR that we discuss above (see for example Rodriguez et al (2006) tends to relate
ownership to CSR in terms of a dominant owner or single large shareholder, and so we
employ the shareholding percentage of the largest shareholder. However, the more
general CSR work of Spicer et al (2004) for example relates the issue to ownership
concentration more generally through the discussion of a wider group of stakeholders.
We therefore consider both the largest shareholder by percentage, and secondly we use a
herfindahl index of ownership concentration calculated across all shareholders. As can
be seen in Appendix A both measures are highly correlated, and so we subsequently
estimate the model using the alternative measures, rather than including both at the same
time. We also include other measures of governance, including the number of directors
that a firm has, and the number of existing subsidiaries. It is possible for example that the
more directors a firm has, the less likely it is to contemplate risky or controversial
investments. Finally, we include seven sector-specific dummy variables based on NACE
2-digit codes. These are: Mining (included to capture resource seeking FDI),
Manufacturing, Agriculture, Transportation Services, Public Services, High-Technology
Services and Low-Technology Services. Finally, the vector location includes country-
19
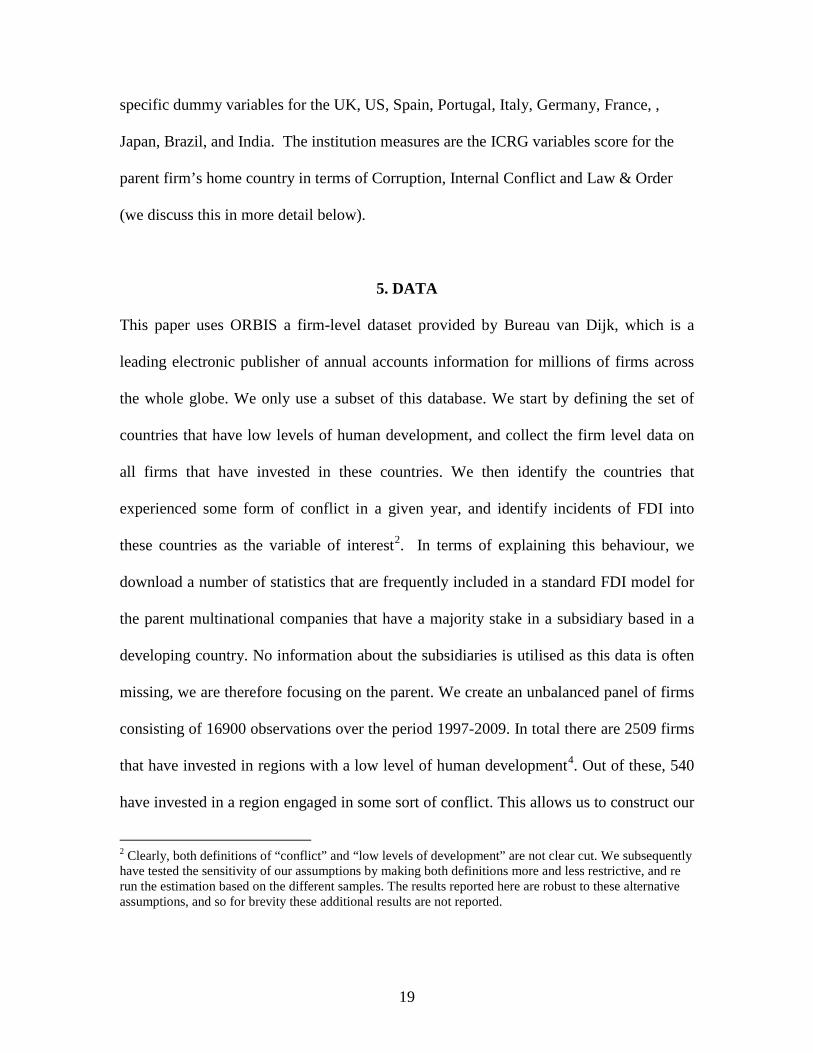
specific dummy variables for the UK, US, Spain, Portugal, Italy, Germany, France, ,
Japan, Brazil, and India. The institution measures are the ICRG variables score for the
parent firm’s home country in terms of Corruption, Internal Conflict and Law & Order
(we discuss this in more detail below).
5. DATA
This paper uses ORBIS a firm-level dataset provided by Bureau van Dijk, which is a
leading electronic publisher of annual accounts information for millions of firms across
the whole globe. We only use a subset of this database. We start by defining the set of
countries that have low levels of human development, and collect the firm level data on
all firms that have invested in these countries. We then identify the countries that
experienced some form of conflict in a given year, and identify incidents of FDI into
these countries as the variable of interest2. In terms of explaining this behaviour, we
download a number of statistics that are frequently included in a standard FDI model for
the parent multinational companies that have a majority stake in a subsidiary based in a
developing country. No information about the subsidiaries is utilised as this data is often
missing, we are therefore focusing on the parent. We create an unbalanced panel of firms
consisting of 16900 observations over the period 1997-2009. In total there are 2509 firms
that have invested in regions with a low level of human development4
2 Clearly, both definitions of “conflict” and “low levels of development” are not clear cut. We subsequently have tested the sensitivity of our assumptions by making both definitions more and less restrictive, and re run the estimation based on the different samples. The results reported here are robust to these alternative assumptions, and so for brevity these additional results are not reported.
. Out of these, 540
have invested in a region engaged in some sort of conflict. This allows us to construct our
20
dependent variable jitFDI that distinguishes between the two and allows us to run a
simple probit model.
The key variables included in our analysis are profitability, defined as return on assets
using EBIT, sales, cash-flow, a ratio of intangible fixed assets to total assets, the number
of subsidiaries, the number of directors, firm age and the concentration variable. In
addition to this we generate: (1) a set of sectoral dummies based on NACE 2-digit codes,
these are mining, manufacturing, agriculture, transportation services, public services,
high-technology services and low-technology services5
To determine which countries are categorised as experiencing conflict, in order to
generate the list of CONFLICT countries, we take advantage of the International Country
Risk Guide (ICRG) constructed by countryrisk.com. There are numerous indices
covering governance and institutions that are available. Many reflect the political
persuasion of the institute involved, or the purpose of the data collection. The ICRG data
is generated in order to provide advice or guidance to firms contemplating FDI decisions.
As such, it is the database most geared to the private sector, and divorced from particular
political views of institutions or institutional development. They use 12 measures of
political risk to assess a number of different countries. One of the measures is called
Internal Conflict and is according to ICRG:
; and (2) a set of country specific
dummies based on each multinational’s home country, these are identified for the UK,
US, Spain, Portugal, Italy, Germany, France, Japan, Braziland India.
“An assessment of political violence in the country and its actual or potential impact on governance. The highest rating is given to those countries where
21
there is no armed or civil opposition to the government and the government does not indulge in arbitrary violence, direct or indirect, against its own people. The lowest rating is given to a country embroiled in an on-going civil war. The risk rating assigned is the sum of three subcomponents, each with a maximum score of four points and a minimum score of 0 points. A score of 4 points equates to Very Low Risk and a score of 0 points to Very High Risk.”
The three subcomponents ICRG distinguishes between are Civil War/Coup Threat,
Terrorism/Political Violence and Civil Disorder. In order to categorise the ‘conflict
countries’ we average each countries score from 1997 to 2009, if this score is less than
6.5 the country is classified as a conflict country and therefore all of the parent companies
that have a subsidiary in that corresponding country are identified as a company that
invests in a conflict region. The conflict countries identified are Bangladesh, Colombia,
Congo DR, Haiti, Iraq, Nigeria, Somalia, Sri Lanka, Sudan, and Zimbabwe.
6 ANALYSIS
Before moving to the econometric analysis, it is important to discuss some features of the
data. Firstly, Table 1 highlights the differences in intuitional quality between different
regions/countries used in the subsequent analysis. The institutional data are taken from
the International Country Risk Guide (ICRG) constructed by countryrisk.com. As well as
their measure of internal conflict (discussed above) they also have statistics on corruption
and law & order. The data in Table 1 contains an average taken from 1997-2009 for each
of these variables for a number of key countries. Freedom from Corruption is an
assessment of corruption within the political system it has maximum score of 6. Law &
Order is split up into two components. The Law sub-component is an assessment of the
22
strength and impartiality of the legal system, while the Order sub-component is an
assessment of popular observance of the law. The maximum score for this variable is 6.
The internal conflict variable is discussed above.
Table 1 here As can be seen across each country there is considerable heterogeneity. The data follows
a consistent and familiar pattern, with the developing countries Brazil and India all
scoring lower on average for each measure relative to the other countries. This result is
unsurprising. Perhaps the most interesting statistics are those associated with Italy. In
general, Italy has the worst rating in terms of freedom from corruption and law & order
compared with all of its European neighbours.
Modelling Strategy
Clearly the decision to invest in a conflict zone in a developing country is not the same as
the decision to invest in say the US or EU. Investing in a developing country in general
can be considered more risky, with investment in a conflict location an extreme example
of this. We therefore proceed as follows. In order to control for the propensity to engage
in risky investments, we construct a database of all firms who have invested in
developing countries with weak institutions, based on the institution quality data
discussed below. This controls for risk taking, and also the ability or willingness to
operate in countries with poor institutional protection. We subsequently seek to explain
which firms are then willing to invest in conflict zones, which may be seen as a more
extreme situation.
23
As we outline above, we do this through the use of a panel probit model, but before
presenting the results it is important to consider a number of econometric issues. Firstly,
there is the issue of colinearity in the explanatory variables. Some of the correlations
reported in table A3 are high, but these typically are simply correlations between
measures of size. They do not present a colineraity problem, and the summary of the VIF
tests are reported below table A3.
Secondly, as some firms may repeatedly invest in the same set of countries, there is the
possibility of serial correlation. We tested for this using the most reliable test for serial
correlation, as discussed in Gourieroux et al (1985). This involves the use of an
asymptotic “score test” for serial correlation. The null of no serial correlation is not
rejected for any of the sets of results that we report below.
The final issue is one of endogeneity in the institution variables. Some of the literature
discussed above suggest a theoretical relationship in which ifdi can influence the
institutions of a country. It is therefore necessary to test for this, and we do so under the
null of no serial correlation, using a likelihood ratio test. This fails to reject the null that
the institution variables are endogenous6
Finally, as we outline above, there are numerous measures of phenomena such as
institutional quality, or ownership structures, so our strategy proceeds as follows. Starting
with the baseline model that uses traditional variables seeking to capture differences in
the FDI decision, such as age, size, intangible assets, sector and performance, we
augment this with the measures of institutional quality, such as freedom from corruption,
protection of law and order, and internal conflict in the home country. These measures
are designed to capture a range of institutional differences, but in practice tend to be
.
24
correlated, and so we introduce these on an individual basis. For completeness, we also
replace these with a set of country dummies to capture differences in the home country.
The baseline equation employs freedom from corruption, as the variable most used in the
FDI flows literature discussed above. We then employ the others in turn, and finally
replace these with country dummies to examine the importance of home
countrydifferences of these on the decision to invest in a conflict country.
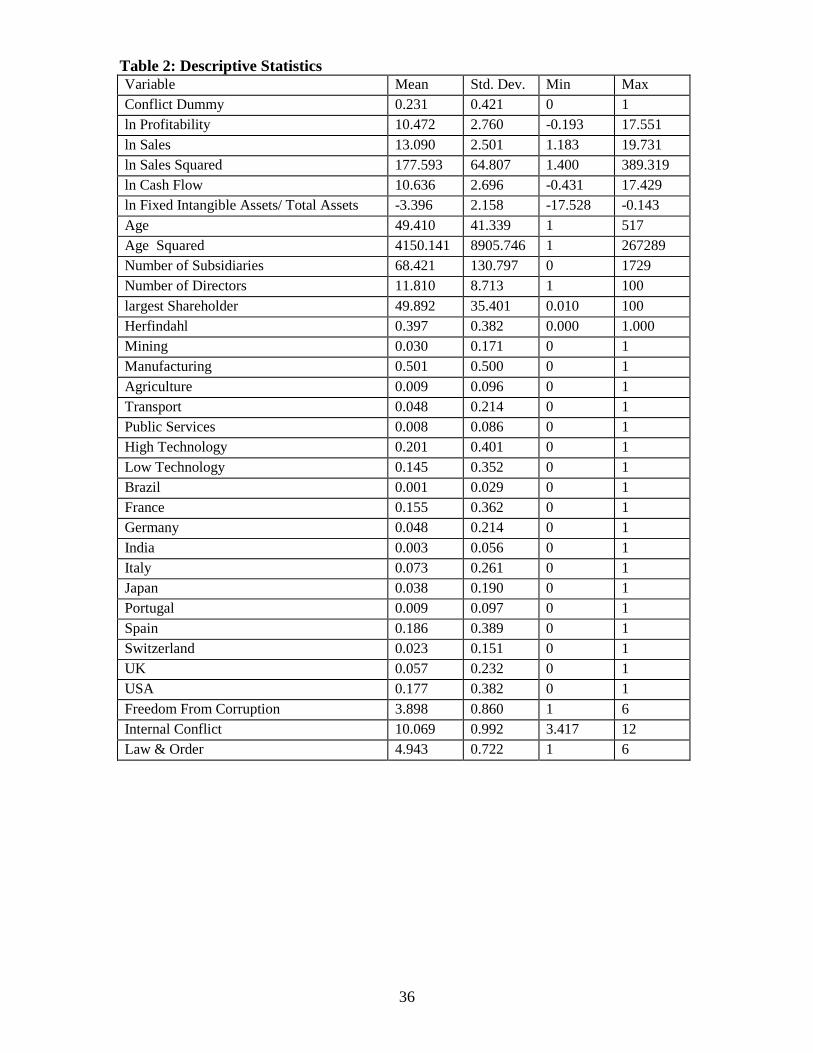
Table 2 gives some simple descriptive statistics for each of the variables used in the
following analysis. Included are the mean, standard deviation and the maximum and
minimum values for each variable. In addition to this Table A1.1 in Appendix A contains
the correlation matrix for the FDI variables.
Table 2 here
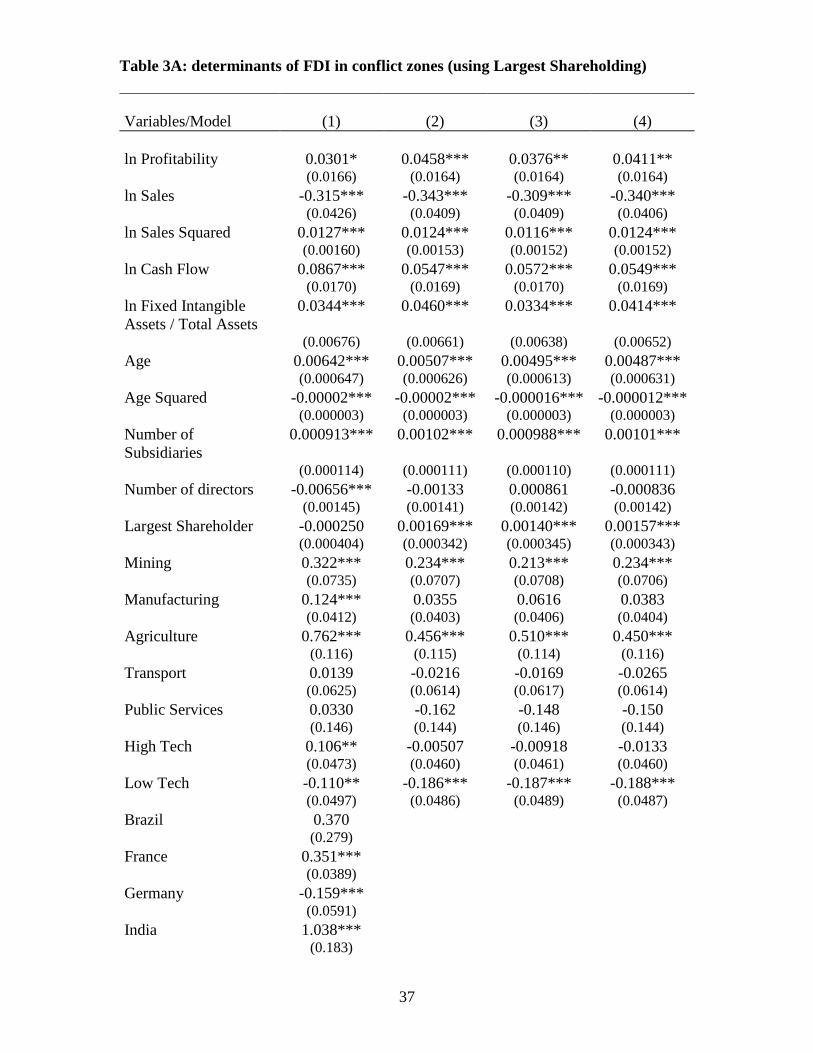
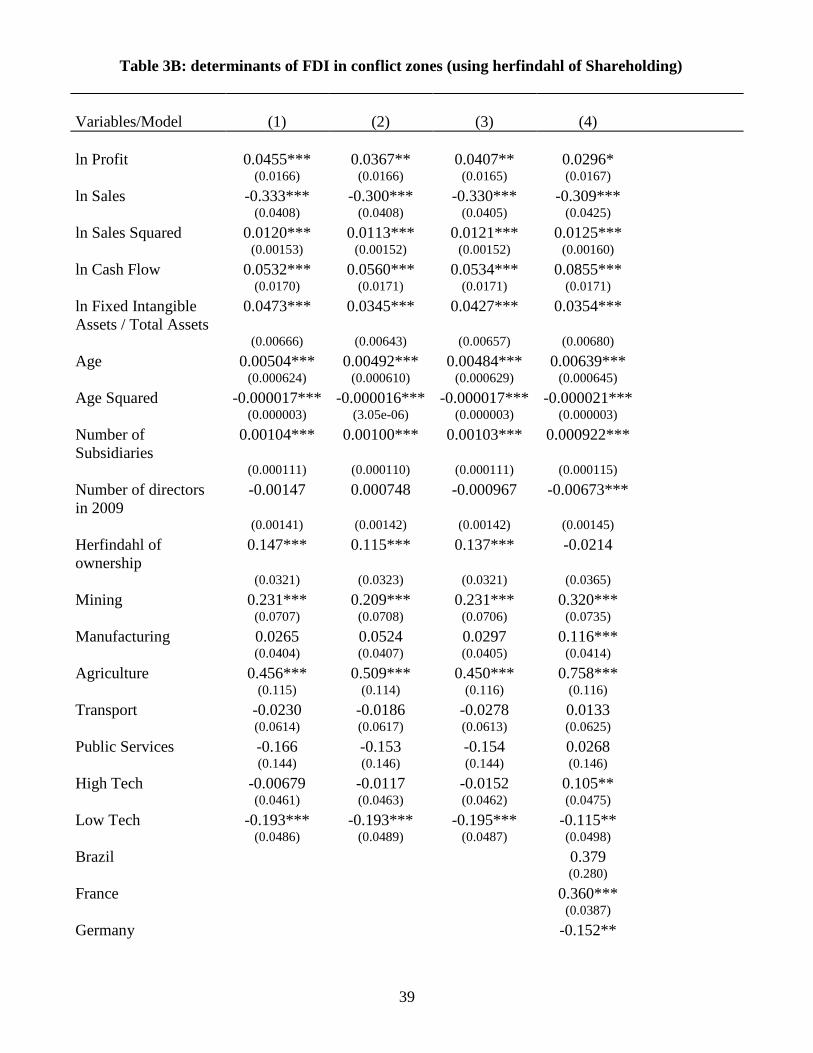
Tables 3A and 3B presents the results of our baseline probit specification (column 1).
These report comparable specifications, using two alternative measures of shareholding
concentration. Initially we focus on the importance of the leading shareholder (3A) and
then on the herfindahl of all shareholdings (3B). The results however are consistent
across these alternative indicators.
The results illustrate the firm level determinants of a firm’s decision to invest in a conflict
location. More specifically they represent the decision of a firm that has already chosen
to invest in low income countries with weak institutions, to also invest in a conflict
location. Given this particularly restrictive question, the models work particularly well.
The control variables work as expected, profitability is associated with this type of FDI
and are consistent with the OLI theory outlined above. Intangible assets and number of
25
subsidiaries are positive. Equally, the effect of age is positive, but again with a turning
point7
We also find unqualified support for hypothesis two. The coefficients on the sectoral
dummies show not surprisingly mining and agriculture are positive and significant. Firms
in these sectors are some 15% and 7% respectively more likely to engage in FDI in
conflict zones. Those sectors governed by geography are more likely to engage in FDI in
conflict zones. It is noticeable however than manufacturing firms are more likely to
invest in such locations, though this again is linked to the desire to source key inputs. Our
results show that the extent of this strategy goes well beyond what may have been
thought of as the traditional sectors of this type of activity. High-technology industries,
which include financial services and manufacturing, show a high probability of being
attracted to such locations. Transportation, not surprisingly, is less likely to be attracted to
conflict countries.
, suggesting that the most established firms shy away from this type of activity. The
results concerning age and size can also be linked to the issue of CSR. Small firms are
perhaps too small to attract criticism, or perhaps are set up for the specific purpose of
investing in sensitive locations, while the largest firms are extremely diversified and may
be able to hide certain activities. The other control variables, subsidiaries, cash flow and
intangible assets work as expected.
Firm size is inversely associated with this behaviour, though with a turning point,
suggesting that it is the smaller and largest firms that are most likely to invest in conflict
locations, which provides support for hypothesis three.
Table 3A here
26
Of more interest are the ownership variables, both in terms of the firm specific variables,
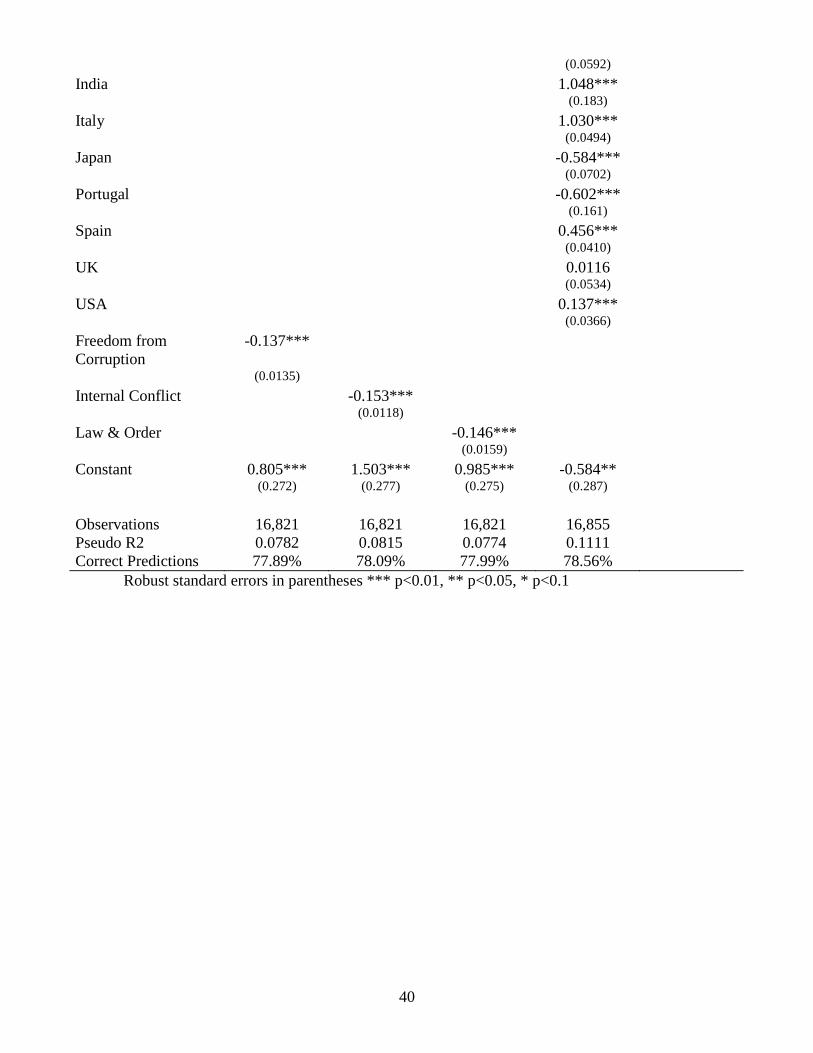
and the home country variables. There is strong support for hypothesis one. From even
within the developed world there are large differences in the propensity to invest in
conflict countries. Spain, Italy and France appear far more likely to invest in conflict
countries than Germany or USA or the UK, although the UK is positive but small,
perhaps indicative of certain ex colonial ties. This provides support for the arguments
around hypothesis one, in that there are significant differences in the propensity of
different countries to invest in conflict regions, and that these are explained by
differences in home country institutions. This is then extended further to include
transition countries, with India and Brazil being significantly more likely to invest in
conflict locations. The marginal effects, reported in the appendix are also informative
here. Italian firms for example are nearly 37% more likely to invest in a conflict zone
than the average, while Japanese firms are 12% less likely. Of the emerging countries,
India is the most likely to invest in conflict zones, 38% more likely than the average.
These results are replicated by the model that employs ownership concentration in the
form of the herfindahl of ownership concentration, which are reported in table 3B.
Table 3b here
The country effects are confirmed by the measures of institutional quality, with all three
measures being negatively associated with FDI to conflict countries. Firms from
countries with lower corruption, less internal conflict, and better law and order are less
likely to invest in conflict zones. This is consistent with both the analysis based on CSR,
and the resource based view of the firm. Firms from countries with traditionally weaker
institutions (even within the developed world) are more likely to be willing to engage

27
with such locations, having more experience with managing resources in challenging
environments. It is also likely that such firms may face less criticism or questioning over
the ethics of their investments, than in say the US, UK or Germany.
The impact of ownership concentration is positive across all specifications, and both
measures of ownership concentration, providing strong support for hypothesis 4such that
concentrated firms are more likely to invest in conflict locations. This is consistent with
the discussion of both CSR and the work of Peng (2008) and Doukas and Lang (2003)
that is linked in H4.
6. CONCLUSION
To the best of our knowledge, this is the first attempt to explain the prevalence of firms to
invest in conflict countries. Numerous authors have pointed out the extent to which
political instability deters FDI, and rather fewer, typically from outside the IB or strategy
area have commented on particular examples of western firms investing in politically
unstable or ethically questionable locations. However, what we have shown here is that
the relatively standard models that seek to explain variations in FDI propensity, including
size, intangible assets, subsidiaries and age, still explain the marginal decision to invest in
a conflict region, even taking into account the decision to invest in a low income country
with relatively weak institutions. Our analysis suggests that of some 2509 firms that have
chosen to invest in such countries, over 540 have invested in conflict countries. Thus,
while existing literature that points out the extent to which internal conflict deters FDI
may well be correct, it by no means deters all firms.
28
Further, we have shown that ownership structures and institutions in the home country
are important determinants of this decision. Firms from countries with relatively strong
traditions of CSR are less likely to engage in conflict FDI. This is not perhaps surprising
as a growing body of research (Murry and Vogel, 1997; Sen and Bhattacharya, 2001 and
Yoon et. al., 2006) indicates that consumer behaviour provides incentives to firms to
engage in socially responsible behaviour; to pay more, to switch brands, to buy products
from a company because of its charitable donations. Thus the commercial benefits of
such socially responsible behaviour are more likely to be undermined within firms
engaged in FDI in conflict zones from countries where traditions of CSR are strong.
Conversely there is also a growing body of literature asserting the need for CSR to be
contextualised (Halme et. al., 2009; Crotty, 2011), to take account of different stages of
economic and institutional development. While our data indicates that firms from
countries with a weak CSR culture were not deterred from investing in conflict zones, out
conclusion is dependent on assuming a western definition, of CSR namely that is
voluntary (Carroll and Shabana, 2010), about going beyond compliance (Davis, 1973)
and informed by stakeholders (Michell et. al., 1997). Firms from such countries may not
have a ‘weak’ CSR culture, but may in fact have different interpretations of what CSR is
and how it should be enacted. Thus in terms of further work, our paper suggests a need
for a better analysis of CSR at the country level, to better understand the motivations of
certain countries to invest in such locations, and to appreciate more readily what is
understood by CSR in such locations. Beyond this, our findings also suggests a link to
possible case study or survey work to determine more about the activities of investors on

29
an individual basis, to understand the commercial trade-offs in investing in conflict zones
verses the loss of CSR benefits within existing markets.
30
BIBLIOGRAPHY Addison, T and Murshed, S M (2001) The Fiscal Dimensions of Conflict and Reconstruction. World Institute for Development Economics Research Discussion Paper No. 2001/49 Arulampalam, W (1998) A Note on Estimated Coefficients in Random Effects Probit Models. The Warwick Economics Research Papers Series, No 520. Barkema, H.G. and Vermeulen, F. (1998) International Expansion through Start up or Acquisition: A Learning Perspective. The Academy of Management Journal, Vol. 41, No. 1 pp. 7-26 Berglof, E. and A. Pajutse (2005). What do firms disclose and why? Enforcing corporate governance and transparency in central and eastern Europe, Oxford Review of Economic Policy 21(2), 178-197. Bertrand, M., P. Mehta and S. Mullainathan (2002). Ferreting out tunnelling: An application to Indian business groups. Quarterly Journal of Economics 117, 121-148. Bhaumik, S., Driffield, N. and Pal, S. Does (2010) Ownership Concentration Affect MNE Operations? The Case of Indian Automobiles and Pharmaceuticals. Journal of International Business Studies 41 (3), pp. 437–450 Bhaumik, S. and Driffield, N. (2011) Direction of outward FDI of EMNEs: vidence from the Indian pharmaceutical sector. Thunderbird Review of IB, forthcoming Bhaumik, S., Estrin, S.. Meyer, K.E and Peng, M. (2009).Institutions, Resources, and Entry Strategies in Emerging Economies. Strategic Management Journal, 30(1): 61-80, 2009. Buckley, P. J. and Casson, M. C. (1976) The Future of the Multinational Enterprise, London, Macmillan. Branzei, O. and Abdelnour, S. (2010) Another Day, Another Dollar: Enterprise Resilience in Conflict, the Journal of International Business Studies, Special Issue on Conflict, Security and Political Risk: International Business in Challenging Times Carroll A.B (1979) ‘A three-dimensional model of corporate social performance’, Academy of Management Review, 4, 497-505. Carroll A.B (1991) ‘The pyramid of corporate social responsibility: Toward the moral management of organizational stakeholders’, Business Horizons, 34(4): 39-48. Carroll A. B. (1999) ‘Corporate social responsibility – Evolution of a definitional construct’, Business and Society, 38, 268-295.

31
Carroll, A. B. and K. M. Shabana, (2010) ‘The Business Case for Corporate Social Responsibility: A Review of Concepts, Research and Practice’. International Journal of Management Reviews 12/1: 85-105 Chau, G.K. and Gray, S.J. (2002). Ownership structure and corporate voluntary disclosure in Hong Kong and Singapore, The International Journal of Accounting 37, 247-265. Child, J. and H. Pleister (2003). Governance and management in China’s private sector, Management International 7(3), 13-24. Crotty, J. (2011). CSR in the Russian Federation: A Contextualised Approach, Academy of Management in Weaver, K. M. (ed) Best Paper Proceedings of the Seventy-first Annual Meeting of the Academy of Management: A1-6. Cuervo-Cazurra, A. (2006) Who cares about corruption? Journal of International Business Studies 37, 807 - 822 Cuervo-Cazurra, A. and Dau, L. 2009. Structural reform and firm profitability in developing countries. Academy of Management Journal, 52(6): 1348-1368. Czinkota., M. R., Knight., G., Liesch., P. W., Steen., J., Terrorism and international business: A research agenda. Journal of International Business Studies (2010) 41, 826–843 Daude, C and Stein, E (2007) The Quality of Institutions and Foreign Direct Investment Economics and Politics 19, 317-344 Davis, K. (1973) ‘The Case For and Against Business Assumption of Social Responsibilities’. Academy of Management Journal, 16: 312-322
Donaldson, T. J., and L. E. Preston. The Stakeholder Theory and the Corporation: Concepts, Evidence, and Implications. Academy of Management Review 20 (1995). Doukas, J.A. and Lang, L.H.P. (2003) Foreign Direct Investment, Diversification and firm performance, Journal of International Business Studies, 34, 153-172 Driffield, N., Henry, M. and Jones, C. (2009) Education or western governance – the beneficial effects of FDI in developing countries. Aston Business School, mimeo.
Driffield, N. Mickiewicz, T., Pal, S. and Temouri, Y (2010) Bridging the gap? corruption, knowledge and foreign ownership. Presented at AIB conference, April 2010.
32
Driffield, N. and Munday, M. (2000). Industrial Performance, Agglomeration, and Foreign Manufacturing Investment in the UK, Journal of International Business Studies, Palgrave Macmillan Journals, vol. 31(1), pages 21-37, March. Dunning, J. H. (1979) ‘Explaining Patterns of International Production: in Defence of the Eclectic Theory’, Oxford Bulletin of Economics and Statistics, 41, 269–95. Dunning, J. H. (1988) Explaining International Production, London, Unwin Hyman. Erdener, C. and D.M. Shapiro (2005). The internationalisation of Chinese family enterprises and Dunning’s eclectic MNE paradigm, Management and Organization Review 1(3), 411-436. Frynas, J G., Mellahi, K and Pigman, G A (2006) First Mover advantages in International Business and Firm-specific political resources. Strategic Management Journal 27, 321-345 Kevin Gibson (2000). The Moral Basis of Stakeholder Theory. Journal of Business Ethics 26 (3). Girma, S.(2002)., The Process of European Integration and the Determinants of Entry by Non-EU Multinationals in UK Manufacturing, The Manchester School, Vol.70, pp. 315-335. Gnyawali, D.R. (1996) ‘Corporate social performance: an international perspective’, in S.B. Prasad and B.K. Boyd (eds.) Advances in International Comparative Management, vol. 11. JAI Press: Greenwich, CT, pp: 251–273. Halme, M.; N. Roome,; P. Dobers, (2009) ‘Corporate Responsibility: Reflections on Contexts and Consequences’. Scandinavian Journal of Management 25/1: 1-9 Heckman, J. (1981). Statistical Models for Discrete Panel Data, in C. Manski and D. McFadden, eds., Structural Analysis of Discrete Data, MIT Press. Henisz, W. J, (2000). The Institutional Environment for Multinational Investment, Journal of Law, Economics and Organization, Oxford University Press, vol. 16(2), pages 334-64, October. Henisz, W.J, Mansfield, E. D., and Von Glinow. M. A., (2010) Conflict, security, and political risk: International business in challenging times. Journal of International Business Studies vol 41 pp. 759-764 Hennart, J-F and YR. Park. (1993). Greenfield vs acquisition: The strategy of Japanese investors in the United States. Management Science, 39:1054-70.

33
Husted, B W and D B Allen (2006) Corporate social responsibility in the multinational enterprise: Strategic and Institutional approaches, Journal of International Business, 36, 838-849 Javorcik, B.S. and S.J. Wei. (2009). ‘Corruption and Cross-border Investment in Emerging Markets: Firm-Level Evidence’, Journal of International Money and Finance, 28, 605-624.
Li, Q. and Vashchilko, T. (2010), Dyadic military conflict, security alliances, and bilateral FDI flows, Journal of International Business Studies, 41, issue 5, p. 765-782. Liao, T F (1994). Interpreting Probability Models Logit, Probit, and Other Generalized Linear Models, Quantitative Applications in the Social Sciences, A Sage University Paper. Liu, L. (2005). China’s Industrial Policies and the Global Business Revolution: The Case of the Domestic Appliance Industry, London: Routledge Curzon. Luo, Y. (2005). Corporate governance and accountability in multinational enterprises: Concepts and agenda, Journal of International Management 11(1), 1-18. Luo, Y (2006) Political behaviour, Social responsibility, and perceived corruption: a structuration perspective, Journal of International Business Studies, 37, 747-766 Luo, Y. and R.L. Tung (2007). International expansion of emerging market enterprises: A springboard perspective, Journal of International Business Studies 38, 481-496. Meyer, K.E. and Nguyen, H.V. (2004) ‘Foreign investment strategies and sub-national institutions in Emerging Markets: evidence from Vietnam’, Journal of Management Studies, 42(1) pp 63-93 Mitchell, R. K.; B. R. Agle,; D. J. Wood,(1997) ‘Towards a Theory of Stakeholder Identification and Salience: Defining the Principle of Who or What Really Counts’. Academy of Management Review, 22/4: 853-886 Murray, K.B. and C.M.Vogel (1997). ‘Using the hierarchy of effects approach to gauge the effectiveness of CSR to general goodwill towards the firm: Financial verses nonfinancial impacts’, Journal of Business Research 38: 141-159 Nazli A. Mohd Ghazali, (2007) Ownership structure and corporate social responsibility disclosure: some Malaysian evidence, Corporate Governance, Vol. 7 Iss: 3, pp.251 - 266 Peng, M. (2006) Global Straegy. South West Thompson, Cincinatti.

34
Peng, M., Wang, D. and Jiang, Y. (2008) An institution-based view of international business strategy: a focus on emerging economies. Journal of International Business Studies vol 39 pp 920-936 Rodriguez, P. Siegel, D., Hillman, A and Eden, L. (2006) Three lenses on the multinational enterprise: politics, corruption and corporate social responsibility. Journal of International Business Studies, vol 37 pp 733-746. Rose-Ackerman, S. (2002) “Grand” corruption and the ethics of global business, Journal of Banking and Finance, Elsevier, vol. 26(9), pages 1889-1918, September. Rose-Ackerman, Susan (2008) 'Corruption and Government', International Peacekeeping,15 (3) ,328- 343 Rugman (1975) Corporate International Diversification and Market Assigned Measures of Risk and Diversification. The Journal of Financial and Quantitative Analysis, Vol. 10, No. 4, 1975 Proceedings (Nov., 1975), pp. 651-652 Sen, S. and C. B. Bhattacharya (2001). ‘Does doing good always lead to doing better?’ Journal of Marketing Research 38: 225-243 Spicer, A. Dunfee, T.W. and Bailey, W.J. (2004) Does national context matter in ethical decision making? An empirical test of integrative social contracts theory. Academy of management journal 47(4) 610-620. Strike, V.M., Gao, J., and Bansal, P.(2006) Being good while being bad: social responsibility and the international diversification of US firms. Journal of International Business Studies vol 37, pp 850-862 Tasi, K.S. (2002). Back-alley Banking: Private Entrepreneurs in China, Ithaca: Cornell University Press. United Nations (2009) Report of the Secretary-General on the work of the Organization. General Assembly Official Records Fifty-fourth Session Supplement No. 1 (A/54/1). Wiersema, M. F. and Bowen, H.P. (2008) Corporate diversification: the impact of foreign competition, industry globalization, and product diversification. Strategic Management Journal vol 29 (2) pp. 115-132 Wood, D. J., and Logsdon, J. M. 2001. Theorising business citizenship. In J. Andriof, and M. McIntosh (Eds.), Perspectives on corporate citizenship: 83-103.Sheffield: Greenleaf. Yoon, Y, Z Gurham-Canli and N Schwartz (2006). ‘The effects of corporate social responsibility activities on companies with bad reputations’, Journal of Consumer Psychology, 16(4): 377-390

35
Table 1: Institutional Quality by Home country: ICRG Indicators Country Freedom from Corruption Internal Conflict Law & Order Brazil 2.52 9.75 2.04 France 3.30 9.45 4.90 Germany 4.41 11.18 5.08 India 2.24 7.63 4.00 Italy 2.61 10.01 4.36 Japan 3.32 11.30 5.01 Portugal 4.00 10.60 5.00 Spain 3.82 9.14 4.57 United Kingdom 4.53 9.88 5.79 United States 4.23 10.43 5.29
Notes: These scores are the average between 2000-2007.
36
Table 2: Descriptive Statistics Variable Mean Std. Dev. Min Max Conflict Dummy 0.231 0.421 0 1 ln Profitability 10.472 2.760 -0.193 17.551 ln Sales 13.090 2.501 1.183 19.731 ln Sales Squared 177.593 64.807 1.400 389.319 ln Cash Flow 10.636 2.696 -0.431 17.429 ln Fixed Intangible Assets/ Total Assets -3.396 2.158 -17.528 -0.143 Age 49.410 41.339 1 517 Age Squared 4150.141 8905.746 1 267289 Number of Subsidiaries 68.421 130.797 0 1729 Number of Directors 11.810 8.713 1 100 largest Shareholder 49.892 35.401 0.010 100 Herfindahl 0.397 0.382 0.000 1.000 Mining 0.030 0.171 0 1 Manufacturing 0.501 0.500 0 1 Agriculture 0.009 0.096 0 1 Transport 0.048 0.214 0 1 Public Services 0.008 0.086 0 1 High Technology 0.201 0.401 0 1 Low Technology 0.145 0.352 0 1 Brazil 0.001 0.029 0 1 France 0.155 0.362 0 1 Germany 0.048 0.214 0 1 India 0.003 0.056 0 1 Italy 0.073 0.261 0 1 Japan 0.038 0.190 0 1 Portugal 0.009 0.097 0 1 Spain 0.186 0.389 0 1 Switzerland 0.023 0.151 0 1 UK 0.057 0.232 0 1 USA 0.177 0.382 0 1 Freedom From Corruption 3.898 0.860 1 6 Internal Conflict 10.069 0.992 3.417 12 Law & Order 4.943 0.722 1 6
37
Table 3A: determinants of FDI in conflict zones (using Largest Shareholding) Variables/Model
(1)
(2)
(3)
(4)
ln Profitability 0.0301* 0.0458*** 0.0376** 0.0411** (0.0166) (0.0164) (0.0164) (0.0164) ln Sales -0.315*** -0.343*** -0.309*** -0.340*** (0.0426) (0.0409) (0.0409) (0.0406) ln Sales Squared 0.0127*** 0.0124*** 0.0116*** 0.0124*** (0.00160) (0.00153) (0.00152) (0.00152) ln Cash Flow 0.0867*** 0.0547*** 0.0572*** 0.0549*** (0.0170) (0.0169) (0.0170) (0.0169) ln Fixed Intangible Assets / Total Assets
0.0344*** 0.0460*** 0.0334*** 0.0414***
(0.00676) (0.00661) (0.00638) (0.00652) Age 0.00642*** 0.00507*** 0.00495*** 0.00487*** (0.000647) (0.000626) (0.000613) (0.000631) Age Squared -0.00002*** -0.00002*** -0.000016*** -0.000012*** (0.000003) (0.000003) (0.000003) (0.000003) Number of Subsidiaries
0.000913*** 0.00102*** 0.000988*** 0.00101***
(0.000114) (0.000111) (0.000110) (0.000111) Number of directors -0.00656*** -0.00133 0.000861 -0.000836 (0.00145) (0.00141) (0.00142) (0.00142) Largest Shareholder -0.000250 0.00169*** 0.00140*** 0.00157*** (0.000404) (0.000342) (0.000345) (0.000343) Mining 0.322*** 0.234*** 0.213*** 0.234*** (0.0735) (0.0707) (0.0708) (0.0706) Manufacturing 0.124*** 0.0355 0.0616 0.0383 (0.0412) (0.0403) (0.0406) (0.0404) Agriculture 0.762*** 0.456*** 0.510*** 0.450*** (0.116) (0.115) (0.114) (0.116) Transport 0.0139 -0.0216 -0.0169 -0.0265 (0.0625) (0.0614) (0.0617) (0.0614) Public Services 0.0330 -0.162 -0.148 -0.150 (0.146) (0.144) (0.146) (0.144) High Tech 0.106** -0.00507 -0.00918 -0.0133 (0.0473) (0.0460) (0.0461) (0.0460) Low Tech -0.110** -0.186*** -0.187*** -0.188*** (0.0497) (0.0486) (0.0489) (0.0487) Brazil 0.370 (0.279) France 0.351*** (0.0389) Germany -0.159*** (0.0591) India 1.038*** (0.183)

38
Italy 1.025*** (0.0494) Japan -0.599*** (0.0707) Portugal -0.606*** (0.161) Spain 0.459*** (0.0409) UK 0.00580 (0.0535) USA 0.122*** (0.0368) Freedom from Corruption
-0.136***
(0.0135) Internal Conflict -0.152*** (0.0117) Law & Order -0.145*** (0.0159) Constant -0.566** 0.808*** 1.495*** 0.987*** (0.287) (0.272) (0.277) (0.276) Observations 16,932 16,898 16,898 16,898 Pseudo R2 0.1111 0.0784 0.0816 0.0776 Correct Predictions 78.56% 77.87% 78.12% 78.00%
Robust standard errors in parentheses *** p<0.01, ** p<0.05, * p<0.1
39
Table 3B: determinants of FDI in conflict zones (using herfindahl of Shareholding)
Variables/Model (1) (2) (3) (4) ln Profit 0.0455*** 0.0367** 0.0407** 0.0296* (0.0166) (0.0166) (0.0165) (0.0167) ln Sales -0.333*** -0.300*** -0.330*** -0.309*** (0.0408) (0.0408) (0.0405) (0.0425) ln Sales Squared 0.0120*** 0.0113*** 0.0121*** 0.0125*** (0.00153) (0.00152) (0.00152) (0.00160) ln Cash Flow 0.0532*** 0.0560*** 0.0534*** 0.0855*** (0.0170) (0.0171) (0.0171) (0.0171) ln Fixed Intangible Assets / Total Assets
0.0473*** 0.0345*** 0.0427*** 0.0354***
(0.00666) (0.00643) (0.00657) (0.00680) Age 0.00504*** 0.00492*** 0.00484*** 0.00639*** (0.000624) (0.000610) (0.000629) (0.000645) Age Squared -0.000017*** -0.000016*** -0.000017*** -0.000021*** (0.000003) (3.05e-06) (0.000003) (0.000003) Number of Subsidiaries
0.00104*** 0.00100*** 0.00103*** 0.000922***
(0.000111) (0.000110) (0.000111) (0.000115) Number of directors in 2009
-0.00147 0.000748 -0.000967 -0.00673***
(0.00141) (0.00142) (0.00142) (0.00145) Herfindahl of ownership
0.147*** 0.115*** 0.137*** -0.0214
(0.0321) (0.0323) (0.0321) (0.0365) Mining 0.231*** 0.209*** 0.231*** 0.320*** (0.0707) (0.0708) (0.0706) (0.0735) Manufacturing 0.0265 0.0524 0.0297 0.116*** (0.0404) (0.0407) (0.0405) (0.0414) Agriculture 0.456*** 0.509*** 0.450*** 0.758*** (0.115) (0.114) (0.116) (0.116) Transport -0.0230 -0.0186 -0.0278 0.0133 (0.0614) (0.0617) (0.0613) (0.0625) Public Services -0.166 -0.153 -0.154 0.0268 (0.144) (0.146) (0.144) (0.146) High Tech -0.00679 -0.0117 -0.0152 0.105** (0.0461) (0.0463) (0.0462) (0.0475) Low Tech -0.193*** -0.193*** -0.195*** -0.115** (0.0486) (0.0489) (0.0487) (0.0498) Brazil 0.379 (0.280) France 0.360*** (0.0387) Germany -0.152**
40
(0.0592) India 1.048*** (0.183) Italy 1.030*** (0.0494) Japan -0.584*** (0.0702) Portugal -0.602*** (0.161) Spain 0.456*** (0.0410) UK 0.0116 (0.0534) USA 0.137*** (0.0366) Freedom from Corruption
-0.137***
(0.0135) Internal Conflict -0.153*** (0.0118) Law & Order -0.146*** (0.0159) Constant 0.805*** 1.503*** 0.985*** -0.584** (0.272) (0.277) (0.275) (0.287) Observations 16,821 16,821 16,821 16,855 Pseudo R2 0.0782 0.0815 0.0774 0.1111 Correct Predictions 77.89% 78.09% 77.99% 78.56%
Robust standard errors in parentheses *** p<0.01, ** p<0.05, * p<0.1

41
APPENDIX A
Table A.1 Correlation Matrix3
Variable 1 2 3 4 5 6 7 8 9 10 1 Conflict Dummy 1.00 2 ln Profitability 0.22 1.00 3 ln Sales 0.21 0.93 1.00 4 ln Cash Flow 0.23 0.96 0.93 1.00 5 ln Fixed Intangible
Assets/ Total Assets
0.13 0.42 0.43 0.41 1.00
6 Age 0.13 0.33 0.36 0.34 0.13 1.00 7 Number of
Subsidiaries 0.21 0.44 0.45 0.44 0.21 0.21 1.00
8 Number of Directors
0.13 0.47 0.48 0.48 0.25 0.22 0.29 1.00
9 largest Shareholder -0.06 -0.37 -0.37 -0.35 -0.27 -0.13 -0.17 -0.25 1.00 10 Herfindahl -0.06 -0.37 -0.36 -0.35 -0.28 -0.13 -0.18 -0.24 0.96 1.00
3 While some of the correlations appear high, these typically are simply due to differences in firm size. Standard VIF tests confirm that the multicollinearity is not a problem; the value of the test statistics vary from 2.9 to 3.6 across the models, well under the normal threshold of 5.
42
Table A. 2 Marginal Effects for Largest Shareholder Model Variable Model 1 Model 2 Model 3 Model 4 ln Profitability 0.013 0.011 0.012 0.009 ln Sales -0.100 -0.090 -0.099 -0.090 ln Sales Squared 0.004 0.003 0.004 0.004 ln Cash Flow 0.016 0.017 0.016 0.025 ln Fixed Intangible Assets/ Total Assets 0.013 0.010 0.012 0.010 Age 0.001 0.001 0.001 0.002 Age Squared 0.000 0.000 0.000 0.000 Number of Subsidiaries 0.000 0.000 0.000 0.000 Number of Directors 0.000 0.000 0.000 -0.002 largest Shareholder 0.000 0.000 0.000 0.000 Mining 0.074 0.067 0.074 0.103 Manufacturing 0.010 0.018 0.011 0.035 Agriculture 0.154 0.175 0.152 0.270 Transport -0.006 -0.005 -0.008 0.004 Public Services -0.044 -0.041 -0.041 0.010 High Technology -0.001 -0.003 -0.004 0.031 Low Technology -0.052 -0.052 -0.052 -0.030 Brazil 0.120 France 0.110 Germany -0.043 India 0.380 Italy 0.367 Japan -0.132 Portugal -0.130 Spain 0.145 UK 0.002 USA 0.036 Corruption -0.040 Internal Conflict -0.044 Law & Order -0.042

43
Table A3 Marginal Effects for Herfindahl Model Variable Model 1 Model 2 Model 3 Model 4 ln Profitability 0.013 0.011 0.012 0.008 ln Sales -0.097 -0.088 -0.097 -0.088 ln Sales Squared 0.004 0.003 0.004 0.004 ln Cash Flow 0.016 0.016 0.016 0.024 ln Fixed Intangible Assets/ Total Assets 0.014 0.010 0.012 0.010 Age 0.001 0.001 0.001 0.002 Age Squared 0.000 0.000 0.000 0.000 Number of Subsidiaries 0.000 0.000 0.000 0.000 Number of Directors 0.000 0.000 0.000 -0.002 Herfindahl 0.043 0.033 0.040 -0.006 Mining 0.073 0.066 0.073 0.102 Manufacturing 0.008 0.015 0.009 0.033 Agriculture 0.154 0.174 0.152 0.269 Transport -0.007 -0.005 -0.008 0.004 Public Services -0.045 -0.042 -0.042 0.008 High Technology -0.002 -0.003 -0.004 0.031 Low Technology -0.053 -0.053 -0.054 -0.032 Brazil 0.124 France 0.113 Germany -0.041 India 0.384 Italy 0.369 Japan -0.129 Portugal -0.130 Spain 0.144 UK 0.003 USA 0.040 Freedom From Corruption -0.040 Internal Conflict -0.045 Law & Order -0.043
∗ Please address correspondence to Nigel Driffield, Economics and Strategy Group, Aston Business School, Aston Triangle, Birmingham, B4 7ET, United Kingdom; email: [email protected]. The authors gratefully acknowledge support from the ESRC under RES-062-23-0986

44
1 See for example http://www.ethicalconsumer.org/CommentAnalysis/CorporateWatch/GenocideinSudan.aspx 2 A Wall St Journal Article published on the 9th of November 2009 discusses a report published by the Heinrich Böll Foundation criticising Italian energy giant Eni SpA’s plans to squeeze oil from the tar sands of the Republic of Congo. “This is a particularly dirty form of oil production and it is being planned for an area that’s highly sensitive in ecological terms,” said Dr. Sarah Wykes, one of the authors of the report. In reply Eni said that the tar-sands project would involve “no destruction of primary forest; no occupation of existing farmland; no impact on areas of high biodiversity; and no…resettlement of people.” This is a classic example of the sort investment that this paper is interested in studying. 3 For further discussion of this see Barkema and Vermeulen (1998) 4 We exclude companies where the parent is based in a tax haven. 5 The NACE 2-digit codes for each of these sectors are as follows: Mining 10 to 14; Manufacturing 15 to 37; Agriculture 01, 02, 05; Transportation 60, 61, 62, 63; Public Services 75, 80, 85; High-Tech Services 64 65, 66, 67, 70, 71 72 73 74; Low-Tech Services 50 51 52 55 60 63 90 91 93 95. This classification is consistent with Erostat. 6 This is perhaps not surprising, as for this to be rejected, this would require an individual FDI decision by a given firm to influence the macro level institutional variables. 7 Likelihood Ratio tests reveal that the models which include squared terms result in a statistically significant improvement in model fit. For example, the LR test for model 1 using the largest shareholder as a measure of concentration yields a test statistic and p-value of 106.26 and 0.000 respectively.