international center for environmental finance. environmental finance policy presentation #?:...
TRANSCRIPT

International Center For Environmental Finance.
Environmental Finance PolicyPresentation #?:
Capital Budgeting Decisions

CAPITAL BUDGETING
Capital Budgeting is used to describe how managers plan projects that have long-term implications such as the purchase of new equipment and the introduction of new products or services.
Managers have many potential projects that can be funded, hence, they must carefully select those projects that promise the greatest future return.

Typical Capital Budgeting Decisions
1. Cost reduction decisions. Should new equipment be purchased to reduce costs?
2. Expansion decisions. Should a new plant, warehouse, or other facility be acquired or built to increase capacity and sales?
3. Equipment selection decisions. Which of several available machines would be the most cost effective purchase?
4. Lease or buy decisions. Should new equipment be leased or purchased ?
5. Equipment replacement decisions. Should old equipment be replaced now or later?

Discounted Cash Flow
There are two approaches to making capital budgeting decisions by means of discounted cash flow.
1. The net present value2. The internal rate of return

The Net Present Value Method
Net present value is the difference between an investment’s market value and its cost.
In other words, net present value is a measure of how much value is created or added today by undertaking an investment, which will determine whether or not the project is an acceptable investment.

The Net Present Value Method
Example 1Moscow City Vodokanal is considering the purchase of a machine that will bring cash revenues of $20,000 per year. Cash costs (including taxes) will be $14,000 per year. The life of the machine is 8 years and its salvage cost will be $2,000. The project cost $30,000 to launch. We will use 15% discount rate.
Should the machine be purchased? If there are 1,000 shares of stock outstanding,
what will be the effect on price per share for taking this investment?

The Net Present Value Method
It may appear that the answer is obvious, since we pay only $30,00 for revenue of 8x($20,000-$14,000)+$2,000=$50,000
However, it is not that obvious.
To see if this investment is acceptable we have to perform Net Present Value Analysis
The Net Present Value Method
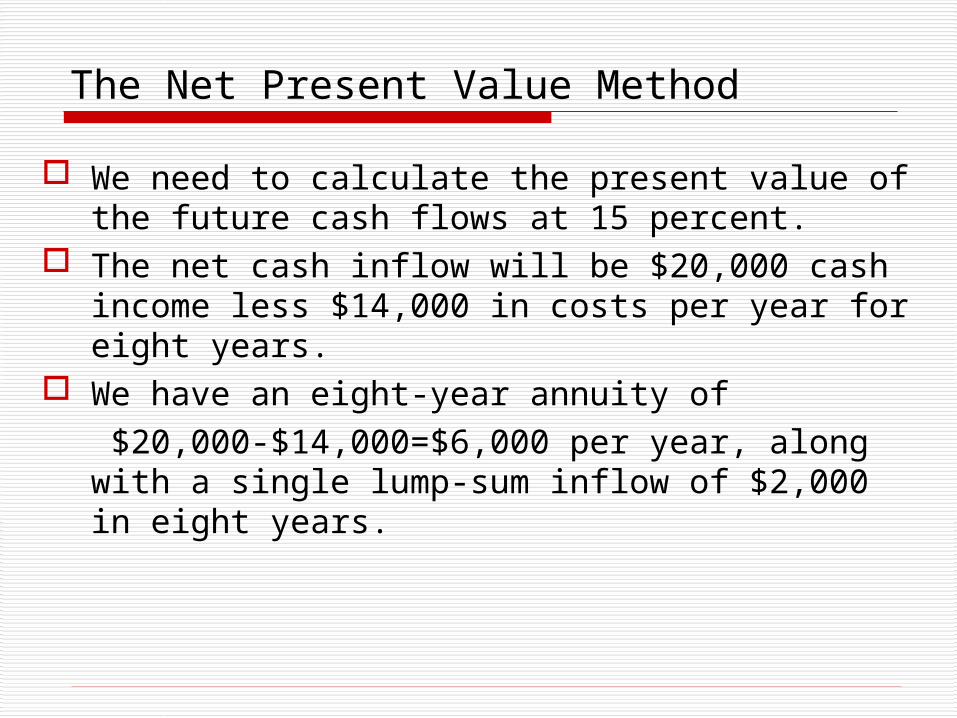
We need to calculate the present value of the future cash flows at 15 percent.
The net cash inflow will be $20,000 cash income less $14,000 in costs per year for eight years.
We have an eight-year annuity of $20,000-$14,000=$6,000 per year, along with a single lump-sum inflow of $2,000 in eight years.

The Net Present Value Method
Time(years) 0 1 2 3 4 5 6 7 8
Initial cost ($30)
Inflow $20 $20 $20 $20 $20 $20 $20 $20
Outflow -14 -14 -14 -14 -14 -14 -14 -14
Net inflow $6 $6 $6 $6 $6 $6 $6 $6
Salvage 2
Net cash flow ($30) $6 $6 $6 $6 $6 $6 $6 $8
The Net Present Value Method
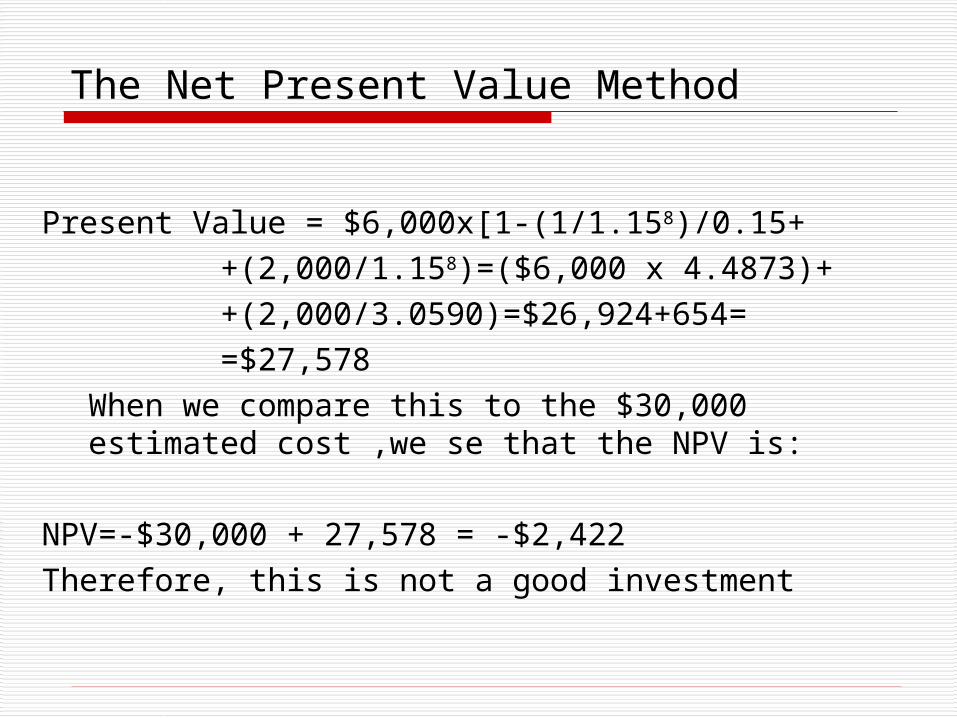
Present Value = $6,000x[1-(1/1.158)/0.15+ +(2,000/1.158)=($6,000 x
4.4873)+ +(2,000/3.0590)=$26,924+654= =$27,578
When we compare this to the $30,000 estimated cost ,we se that the NPV is:
NPV=-$30,000 + 27,578 = -$2,422Therefore, this is not a good investment

The Net Present Value Method
Now, lets answer the question regarding how this investment affect the value of our stock.
It will decrease the total value of our stock by $2,422. With 1,000 shares outstanding, we should expect a loss of value of $2,422/1,000 = $2,42 per share

The Net Present Value Method
Summary:
If the Net Present Value Is … Then the Project Is…
PositiveAcceptable, since it promisesa return grater than therequired rate of return
ZeroAcceptable, since it promisesa return equal the requiredrate of return
NegativeNot acceptable, since itpromises a return less thanthe required rate of return

The Net Present Value Method
Example 2Now let us consider an example that has different cash inflows in different periods.
Suppose we are asked to decide whether or not a new consumer service product should be launched.
Based on projected sales and costs, we expect that the CF over the 5 year life of the project will be $2,000 in the first two years, $4,000 in the next two, and $5,000 in the last year.
It will cost $10,000 to begin operation and we use 10% discount rate.
WHAT SHOULD WE DO?

The Net Present Value Method
Given the cash flows and discount rate, we can calculate the total value of the product by discounting the cash flows back to the present.
Present Value = ($2,000/1.1) + (2,000/1.12) + + (4,000/1.13) + (4,000/1.14) + (5,000/1.15)== $1,818 + 1,653 + 3,005 + 2,732 + 3,105 == $12,313
NPV = $12,313 – 10,000 - $2,313

Importance of Cash Flows
Although, the accounting net income figure is useful for many things, it is not used in discounted cash flow analysis.
The reason is that accounting net income is based on accrual concepts that ignore the timing of cash flows into and out of an organization.
The timing of cash flows is important, since a dollar received today is more valuable than a dollar received in the future.
Therefore, instead of determining accounting net income, the manager must concentrate on identifying the specific cash flows associated with an investment project.

Cash Outflows
Most projects will have an immediate cash outflow in the form of an initial investment in equipment or other assets.
In addition, some projects require expansion of the working capital.
Also, many projects require periodic repairs and maintenance and additional periodic costs – these should be treated as cash outflows.

Cash Outflows
Cash Outflows: Initial investment Increased working capital needs Repairs and maintenance Incremental operating costs

Cash Inflows
Any sound project will normally either increase revenues or reduce costs. And the amount involved should be treated as a cash inflow.
Cash inflows are also frequently realized from salvage of equipment when the project is terminated.
Also, upon termination of a project, any working capital that was tied up to the project can be released to for use elsewhere and should be trayed as cash inflow.

Cash Inflows
Cash Inflows: Incremental revenues Reduction in costs. Salvage value Release of working capital

Choosing a Discount Rate
To use the net present value method, we must choose some rate of return for discounting cash flows to their present value.
The firm’s cost of capital is usually regarded as the most appropriate choice for the discount rate.
The cost of capital is the average rate of return the company must pay to its long term creditors for the use of their funds.

Extended Example of the NPV Method
Example 3 GorVodokanal has an opportunity to offer new
service to an industrial client, but has to purchase supplies and equipment from a chemical manufacturer in order to provide that service.
The contract between all 3 parties is for 5 years with an option for renew.
GorVodokanal is responsible for all costs of promotion and distribution of its new service.
After careful study, GorVodokanal has estimated that the following costs and revenues would be associated with the new service:

Extended Example of the NPV Method
Cost of equipment needed $60,000
Working capital needed 100,000
Overhaul of the equipment in four years 5,000
Salvage value of the equipment in five years 10,000
Annual revenue and costs:
Sales revenues 200,000
Cost of goods sold 125,000
Out of pocket operating costs (for salaries,advertising, and other direct costs) 35,000

Extended Example of the NPV Method
At the end of the five-year period, the working capital would be released for investment elsewhere if contract will not be renewed.
GorVodokanal’s discount rate and cost of capital is 20%.
Would you recommend that GorVodokanal undertakes this project?

Extended Example of the NPV Method
Sales revenue $200,000
Less cost of goods sold 125,000
Less out-of-pocket costs for salaries,advertising, etc. 35,000
Annual net cash inflows $40,000

Extended Example of the NPV Method
Item Year(s)
Amount ofCashFlows
20% Factor
PresentValue ofCash Flows
Purchase of equipment Now ($60,000) 1 ($60,000)
Working capital needed Now -100,000 1 -100,000
Overhaul of equipment 4 -5,000 0.482* -2,410
Annual net cash inflowsfrom sales of the productLine
1-540,000 2.991^ 119,640
Salvage value of theequipment 5 10,000 0.402* 4,020
Working capital released 5 100,000 0.402* 40,200
Net present value $1,450

Extended Example of the NPV Method
*From Present Value and ^Present Value of an Annuity Tables
Notice how working capital is handled in this exhibit. It is counted as a cash outflow at the beginning of the project and as a cash inflow when it is released at the end of the project.

Discounted Cash Flows –The Internal Rate of Return
Method

The Internal Rate of Return Method
The internal rate of return (IRR) method can be defined as the interest yield promised by an investment project over its useful life.
The IRR is computed by finding the discount rate that equates the present value of a project’s cash outflows with the present value of its cash inflows.
In other words, the IRR is that discount rate that will cause the NPV of a project to be equal zero.
The Internal Rate of Return Method
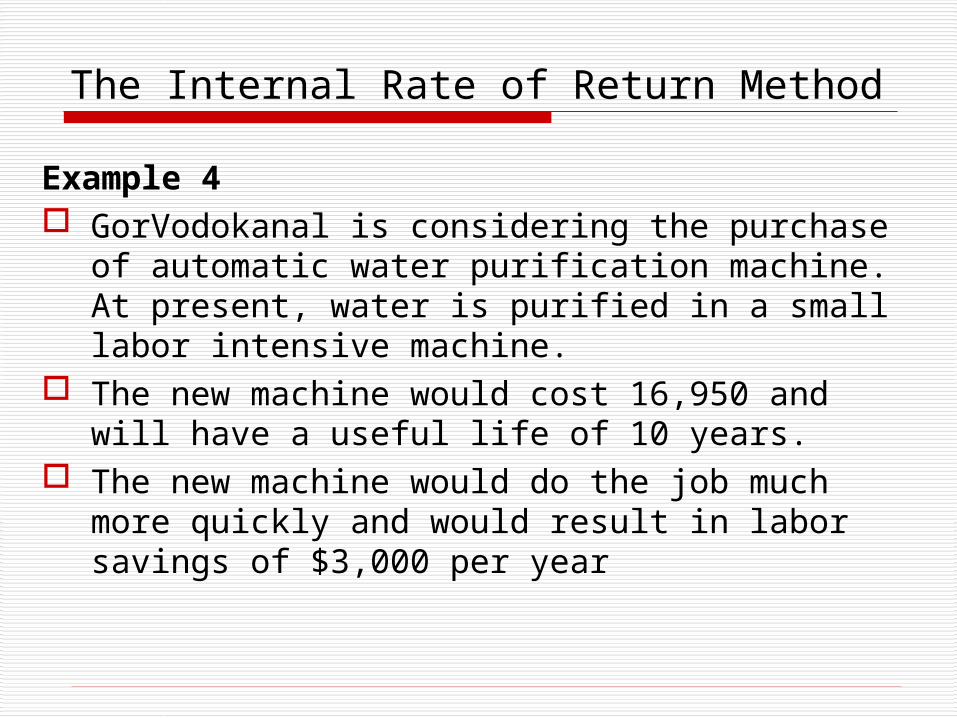
Example 4 GorVodokanal is considering the purchase of
automatic water purification machine. At present, water is purified in a small labor intensive machine.
The new machine would cost 16,950 and will have a useful life of 10 years.
The new machine would do the job much more quickly and would result in labor savings of $3,000 per year

The Internal Rate of Return Method
Initial cost $16,950
Life of the project (years) 10
Annual cost savings $3,000
Salvage value 0

The Internal Rate of Return Method
To compute IRR promised by the new machine, we must find the discount rate that will cause NPV of the project to be zero.
To do that, we need to divide the investment in the project by the expected net annual cash inflow. This computation will give us a factor from which the IRR can be determined.
Factor of the IRR =
Investment Required
=$16,950
= 5.65Net annual cash inflow
$3,000

The Internal Rate of Return Method
Thus, from our computations, the discount factor that will equate a series of $3,000 cash inflows with a present investment of $16,950 is 5.65.
Now, we need to find this factor in Present Value of an Annuity Table to see what rate of return it represents.
We should use the 10 period line in Present Value of an Annuity Table since the cash flows for the project continue for 10 years.

Present Value of an Annuity Table
Period 4% 5% 6% 8% 10% 12% 14%
1 0.962 0.952 0.943 0.926 0.909 0.893 0.877
2 1.886 1.859 1.833 1.783 1.736 1.69 1.647
3 2.775 2.723 2.673 2.577 2.487 2.402 2.322
4 3.63 3.546 3.465 3.312 3.17 3.037 2.914
5 4.452 4.212 4.212 2.993 3.791 3.605 3.433
6 5.242 5.076 4.917 4.623 4.355 4.111 3.889
7 6.002 5.786 5.582 5.206 4.868 4.564 4.288
8 6.733 6.463 6.21 5.747 5.335 4.968 4.639
9 7.435 7.108 6.802 6.247 5.759 5.323 4.946
10 8.111 7.722 7.36 6.71 6.145 5.650 5.216
11 8.76 8.306 7.887 7.139 6.495 5.988 5.453

The Internal Rate of Return Method
As we can see from Present Value of Annuity Table the internal rate of return promised by the water purification machine project is 12%.
We can verify this by computing the project’s net present value using a 12% discount return

The Internal Rate of Return Method
Item Year(s)
Amountof CashFlows
12%Factor
PresentValue ofCashFlows
Annual cost savings 1-10 $3,000 5,650* $16,950
Initial investment Now -16,950 1,000 -16,950
Net present value $0

The Internal Rate of Return Method
Once the IRR has been computed, what does the manager should do with the information?
The IRR should be compared to the company’s required rate of return, which is the minimum rate of return that an investment project must yield to be acceptable.
If the IRR is equal or greater than the required rate of return, then the project is acceptable.
If the IRR is less than the required rate of return, then the project is rejected.

The NPV of Return Method
The NPV method can be used to compare competing investment projects in two ways.
1. total-cost approach2. incremental-cost approach

The Total Cost Approach
Example 5 GorVodokanal has one of its pipe networks in
poor condition. This pipe network can be renovated at an immediate cost of $20,000. Further repairs and maintenance will be needed five years from now at a cost of $8,000. In all, this pipe network will be usable for 10 years if this work is done. At the end of 10 years, the pipe network will be scrapped at a salvage value of $6,000. The scrap value now is $7,000. It will cost $30,000 each year to operate pipe network, and revenues will total $40,000 annually

The Total Cost Approach
Alternative: GorVodokanal can purchase a new pipe network at a cost of $36,000. The new pipe network will have a life of 10 years and will require some repairs at the end of 5 years and will amount to $3,000. At the end of 10 years, it is estimated that the scrap value would be $6,000. It will cost $21,000 each year to operate the pipe network, and revenues will total $40,000 annually.
GorVodokanal requires a return of at least 18% on all investment capital.

The Total Cost Approach
New Pipe Network
Old Pipe Network
Annual revenues$40,000 $40,000
Annual cash operating costs21,000 30,000
Net annual cash inflows$19,000 $10,000

The Total Cost Approach
Item Year(s)
Amountof CashFlows
18%Factor*
PV ofCashFlows
Buy the new pipe network:
Initial investment Now ($36,000) 1.000 ($36,000)
Repairs in 5 years 5 ($3,000) 0.437 ($1,311)
Net annual cash inflows 1-10 19,000 4.494 85,386
Salvage of the old network Now 7,000 1.000 7,000
Salvage of the new network 10 6,000 0.191 1,146
Net present value $56,221

The Total Cost Approach
Item Year(s)
Amountof CashFlows
18%Factor*
PV ofCashFlows
Keep the old pipe network:
Initial repairs Now ($20,000) 1.000 ($20,000)
Repairs in five years 5 ($8,000) 0.437 ($3,494)
Net annual cash inflows 1-10 10,000 4.494 44,940
Salvage of the old network 10 6,000 0.191 1,146
Net present value $22,590
The Total Cost Approach
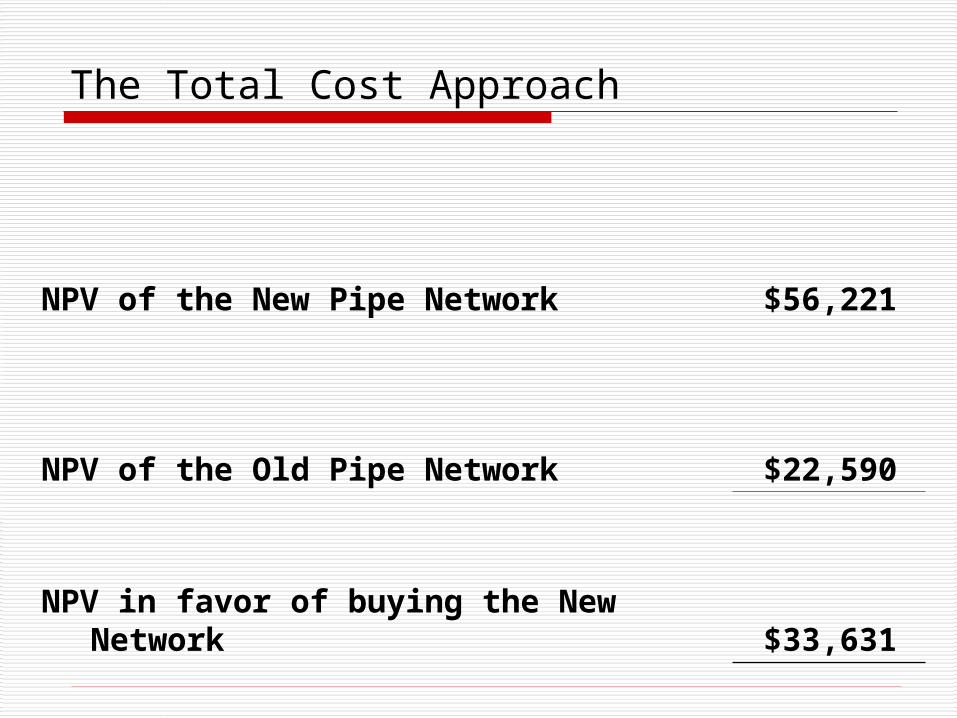
NPV of the New Pipe Network $56,221
NPV of the Old Pipe Network $22,590
NPV in favor of buying the New Network $33,631

The Incremental Cost Approach
When only two alternatives are being considered, the incremental cost approach offers a simpler and more direct decision.
Unlike the total cost approach, it focuses only on differential costs.

The Incremental Cost Approach
Item Year(s)
Amountof CashFlows
18%Factor*
PV ofCashFlows
Incremental investment requiredto purchase the new pipe network Now ($16,000) 1 ($16,000)
Repairs in five years avoided 5 $5,000 0.437 $2,185
Increased met annual cashinflows 1-10 $9,000 4.494 $40,000
Salvage of the old network Now 7,000 1 7,000
Difference in salvage value in 10 years 10 -0- - -0-
NPV in favor of buying the newNetwork 33,631

The Ranking of Investment Projects
When considering investment opportunities, managers must make two types of decisions:
1. screening, and2. preference decisions.
Screening decisions pertain whether or not proposed investments are acceptable.
Preference decisions come after screening decisions and attempt to rank selected projects in terms of preference.

The Ranking of Investment Projects
Internal rate of Return Method When using IRR to rank competitive investment
projects, the preference rule is: The higher the IRR, the more desirable the project.
For example, an investment project with an IRR of 18% is preferable to another project that promises a return of only 15%.

The Ranking of Investment Projects
Net Present Value Method
If the NPV method is used to rank projects, the NPV of one project cannot be compared directly to NPV of another project unless the investments in the projects are of equal size.

The Ranking of Investment Projects –NPV Method
Example 6
Investment
A B
Investment required ($80,000) ($5,000)
Present value of cash inflows 81,000 6,000
Net present value $1,000 $1,000

The Ranking of Investment Projects –NPV Method
Each project has a net present value of $1,000, but they are not equally desirable.
The project requiring an investment of only $5,000 is much more desirable (especially when funds are limited) than the project requiring $80.000.
However, there is a way to compare the two projects on a valid basis – its called Profitability Index.

The Ranking of Investment Projects –NPV Method
To calculate profitability index we need to divide the present value of all cash inflows by the investment required.
The formula for profitability index is:
Profitability index
=
Present value of cash inflows
Investment required

The Ranking of Investment Projects –NPV Method
Investment
A B
Present value of cash inflows (a) $81,000 $6,000
Investment required (b) $80,000 $5,000
Profitability index (a)/(b) 1.01 1.20

Other Approaches to Capital Budgeting Decisions
1.The Payback Method2.The Simple Rate of Return

The Payback Method
The payback method centers on a spam of time known as the payback period.
The payback period is the length of time until the sum of an investment’s cash flows equals its cost.
The payback period rule is to take a project if its payback is less than some prespecified number of years.
The payback period is a flawed criterion, primarily because it ignores risk, the time value of money, and cash flows beyond the cutoff point.

The Payback Method
Example 7
GorVodokanal needs a new piece of equipment and considers two machines: machine A and Machine B.
Machine A costs $15,000 and will reduce operating costs by $5,000 per year.
Machine B costs $12,000 and will also reduce operating costs by $5,000 per year
Which Machine should be purchased?

The Payback Method
Payback period =Investment Required
Net annual cash inflow
Machine APayback period
=$15,000
= 3.0 years$5,000
Machine Bpayback period
=$12,000
= 2.4 years$5,000
GorVodokanal should purchase machine B, since it has a shorter payback period than A.

Evaluation of the Payback Method
The payback method is not a true measure of the profitability of an investment.
Managers should not make investment decisions based on this method alone. Instead it should be used as a screening tool to determine which projects are worth further consideration.

Evaluation of the Payback Method
Payback method does not take into account differences between useful lives between investments.
Furthermore, payback method does not consider the time value of money. A cash inflow to be received several years in the future is weighed equally with a cash inflow received today.