international centre for integrated mountain development kathmandu, nepal emission inventory of...
TRANSCRIPT

International Centre for Integrated Mountain Development
Kathmandu, Nepal
Emission Inventory
of Nepal for the Year 2005

Hanimaadu
Anuradaphura
Abadan
Port Canning Sundarban
Geliphu
Narowal
Chitwan
Male’ Monitoring Stations
Regional Network
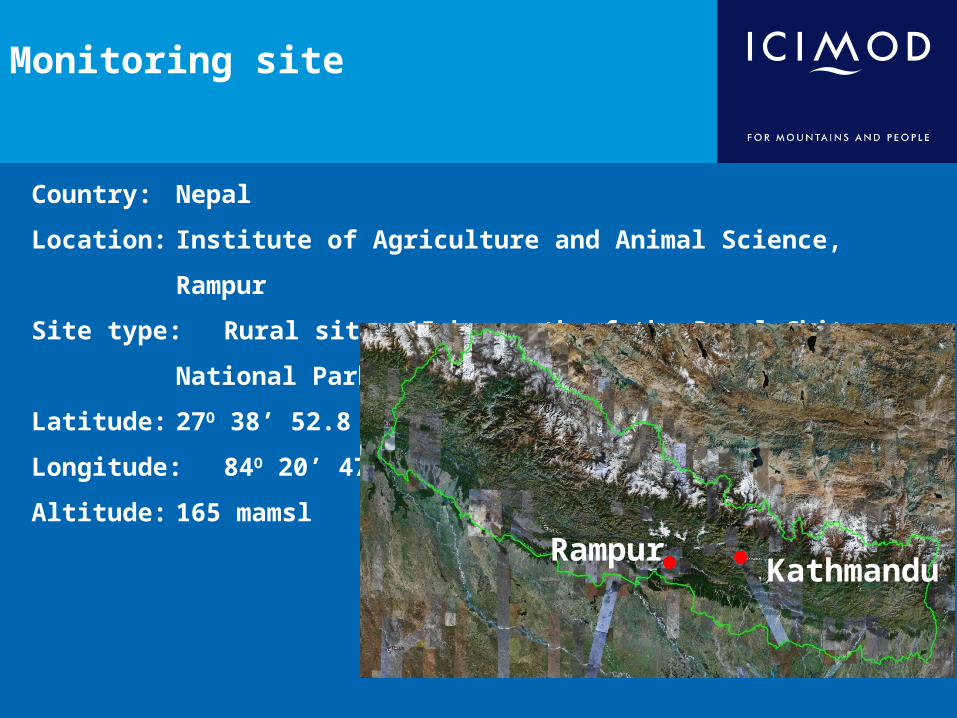
Country: Nepal
Location: Institute of Agriculture and Animal Science, Rampur
Site type: Rural site, 15 km south of the Royal Chitwan National Park
Latitude: 27O 38’ 52.8” N
Longitude: 84O 20’ 47.7” E
Altitude: 165 mamsl
Monitoring site
RampurKathmandu

Instruments
Passive Sample
High Volume Sampler
WS
Wet Only Collector
Bulk Collector
Laboratory

Impact studies Under Male’ Declaration Project

Material Exposed:
Carbon Steel, zinc steel, Copper, Coated steel and lime stone
Corrosion study in Kathmandu
Passive Samples:SO2 NO2 O3 HNO3 PM10

Results

Field –layout
EDU and Non-EDU treated Plant
Impact of Ambient Ozone Concentrations on Crop with the use of Ethylendiurea (EDU)

Results

Rapid Urban AssessmentKathmandu
• prepared the concentration maps of selected pollutants (SO2, NOX, CO, NMVOC, NH3, PM10 and PM2.5) in Kathmandu
• find out the hotspot areas in Kathmandu

Total Emission of the Pollutant of Kathmandu
Application of Emission Inventory

Health Impact Assessment
• Field study Completed

Emission Inventory of Nepal for the Year 2000 and 2005

Emission Inventory of Nepal for the Year 2005

Data Used
Activity data was collected from:• Statistical Year Book of Nepal 2006-07• Economic Survey of Nepal 2006-07• Environment year Book of Nepal 2008• IEA and FAO datasets • Some other sources available on internet• Different institution and Personal communication

CO Emission form different sectors

NH3 Emission form different sectors

MNVOC Emission form different sectors
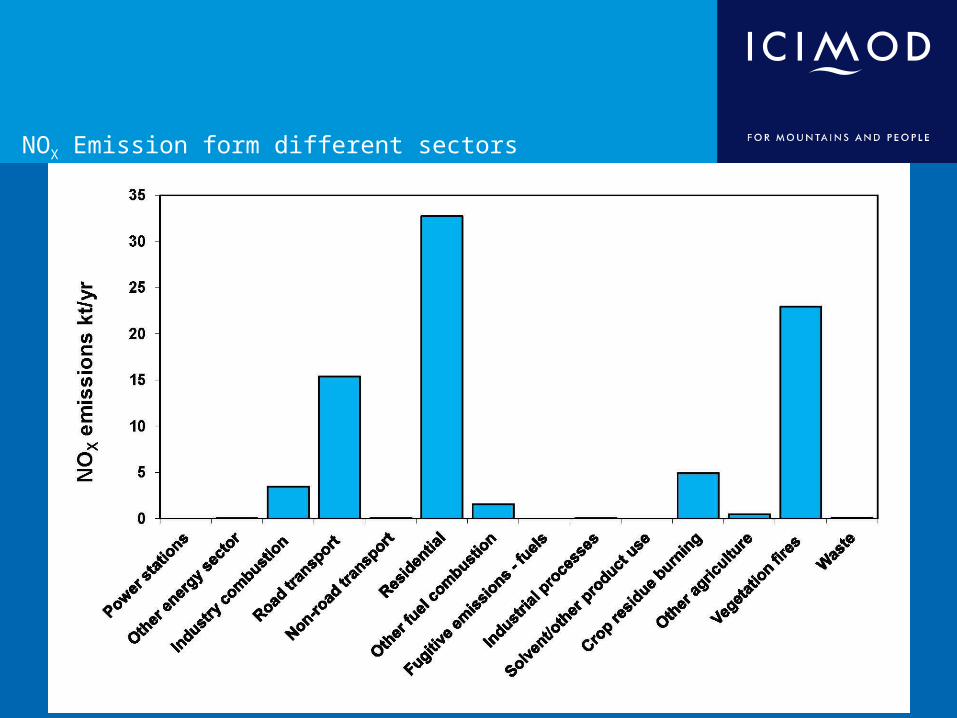
NOX Emission form different sectors
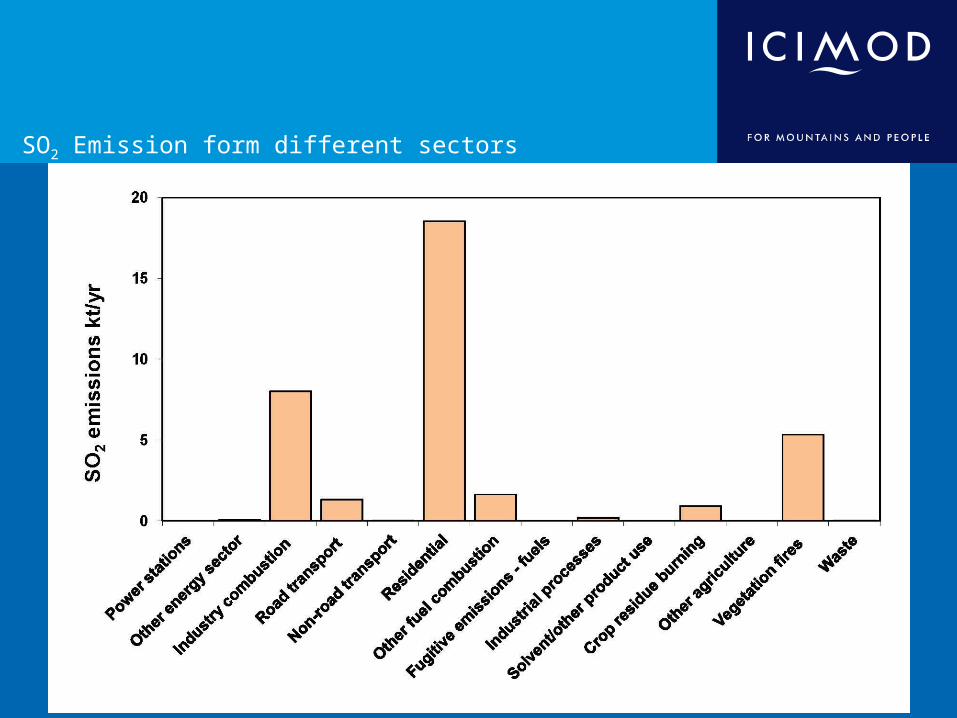
SO2 Emission form different sectors

PM10 Emission form different sectors
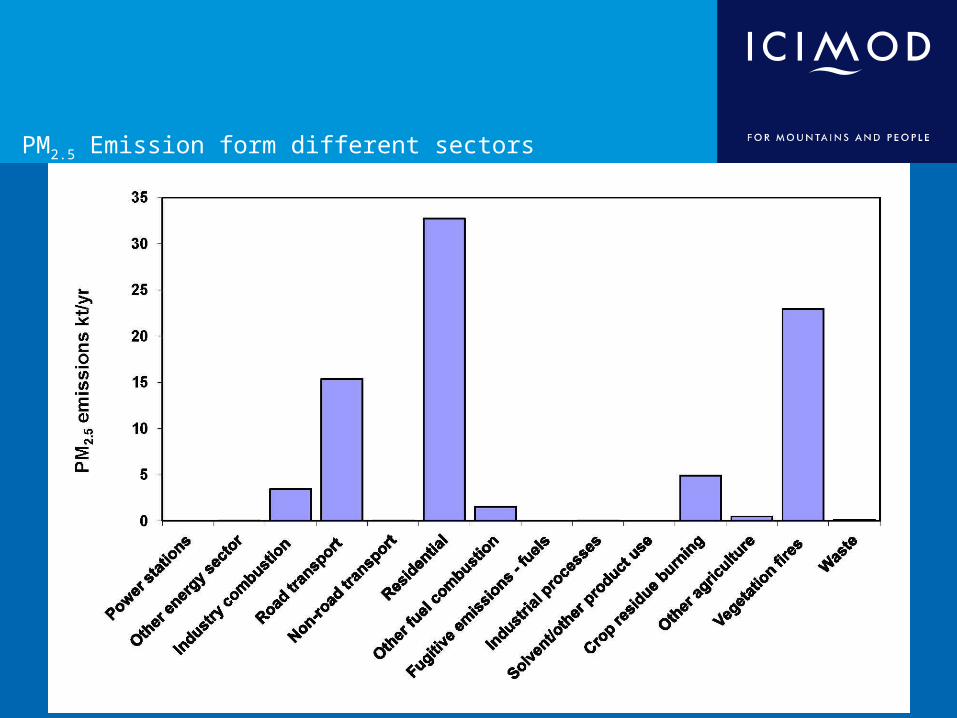
PM2.5 Emission form different sectors
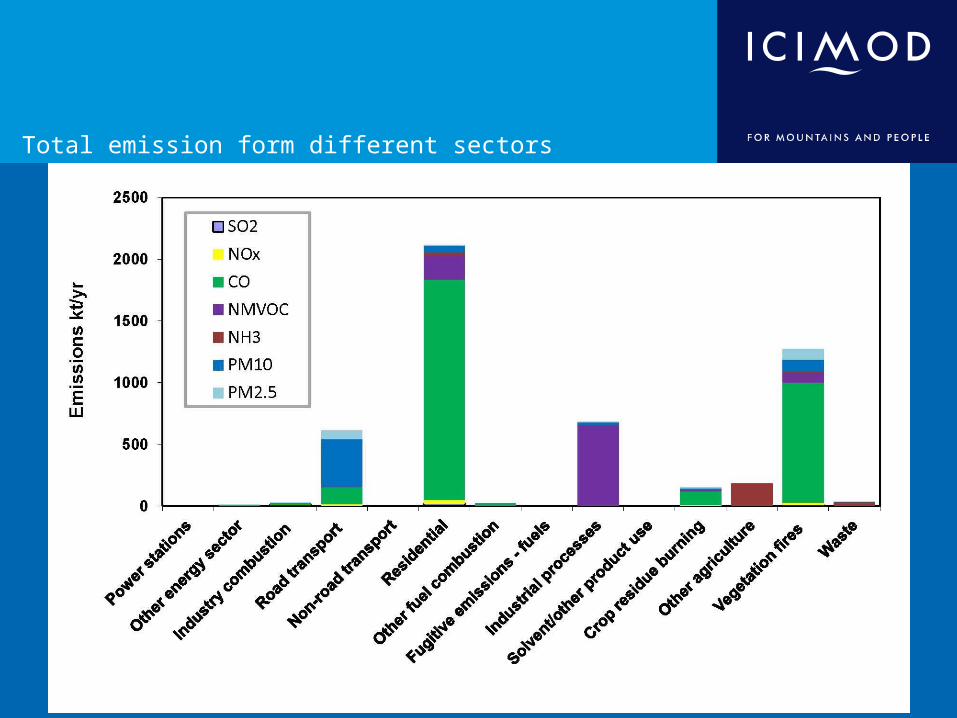
Total emission form different sectors

1 Waste burn data
2 Vehicle – Distance Travel
3 Burning of Forest/ Grass land
4 Lack of relevant activity data. The data available is not in proper format.
5 Process (non combustion) emission from the producing NMVOC emission from Bread factory Emission from Solvent and other products others
Unavailable Datasets

1. Dataset in the scattered for• Difficulty in collection• Difficulty in comparison
2. Dataset are poor and lack uniformity which might result in inaccurate analysis and results
3. Frequent changes of the responsible officers
Challenges

Conclusions
• The major pollutants emitted from different sources are CO, NH3, PM and NMVOC..
• The major source of CO are residential, vegetation fire and transportation.
• Where as PM is mainly emitted from the transport sector.
• Maximum emission of NH3 is from Agriculture sector due to excessive use of N-containing fertilizers and manure management.
• NMVOC is mainly from Industrial process and resident sector
Data collection under progress for year 2010
Emission Inventory

Thank you
Mr. Harry Vallack, SEI, York
UNEP RRC-AP, Bangkok Thailand
Sri lankan team
Acknowledgements