international currency markets - purdue agriculture
TRANSCRIPT

Purdue University Cooperative Extension Service is an equal access/equal opportunity institution.
July 2017
Jason HendersonDirector of Purdue ExtensionAssociate Dean College of Agriculturewww.extension.purdue.edu
International Currency Markets

Purdue University Cooperative Extension Service is an equal access/equal opportunity institution.
The U.S. Dollar Moves Due to …
70.0
80.0
90.0
100.0
110.0
120.0
130.0
140.0
Jan-
73
Jan-
77
Jan-
81
Jan-
85
Jan-
89
Jan-
93
Jan-
97
Jan-
01
Jan-
05
Jan-
09
Jan-
13
Jan-
17
Real Trade Weighted U.S. Dollar Index: Broad
Index Mar 1973=100
Source: Board of Governors Federal Reserve System
Trade
Financial Flows
Fear

Purdue University Cooperative Extension Service is an equal access/equal opportunity institution.
0.0
50.0
100.0
150.0
200.0
250.0
0.0
50.0
100.0
150.0
200.0
250.0
1912
1916
1920
1924
1928
1932
1936
1940
1944
1948
1952
1956
1960
1964
1968
1972
1976
1980
1984
1988
1992
1996
2000
2004
2008
2012
2016
F
U.S. Agriculture Value-Added and Net Farm Income(Three-Year Moving Average)
Value Added Net Farm Income
Billions (2016 constant dollars)
International Trade is a Key Driver of Agricultural Cycles
World War I Russian Grain DealWorld War IIChina & Ethanol
Calculations based on USDA data deflated with Consumer Price Index

Purdue University Cooperative Extension Service is an equal access/equal opportunity institution.
1970s/1980s U.S. Ag Exports
1972 $ 53.9 billion
1981 $114.1 billion
1986 $ 57.3 billion
2000s/2010s U.S. Ag Exports
2005 $ 77.5 billion
2014 $151.8 billion
2016 $133.7 billionNote: Export value data presented in 2016 constant dollarsSource: USDA
Note: Export value data presented in 2016 constant dollarsSource: USDA
1910s/1920s U.S. Foodstuff Exports
1910 $ 9.5 billion
1920 $24.3 billion
1936 $ 3.5 billionNote: Export value data presented in 2016 constant dollarsSource: Census Bureau, Historical Statistics of the United States
1940s/1950s U.S. Ag Exports
1940 $ 8.9 billion
1947 $ 42.4 billion
1953 $ 25.5 billionNote: Export value data presented in 2016 constant dollarsSource: USDA
Global Trade and Policy Shapes Farm Incomes

Purdue University Cooperative Extension Service is an equal access/equal opportunity institution.
Trade

Purdue University Cooperative Extension Service is an equal access/equal opportunity institution.
U.S. Dollar Fundamentals: Trade
• Strong demand for goods and services supports a strong dollar
-900.0-800.0-700.0-600.0-500.0-400.0-300.0-200.0-100.0
0.0100.0
Jan-
47
Jan-
52
Jan-
57
Jan-
62
Jan-
67
Jan-
72
Jan-
77
Jan-
82
Jan-
87
Jan-
92
Jan-
97
Jan-
02
Jan-
07
Jan-
12
Jan-
17
U.S. Trade Deficit(Exports minus Imports)
Billions of Chained 2009 Dollars
Source: U.S. Bureau of Economic Analysis
Purdue University Cooperative Extension Service is an equal access/equal opportunity institution.
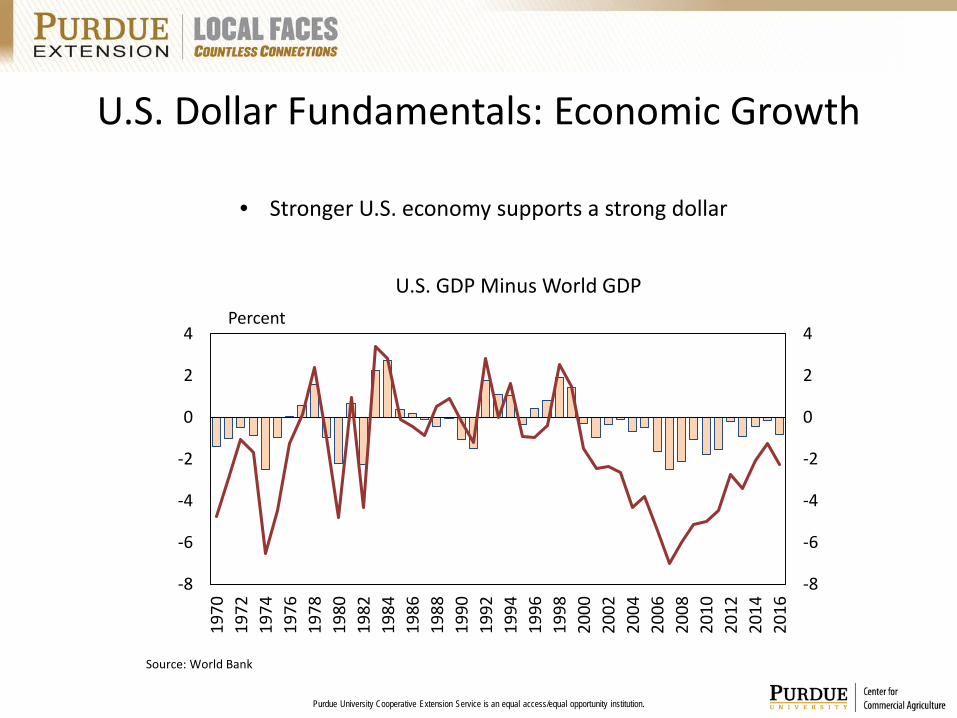
U.S. Dollar Fundamentals: Economic Growth
• Stronger U.S. economy supports a strong dollar
-8
-6
-4
-2
0
2
4
-8
-6
-4
-2
0
2
4
1970
1972
1974
1976
1978
1980
1982
1984
1986
1988
1990
1992
1994
1996
1998
2000
2002
2004
2006
2008
2010
2012
2014
2016
U.S. GDP Minus World GDPPercent
Source: World Bank

Purdue University Cooperative Extension Service is an equal access/equal opportunity institution.
The U.S. Dollar Moves Due to … Financial Flows
70.0
80.0
90.0
100.0
110.0
120.0
130.0
140.0
Jan-
73
Jan-
77
Jan-
81
Jan-
85
Jan-
89
Jan-
93
Jan-
97
Jan-
01
Jan-
05
Jan-
09
Jan-
13
Jan-
17
Real Trade Weighted U.S. Dollar Index: Broad
Index Mar 1973=100
Source: Board of Governors Federal Reserve System
1981 to 1985: High US Interest Rates
Stronger Economy
1997 to 2001:Asian Financial Crisis
Stronger Economy
2015 to 2017:Higher Interest Rates
Stronger economy

Purdue University Cooperative Extension Service is an equal access/equal opportunity institution.
Financial Flows

Purdue University Cooperative Extension Service is an equal access/equal opportunity institution.
Financial Flows are More Dominant than Ever
-10000
-8000
-6000
-4000
-2000
0
2000
1976 1981 1986 1991 1996 2001 2006 2011 2016
U.S. Net International Investment Position (Asset Minus Liabilities)
Billions of 2016 Dollars
Source: U.S. Bureau of Economic Analysis
Assets: US purchasesLiabilities: Foreign purchases

Purdue University Cooperative Extension Service is an equal access/equal opportunity institution.
Financial Flows are More Dominant than Ever
1976-1980
1990-1994
2012-2016
Exports 315.3 730.8 2,072.4
Imports (367.2) (797.6) (2,548.2)
Net Exports
(51.9) (66.8) (476.1)
1976 -1980
1990-1994
2012-2016
Assets 1,567 4,886 24,228
Liabilities (1,227) (5,250) 30,877
Net Position
340 (275) (6,649)
Source: U.S. Bureau of Economic Analysis
Net Exports of Goods and Services(Billions of dollars)
Net International Investment Position(Billions of dollars)
Source: U.S. Bureau of Economic Analysis
Financial Flow are 10 Fold Export Activity

Purdue University Cooperative Extension Service is an equal access/equal opportunity institution.
Financial Flows (Equity, Debt, & Derivatives) Shifted with Financial Conditions
0
10
20
30
40
50
60
70
1982 1986 1990 1994 1998 2002 2006 2010 2014
U.S. International Positions - Assets
Equity Debt Derivatives
Percent

Purdue University Cooperative Extension Service is an equal access/equal opportunity institution.
Financial Flows (Equity, Debt, & Derivatives) Shifted with Financial Conditions
0
10
20
30
40
50
60
70
1982 1986 1990 1994 1998 2002 2006 2010 2014
U.S. International Positions - Liabilities
Equity Debt Derivatives
Percent

Purdue University Cooperative Extension Service is an equal access/equal opportunity institution.
Financial Flows (Equity, Debt, & Derivatives) Shifted with Financial Conditions
0
10
20
30
40
50
60
70
1976 1981 1986 1991 1996 2001 2006 2011 2016
U.S. International Positions - Asset
Direct Portfolio
Percent

Purdue University Cooperative Extension Service is an equal access/equal opportunity institution.
Is This Good for the U.S. Economy?
-10000
-8000
-6000
-4000
-2000
0
2000
1976 1981 1986 1991 1996 2001 2006 2011 2016
U.S. Net International Investment Position (Asset Minus Liabilities)
Billions of 2016 Dollars
Source: U.S. Bureau of Economic Analysis
Assets: US purchasesLiabilities: Foreign purchases

Purdue University Cooperative Extension Service is an equal access/equal opportunity institution.
Fear and Uncertainty

Purdue University Cooperative Extension Service is an equal access/equal opportunity institution.
Exchange Rates Move with Fear
Brazil: 2017
Brexit: 2017

Purdue University Cooperative Extension Service is an equal access/equal opportunity institution.
The Euro and Germany
0.00.20.40.60.81.01.21.41.61.8
1999
-01-
0119
99-0
9-01
2000
-05-
0120
01-0
1-01
2001
-09-
0120
02-0
5-01
2003
-01-
0120
03-0
9-01
2004
-05-
0120
05-0
1-01
2005
-09-
0120
06-0
5-01
2007
-01-
0120
07-0
9-01
2008
-05-
0120
09-0
1-01
2009
-09-
0120
10-0
5-01
2011
-01-
0120
11-0
9-01
2012
-05-
0120
13-0
1-01
2013
-09-
0120
14-0
5-01
2015
-01-
0120
15-0
9-01
2016
-05-
0120
17-0
1-01
Euro and Germany Exchange Rate with US
Germany Euro
Foreign currency to US dollar ratio
Source: Board of Governors Federal Reserve System

Purdue University Cooperative Extension Service is an equal access/equal opportunity institution.
Interest Rates and Exchange Rates

Purdue University Cooperative Extension Service is an equal access/equal opportunity institution.
Interest Rate Movements Drive Financial Flows
-1.00
0.00
1.00
2.00
3.00
4.00
5.00
6.00
Yields on 10-Year Bonds
Germany Great Britian Japan US
Percent
Source: Board of Governors Federal Reserve System

Purdue University Cooperative Extension Service is an equal access/equal opportunity institution.
0.0
0.5
1.0
1.5
2.0
2.5
3.0
3.5
4.0
4.5
2015 2016 2017 2018 2019 2020
Fed Funds RatesMidpoint of target range
Source: Federal Reserve Board of Governors
Longer Run
How will the Fed Normalize Rates?

Purdue University Cooperative Extension Service is an equal access/equal opportunity institution.
The Next Step in Normalization: Shrinking the Balance Sheet
0
500
1000
1500
2000
2500
3000
3500
4000
4500
5000
Fed Agency Debt MBS
Liquidity to Key CreditMarkets
Lending to FinancialInstitutions
Long-Term Treasuries
Traditional SecurityHoldings
Billions of dollars
Federal Reserve Balance Sheet: Assets
Source: Federal Reserve Bank of Cleveland

Purdue University Cooperative Extension Service is an equal access/equal opportunity institution.
What Drives Interest Rates Higher?
Too much money
chasing
too few goods

Purdue University Cooperative Extension Service is an equal access/equal opportunity institution.
The U.S. is Expected to Lead the Rebound
Area 2016 2017 2018
World 3.1 3.4 3.6
Advanced 1.6 1.9 2.0
US 1.6 2.3 2.5
Euro Area 1.7 1.6 1.6
EMDE 4.1 4.5 4.8
China 6.7 6.5 6.0
India 6.6 7.2 7.7
Russia -0.6 1.1 1.2
Latin America -0.7 1.2 2.1
Source: International Monetary Fund, January 2017

Purdue University Cooperative Extension Service is an equal access/equal opportunity institution.
Will Demographics be the Trigger?
– Millennial spending: Homes, cars, families …– Boomer spending: Retirement, health care …
Percent change per yearU.S. Population Growth
-1.00
0.00
1.00
2.00
3.00
4.00
25 to 44 year olds 45 to 64 year olds 65 years or overCalculations based on U.S. Census data

Purdue University Cooperative Extension Service is an equal access/equal opportunity institution.
Slower Labor Force Growth is Expected to Trim Potential GDP
US Potential GDP(Average Annual Growth)
Source: Congressional Budget Office
1950 -1973
1974-1981
1982-1990
1991-2001
2002-2007
2008-2014
2015-2025
Potential GDP 4.0 3.3 3.2 3.2 2.8 1.4 1.8
Potential Labor Force 1.6 2.5 1.6 1.3 0.9 0.5 0.5
PotentialLabor Force Productivity
2.4 0.8 1.6 1.9 1.9 0.9 1.3
Lower Potential GDP Suggests Inflation Rises at Lower Growth Rates.

Purdue University Cooperative Extension Service is an equal access/equal opportunity institution.
Policy Implications

Purdue University Cooperative Extension Service is an equal access/equal opportunity institution.
Ag Export Destinations are Different than Manufactured Export Destinations
Country Share
(1) China 16.7%
(2) Canada 15.0%
(3) Mexico 13.1%
(4) Japan 8.7%
(5) Korea, South 4.3%
Country Share
(1) Canada 19.3%
(2) Mexico 15.5%
(3) China 6.4%
(4) Japan 4.1%
(5) United Kingdom 3.4%
Country Share
(1) Canada 33.7%
(2) Mexico 13.4%
(3) Germany 5.2%
(4) Japan 5.0%
(5) France 4.2%
U.S. Ag Exports(2012-2016)
U.S. Manufactured Exports(2012-2016)
IN Manufactured Exports(2012-2016)
Source: USDA Source: International Trade Admin. Source: International Trade Admin.
Will Trade Policy Reflect Ag Interests?

Purdue University Cooperative Extension Service is an equal access/equal opportunity institution.
0.0
20.0
40.0
60.0
80.0
100.0
120.0
0.0
20.0
40.0
60.0
80.0
100.0
120.0
1976
1978
1980
1982
1984
1986
1988
1990
1992
1994
1996
1998
2000
2002
2004
2006
2008
2010
2012
2014
2016
U.S. Agricultural Exports
High-Value Bulk
Billions (2016 constant dollars)
Calculations based on USDA data deflated with Consumer Price Index
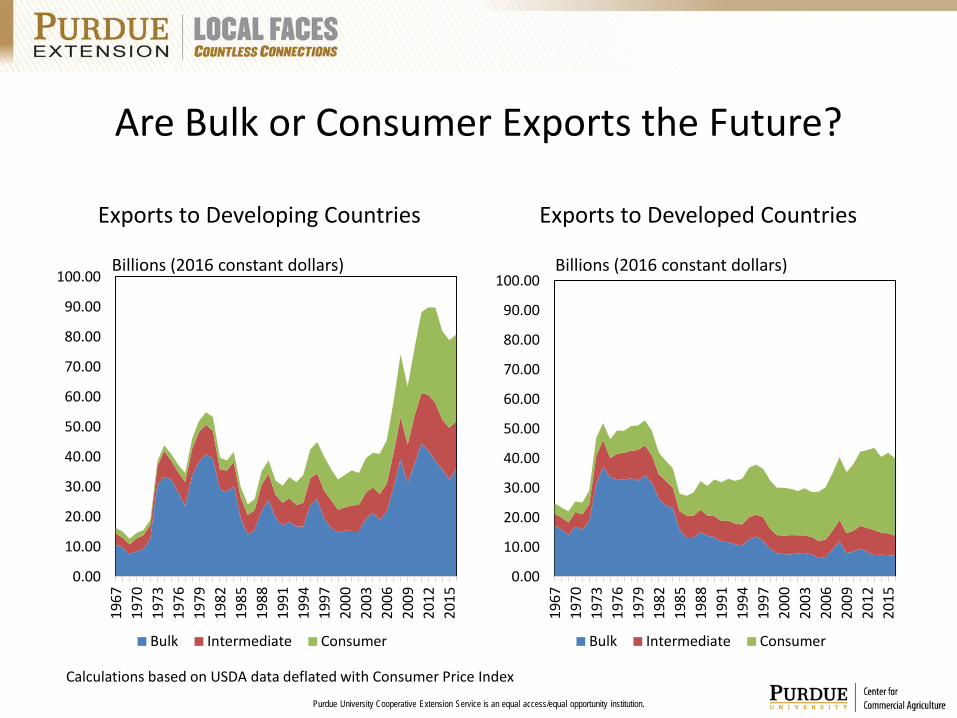
Are Bulk or Consumer Exports the Future?
Purdue University Cooperative Extension Service is an equal access/equal opportunity institution.
Are Bulk or Consumer Exports the Future?
0.00
10.00
20.00
30.00
40.00
50.00
60.00
70.00
80.00
90.00
100.00
1967
1970
1973
1976
1979
1982
1985
1988
1991
1994
1997
2000
2003
2006
2009
2012
2015
Exports to Developing Countries
Bulk Intermediate Consumer
0.00
10.00
20.00
30.00
40.00
50.00
60.00
70.00
80.00
90.00
100.00
1967
1970
1973
1976
1979
1982
1985
1988
1991
1994
1997
2000
2003
2006
2009
2012
2015
Exports to Developed Countries
Bulk Intermediate Consumer
Billions (2016 constant dollars) Billions (2016 constant dollars)
Calculations based on USDA data deflated with Consumer Price Index

Purdue University Cooperative Extension Service is an equal access/equal opportunity institution.
Policy Implications for Agriculture:When Do Multinational Companies Buy US?
Strong Dollar Weak Dollar
When is U.S. currency strong?
When do multinationals want to repatriate funds?

Purdue University Cooperative Extension Service is an equal access/equal opportunity institution.
When will the Exchange Rate Environment Change?
• China: a Consumer or a Producer Driven Economy?
• What about other developing nations?
Consumers
Strong Currency
Producers
Weak Currency

Purdue University Cooperative Extension Service is an equal access/equal opportunity institution.
Conclusions
• Currency markets and trade are important for ag• Financial flows and fear/uncertainty are more
important drivers of currency markets
• Strong economic growth, high returns, and stability drive a strong dollar.
• A strong dollar might be with us for some time.