international energy outlook 2018 (ieo2018) - eia.gov · • energy consumption in the non-oecd...
TRANSCRIPT
www.eia.govU.S. Energy Information Administration Independent Statistics & Analysis
International Energy Outlook 2018 (IEO2018)
forCenter for Strategic and International StudiesJuly 24, 2018 | Washington, DC
byDr. Linda Capuano, AdministratorU.S. Energy Information Administration
• Energy consumption in the non-OECD countries began to exceed OECD consumption in 2007 and is projected to reach nearly two-thirds of the 739 quadrillion Btu global energy consumption in 2040
• The world’s energy consumption through 2040 increases, on average, for all fuels in the IEO2018 Reference case
• The IEO2018 side cases show higher economic growth drives increasing energy consumption, while services or manufacturing pathways to growth modulate that consumption
• Per capita energy consumption in India and Africa remain comparatively low despite high economic growth in the IEO2018 side cases
• IEO2018 side cases highlight the need to further explore the relationship between high economic growth, relative sizes of the services and manufacturing sectors, and energy consumption
Dr. Linda Capuano, CSIS IEO2018, July 2018
Key takeaways
2
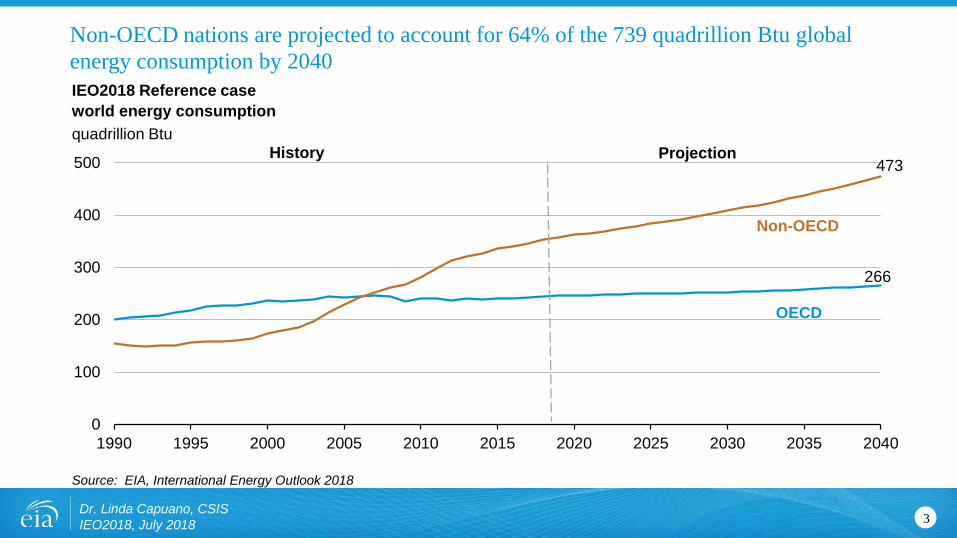
266
473
0
100
200
300
400
500
1990 1995 2000 2005 2010 2015 2020 2025 2030 2035 2040
Non-OECD
OECD
Source: EIA, International Energy Outlook 2018
Dr. Linda Capuano, CSIS IEO2018, July 2018
Non-OECD nations are projected to account for 64% of the 739 quadrillion Btu global energy consumption by 2040IEO2018 Reference caseworld energy consumptionquadrillion Btu
3
ProjectionHistory
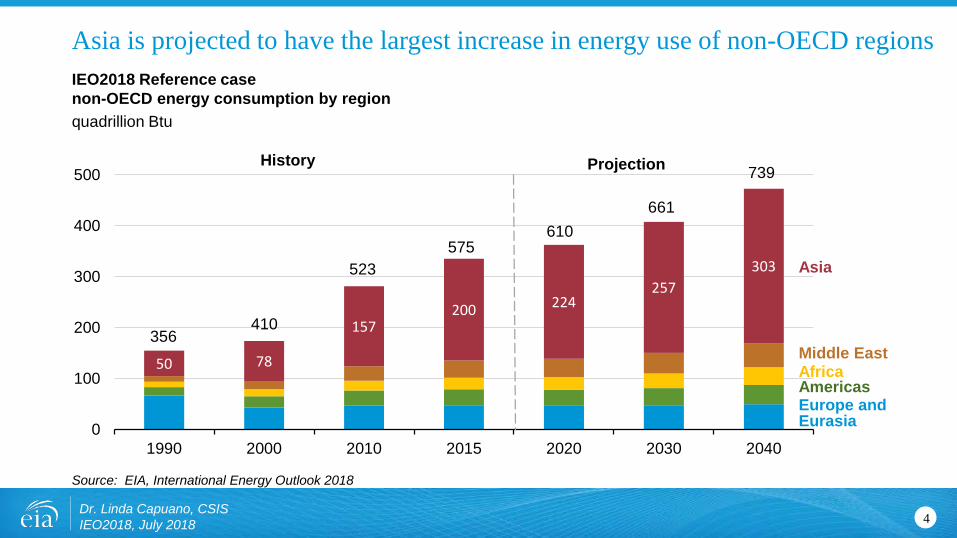
50 78
157200 224
257303
0
100
200
300
400
500
1990 2000 2010 2015 2020 2030 2040
Africa
Source: EIA, International Energy Outlook 2018
Dr. Linda Capuano, CSIS IEO2018, July 2018
Asia is projected to have the largest increase in energy use of non-OECD regionsIEO2018 Reference casenon-OECD energy consumption by regionquadrillion Btu
4
Asia
Middle East
AmericasEurope andEurasia
History Projection
356410
523575
610661
739

1.7%
0.4%
1.5%
1.6%
2.0%
2.1%
2.3%
2.4%
0% 2% 4% 6%
Total OECD
Japan
OECD Europe
Canada
South Korea
United States
Mexico/Chile
Australia/New Zealand
4.1%
1.4%
1.6%
2.4%
2.5%
3.1%
3.8%
4.2%
4.5%
6.0%
0% 2% 4% 6%
Total Non-OECD
Russia
Brazil
Other Americas
Other Europe/Eurasia
Middle East
Africa
Other Asia
China
India
IEO2018 Reference caseaverage annual percent change in real GDP by region, 2015–40
Source: EIA, International Energy Outlook 2018
Many non-OECD countries are projected to lead global economic growth
Dr. Linda Capuano, CSIS IEO2018, July 2018 5
OECD Non-OECD
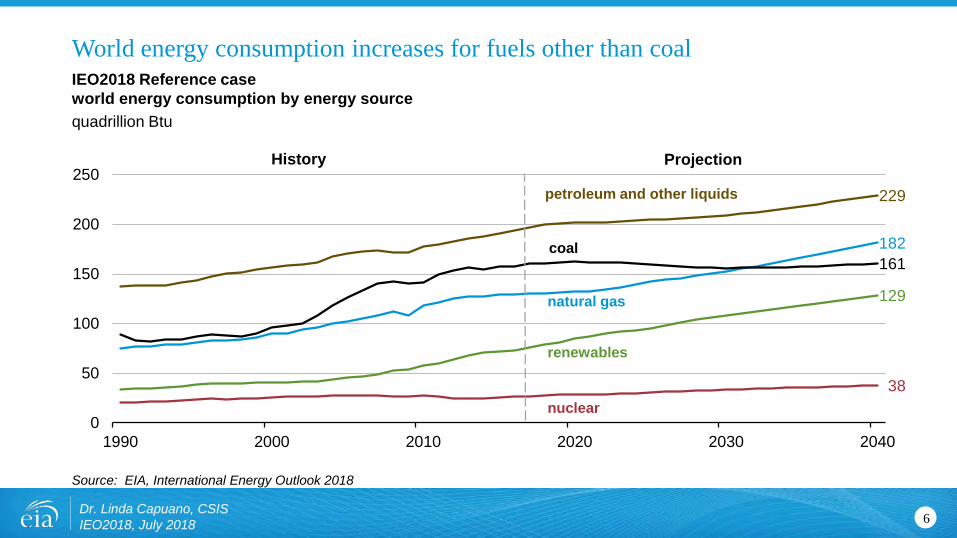
229
182161
38
129
0
50
100
150
200
250
1990 2000 2010 2020 2030 2040
ProjectionHistory
petroleum and other liquids
coal
natural gas
renewables
nuclear
Source: EIA, International Energy Outlook 2018
Dr. Linda Capuano, CSIS IEO2018, July 2018
World energy consumption increases for fuels other than coalIEO2018 Reference case world energy consumption by energy sourcequadrillion Btu
6
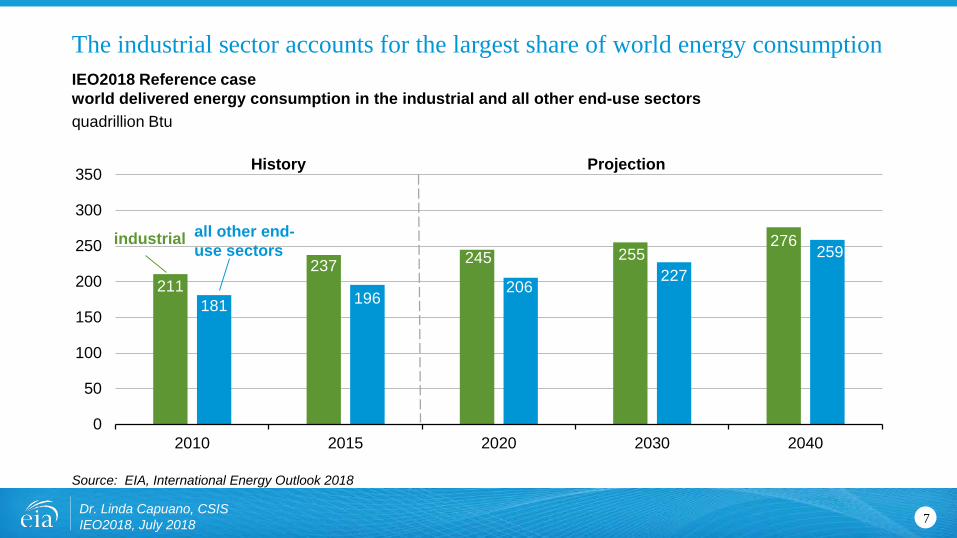
211237 245 255
276
181 196206
227259
0
50
100
150
200
250
300
350
2010 2015 2020 2030 2040
industrial all other end-use sectors
Source: EIA, International Energy Outlook 2018
Dr. Linda Capuano, CSIS IEO2018, July 2018
The industrial sector accounts for the largest share of world energy consumptionIEO2018 Reference caseworld delivered energy consumption in the industrial and all other end-use sectorsquadrillion Btu
7
History Projection
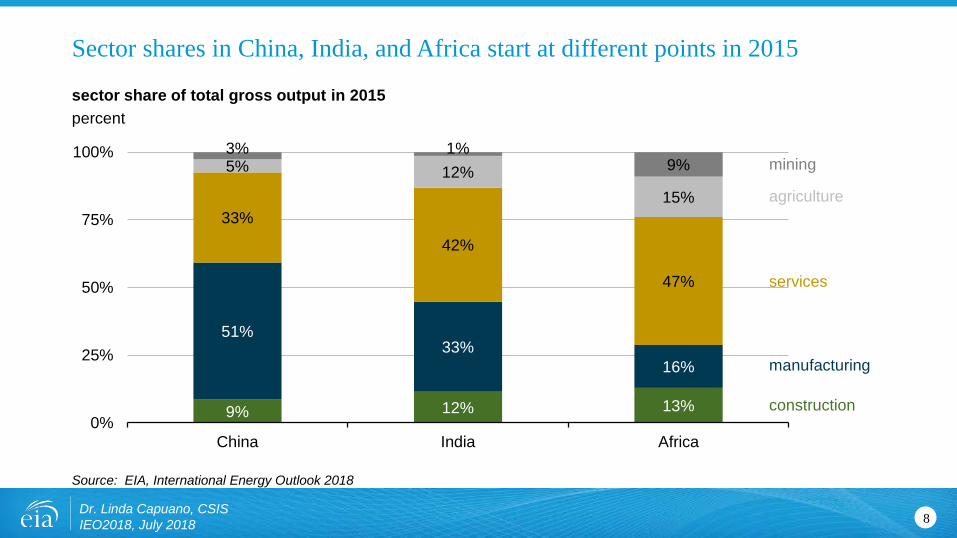
9% 12% 13%
51%33%
16%
33%
42%
47%
5% 12%15%
3% 1%9%
0%
25%
50%
75%
100%
China India Africa
mining
agriculture
services
manufacturing
construction
Source: EIA, International Energy Outlook 2018
Dr. Linda Capuano, CSIS IEO2018, July 2018
Sector shares in China, India, and Africa start at different points in 2015
sector share of total gross output in 2015percent
8
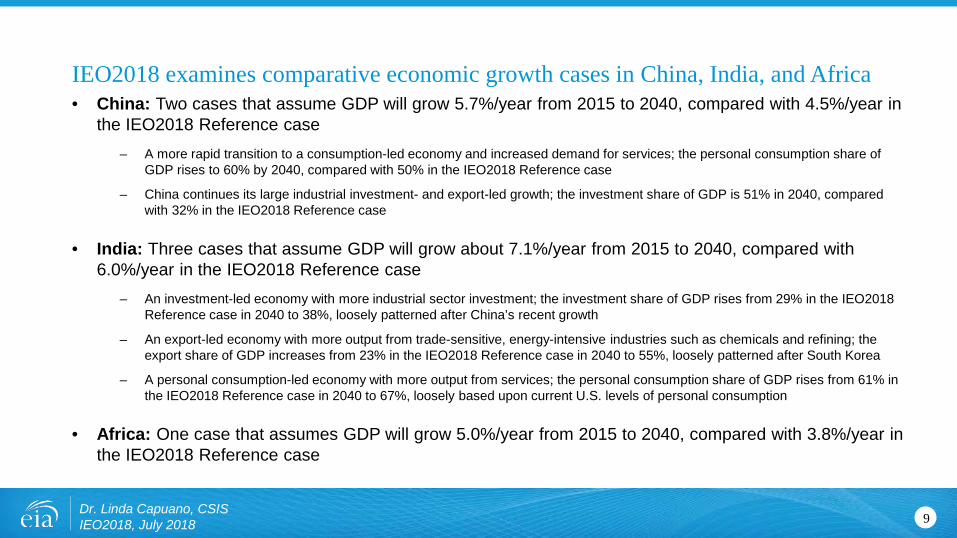
• China: Two cases that assume GDP will grow 5.7%/year from 2015 to 2040, compared with 4.5%/year in the IEO2018 Reference case
– A more rapid transition to a consumption-led economy and increased demand for services; the personal consumption share of GDP rises to 60% by 2040, compared with 50% in the IEO2018 Reference case
– China continues its large industrial investment- and export-led growth; the investment share of GDP is 51% in 2040, compared with 32% in the IEO2018 Reference case
• India: Three cases that assume GDP will grow about 7.1%/year from 2015 to 2040, compared with 6.0%/year in the IEO2018 Reference case
– An investment-led economy with more industrial sector investment; the investment share of GDP rises from 29% in the IEO2018 Reference case in 2040 to 38%, loosely patterned after China’s recent growth
– An export-led economy with more output from trade-sensitive, energy-intensive industries such as chemicals and refining; the export share of GDP increases from 23% in the IEO2018 Reference case in 2040 to 55%, loosely patterned after South Korea
– A personal consumption-led economy with more output from services; the personal consumption share of GDP rises from 61% in the IEO2018 Reference case in 2040 to 67%, loosely based upon current U.S. levels of personal consumption
• Africa: One case that assumes GDP will grow 5.0%/year from 2015 to 2040, compared with 3.8%/year in the IEO2018 Reference case
Dr. Linda Capuano, CSIS IEO2018, July 2018
IEO2018 examines comparative economic growth cases in China, India, and Africa
9
Source: EIA, International Energy Outlook 2018
Dr. Linda Capuano, CSIS IEO2018, July 2018
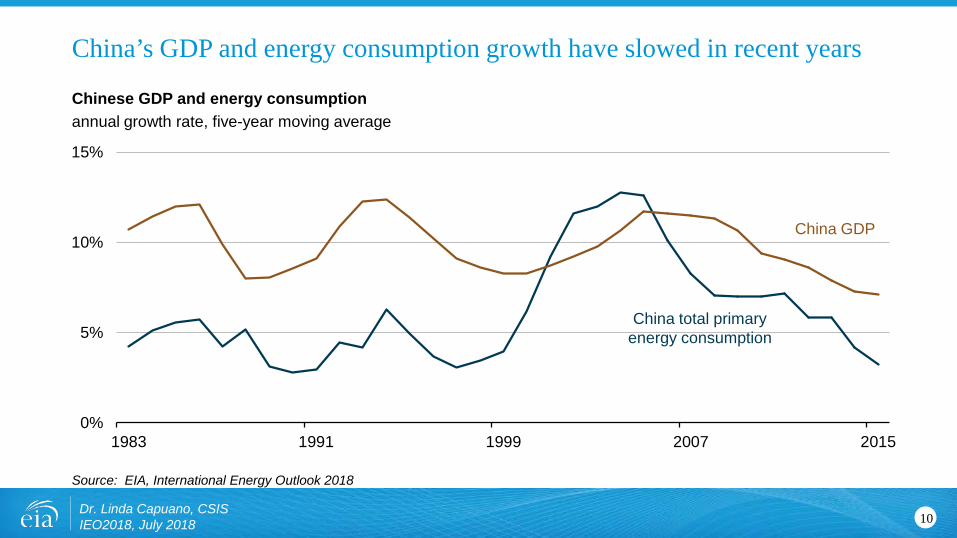
China’s GDP and energy consumption growth have slowed in recent years
Chinese GDP and energy consumptionannual growth rate, five-year moving average
10
0%
5%
10%
15%
1983 1991 1999 2007 2015
China GDP
China total primary energy consumption
Source: EIA, International Energy Outlook 2018
Dr. Linda Capuano, CSIS IEO2018, July 2018
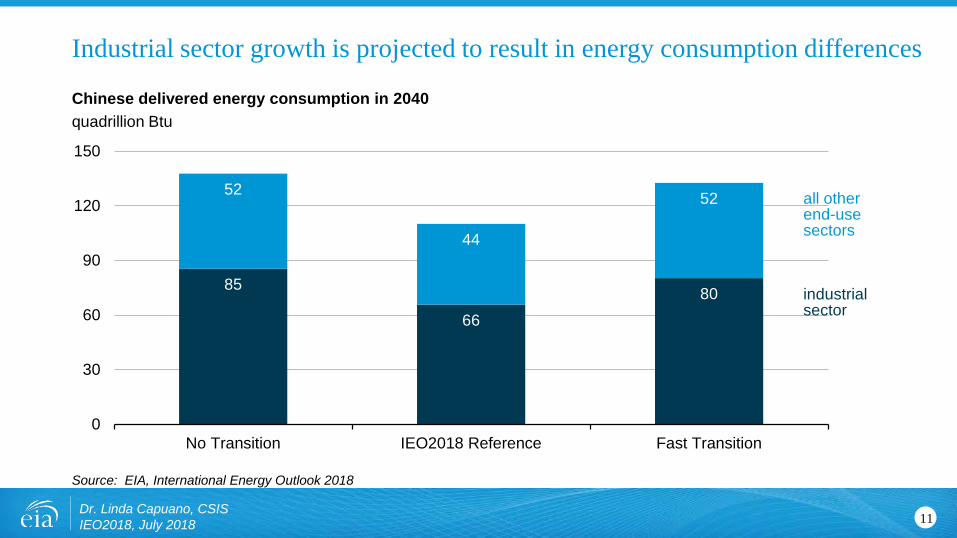
Industrial sector growth is projected to result in energy consumption differences
Chinese delivered energy consumption in 2040quadrillion Btu
11
85
6680
52
44
52
0
30
60
90
120
150
No Transition IEO2018 Reference Fast Transition
all other end-usesectors
industrialsector
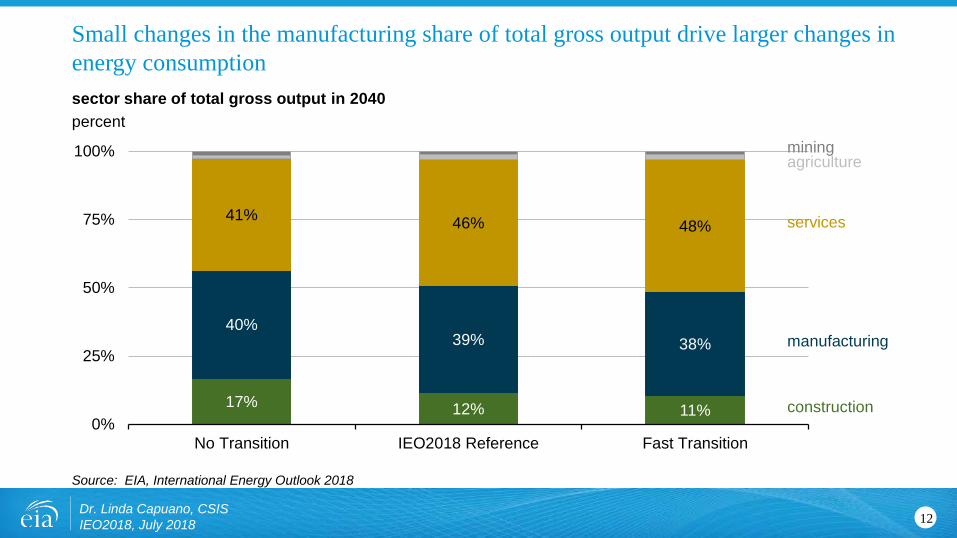
17% 12% 11%
40%39% 38%
41% 46% 48%
0%
25%
50%
75%
100%
No Transition IEO2018 Reference Fast Transition
miningagriculture
services
manufacturing
construction
Source: EIA, International Energy Outlook 2018
Dr. Linda Capuano, CSIS IEO2018, July 2018
Small changes in the manufacturing share of total gross output drive larger changes in energy consumptionsector share of total gross output in 2040percent
12

Source: EIA, International Energy Outlook 2018
Dr. Linda Capuano, CSIS IEO2018, July 2018
China’s economic growth in the side cases leads to gains in its share of global energy-intensive goods productionregion share of global energy-intensive sector gross output in 2040percent
13
41% 35% 40%
15%16% 16%
10% 11% 11%7% 8% 7%7% 7% 7%
20% 22% 20%
0%
25%
50%
75%
100%
No Transition IEO2018 Reference Fast Transition
Rest of World
United StatesMiddle East
other non-OECD Asia
India
China
Source: EIA, International Energy Outlook 2018
Dr. Linda Capuano, CSIS IEO2018, July 2018
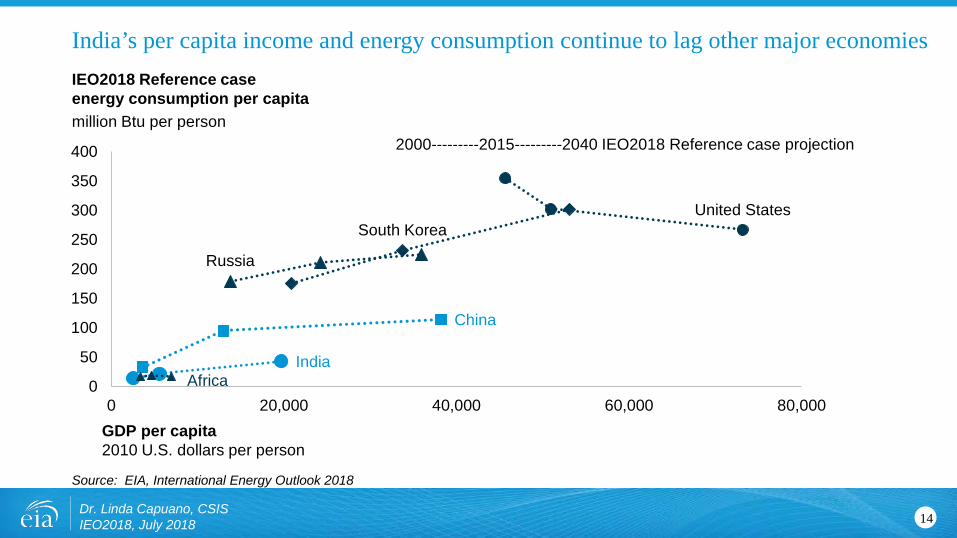
India’s per capita income and energy consumption continue to lag other major economiesIEO2018 Reference case energy consumption per capitamillion Btu per person
2000---------2015---------2040 IEO2018 Reference case projection
14
China
India
Russia
South KoreaUnited States
0
50
100
150
200
250
300
350
400
0 20,000 40,000 60,000 80,000GDP per capita2010 U.S. dollars per person
Africa
Source: EIA, International Energy Outlook 2018
Dr. Linda Capuano, CSIS IEO2018, July 2018
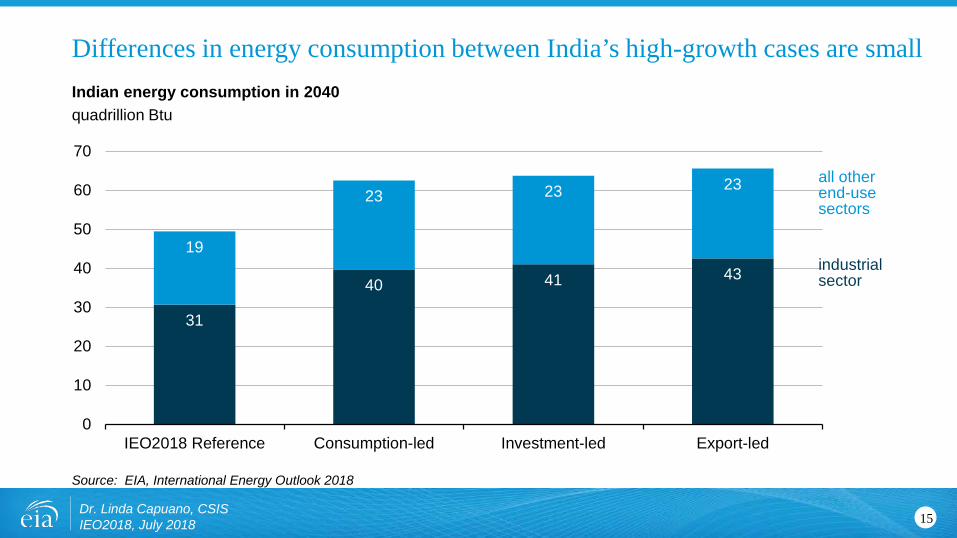
Differences in energy consumption between India’s high-growth cases are smallIndian energy consumption in 2040quadrillion Btu
15
31
40 41 43
19
23 23 23
0
10
20
30
40
50
60
70
IEO2018 Reference Consumption-led Investment-led Export-led
all otherend-usesectors
industrialsector
Source: EIA, International Energy Outlook 2018
Dr. Linda Capuano, CSIS IEO2018, July 2018
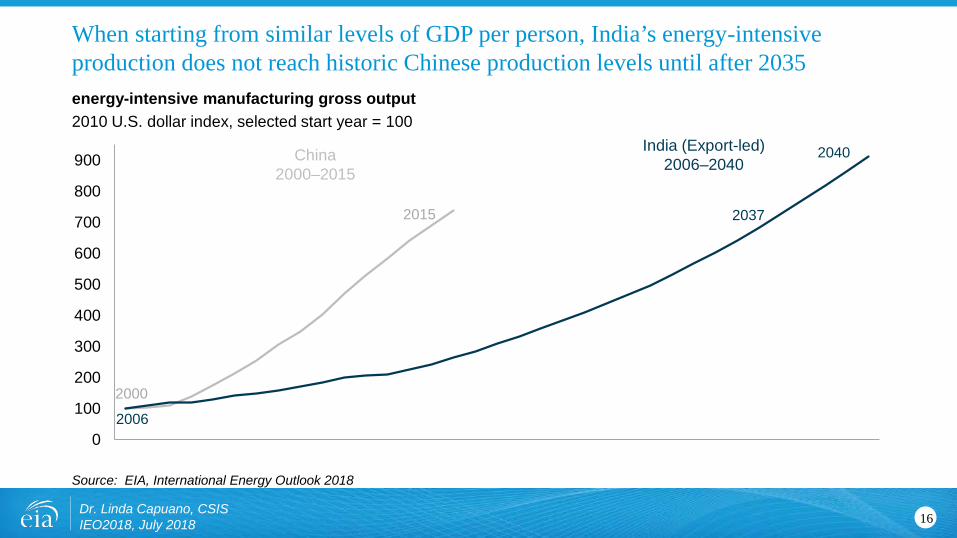
When starting from similar levels of GDP per person, India’s energy-intensive production does not reach historic Chinese production levels until after 2035energy-intensive manufacturing gross output2010 U.S. dollar index, selected start year = 100
16
0
100
200
300
400
500
600
700
800
900 China2000–2015
India (Export-led)2006–2040
2006
2000
2015
2040
2037
Source: IHS Markit and Oxford Economics
Dr. Linda Capuano, CSIS IEO2018, July 2018
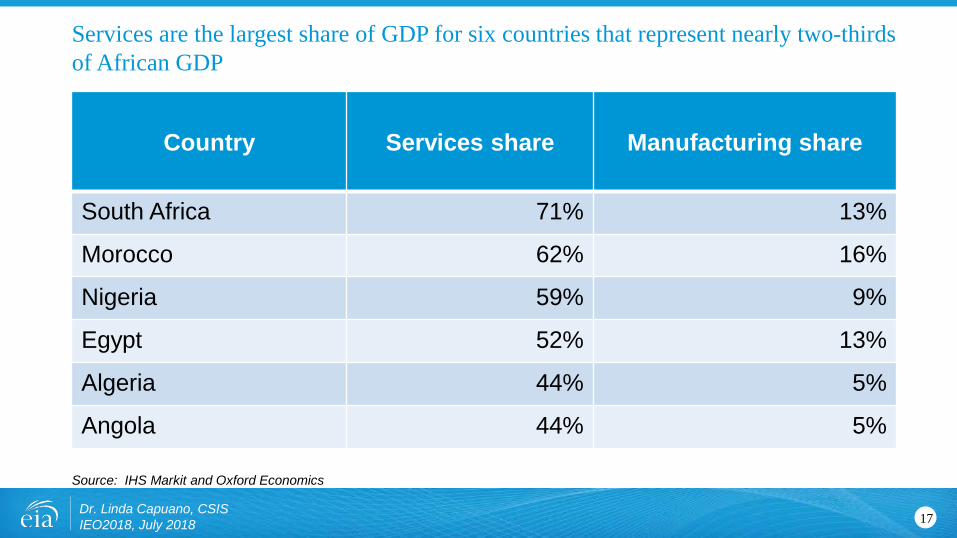
Services are the largest share of GDP for six countries that represent nearly two-thirds of African GDP
17
Country Services share Manufacturing share
South Africa 71% 13%
Morocco 62% 16%
Nigeria 59% 9%
Egypt 52% 13%
Algeria 44% 5%
Angola 44% 5%
Source: EIA, International Energy Outlook 2018
Dr. Linda Capuano, CSIS IEO2018, July 2018
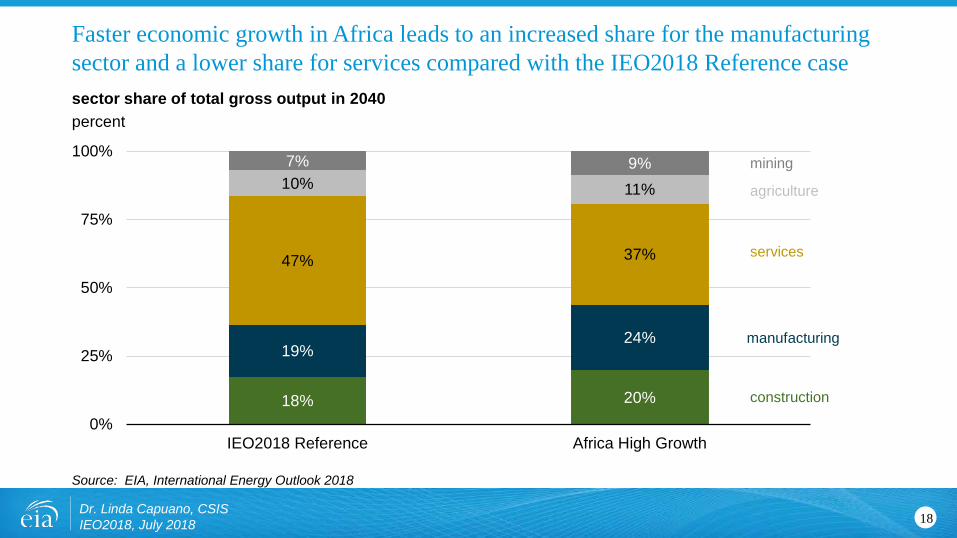
Faster economic growth in Africa leads to an increased share for the manufacturing sector and a lower share for services compared with the IEO2018 Reference casesector share of total gross output in 2040percent
18
18% 20%
19%24%
47% 37%
10% 11%
7% 9%
0%
25%
50%
75%
100%
IEO2018 Reference Africa High Growth
mining
services
construction
agriculture
manufacturing
Source: EIA, International Energy Outlook 2018
Dr. Linda Capuano, CSIS IEO2018, July 2018
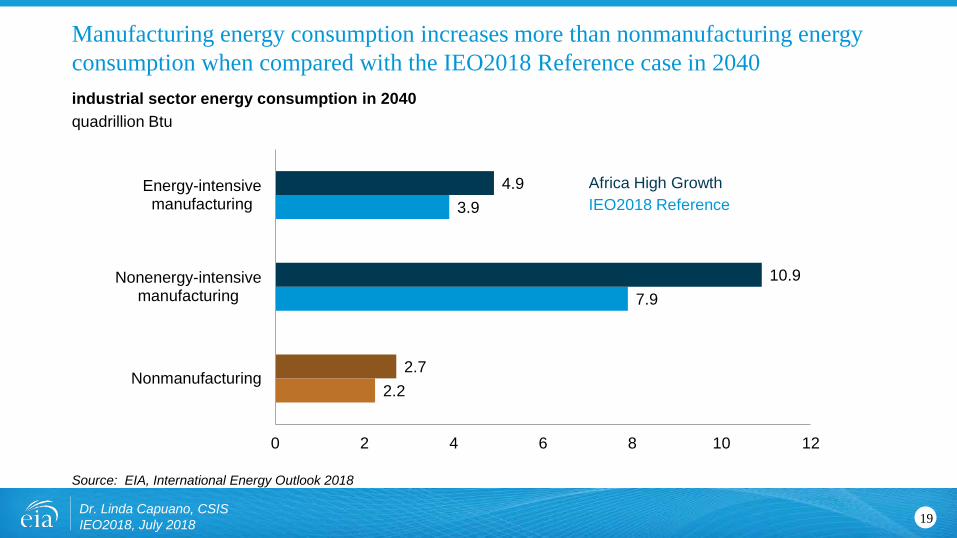
Manufacturing energy consumption increases more than nonmanufacturing energy consumption when compared with the IEO2018 Reference case in 2040industrial sector energy consumption in 2040quadrillion Btu
19
2.2
7.9
3.9
2.7
10.9
4.9
0 2 4 6 8 10 12
Nonmanufacturing
Nonenergy-intensivemanufacturing
Energy-intensivemanufacturing
Africa High GrowthIEO2018 Reference

• What is surprising?
• What is expected?
• What are your insights?
• Which topics would you explore more deeply?
Dr. Linda Capuano, CSIS IEO2018, July 2018
Key IEO2018 questions for panelists
20
U.S. Energy Information Administration home page | www.eia.gov
International Energy Outlook | www.eia.gov/ieo
Short-Term Energy Outlook | www.eia.gov/steo
Annual Energy Outlook | www.eia.gov/aeo
International Energy Statistics database | www.eia.gov/ies
To receive emails about releases related to the International Energy Outlook or other EIA publications, please subscribe at https://www.eia.gov/tools/emailupdates/.
Dr. Linda Capuano, CSIS IEO2018, July 2018
For more information
21