international family tracing - microsoft · pdf file51% of all ift uasc cases are for ... 4...
TRANSCRIPT
International Family Tracing
National Overview Report 2013 - 2015 March 2016 Susy Heighway

International Family Tracing - National Overview Report 2016
1
Contents
GLOSSARY .................................................................................................................................... 2
EXECUTIVE SUMMARY ................................................................................................................. 4
INTRODUCTION ............................................................................................................................. 8
1. WHICH COMMUNITIES HAVE RFL NEEDS AND WHAT ARE THEIR CHARACTERISTICS? .... 9
1.1 National Trends ........................................................................................................................ 9
1.2 Asylum Seekers & Refugees ..................................................................................................12
1.3 Unaccompanied and Separated Children ..............................................................................14
1.4 Detainees in Immigration Removal Centres...........................................................................16
1.5 Conflict ....................................................................................................................................19
1.6 World War Two ........................................................................................................................19
1.7 Disaster ...................................................................................................................................20
1.8 Other Potential Service Users ................................................................................................21
1.8.1 Irregular Migrants ...........................................................................................................21
1.8.2 Foreign National Prisoners (FNP) ..................................................................................22
1.8.3 Countries at Risk ............................................................................................................ 23
2. AWARENESS & BARRIERS ......................................................................................................24
3. ‘SUCCESS’ RATES ....................................................................................................................25
CONCLUSION ................................................................................................................................26
RECOMMENDATIONS & ACTIONS ...............................................................................................28
APPENDIX 1 ..................................................................................................................................34
APPENDIX 2 ..................................................................................................................................35

International Family Tracing - National Overview Report 2016
2
Glossary
IFT International Family Tracing
RFL Restoring Family Links
Charter The International Family Tracing database in which cases are created,
stored and updated.
BRM The Beneficiary Relationship Management database in which Refugee
Support cases are created, stored and updated. (At the time of writing this
report BRM is used only by Refugee Support and not by IFT.)
Case When a tracing enquiry, Red Cross message or attestation request is
formally entered on Charter it becomes a Case. Each person will be given
one unique case number, even if they are requesting more than one
service. For example a person opening two tracing enquiries and one Red
Cross message will have just one case number for all three enquiries.
Looking at case numbers shows the number of unique people using our
service, but would not show all the instances of different service types, or
information on different sought people against one case.
Slice When a person has more than one enquiry against a Case on Charter
these show as separate ‘slices’. For example a person opening two
tracing enquiries and one Red Cross message would have one case
number and three ‘slices’. Slices also allow us to look at the number of
sought people per tracing case. So if there were 5 sought people for one
case this could be shown as 5 slices.
Enquirer The person whom we are opening the case for. They may be looking for
someone, want to send a Red Cross message, or may have an attestation
request.
Sought Person The person that is being looked for in a tracing case.
Outgoing Case Enquirer is in the UK.
Incoming Case Enquirer is in another country and sought person is in the UK.
RCM Red Cross Message
UASC Unaccompanied and Separated Children (<18) Please note this is not to
be confused with the Home Office terminology of UASC as
Unaccompanied Asylum Seeking Children. Within this report UASC will
only refer to asylum seeking children when used to reference Home Office
immigration statistics.

International Family Tracing - National Overview Report 2016
3
Migration Where people become separated at the point of leaving the country of
origin.
Dispersal Where people become separated having left the country of origin together.
Disaster Cases Cases marked on charter as ‘Disaster’ include natural disasters (such as
earthquakes, hurricanes etc.) as well as boat disasters (migrant boats).
IRC Immigration Removal Centre
People Assisted The number of individual people assisted in an immigration removal
centre. Assistance to detainees is defined as a visit or phone call. This is
recorded on an Internal Report Form (IRF) which is recorded on Charter.
This figure would not take into account the number of different times one
person has been assisted.
Contacts/IRF The number of contacts we have had with an individual in an IRC and an
Internal Report Form (IRF) has been completed. This could be a phone
call or a visit and is not necessarily regarding an IFT service.
FNP Foreign National Prisoners
Section 95 Asylum Seekers can apply for support under Section 95 of the Support
Immigration and Asylum Act 1999 whilst they await a decision on their
application. Under Section 95 they can receive accommodation only
(where they are allocated accommodation in a dispersal area) or
subsistence only (where they receive cash to support themselves) or both.
‘Looked After’ Children In UK law children in care are referred to as ‘looked after
children’. A child is ‘looked after’ if they are in the care of the local
authority for more than 24 hours.

International Family Tracing - National Overview Report 2016
4
Executive Summary
This report uses IFT caseload data (2013 - 2015) and secondary sources to identify existing
and potential needs for the IFT service. It also summarises the findings of local Area Needs
Assessments that have been conducted by Areas between 2011 and 2015. The findings
presented in this executive summary provide information on:
The communities identified as having RFL needs and their characteristics, including
nationality and geographic location within the UK. (1.1 – 1.8)
The level of awareness and understanding of the service, including barriers to the
service and recommendations for overcoming these. (2)
The number of successful cases 2013 – 2015 as an indicator of current capacity and to
assist in key messaging and managing beneficiary expectations. (3)
1.1 NATIONAL IFT TRENDS
2013 – 2015:
The service is growing with a 17% increase in the number of cases opened.
Attestation cases fell by 52%.
3,320 individual people opened cases with enquirers from over 100 nationalities.
88% of all cases were tracing (Total: 34871).
There was a significant increase in the number of cases opened for Eritreans. The
number of cases opened for Syrians, Ethiopians and Vietnamese also increased.
The Midlands and to the North of the UK are seeing the greatest increase in cases.
2015:
Cases with an Afghan enquirer accounted for nearly 40% or all cases.
Sri Lankans were the highest user of the attestation service.
1.2 ASYLUM SEEKERS & REFUGEES
Sudanese and Pakistani are nationalities in both the top ten of Refugee Support cases
and asylum applications for 2015 but not for IFT cases suggesting a potential need
within these communities. In addition Nigerian and Zimbabwean are in the top ten of
Refugee Support cases and Albanian, Bangladeshi and Indian in the top ten of asylum
applications but none are in the top ten of IFT cases.2
Sudanese, Iraqis and Afghans saw significant increases for Refugee Support cases or
asylum applications but not for IFT cases opened 2013 – 20152.
The UK spread of IFT cases is reflective of higher levels of service use in Areas that
have initial accommodation centres and in asylum seeker dispersal hot spots3.
1.3 UNACCOMPANIED AND SEPARATED CHILDREN (UASC)4
UASC IFT cases have increased by 52% 2013-2015 and accounted for 1 in 5 of all
cases in 2015 (19%).
51% of all IFT UASC cases are for 16-17 year olds and 14% are under 14 years old.
1 year old is the youngest age for an IFT UASC case opened in the last 3 years.5
There were significant increases in UASC asylum applications for Eritreans, Afghans,
Iraqis and Ethiopians 2013 – 20156.
1 Total cases when including service types is higher as individuals may use more than one service type per case number.
2 BRM Data 2015 & Home Office Immigration Statistics – Total Asylum Applications 2015
3 Home Office Immigration Statistics - Section 95 Support
4 UASC cases counted include outgoing where enquirer is UASC and incoming where SP is UASC.
5 Case 118955 –Incoming dispersal case for Afghan SP with year of birth 2013 and date case created 31.10.14.

International Family Tracing - National Overview Report 2016
5
The South East, Wales and Scotland have seen the largest increases in the number of
‘looked after’ unaccompanied asylum seeking children 2013-2015. These areas have
seen minimal or no increase in IFT outgoing cases7.
1.4 DETAINEES IN IMMIGRATION REMOVAL CENTRES (IRCs)
1 in 20 of all outgoing IFT cases 2013 – 2015 was opened for someone in detention.
(But only 3% of all cases when including incoming cases.)
We have assisted 652 individuals in detention (2013 - 2015) and 16% have opened a
case for at least one IFT service.
Home Office statistics show a significant increase in the number of Albanians, Iraqis,
Sudanese and Syrians entering detention 2013 – 20158.
The UK spread of ‘people assisted’ in detention reflects the location of IRCs. However
we have ‘seen’ a relatively small number of people in Yarl’s Wood, Morton Hall and
Dungavel House compared to the number of people entering detention in those centres
in 2015. Yarl’s Wood had the more people enter in 2015 than any other IRC8.
1.5 CONFLICT CASES
At least 41% of all cases opened in 2015 were due to separation as a result of conflict.
1 in 5 was also UASC and 10% of 2015 conflict cases were WWII.
The Central African Republic, Pakistan, Yemen, Mexico and Nigeria are all ranked in
the INFORM Global Index for Risk Management top ten for conflict, but not in the IFT
top ten of 2015 conflict cases9.
1.6 WORLD WAR TWO
IFT data reflects a declining need for this service with a 33% drop in the number of
cases opened (2013 – 2015).
Almost 1 in 20 of all cases opened in 2015 was WWII (4%).
For outgoing cases the majority of enquirers are aged 60 -79, for sought persons in
incoming cases the average age is older with the majority aged 80-99.
2011 Census data shows areas with the highest median ages are located close to the
south coast, including Devon, Torbay and Eastbourne, but also East Riding and
Worcestershire are ranked in the top ten10.
1.7 DISASTER CASES11
Just 2% of all cases opened 2013-2015 have been due to ‘disaster’.
In 2015 we opened 15 cases looking for 22 people.
The highest number of cases opened in the three year period for one disaster was
because of the Philippines Typhoon in 2013 (25 cases).
The top five countries currently most at risk from natural disaster according to the
INFORM Global Index for Risk Management are the Philippines, Bangladesh, Japan,
China and Myanmar9.
6 Home Office Immigration Statistics – Total UASC Asylum Applications 2015
7 England: Department for Education – Looked After Children Statistics. Scotland & Wales: Freedom of Information Request Total UASC 31
st
March 2015. No statistics provided for Northern Ireland. 8 Home Office Immigration Statistics – People Entering Detention 2015
9 INFORM Index for Risk Management – Released 14.12.16 v.0.2.7 - www.inform-index.org
10 Office for National Statistics - Annual Small Area Population Estimates, Mid-2014 | 25 November 2015 (using 2011 Census Data)
11 Cases marked on charter as ‘Disaster’ include natural disasters (such as earthquakes, hurricanes etc.) as well as boat disasters (migrant
boats).

International Family Tracing - National Overview Report 2016
6
1.8 OTHER POTENTIAL SERVICE USERS
Irregular Migrants – Victims of Trafficking12
3,266 potential victims were referred to the National Referral Mechanism in 2015. A
40% increase on 2014.
Albania, Vietnam and Nigeria remain the most common country of origin.
Sudan saw the highest percentage increase in referrals compared to the previous year.
England, Scotland and Northern Ireland all saw increases in referrals 2014 – 2015.
Wales saw the greatest percentage change with a 91% increase 2014 – 2015.
Foreign National Prisoners (FNP)
As at 31st December 2015 FNPs accounted for 12% of the prison population with a total
of 10,503 FNPs from 162 nationalities13.
Family contact has previously been raised by FNPs as one of the biggest problems they
face in prison (HM Inspectorate of Prisons 2007 follow up review)14.
The top 3 nationalities of FNPs at 31st December 2015 were Polish, Irish and Romanian.
However Albanian, Pakistani, Somali and Nigerian all featured in the top 1013.
The 2014 National Audit Office report shows FNPs are heavily concentrated in London
and the South-East15.
Countries At Risk
The top five countries currently most at risk from disaster (human & natural) according
to the INFORM Global Index for Risk management are Somalia, the Central African
Republic, Afghanistan, South Sudan and Yemen.16
2. AWARENESS & BARRIERS (Area Needs Assessments)
80% (16 out of 20) Areas have completed phases 1 and 2.
21 Area Needs Assessment reports have been completed from 2011 to 2015 with over
200 potential beneficiaries interviewed.
Awareness of the service, location of BRC offices and language were the main service
barriers identified.
Over 60 different ways to help overcome barriers to the service were raised in the
reports. The main recommendations were:
Increased promotion online (specifically social media), in radio and press
More local engagement with communities and referral organisations
Language and literacy considerations for marketing materials
Myth busting messaging
Introducing confidentiality statements
Offering off-site interviews (libraries)/assisting with travel costs
Recruiting volunteers/ambassadors with community links
12
National Crime Agency National Referral Mechanism Statistics End of Year Summary 2015. Published 11.02.16. 13
Ministry of Justice – Prison Population: 31December 2015 14
Source: International Family Tracing in Prisons, Literature Review and Scoping Interviews, Sep 2015 15
National Audit Office Report- Managing and removing foreign national offenders 22.10.14 16
Here the INFROM Risk has taken into account natural disaster, human conflict, vulnerability and lack of coping capacity. INFORM Index for Risk Management – Released 14.12.16 v.0.2.7 - www.inform-index.org

International Family Tracing - National Overview Report 2016
7
3. ‘SUCCESS’17
All successful cases 2013-2015, including cases opened pre-2013:
451 ‘successful’ tracing cases with 698 people found by the Red Cross.
In addition 339 ‘successful’ cases and 615 people found by ‘other channels’.
Successful cases including only where the case was opened between 2013 and 2015:
11% of all tracing cases opened in this three year period have been ‘successful’.
There were 327 successful’ tracing cases with 504 people found by the Red Cross.
In addition 275 ‘successful’ cases and 481 people found by ‘other channels’.
A successful trace is the main outcome of ‘successful’ cases – accounting for 63%. In
16% of cases the sought person had died and 7% wanted no contact with the enquirer.
Cases are more likely to be ‘successful’ in the first year they’re opened (Opened 2013:
Yr1 8%, Yr2 6%, Yr3 1%).
17
An IFT case is deemed successful when it is marked with a date found. Outcomes of successful cases include a successful trace, news of death and the sought person is found but no contact with the enquirer is wanted.
International Family Tracing - National Overview Report 2016
8
Introduction
As part of the Restoring Family Links (RFL) Strategy for the Movement 2008-201818, all
national societies are encouraged to carry out regular needs assessments.
The British Red Cross Corporate Plan 2010-2015 supports this work and over the last five
years Areas have been conducting local RFL needs assessments to varying degrees.
In addition the International Family Tracing (IFT) UK Office have developed an annual
National Overview Report highlighting main existing and potential RFL needs across the
country and summarising findings from the local Area needs assessments. This is the
National Overview Report 2016 which is assessing trends, information and data from 2013 -
2015.
Aims & Objectives
The aim of the report is:
1. To summarise the main trends and characteristics of communities in the UK with
potential and existing RFL needs.
2. To inform future research and outreach planning at both national and local levels.
These aims will be achieved by answering the following questions:
Which communities have RFL needs and what are their characteristics? (Section 1)
What is the level of awareness and understanding of IFT and of the Red Cross and Red
Crescent movement within communities of potential service users? (Section 2)
What barriers do communities face in accessing the service? (Section 2.2)
What are the potential ways to overcome any barriers? (Section 2.3)
Methodology
The report utilises IFT caseload data from 1st January 2013 to 31st December 2015 to
ascertain existing need for the service. Growing and potential need is also identified through
analysing trends and changes over the three year period.
In addition a number of secondary sources are utilised to draw comparisons. This enables
potential gaps in IFT service provision to be identified and additional need to be highlighted
for further research and consideration in outreach planning. These secondary sources
include British Red Cross Refugee Support data and Home Office Immigration Statistics.
To assess levels of awareness and potential barriers to the service information from Area
Needs Assessments has been collated. Area Needs Assessments were completed between
2011 and 2015 and the process included direct engagement with potential beneficiaries and
referral organisations through interviews and focus groups. These Area Needs
Assessments are the source of the recommendations for overcoming service barriers
included in this report.
18
https://www.icrc.org/eng/assets/files/other/icrc_002_0967.pdf

International Family Tracing - National Overview Report 2016
9
1. Which communities have RFL needs & what are their characteristics?
This section will summarise the main trends and characteristics of communities in the UK
with potential and existing RFL needs over the last three years, using IFT caseload data
(Charter) and secondary sources.
The communities explored in this section are
as follows and have been selected by
identifying:
1. Those that we can see have existing
need through current caseload data.
2. Those with potential need identified
using a combination of secondary
sources and the parameters of the
service (people separated by conflict,
disaster or migration).
1.1 National Trends
This section will look at top line trends of the service 2013 - 2015 to build a picture of how IFT services are currently being used (existing need). It will also begin to identify potential need by looking at changes over the last three years and differences between incoming and outgoing cases.
1.1.1 Summary 2013 - 201519
Cases opened increased by 17% showing an increasing need for the service.
3,320 individual cases were opened for people from 106 different nationalities.
60% of cases were outgoing.
As people may use more than one service per case there were a total of 3,487 cases
opened when including separate service types.
88% of cases were tracing.
9% of cases were Red Cross message, 3% attestation and less than 1% safe & well.
Attestation cases fell by 52%. It is also noted that 55% of all attestation cases opened
since 2013 were in Area 34 – London.
1.1.2 Nationalities20 The top five nationalities of enquirer for 2015 were as follows:
Source: Charter Data - Unique case numbers only. Report pulled 22.02.16
19
Source: Charter Data -Unique Case Numbers Only and Charter Data – Including Case Slices. Reports pulled 22.02.16 20
In this section nationality refers to the nationality of the enquirer.
Afghan 38% Eritrean 10% Somali 6% Syrian 5% British 5% 63 Nationalities 469 Cases 129 Cases 73 Cases 65 Cases 61 Cases 439 Cases
International Family Tracing - National Overview Report 2016
10
The other nationalities in the top ten were Iraqi (4%), Congolese (DRC) (3%), Iranian (3%), Vietnamese (2%) and Ethiopian (2%)
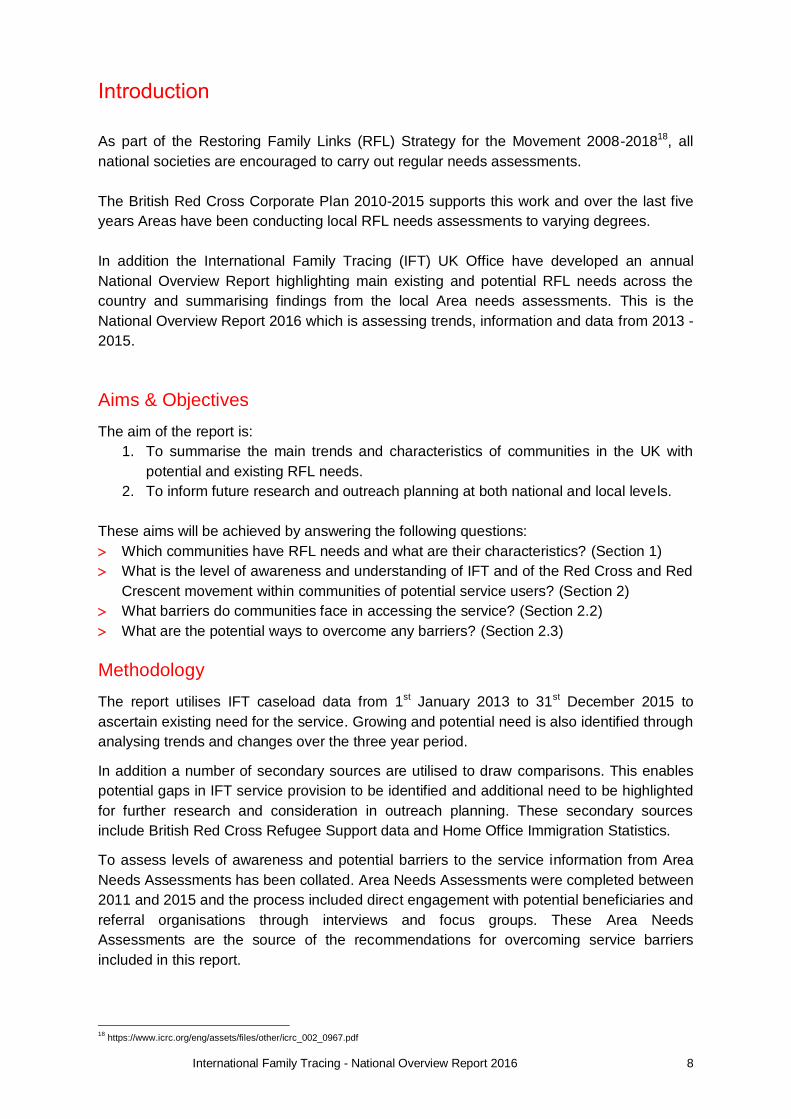
There was a significant increase in the number of cases opened for the following nationalities:
13 – 15
% Change
2015 No. Cases
Eritrean 126% 270
Syrian 76% 151
Ethiopian 180% 58
Vietnamese 164% 54
Hungarian 167% 38
Albanian 275% 24
Source: Charter Data - Unique case numbers only. Report pulled 22.02.16
64% of all cases with an Afghan enquirer were incoming. This is much higher than
other nationalities in the top ten (for example Eritrean 10% and Iraqi 25%). Therefore,
even though Afghans are currently our main service user, it suggests there may still be
a greater need for our service for this nationality in the UK than is currently being met.
Since 2013 IFT have opened outgoing but no incoming cases for 28 nationalities.
Reasons for this may include limited resources and capacity in sister National Societies,
or conflict preventing IFT services from operating in the area. The top ones and number
of outgoing cases are: Vietnamese (54), Albanian (24), Chinese (9) Algerian (9),
Zimbabwean (7), Yemeni (7).
Do Certain Nationalities Use Certain Services?
The top five nationalities using each service across the three year period have been: Tracing: Afghan (40%), Eritrean (8%), Somali (6%), British (6%), Syrian (5%) (Total Cases: 3,076)
RCM: Afghan (18%), Eritrean (15%), Somali (12%), DRC (7%), British (11%) (Total Cases: 320)
Attestation: Sri Lankan (38%), Iraqi (25%), British (8%), Swedish (8%), Eritrean (3%) (Total Cases: 88)
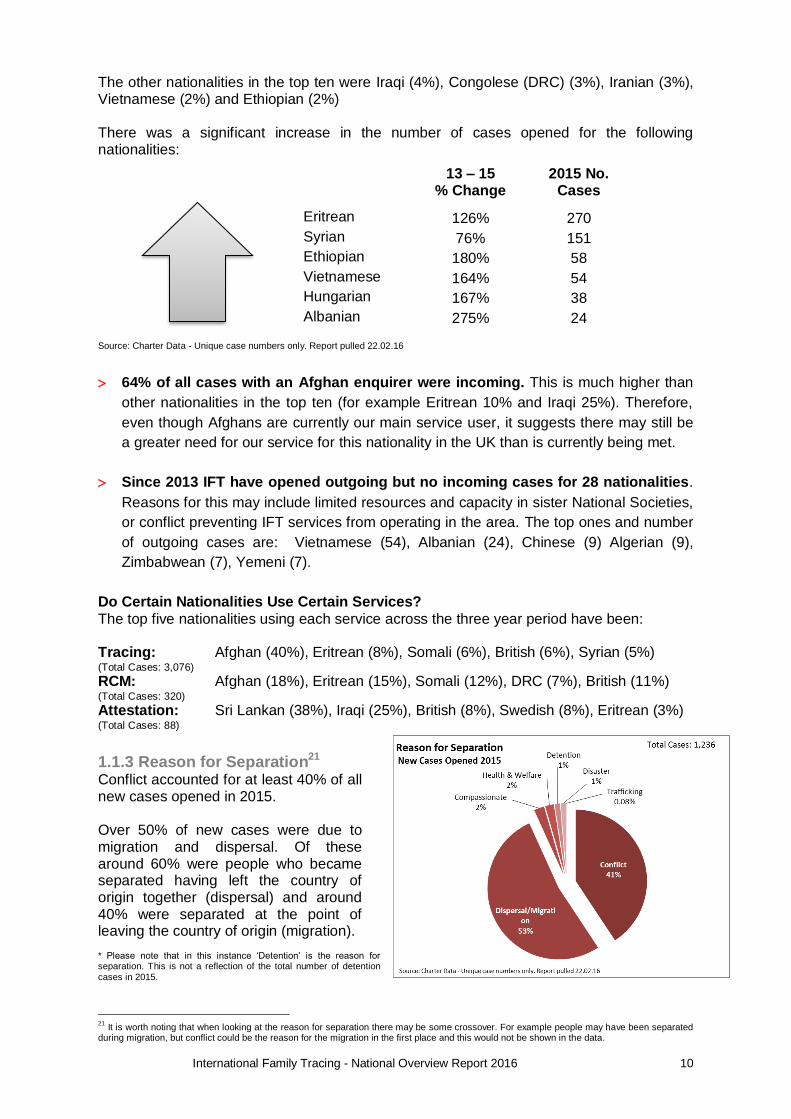
1.1.3 Reason for Separation21 Conflict accounted for at least 40% of all new cases opened in 2015. Over 50% of new cases were due to migration and dispersal. Of these around 60% were people who became separated having left the country of origin together (dispersal) and around 40% were separated at the point of leaving the country of origin (migration). * Please note that in this instance ‘Detention’ is the reason for separation. This is not a reflection of the total number of detention cases in 2015.
21
It is worth noting that when looking at the reason for separation there may be some crossover. For example people may have been separated during migration, but conflict could be the reason for the migration in the first place and this would not be shown in the data.

International Family Tracing - National Overview Report 2016
11
1.1.4 UK Area/Location22
Almost 30% of all outgoing cases opened between 2013 and 2015 were in Area 34
London. However, despite a growing number of enquiries this Area has seen a 4%
drop in cases opened during the three year period.
Areas 11 (Northern Scotland), 13 (East Scotland) and 26 (Herefordshire, Shrops &
Worcs) all opened fewer than 10 outgoing cases each. The map on the left shows the number of cases opened in each Area in 2015. The map on the right shows the difference in the number of cases opened for each area comparing 2013 to 2015. As shown areas in the Midlands and to the North of the UK are seeing the greatest increases in the number of cases opened. 11 Areas saw a fall in the number of cases opened over this period.
Source: Charter Data -Unique Case Numbers Only. Report pulled 22.02.16
Where do cases for our main nationalities of enquirer come from?
Enq. Nationality & Total 2015 Cases
Areas with highest number of outgoing cases opened for each Nationality (% of total cases for that nationality)
Afghan 167 Cases
36% A34 London, 17% A27 Staff, Warks & W Midlands
Eritrean 116 Cases
23% A27 Staff, Warks & W Midlands 19% A14 West Scotland 15% A22 Yorkshire
22
As 90% of incoming cases are marked as UKO, when analysing cases by Area only outgoing cases are included. Figures do not take account of the number of enquiries/client assists.
IFT Outgoing Cases – Difference in Number of Cases Opened 2013 -2015
IFT Outgoing Cases 2015
(Fall in no. cases opened)

International Family Tracing - National Overview Report 2016
12
Somali 47 Cases
26% A15 Northern Ireland & Isle of Man 23% A34 London 13% A23 Lancs Mersey Grtr Manchester
Syrian 41 Cases
32% A14 West Scotland 15% A23 Lancs Mersey Grtr Manchester 12% A36 Kent & Sussex 12% A22 Yorkshire
Iraqi 39 Cases
18% A27 Staff, Warks & W Midlands 15% A14 West Scotland 15% A23 Lancs Mersey Grtr Manchester
Vietnamese 29 Cases
41% A34 London 17% A32 Bedfordshire, Hertfordshire, Essex
Congolese (DRC) 29 Cases
24% A34 London 24% A22 Yorkshire 17% A23 Lancs Mersey Grtr Manchester
1.2 Asylum Seekers & Refugees
As IFT does not request or collect any data regarding the immigration status of beneficiaries it is impossible to ascertain what level, if any, of existing cases may be from the asylum seeker and refugee community. However, since conflict represents one of the main reasons for families being separated and requesting RFL services in the UK (in 2015, approximately 40% of all opened cases were related to conflict), asylum seekers and refugees in the UK can be identified as potential service users and therefore as a community to explore within this report.
1.2.1 Nationality The following table shows a comparison of the top ten nationalities for IFT cases, Refugee Support beneficiaries and for asylum applications in 2015. Those highlighted show where a nationality is in one of the ‘top tens’ but not another and therefore where potential need for the service may exist.
IFT CASES Total 2015: 1,236
REFUGEE SUPPORT Total: TBA
ASYLUM APPLICATIONS Total 2015: 32,414
Enq. Nationality No. Cases
Asylum Apps Nationality
No. Cases
IFT Cases Nationality
Applications
IFT Cases
Afghan 469 Eritrean 2935 Eritrean 3,729
Eritrean 129 Sudanese 2588 27 Iranian 3,248
Somali 73 373 Iranian 1627 Sudanese 2,918 27
Syrian 65 Syrian 1511 Syrian 2,609
British 61 N/A Iraqi 675 Pakistani 2,441 5
Iraqi 52 Afghan 574 Afghan 2,240
Congolese(DRC) 37 181 Pakistani 535 5 Iraqi 2,185
Iranian 33 Nigerian 534 9 Albanian 1,504 15
Vietnamese 29 574 Ethiopian 526 Bangladeshi 1,084 4
Ethiopian 28 713 Zimbabwean 521 3 Indian 1,004 2 Source: Charter Data - Unique case numbers only. Report pulled 22.02.16, Refugee Support BRM 2015 Data, Home Office Immigration Statistics - Total Asylum Applications 2015 Published 25/02/2016
As can be seen in the table both Sudanese and Pakistanis are in the top ten nationalities for Refugee Support beneficiaries and asylum applications, but not for IFT cases. This

International Family Tracing - National Overview Report 2016
13
suggests a potential need for the service within these communities and further investigation is recommended to establish if this is the case.
Comparing 2013 to 2015 IFT, Refugee Support and asylum applications have all seen
an increase in numbers for Eritreans and Ethiopians.
Iraqis have seen a significant increase in asylum applications of 605% (an
increase of nearly 2,000 applications) but have only seen a slight increase in the
number of IFT cases opened (27%, 11 cases)
Sudanese and Afghan have also seen a high increase in asylum applications
(Sudanese c.300%, Afghan c.100%) but with only a small increase in the
percentage of IFT cases opened.
1.2.2 Location /UK Area23 The maps show:
Asylum seeker dispersal for 2015 using Home Office Section 95 Support data. This
map also highlights the location of UK initial accommodation centres (capacity
c.200)
The spread of Refugee Support cases in 2015.
The spread of IFT outgoing cases in 2015.
The data shows higher levels of existing need for the service around the initial accommodation centres and main dispersal areas, in the Midlands and toward the North of the UK, including West Scotland.
23
As 90% of incoming cases are marked as UKO, when analysing cases by Area only outgoing cases are included. Figures do not take account of the number of enquiries/client assists.
Areas that show a lower proportion of
cases compared to Home Office or Refugee
Support Data.
Initial Accommodation Centre (Capacity c.200)
Asylum Seeker Dispersal Home Office – Section 95 Support 2015
Refugee Support 2015 IFT Outgoing Cases 2015
Source: Home Office Immigration Statistics – Section 95 Support, Refugee Support BRM 2015 Data, Charter Data - Unique case numbers only. Report 22.02.16

International Family Tracing - National Overview Report 2016
14
It can be seen that Areas 21, 22, 24 and 12 all have a lower proportion of cases opened compared to the proportion of dispersal and refugee support cases in these Areas. This suggests there may be potential service users in these Areas who are not currently accessing our service.
1.2.3 Syrian Resettlement Scheme The Government fulfilled their commitment to bring 1,000 Syrian refugees to the UK before the end of 2015. From March 2016 onwards the Home Office foresee phase 2 beginning, where groups of hundreds arrive to progress towards the 20,000 target over a number of years.24 At this point we do not have access to a breakdown of the location of the 1,000 who have already arrived, or of planned locations for the remaining 19,000.
1.3 Unaccompanied and Separated Children
The total number of IFT cases opened regarding unaccompanied and separated children (UASC) in the UK has increased by just over 50% from 155 in 2013 to 236 in 2015. 80%
of these have been outgoing where the enquirer was an unaccompanied child, and 20% incoming where the sought person was an unaccompanied child.
1 in 5 (19%) of all IFT cases opened in 2015 were
regarding UASC.25
Just 1 year old is the youngest age for an unaccompanied child IFT case opened in the last three years.26 Tracing is by far the main service accounting for 95% of all UASC cases opened 2013-2015.
Source: Charter Data - UASC Unique case numbers only. (Age calculated at date case opened. Report pulled 23.02.16) and Home Office Immigration Statistics - Total Asylum Applications from UASC 2015 Published 25/02/2016.
1.3.1 Reason for Separation Dispersal was by far the main cause of separation for incoming cases when looking for an unaccompanied child in the UK, accounting for 85% of all cases. This is likely to be a reflection of the growing European migration crisis in 2015. For outgoing cases where the enquirer was an unaccompanied child the main reason given for the separation was conflict.
24
RS & IFT Service Development Group Update Report Q4 2015 p.14 Section 7.1 25
This takes into account outgoing cases where the enquirer is UASC <18, and incoming cases where the sought person is UASC <18. 26
Case 118955 –Incoming dispersal case for Afghan SP with year of birth 2013 and date case created 31.10.14.
16 - 17 14 - 15 <14
51% 35% 14%
34% 27% 9% Asylum Applications Total: 2,912
IFT Total: 249
OTffTfttTtTotalCases
2015

International Family Tracing - National Overview Report 2016
15
1.3.2 Nationality The following table shows a comparison of the top ten nationalities for IFT cases, Refugee Support service users and for Unaccompanied Asylum Seeking Children in 2015. Those highlighted show where a nationality is in one of the ‘top tens’ but not another and therefore where potential need for the service may exist.
IFT CASES 2015 REFUGEE SUPPORT 201527
UASC ASYLUM APPLICATIONS 2015
Enq Nationality No Nationality No
IFT Cases Nationality No
IFT Cases
1 Afghan 91 Eritrean 30
Eritrean 694 2 Vietnamese 21 Afghan 18
Afghan 656
3 Eritrean 17 Sudanese 13
Albanian 456 4 Iraqi 9 Syrian 12
Iranian 208
5 Syrian 8 Iranian 8
Syrian 186 6 Albanian 7 Nigerian 4 0 Vietnamese 178
7 Iranian 5 Albanian 4
Iraqi 163 8 Ethiopian 5 Iraqi 4
Sudanese 142
9 Sudanese 4 Bangladeshi 2 1 Ethiopian 92 10 Somali 3 Pakistani 2 1 Egyptian 52 2
Source: Charter Data - UASC Unique case numbers only. Report pulled 23.02.16, Refugee Support BRM 2015 Data (where UASC box ticked) and Home Office Immigration Statistics - Total Asylum Applications from UASC 2015 Published 25/02/2016
From 2013 to 2015 Albanian’s had the highest number of UASC asylum
applications, accounting for 25% of all applications.28
The following nationalities showed significant increases in the number of UASC asylum
applications from 2013 – 201528:
Eritrean 563 applications / 430%
Afghan 506 applications / 337% Iraqi 163 applications in 2015 compared to 6 in 2013 Ethiopian 92 applications in 2015 compared to 7 in 2013
IFT also saw an increase in the number of cases for Vietnamese, Eritreans, Iraqis, and
Albanians but as you can see in the table above numbers are small so we are looking at
only very slight increases in actual case numbers.
1.3.3 Location / UK Area
Between 2013 and 2015 the South East, Wales and Scotland have seen the largest increases in the number of ‘looked after’ unaccompanied asylum seeking children.
27
This is BRM data for service users who had the UASC tick box ticked. This data has been flagged by the Refugee Support department as not
particularly robust. This should be taken into account when drawing any conclusions from this data BRM. 28
Home Office Immigration Statistics - Total Asylum Applications from UASC 2015 Published 25/02/2016

International Family Tracing - National Overview Report 2016
16
29
Source: Department for Education - Looked After Children Statistics - Total UASC at 31st March Published 10/12/15 & Freedom of Information Request - Looked After Children Statistics - Total UASC at 31st March Scotland & Wales. No statistics provided for Northern Ireland.
1.3.4 Future Considerations Affecting the UK UASC Community30
The government have announced they intend to work with the UNHCR to resettle
‘exceptional’ cases of separated children to the UK as part of the Syrian resettlement
scheme. Details are not yet available, and there is no commitment on total numbers.
The Home Office recently announced their intention to transfer approximately 600
unaccompanied asylum seeking children from Kent local authority to other areas across
the UK. Local authorities will be asked to volunteer but if enough do not come forward
then the Home Secretary may impose transfers on local authorities.
1.4 Detainees in Immigration Removal Centres
1 in 20 of all outgoing IFT cases opened 2013 – 2015 was opened for someone held in detention.31
Tracing is by far the main IFT service used by this group, accounting for 90% of all
cases opened 2013 – 201532.
29
As 90% of incoming cases are marked as UKO, when analysing cases by Area only outgoing cases are included. Figures do not take account of the number of enquiries/client assists. 30
RS & IFT Service Development Group Update Report Q4 2015 p.14 Section 7.2 & 7.3 31
Taking into account incoming cases as well this drops from 20% of outgoing cases to 3% of all cases. 32
Source: Charter Data – People assisted – With Slices. Report pulled 22.02.16
Department for Education - ‘Looked After’ UASC
Difference in number of cases March 2013 – March 2015
No statistics
available for
NI.
This suggests a growing need for IFT services for
UASC in these Areas. However these Areas have
seen minimal or no increase in IFT outgoing cases
opened for UASC from 2013 – 201529.
DIFFERNCE
‘Looked After’
UASC Mar 13 - 15
IFT UASC (Outgoing) Jan 13 -15
A34 London 315 5
A36 Kent & Sussex 195 -4
A32 Beds, Herts, Essex 100 4
A31 Cambs, Norfolk, Suffolk 40 1
A25 Lincs, Leics, Rutland,
Northants 50 0
A14 West Scotland 64 6
A12 Wales 48 6
The area that has seen the greatest increase in IFT
UASC outgoing cases is A27 – Staffs, Warks & W
Midlands with 17 more cases opened in 2015 than
2013.
International Family Tracing - National Overview Report 2016
17
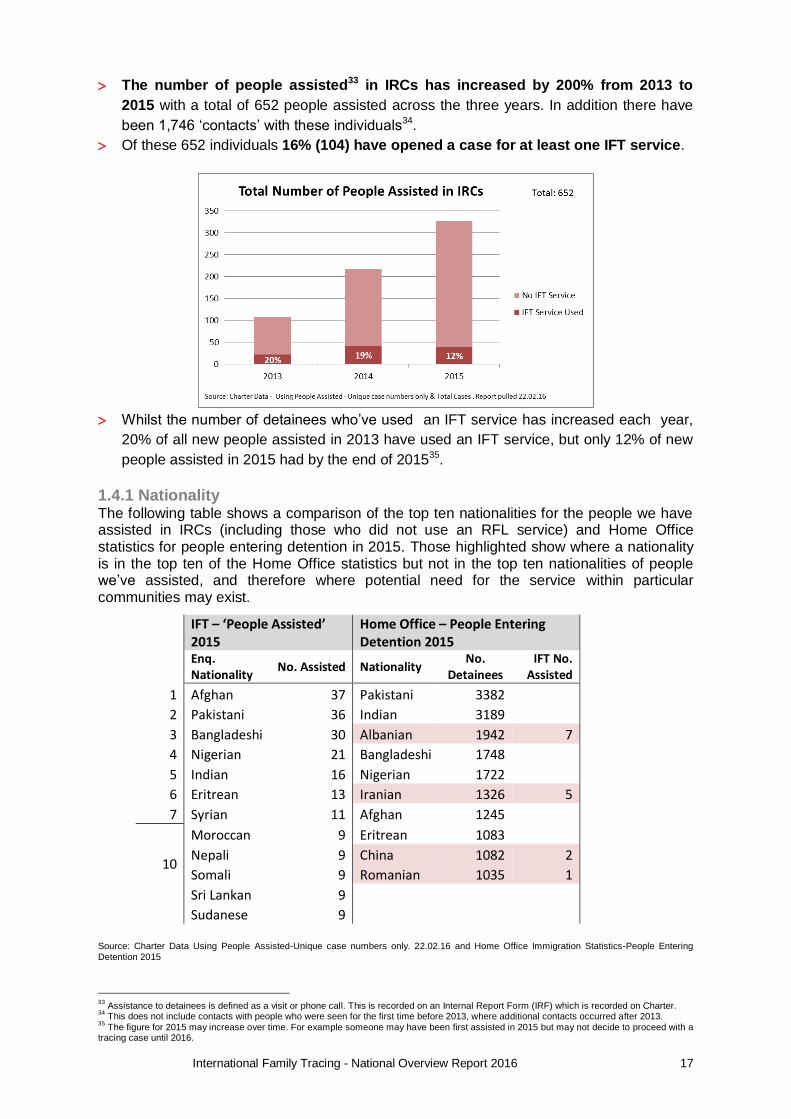
The number of people assisted33 in IRCs has increased by 200% from 2013 to
2015 with a total of 652 people assisted across the three years. In addition there have
been 1,746 ‘contacts’ with these individuals34.
Of these 652 individuals 16% (104) have opened a case for at least one IFT service.
Whilst the number of detainees who’ve used an IFT service has increased each year,
20% of all new people assisted in 2013 have used an IFT service, but only 12% of new
people assisted in 2015 had by the end of 201535.
1.4.1 Nationality The following table shows a comparison of the top ten nationalities for the people we have assisted in IRCs (including those who did not use an RFL service) and Home Office statistics for people entering detention in 2015. Those highlighted show where a nationality is in the top ten of the Home Office statistics but not in the top ten nationalities of people we’ve assisted, and therefore where potential need for the service within particular communities may exist.
IFT – ‘People Assisted’ 2015
Home Office – People Entering Detention 2015
Enq. Nationality
No. Assisted Nationality No.
Detainees IFT No.
Assisted
1 Afghan 37 Pakistani 3382 2 Pakistani 36 Indian 3189 3 Bangladeshi 30 Albanian 1942 7
4 Nigerian 21 Bangladeshi 1748 5 Indian 16 Nigerian 1722 6 Eritrean 13 Iranian 1326 5
7 Syrian 11 Afghan 1245
10
Moroccan 9 Eritrean 1083 Nepali 9 China 1082 2
Somali 9 Romanian 1035 1
Sri Lankan 9
Sudanese 9
Source: Charter Data Using People Assisted-Unique case numbers only. 22.02.16 and Home Office Immigration Statistics-People Entering Detention 2015
33
Assistance to detainees is defined as a visit or phone call. This is recorded on an Internal Report Form (IRF) which is recorded on Charter. 34
This does not include contacts with people who were seen for the first time before 2013, where additional contacts occurred after 2013. 35
The figure for 2015 may increase over time. For example someone may have been first assisted in 2015 but may not decide to proceed with a tracing case until 2016.

International Family Tracing - National Overview Report 2016
18
There has been a significant increase in the number of people entering detention with the following nationalities 2013 - 201536:
Albanian: 722 more Albanians entering detention / 59%
Iraqi: 717 more Iraqis entering detention / 327%
Sudanese: 612 more Sudanese entering detention / 175%
Syrian: 742 more Syrians entering detention / 47%
IFT – ‘People assisted’ by IRC 2015 Home Office – People Entering Detention 2015
IRC No Assisted
% of Total IRC
No Ent. Detention
% of Total
Brook House 96 25% Yarl's Wood 3969 15%
Harmondsworth 86 22% Brook House 3913 14%
Colnbrook 55 14% Colnbrook 2940 11%
Campsfield House 34 9% Dover (Closed Nov 15) 2779 10%
Tinsley House 32 8% Campsfield House 2754 10%
The Verne 30 8% The Verne 2656 10%
Yarl's Wood 18 5% Morton Hall 2437 9%
Dover (Closed Nov 15) 19 5% Harmondsworth 2190 8%
Haslar (Closed Mar 15) 5 1% Tinsley House 1750 6%
Morton Hall 4 1% Dungavel 1464 5%
Dungavel House 1 0.3% Haslar (Closed Mar 15) 351 1%
Prison / YOI 3 1%
36
Home Office - Immigration Statistics - People Entering Detention 2015
1.4.2 Location/UK Area
The map shows the number of
“people assisted” in each UK Area
(by the Area that is currently dealing
with the case). It also shows the
location of UK Immigration Removal
Centres and the number of people
who entered detention in each centre
in 2015.
The table below shows the number of
“people assisted” in each detention
centre, as well as the number of
people entering each centre. Both are
sorted from highest to lowest.
People Assisted in IRCs 2015
By Area Currently Dealing With Case
Source: Charter Data - Using People assisted - Unique case numbers only. Report pulled 22.02.16 and Home Office Immigration Statistics - People Entering Detention 2015

International Family Tracing - National Overview Report 2016
19
IFT numbers are low, but we can see that Morton Hall and Dungavel House had particularly
low numbers. In addition Yarl’s Wood had the highest number of people enter detention in
2015, but a proportionally low number of ‘people assisted’ by us.
1.5 Conflict
By the very definition of the IFT service (tracing families separated by war and conflict) we know there is an existing need for our service within the conflict affected community. In 2015 at least 41% of all IFT cases were opened due to separation as a result of conflict37. The number of cases opened each year due to conflict has remained around 500 in 2013, 2014 and 2015.
1 in 5 of all cases opened in 2015 and marked as conflict were also UASC.
10% of all 2015 cases marked as conflict were also marked as WWII.
1.6.1 Nationality The table shows the top ten nationalities of enquirer for those cases opened and marked as conflict in 2015. Those highlighted have seen the highest percentage increase in the number of cases opened from 2013 to 2015, indicating increasing need within these communities.
Enq. Nationality
2015 No. Cases
13-15 % Change
Enq. Nationality
2015 No. Cases
% Change
1 Afghan 165 6% 6 British 29 28%
2 Somali 70 8% 7 Eritrean 21 50%
3 Iraqi 39 34% 8 Sudanese 18 80%
4 Syrian 36 89% 9 Sri Lankan 17 6%
5 Congolese (DRC) 34 55% 10 Polish 13* 34%
Source: Charter Data - Unique case numbers only. Report pulled 22.02.16 * All 13 cases are WWII cases
To assist us in identifying other communities affected by conflict (now or in the near future) we are able to use the global INFORM Index for Risk Management to identify those countries deemed most at risk of conflict38. The Central African Republic, Pakistan and Yemen are all identified within the top ten for projected and current conflict risk but do not feature in the top ten nationality of enquirer for IFT conflict cases in 2015. Further research is recommended to ascertain whether there may be potential or existing need for RFL services within these communities in the UK.
1.6 World War Two
The number of WWII cases has
decreased by 33% from 2013 to
2015 suggesting a declining need
for this service.
4%, almost 1 in 20, of all cases opened in 2015 was due to separation caused by WWII.
37
It is worth noting that this number may be higher. For example people may have been separated during migration, but conflict could be the reason for the migration in the first place and this would not be shown in the data. 38
INFORM Index for Risk Management. Released 14.12.16 v 0.2.7 - www.inform-index.org The INFORM index scores countries on a number of criteria. Here we are looking only at their risk of conflict.

International Family Tracing - National Overview Report 2016
20
In contrast to ‘all’ cases we’ve had more incoming WWII cases opened in the last 3
years than outgoing, with incoming accounting for 58%. (Though in 2015 the split was
50/50.)
1.5.1 Age For WWII outgoing cases the majority of enquirers are aged 60-79. The oldest has been 89. For sought people in incoming cases the average is older with the majority aged 80-99.
1.5.2 Nationality As the number of WWII cases has been in decline there’s no significant increase in cases from any particular nationality. British and Polish have been the main nationality of enquirer across the three year period accounting for 52% of all cases opened (68 British
Cases, 31 Polish cases), followed by German and Ukrainian with 10 cases opened each. For outgoing cases we have only opened cases for 9 nationalities in this time period, whereas for incoming we have opened cases for 19 different nationalities.
1.5.4 Location/UK Area With only a total of 79 outgoing WWII cases 2013 - 2015 there are low numbers and no obvious trends to draw conclusions from in terms of geographic spread of these cases.
Overall most Areas have opened between 1 – 10 cases in the 3 year period with the exception of A15 (Northern Ireland & Isle of Man) & A26 (Herefordshire, Shrops & Worcs) who have not opened any.
With a high age of enquirer and sought person for this type of case 2011 Census data is able to provide an insight into the areas of the UK where older sections of the population are based. The data highlights that areas with the highest median ages are mainly located close to the south coast of England. Specific areas include Eastbourne, East Devon, East Dorset and Pool. East Riding of Yorkshire and Worcestershire are also in the highest when looking at local authority data. With an older population than other areas of the UK these are likely to be good target areas for raising awareness of the IFT service for the WWII community.39
1.7 Disaster40
As with conflict cases we know there is a need within this community by the very definition of the IFT service. However only a small number of the cases opened each year are due to separation because of disaster.
39
Office for National Statistics - Annual Small Area Population Estimates, Mid-2014 | 25 November 2015 (using 2011 Census Data) 40
Currently cases marked on charter as ‘Disaster’ include natural disasters (such as earthquakes, hurricanes etc.) as well as boat disasters (migrant boats).

International Family Tracing - National Overview Report 2016
21
2013 - 2015
2% of all cases opened have been marked as disaster (59 cases).
The highest number of cases opened due to one disaster was because of the
Philippines Typhoon in 2013 (25 cases).
2015 Only
In 2015 we opened 15 tracing cases relating to disaster, looking for 22 people.
The highest number of disaster cases was marked as 'Migrant Boats' (8 cases in 2015 -
53% of all 2015 cases).
We had 3 tracing enquiries relating to the Earthquake in Nepal and 1 relating to floods in
India.
1 case out of all marked as disaster was also marked as UASC.
The following are the top five countries deemed at highest risk of natural disaster according to the INFORM Index for Risk Management41. In the event of a natural disaster rapid response is required and there is little time to implement outreach to the communities in need. Consideration should therefore be given to establishing links with the following communities in the UK so that a good level of awareness exists regarding RFL services and their role in assisting to restore family contact in the event of a natural disaster.
INFORM INDEX: COUNTRIES RATED VALUE 8 OR MORE FOR RISK OF NATURAL DISASTER
Eart
hquake
Flo
od
Tsunam
i
Tro
pic
al
Cyclo
ne
Dro
ught
Natu
ral
To
tal
Philippines 10.0 7.4 9.8 9.8 3.3 8.9
Bangladesh 8.6 10.0 9.4 7.1 5.4 8.6
Japan
10.0 3.6 10.0 9.9 0.0 8.5
China
8.0 8.4 9.4 8.8 4.6 8.2
Myanmar 9.3 9.8 9.3 7.0 0.0 8.2
1.8 Other Potential Service Users
1.8.1 Irregular Migrants
The International Organisation for Migration (IOM) defines irregular migration as movement that takes place outside the regulatory norms of the sending, transit or receiving country. In the case of the receiving or destination country it is defined as those migrants who enter, stay or work without the necessary authorisation required under immigration regulations. However the IOM accepts there is no universally accepted definition of the term and that its use is often restricted to cases of smuggling and trafficking
42.
When analysing irregular migration statistics comparison with existing IFT cases are impossible as we do not record the immigration status of our beneficiaries.
According to the Joint Council for the Welfare of Immigrants (JCWI) the latest estimate of the undocumented migrant population is 618,000 which comes from a 2009 study by the
41
INFORM Index for Risk Management. Released 14.12.16 v 0.2.7 - www.inform-index.org The INFORM index scores countries on a number of
criteria. Here we are looking only at their risk of natural disaster. 42
International Organisation for Migration – Key Migration Terms https://www.iom.int/key-migration-terms
International Family Tracing - National Overview Report 2016
22
London School of Economics. The population is extremely diverse and calls to the JCWI free legal advice line since 2012 have included43:
Callers from over 50 countries from Australia to Zimbabwe.
Age range of 12 to 75 years old.
Roughly even male/female split.
Just under 50% have a child under 18 in the UK.
The length of time in the UK ranges from less than a week to over 40 years.
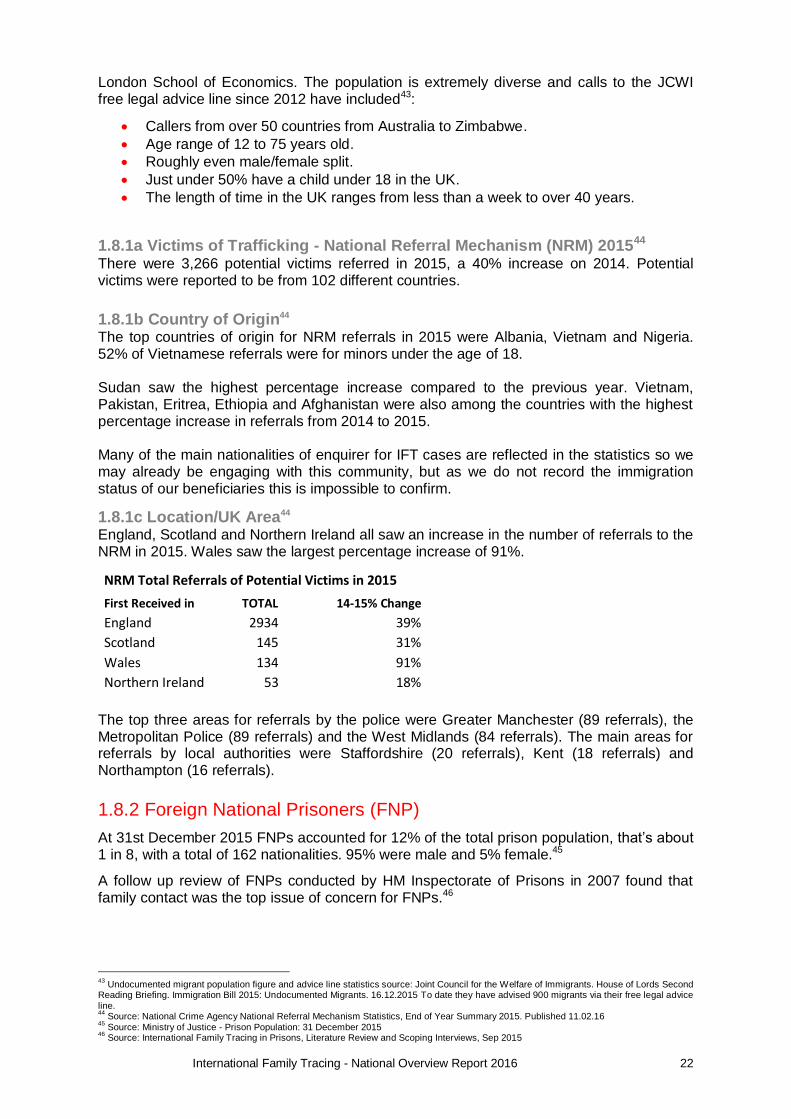
1.8.1a Victims of Trafficking - National Referral Mechanism (NRM) 201544 There were 3,266 potential victims referred in 2015, a 40% increase on 2014. Potential victims were reported to be from 102 different countries.
1.8.1b Country of Origin44 The top countries of origin for NRM referrals in 2015 were Albania, Vietnam and Nigeria. 52% of Vietnamese referrals were for minors under the age of 18. Sudan saw the highest percentage increase compared to the previous year. Vietnam, Pakistan, Eritrea, Ethiopia and Afghanistan were also among the countries with the highest percentage increase in referrals from 2014 to 2015. Many of the main nationalities of enquirer for IFT cases are reflected in the statistics so we may already be engaging with this community, but as we do not record the immigration status of our beneficiaries this is impossible to confirm.
1.8.1c Location/UK Area44 England, Scotland and Northern Ireland all saw an increase in the number of referrals to the NRM in 2015. Wales saw the largest percentage increase of 91%.
NRM Total Referrals of Potential Victims in 2015
First Received in TOTAL 14-15% Change
England 2934 39%
Scotland 145 31%
Wales 134 91%
Northern Ireland 53 18%
The top three areas for referrals by the police were Greater Manchester (89 referrals), the Metropolitan Police (89 referrals) and the West Midlands (84 referrals). The main areas for referrals by local authorities were Staffordshire (20 referrals), Kent (18 referrals) and Northampton (16 referrals).
1.8.2 Foreign National Prisoners (FNP)
At 31st December 2015 FNPs accounted for 12% of the total prison population, that’s about 1 in 8, with a total of 162 nationalities. 95% were male and 5% female.45
A follow up review of FNPs conducted by HM Inspectorate of Prisons in 2007 found that family contact was the top issue of concern for FNPs.46
43
Undocumented migrant population figure and advice line statistics source: Joint Council for the Welfare of Immigrants. House of Lords Second Reading Briefing. Immigration Bill 2015: Undocumented Migrants. 16.12.2015 To date they have advised 900 migrants via their free legal advice line. 44
Source: National Crime Agency National Referral Mechanism Statistics, End of Year Summary 2015. Published 11.02.16 45
Source: Ministry of Justice - Prison Population: 31 December 2015 46
Source: International Family Tracing in Prisons, Literature Review and Scoping Interviews, Sep 2015

International Family Tracing - National Overview Report 2016
23
1.8.3a Nationality The top 3 nationalities of FNPs at 31st December 2015 were Polish, Irish and Romanian. However Albanian, Pakistani, Somali and Nigerian all featured in the top ten. There were also a high number of Iranian, Iraqi, Vietnamese and Afghan FNPs who were all within the top twenty47.
1.8.3b Location/UK Area In 2014 the National Audit Office reported that foreign nationals were held in over 120 prisons and IRCs across England and Wales, with FNPs fairly heavily concentrated in London and the South-East. Where possible, lower harm FNPs are allocated to 1 of 14 designated ‘category C’ prisons, including 2 FNP-only prisons in Maidstone (Kent) and Huntercombe (South Oxfordshire)48.
1.8.3 Countries at Risk
In order to identify countries that are most at risk from being affected by disaster we are able to use the global INFORM Index49. In this instance the risk of conflict and natural disaster are taken into account as well as vulnerability and ‘coping’ capacity. The following are the top ten countries deemed currently to be most at risk.
INFORM INDEX: COUNTRIES MOST AT RISK
COUNTRY
INFORM RISK
COUNTRY INFORM
RISK
1 Somalia 8.7 6 Sudan 7.2
2 Central African Republic 8.3 7 Iraq 7.1
3 Afghanstan 7.9 8 Congo DR 6.9
4 South Sudan 7.9 9 Myanmar 6.8
5 Yemen 7.5 10 Pakistan 6.7
Source: INFORM Index for Risk Management. Released 14.12.16 v 0.2.7 - www.inform-index.org
In terms of geographical location to assist us in outreach to these communities there is minimal information available. However the following areas are highlighted in the 2011 Census data for having the highest proportion of certain languages spoken, identifying strong pockets of a number of these communities.50
MAIN LANGUAGE BY LOCAL AUTHORITY Local Authority Language % Spoken
Bradford Pashto 0.7% Birmingham Pahari 1.1% Slough Panjabi 6.2% Slough Urdu 5% London - Westminster Arabic 5.7% London - Westminster Kurdish 1% London - Brent Somali 2% OTHERS ALSO OF NOTE: Rushmore Nepalese 6.2% Birmingham Pahari 1.1% London – Harrow Tamil 3.6%
Source: 2011 Census
47
Source: Ministry of Justice - Prison Population: 31 December 2015 48
National Audit Office Report- Managing and removing foreign national offenders 22.10.14 49
INFORM Index for Risk Management. Released 14.12.16 v 0.2.7 - www.inform-index.org 50
Source: 2011 Census
http://www.ons.gov.uk/peoplepopulationandcommunity/culturalidentity/language/articles/languageinenglandandwales/2013-03-04#concentration-of-languages-across-local-authorities
International Family Tracing - National Overview Report 2016
24
2. Awareness & Barriers
From 2011 to 2015 British Red Cross Areas have been completing Area Needs Assessments. As part of the process Areas engaged with different communities, identifying potential barriers to the service and ways that these could be addressed.
80% (16 out of 20) Areas have completed phases 1 and 2
21 reports have been completed51 with over 200 potential beneficiaries interviewed
Nearly 200 referral organisations have been contacted
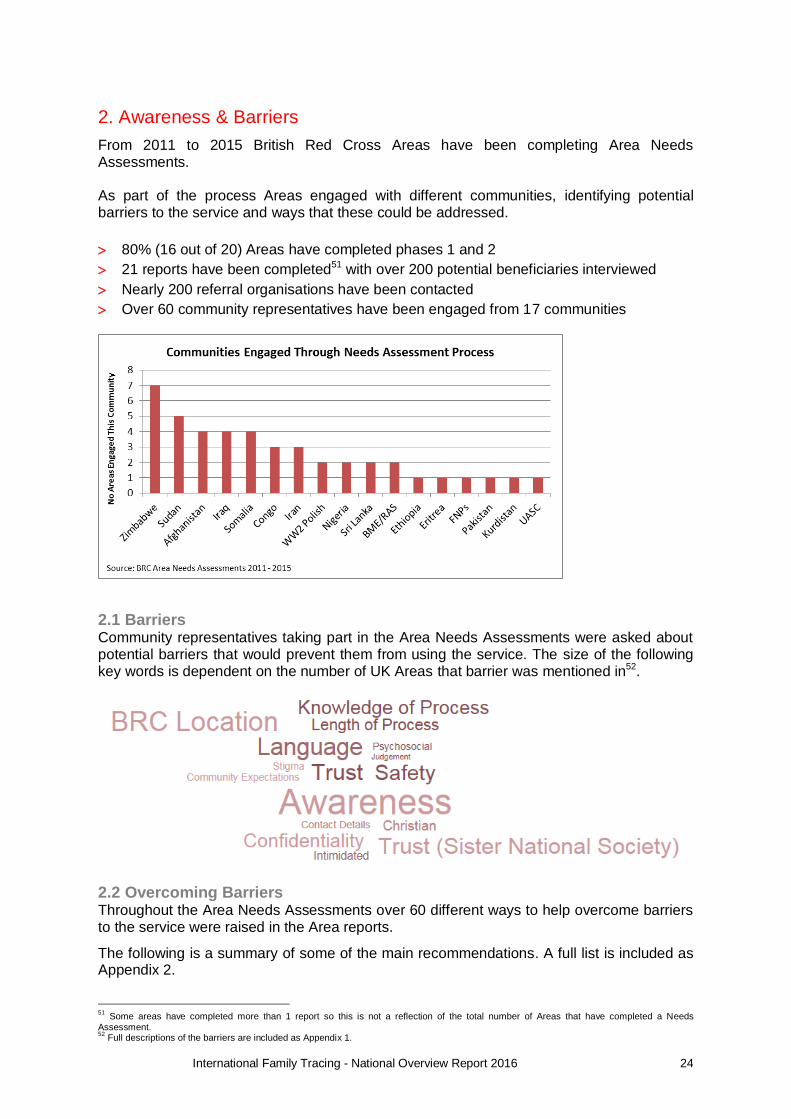
Over 60 community representatives have been engaged from 17 communities
2.1 Barriers Community representatives taking part in the Area Needs Assessments were asked about potential barriers that would prevent them from using the service. The size of the following key words is dependent on the number of UK Areas that barrier was mentioned in52.
2.2 Overcoming Barriers Throughout the Area Needs Assessments over 60 different ways to help overcome barriers to the service were raised in the Area reports.
The following is a summary of some of the main recommendations. A full list is included as Appendix 2.
51
Some areas have completed more than 1 report so this is not a reflection of the total number of Areas that have completed a Needs
Assessment. 52
Full descriptions of the barriers are included as Appendix 1.

International Family Tracing - National Overview Report 2016
25
Increased promotion online (specifically social media), in radio and press
More local engagement with communities and referral organisations
Language and literacy considerations for marketing materials
Myth busting messaging
Introducing confidentiality statements including for interpreters
Offering off-site interviews (libraries) / assisting with travel costs
Recruiting volunteers/ambassadors with community links
3. ‘Success’ Rates
Having looked at existing and potential RFL service users in the UK it is important to analyse the capacity of the service. Looking at the number of ‘successful’ cases across the three year period helps to give an indication of the current capacity as well as assisting to manage expectations of the service. Furthermore success rates are a useful tool in promoting the service and championing the work of the British Red Cross RFL network to ultimately raise awareness and engagement with the service. An IFT case is deemed successful when it is marked with a date found. Successful tracing cases include all outcomes where a person is traced. It’s therefore important to remember successful cases will include those where a sought person has died, or has not wanted contact with the enquirer. The following figures are for all ‘successful’ tracing cases from 2013 to 2015, including cases that were opened prior to 2013:
451 successful tracing cases with 698 people found by the Red Cross53.
An additional 339 successful tracing cases with 615 people found by ‘other channels’. The following figures only take into account ‘successful’ tracing cases that were both opened and successful between 2013 and 2015:
11% of all tracing cases opened were ‘successful’ through the work of the Red
Cross (327 cases54).
504 people were found by the Red Cross.
In addition 275 cases were ‘successful’ and 481 people found by ‘other channels (9% of
all tracing cases in this period).
We have a higher success rate with outgoing cases, which account for 61% of
successful cases.
Cases are more likely to be ‘successful’ in the first year they are opened (Opened 2013:
Yr1 8% successful, Yr2 6% successful, Yr3 1% successful)
A successful trace was the main
outcome accounting for 63% of all
successful cases in this period.
53
An additional 42 cases are marked with a date found but currently have investigations ongoing. This may include, for example, cases where
an additional small piece of information is outstanding before the case is finally marked as ‘successful’. 54
An additional 25 cases are marked with a date found but currently have investigations ongoing.

International Family Tracing - National Overview Report 2016
26
Health and welfare and compassionate cases had the highest success rates, with around 50% success of those opened. Dispersal and disaster cases had some of the lowest success rates.
Reason for separation – ranked from most successful to least
Total Cases 13-15
% Successful
Total Cases 13-15
% Successful
Health & Welfare 68 53% Disaster 59 8%
Compassionate 110 42% Detention 43 5%
Conflict 1505 13% Dispersal 923 2%
Migration 610 11% Trafficking 2 0%
Conclusion
Communities with Existing or Potential RFL Needs
Overall the data shows a growth in the service with a 17% increase in the number of IFT
cases opened comparing 2013 to 2015. Cases opened for unaccompanied and separated
children in the UK have seen a particular increase of 52% across this period.
The only parts of the service that have seen a fall in cases opened are WWII (33% drop)
and attestation cases (52% drop), suggesting additional outreach and awareness is needed
here, or possibly a declining need for this type of case within the UK.
On the whole IFT data is reflective of the data from secondary sources with IFT main
nationalities of enquirer represented in most comparison data. The UK spread of cases
shows growth in similar Red Cross Areas to that of Refugee Support and asylum seeker
dispersal Section 95 data, indicating we are meeting the growing potential need in these
areas.
However, in some places there are key differences in the IFT data when compared to
secondary sources. These highlight communities and Areas for targeted outreach to
increase service awareness and levels of use among particular communities.
For example there was a significant increase in the number of Refugee Support cases and
asylum applications for Sudanese, Iraqis and Afghans across the three year period that was
not reflected in significant increases in IFT cases.
In addition, data from the Department of Education for the number of ‘looked after’
unaccompanied asylum seeking children showed increases in seven British Red Cross UK
Areas (A34, A36, A32, A31, A25, A14, A12) from 2013 to 2015, however these Areas have
seen minimal or no increase in IFT outgoing cases for unaccompanied children during this
time.
International Family Tracing - National Overview Report 2016
27
It is noted that in some instances further investigation may be needed to ascertain whether
additional need has been identified, or whether there may be underlying reasons that RFL
services are not required for these communities.
Full details of communities and Areas for future investigation or targeted outreach are
highlighted in the Recommendations and Actions section of the report.
Awareness & Barriers
Local Area Needs Assessments (conducted from 2011 to 2015) show low levels of
awareness for the service, with all Areas who completed reports identifying this as a key
barrier for beneficiaries using RFL services. In addition the location of the British Red Cross
offices and language barriers were the other two main reasons identified for people not
accessing the RFL services. A number of recommendations for addressing these barriers to
the service were put forward in the Area Needs Assessments and these are summarised in
the Recommendations and Actions section of the report.
‘Success’ Rates55
Overall more cases across the three year period have been successful by the work of the
Red Cross (11%, 32756 cases) than by ‘other channels’ (9%, 275 cases). The main outcome
has been a successful trace with this accounting for 63% of all successful cases. (These
figures only take account of tracing cases that were both opened and successful between
2013 to 2015.)
From 2013 to 2015 a total of 1,313 people were found (698 by the work of the Red Cross
and 615 by ‘other channels’). (This figure includes cases that were opened prior to 2013.)
55
An IFT case is deemed successful when it is marked with a date found. Outcomes of successful cases include a successful trace, news of death and the sought person is found but no contact with the enquirer is wanted. 56
An additional 25 cases are marked with a date found but currently have investigations ongoing. This may include, for example, cases where an additional small piece of information is outstanding before the case is finally marked as ‘successful’.

International Family Tracing - National Overview Report 2016
28
Recommendations & Actions
Recommendation Consideration/Action By
OUTREACH & COMMUNITY ENGAGEMENT
Awareness: With low levels of awareness identified in the Local Area Needs Assessment a strong national communications plan and continued local outreach by Areas are recommended. Considerations for additional capacity requirements from any resulting uplift will also be required.Future communication plans and outreach should take into account the recommendations from Area Needs Assessments for overcoming barriers. The main recommendations are summarised as follows but a full list is included as Appendix 2:
- increased promotion online (specifically social media), in radio and press - more local engagement with communities and referral organisations - language and literacy considerations for marketing materials (Language was also one of the top 3
barriers to the service identified in Area Needs Assessments) - myth busting messaging
Service Access Officer Communications Team Areas
Awareness & Trust:
Recruiting volunteers from specific communities and local ambassadors with good community links to champion the service are both recommendations to come out of the Area Needs Assessments to help tackle awareness and trust.
Areas
Specific Target Communities:
The following communities have been identified within the report as: - showing an increase in IFT cases suggesting a growing need among existing communities or - showing high existing levels or strong growth in secondary source data suggesting a potential need among particular communities These communities are therefore identified for consideration for future outreach, promotion and local community engagement activities.
Eritrean, Syrian, Ethiopian and Vietnamese An increasing number of IFT cases highlights an increasing need for RFL services among these communities
Service Access Officer Communications Team Areas
International Family Tracing - National Overview Report 2016
29
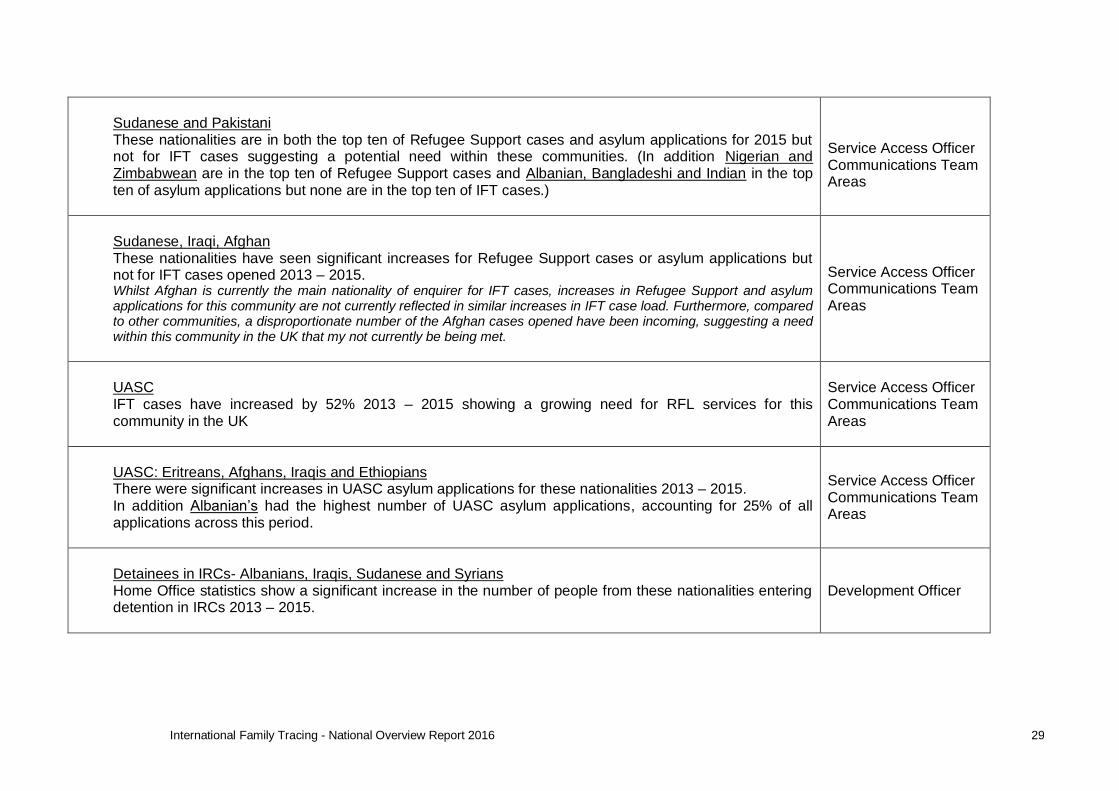
Sudanese and Pakistani These nationalities are in both the top ten of Refugee Support cases and asylum applications for 2015 but not for IFT cases suggesting a potential need within these communities. (In addition Nigerian and Zimbabwean are in the top ten of Refugee Support cases and Albanian, Bangladeshi and Indian in the top ten of asylum applications but none are in the top ten of IFT cases.)
Service Access Officer Communications Team Areas
Sudanese, Iraqi, Afghan These nationalities have seen significant increases for Refugee Support cases or asylum applications but not for IFT cases opened 2013 – 2015. Whilst Afghan is currently the main nationality of enquirer for IFT cases, increases in Refugee Support and asylum applications for this community are not currently reflected in similar increases in IFT case load. Furthermore, compared to other communities, a disproportionate number of the Afghan cases opened have been incoming, suggesting a need within this community in the UK that my not currently be being met.
Service Access Officer Communications Team Areas
UASC IFT cases have increased by 52% 2013 – 2015 showing a growing need for RFL services for this community in the UK
Service Access Officer Communications Team Areas
UASC: Eritreans, Afghans, Iraqis and Ethiopians There were significant increases in UASC asylum applications for these nationalities 2013 – 2015. In addition Albanian’s had the highest number of UASC asylum applications, accounting for 25% of all applications across this period.
Service Access Officer Communications Team Areas
Detainees in IRCs- Albanians, Iraqis, Sudanese and Syrians Home Office statistics show a significant increase in the number of people from these nationalities entering detention in IRCs 2013 – 2015.
Development Officer

International Family Tracing - National Overview Report 2016
30
The Philippines, Bangladesh, Japan, China and Myanmar These are the top five countries currently most at risk from natural disaster according to the INFORM Global Index for Risk Management. Good community links within the UK would be beneficial to raise awareness of RFL services within these communities to enable rapid support in the event of a future disaster.
Areas
CAPACITY CONSIDERATIONS AND AREAS IDENTIFIED FOR TARGETTED OUTREACH
A27- Staffordshire, Warwickshire, West Midlands, A14 - West Scotland, A23 - Lancashire, Merseyside, Greater Manchester
The Midlands and to the North of the UK are seeing the greatest increase in cases (in-line with asylum seeker dispersal figures). Considerations will need to be given to capacity to ensure the growing need can continue to be met.
A27- Staffordshire, Warwickshire, West Midlands A14 - West Scotland A23 - Lancashire, Merseyside, Greater Manchester
A21 – North East and Cumbria, A22 – Yorkshire, A24 – Derbyshire, Nottinghamshire, Cheshire Comparing Refugee Support, Section 95 Support and IFT data shows a lower proportion of IFT cases opened in these Areas and suggesting a higher need for our service may exist here than is currently being met.
A21 – North East and Cumbria A22 – Yorkshire A24 – Derbyshire, Nottinghamshire, Cheshire
UASC: A34 – London, A36 – Kent & Sussex, A32 – Bedfordshire, Hertfordshire, Essex, A31 – Cambridgeshire, Norfolk, Suffolk, A25 – Lincolnshire, Leicestershire, Rutland, Northamptonshire, A14 – West Scotland, A12 Wales
The South East, Wales and Scotland have seen the largest increases in the number of ‘looked after’ UASC 2013 - 2015. These areas have seen minimal or no increase in IFT outgoing cases opened for UASC.
A34 – London A36 – Kent & Sussex A32 – Beds, Herts, Essex A31 – Cambridgeshire, Norfolk, Suffolk A25 – Lincolnshire, Leicestershire, Rutland, Northamptonshire A14 – West Scotland A12 Wales

International Family Tracing - National Overview Report 2016
31
Detention: A32 - Bedfordshire, Hertfordshire, Essex, A25 – Lincolnshire, Leicestershire, Rutland, Northants, A14 - West Scotland
The UK spread of ‘people assisted’ in detention largely reflects the location of IRCs. However a relatively small number of people have been assisted’ in Yarl’s Wood, Morton Hall and Dungavel House compared to the number of people entering detention in those centres in 2015. Yarl’s Wood had the more people enter in 2015 than any other IRC.
Development Officer A32 - Bedfordshire, Hertfordshire, Essex A25 – Lincolnshire, Leicestershire, Rutland, Northants A14 - West Scotland
A38 Cornwall, Devon, Dorset, Somerset, Channel Isles, A35 - Hampshire, Isle of Wight, Surrey, A27 - Staffordshire, Warwickshire, West Midlands, A22 - Yorkshire Whilst IFT caseload shows a declining need for this service (33% drop in cases opened 2013 - 2015) with a high age for enquirer and sought persons for these cases it is noted there may only be the opportunity of a few more years to assist service users in this community. 2011 Census data shows areas with the highest median ages are located close to the south coast of England (including Devon, Torbay and Eastbourne. East Riding and Worcestershire are also ranked in the top ten.) These are therefore identified as potential target areas for raising awareness of the RFL service within the WWII community.
A38 Cornwall, Devon, Dorset, Somerset, Channel Isles A35 - Hampshire, Isle of Wight, Surrey A27 - Staffordshire, Warwickshire, West Midlands, A22 - Yorkshire
THE SERVICE & PROCESS
Location and ‘visibility’ of BRC offices:
This is one of the top 3 barriers to the service identified in Area Needs Assessments. Recommendations from area reports to help address this barrier are offering off-site interviews (for example libraries, meeting rooms) and assisting with travel costs.
Areas
Trust & Confidentiality: Introducing confidentiality statements to the tracing form and for interpreters as a tool to help tackle the concerns around trust and confidentiality for potential service users were both recommendations in the Area Needs Assessments.
Development Manager IFT Casework Manager

International Family Tracing - National Overview Report 2016
32
ADDITIONAL RESEARCH AND INVESTIGATION
Attestation – 52% drop in cases from 2013 to 2015 Further investigation is required to identify whether the reason for the fall in caseload is due to a lack of awareness of the service or a declining need within the UK. (It is noted that Iraqis have been the second highest user of this service across the three year period, and asylum applications for this nationality have seen over a 600% increase in that time.)
Service Access Officer Communications Team Areas
Detention:
Only 16% of ‘people assisted’ in detention have used an IFT service. Further investigation is required to determine what the need is for the remaining 84% and whether this could be met by other BRC services.
Development Officer Areas
Vietnamese (54 cases), Albanian (24 cases), Chinese (9 cases), Algerian (9 cases), Yemeni (7 cases), Zimbabwean (7 cases)
Further research is recommended to determine the reason for outgoing but no incoming cases between 2013 and 2015 for these nationalities. As well as potentially identifying a service need for these communities with sister National Societies, findings may also increase the likelihood of a ‘successful’ outgoing case for these nationalities, or assist BRC in how they are able to respond to cases from these nationalities.
Service Access Officer
The Central African Republic, Pakistan, Yemen, Mexico and Nigeria
These countries are all ranked in the INFORM Global Index for Risk Management top ten for conflict, but not in the IFT top ten of 2015 conflict cases. Further research is recommended to identify whether these communities exist in the UK with an RFL need, and if so what barriers may be in existence.
Service Access Officer Areas
FNPs:
Nationalities of our existing service users are represented within the top ten nationalities of FNPs (Albanian, Somali, Nigerian) suggesting a potential need for our service within this community.
Development Officer Areas

International Family Tracing - National Overview Report 2016
33
Irregular Migrants – Victims of Trafficking:
Albania, Vietnam and Nigeria remain the most common country of origin for NRM referrals. Sudan saw the highest percentage increase in NRM referrals compared to the previous year. Whilst IFT do not collect data regarding the immigration status of beneficiaries consideration should be given when dealing with cases from these particular communities as to whether further assistance and signposting could aid with additional support.
Areas/Caseworkers
Future Needs Assessments The following nationalities have been identified within this report as having growing or potential RFL needs and therefore are recommended as communities for engagement in future Area Needs Assessments: Pakistani, Sudanese, Iraqi, Eritrean, Syrian, Ethiopian and Albanian (particularly UASC for Albanian.)
Areas

International Family Tracing - National Overview Report 2016
34
APPENDIX 1
Detailed descriptions of the barriers to using the IFT service as raised in the Area Needs Assessment 2011 – 2015.
KEYWORD BARRIER DESCRIPTION
No. AREAS (where barrier was
mentioned out of the 19 that completed the
NA process)
BRC - Organisation & Process Awareness Lack of awareness of the service 16
Location Location of BRC office 12
Christian Red Cross seen as a Christian organisation 4
Trust Trust in BRC (e.g. seen as part of UKBA) 9
Contact Lack of knowledge on how to contact BRC 2
Time Worry it takes a long time 5
Process Lack of knowledge of how tracing works 7
Trust (Sister National Society) Trust (in sister National Society) 9
Confidentiality Worries about confidentiality 7
Judgement Fear of being judged by BRC (e.g. for not trying to trace family sooner) 1
Personal
Language Language and literacy 10
Safety Worry about safety (of self and family members) 8
Intimidated Intimidated by a large organisation 3
Psychosocial Psychosocial reasons (e.g. enquirers may want to avoid reminders of past trauma; fearful of outcome) 2
Social
Stigma
Concerns over the stigma that might be attached to family in the home country over visits from outsiders (e.g. Red Cross volunteers). 2
Community Expectations Community expectations (e.g. that enquirer uses community’s own routes, or maintains family contact). 2

International Family Tracing - National Overview Report 2016
35
APPENDIX 2
Full list of the solutions to barriers identified in Area Needs Assessments 2011 to 2015.
RAISE AWARENESS, MEDIA & PROMOTION
Advertising & Promotion on/in:
Social media - particularly Facebook
Websites & forums
National community media (Apparently most community based media are national rather than local so important to do national outreach as well)
Local/community media (radio/TV/web/newspapers)
Free papers (Metro)
Radio broadcasts (To target those with low literacy levels
Specific places to target posters/leaflets/presentations/info sessions
Schools/Children centres/Youth centres/After school clubs
Shops (In particular hair salons, barbers & nail shops mentioned by the Zimbabwe community in Yorkshire
Referral organisations
GPs
ESOL classes
Religious institutions
CLEAR training facilities
Sure Start Centres
Drop-in centres
Counselling sessions/mental health support groups
Food banks
Community project workshops
Ethnic Minority and Traveler Achievement Service (EMTAS)
Shops selling international phone cards & on the phone cards
Libraries
Job Centres
Organisations that work with refugees, migrants, unaccompanied minors, homeless people, destitute asylum seekers, people living with HIV/AIDS, community organisations.
Presentations to other organisations & local authorities
Solicitors & social workers (address trust issues)
Build community relations:
Faith group leaders and community organisations
Network & engagement in local area
Engaging relevant communities locally
Importance of face-to-face/spread the word directly within community (low levels of literacy)
Local events (including black history month)
Hold community information sessions & workshops

International Family Tracing - National Overview Report 2016
36
MARKETING MATERIALS & MESSAGING
Materials
Language specific leaflets & posters (One area specifically mentioned Albanian, Shona and Sorani Kurdish, Swahili, Kikongo, French and Lingala)
Integrated leaflets including other BRC services (especially for referral orgs)
Posters
Ensure stand out - lots of organisations will have leaflets/posters in the places we're targeting
Case studies
Red Cross stories to go on referral organisation & Local Authority news bulletins
IFT presentations for clients & organisations
Alternatives to printed materials for illiterate - audio and visual:
* Radio
* Presentations
* Face to face/workshops/info sessions
Messaging
Free service
Independent from Government
Confidential
Explain how the service works
Make it clear that interpreters are available
Contact details
Drop in time & locations
Include cross and the crescent emblems
LOCATION
Improve visibility of BRC offices
BRC assist with travel costs
Interviews could be held in local libraries (meeting rooms)
PROCESS
Tracing form confidentiality statement - clear, simple and plain language
Interpreters to sign code of conduct including confidentiality clause (show to beneficiaries)
Telephone interpreting can be more appropriate as more anonymised.
Updates should be every 3 months (not 6)
STAFF/VOLUNTEERS
Train other community workers (ambassadors)
Train and certificated red cross ambassadors
Recruit volunteers who:
* have good understanding of specific cultures
* have good understanding of local councils
* have good understanding of community voluntary organisations
* are from specific communities