international finance - nyu
TRANSCRIPT

International Finance
Chris EdmondNYU Stern
Spring 2008
1
Today
• International capital flows
– balance of payments accounting– trade in goods and services vs. trade in assets– are large deficits sustainable?
• Exchange rates
– nominal vs. real– purchasing power parity (PPP)– covered and uncovered interest parity (CIP and UIP)– currency carry trade– fixed vs. floating exchange rate regimes
2
Terminology
• Trade balance
– balance on merchandise trade (‘goods’)– balance on goods and services (‘net exports’)
• Current account balance
– current account = net exports + net foreign income– net foreign income includes
* capital income* labor income* taxes and transfers
– current account measures change in net foreign assets
3
Current account, 2007
Category amount (billions)Net exports of goods −815Net exports of services 107Net labor income 74Net capital income −6Net taxes and transfers −104
Current account −744
4
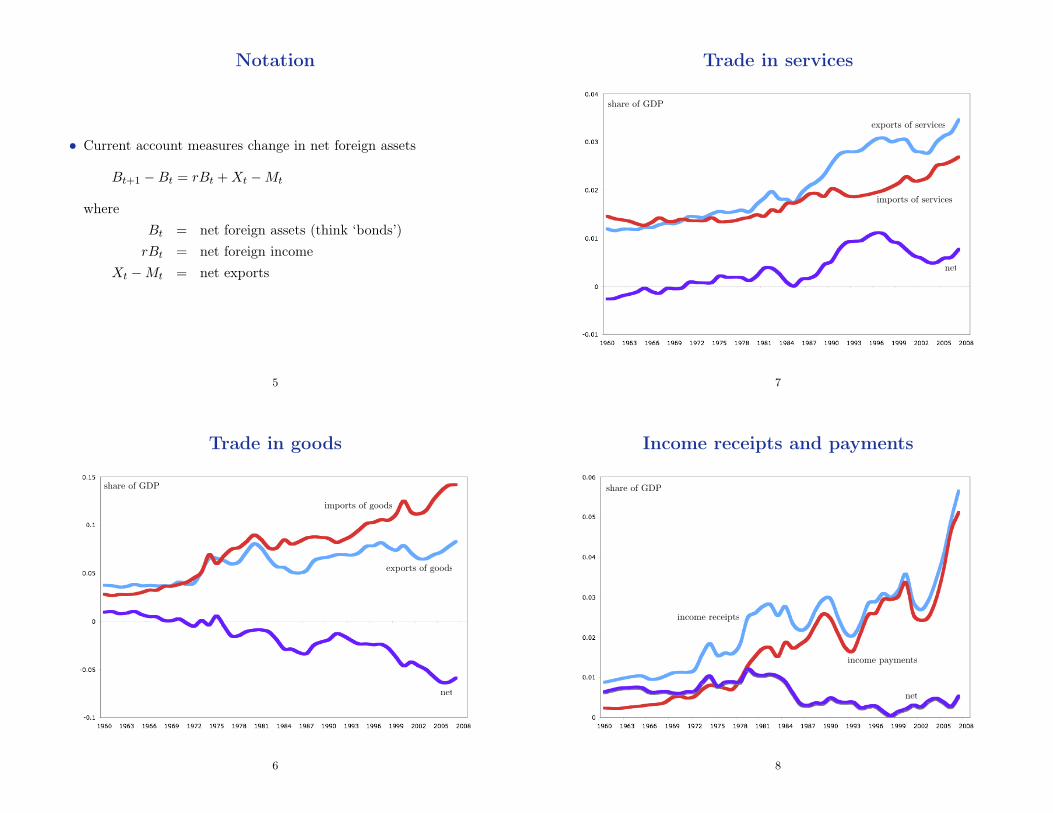
Notation
• Current account measures change in net foreign assets
Bt+1 −Bt = rBt + Xt −Mt
whereBt = net foreign assets (think ‘bonds’)
rBt = net foreign incomeXt −Mt = net exports
5
Trade in goods
share of GDP
imports of goods
exports of goods
net
6
Trade in services
share of GDP
net
exports of services
imports of services
7
Income receipts and payments
share of GDP
net
income receipts
income payments
8

Current account
share of GDP
net goods
current account
net servicesnet income
net transfers etc
9
Summary
• As a share of GDP, the US runs
– large goods deficit– modest services surplus– modest net capital and labor income surplus
• Implies
– trade deficit ≈ current account deficit
10
Financing the deficit
• How is a current account deficit financed?
– by selling assets to foreigners
• Trade in assets
– direct investment (controlling interest)– portfolio investment
* purchases of government securities* purchases of corporate equity or securities* bank and non-bank loans
11
Capital and financial account
• Capital account includes
– net direct investment– net portfolio investment– net government transactions (gold, international reserves, etc)
• Current and capital accounts balance
current account + capital & financial account = 0
(up to a statistical discrepancy)
• Suggests an alternative perspective
– current account deficit ⇒ domestic investment > savings– perhaps deficit ⇒ domestic investment opportunities are good
relative to rest of world
12
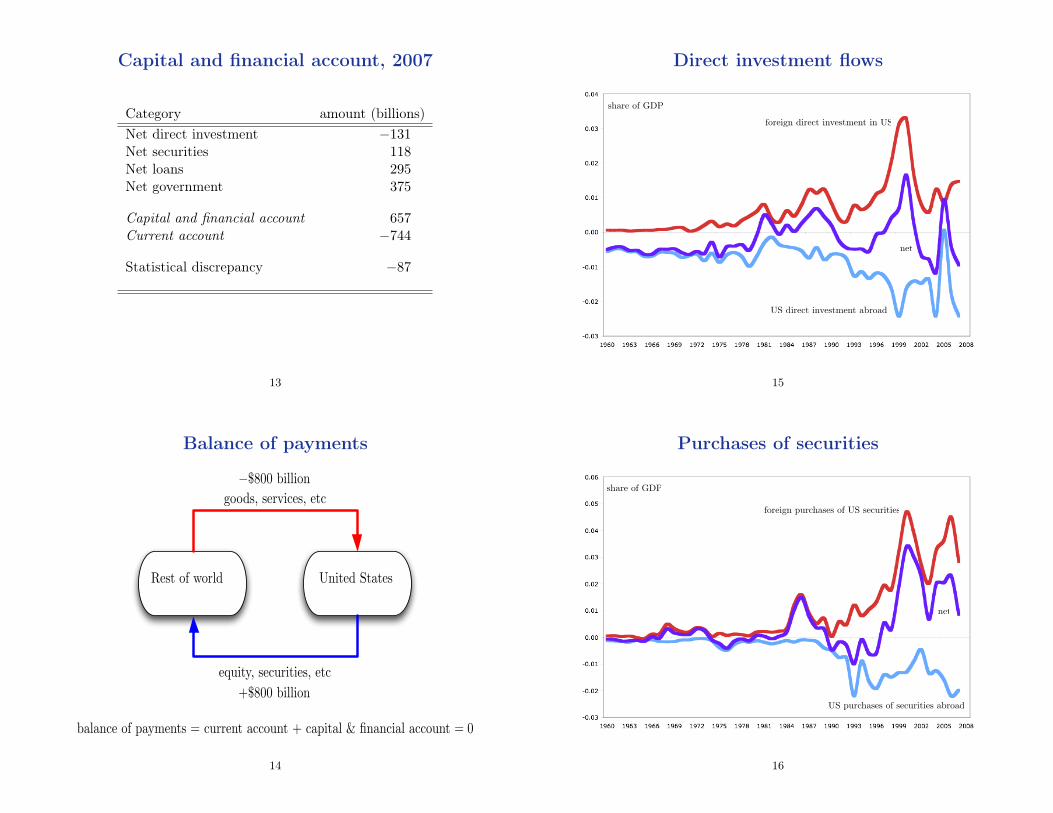
Capital and financial account, 2007
Category amount (billions)Net direct investment −131Net securities 118Net loans 295Net government 375
Capital and financial account 657Current account −744
Statistical discrepancy −87
13
Balance of payments
goods, services, etc
equity, securities, etc
United StatesRest of world
+$800 billion
−$800 billion
balance of payments = current account + capital & financial account = 0
14
Direct investment flows
share of GDP
net
US direct investment abroad
foreign direct investment in US
15
Purchases of securities
share of GDP
foreign purchases of US securities
US purchases of securities abroad
net
16

Purchases of government assets
share of GDP
US purchases of government abroad
foreign purchases of US government
17
Balance of payments
share of GDP
capital & financial account surplus
current account deficit
18
Net foreign assets
• Current/capital account measure international capital flows
• Add up current/capital accounts over time to get asset position
assets = US claims on foreign countriesliabilities = foreign claims on US
net foreign assets = assets − liabilities
19
US claims abroad (assets)
share of GDP
govt
direct investment
loans
corporate equity
corporate bonds
20

Foreign claims on US (liabilities)
share of GDP
direct investment govt
corporate equity
loanscorporate bonds
21
Net foreign assets
share of GDP
net foreign assets
US claims abroad(assets)
foreign claims on US(liabilities)
22
Is the US in trouble?
• Two perspectives
– pessimistic: current account deficit because low savings, debtburden will grow, consumption will have to fall in future
– optimistic: capital account surplus because US good place to invest,large flow of savings from low-growth countries(‘global savings glut’)
23
Is the US in trouble?
• Sustainability analysis, same as with fiscal policy
• Net foreign assets/output ratio follows
bt+1 − bt =r − g
1 + gbt +
11 + g
(xt −mt)
where x−m is net exports/output ratio
• Steady state
b = − 1r − g
(x−m)
24

Is the US in trouble?
• Steady state net foreign assets/GDP ratio
b = − 1r − g
(x−m)
• Example: US net foreign assets/GDP is −0.35. If r = 0.05 andg = 0.02, what trade surplus is needed to sustain this indefinitely?
• Answer
x−m = −(r − g)b= (0.05− 0.02)0.35= 0.0105
• A surplus of more than 1% of GDP. But currently, deficit of 5% ofGDP. Something has to give. What?
25
What have we learned so far?
• Balance of payments accounting
– current account = net exports + net foreign income– current account + capital & financial account = 0
(deficit financed by selling assets)
– net foreign assets = sum of past current accounts
• Two perspectives on current account deficit
– pessimistic: US isn’t saving enough, so has to sell assets– optimistic: foreign countries are growing too slow, US is a
great place to invest
26
Exchange rates
• Nominal vs. real exchange rates
• Purchasing power parity (PPP)
• Covered and uncovered interest parity (CIP and UIP)
• Currency carry trade
• Fixed vs. floating exchange rate regimes
27
Nominal exchange rates
• Relative price of two currencies
• Level or change affect most international business transactions
– profits in euros = how many dollars? (‘level’)– return on euro bonds = what return on dollar bonds? (‘change’)
• Very volatile, ought to hedge?
28

Terminology/notation
• Bilateral spot exchange rate, e
• By convention: local currency price of foreign currency
• Example:
if 1.23 dollars buy 1.00 euro, e = 1.23
• Counterintuitive:
↑ e⇒ dollar depreciates
(takes more dollars to buy one euro)
29
Dollar/yen nominal exchange rate
US dollars per 100 yen
30
Dollar/euro nominal exchange rate
US dollars per euro
31
Real exchange rate
• Real exchange rate adjusts for price level differences
real exchange rate ≡ eP ∗
P
wheree = nominal exchange rate, e.g., dollars per yen
P ∗ = foreign price level, e.g., Japanese CPI in yenP = domestic price level, e.g., US CPI in dollars
• Real exchange rate measures relative price of a basket of goods
– domestic basket is expensive if P > eP ∗
– foreign basket is expensive if P < eP ∗
32

‘Law of one price’
• Basic idea
– goods should sell for same price everywhere– once exchange rate taken into account
• Goods market arbitrage: for traded commodities i = 1, 2, ..., n
pi = ep∗i
if not, buy low sell high
33
Purchasing power parity (‘PPP’)
• PPP hypothesis is
P = eP ∗
‘law of one price’ for whole consumption baskets
• Implicit assumptions
– all goods and services traded– consumers in both countries have same tastes
• Other issues
– tariffs, transportation costs– monopoly power, price discrimination
34
Purchasing power parity (‘PPP’)• PPP hypothesis is
P = eP ∗ ⇔ real exchange rate = 1
• Often people say
‘domestic currency is overvalued’⇔ P > eP ∗
• Empirical tests look at weaker implication
∆ log(P ) = ∆ log(e) + ∆ log(P ∗) = 0
or
∆ log(e) = π − π∗
If so, exchange rate depreciates when domestic inflation is greaterthan foreign inflation
35
PPP evidence
year-on-year rate of change
inflation differential
Japanese inflation
US inflation
36

PPP evidence
year-on-year rate of change
change in US dollars per yen
37
PPP works better for high inflation countries
!
"#
$#
"##
!%###
"%###
&'()*+,-./,-0'((+,
#
1#
!##
2/,3/45+6/
!7819! !77#9! !7719! "###9! "##19!-
:;3<+46/-=+5/-0/.,/3)+5)'4 >4?(@-0)??/,/45)+(
:;3<+46/-=+5/-A('6-B3+(/-!-,)6<5C
>4?(+5)'4-0)??/,/45)+(-+4D-&'()*+,EB-0/.,/3)+5)'4
38
Summary
• Countries with low inflation
– PPP fails badly, especially at short horizons– inflation differentials smooth but exchange rates volatile
• Countries with high inflation
– PPP works much better– depreciation reflects relatively high domestic inflation
39
Exchange rates and interest rates
Country/region 3-month interest rates (%)Argentina 10.69Australia 7.81Brazil 11.64China 4.49Euro area 4.83India 7.21Japan 0.75Russia 10.25Turkey 16.76United States 1.97
40

Exchange rates and interest rates
• Notationi = interest rate on domestic currency
i∗ = interest rate on foreign currencye = spot nominal exchange ratef = one-period forward nominal exchange rate
• How are these related? Two concepts
– covered interest parity (CIP)– uncovered interest parity (UIP)
41
Covered interest parity (CIP)• Buy and hold dollars
– invest one dollar in dollar asset, gives 1 + i dollars
• Or, sell euros forward
– one dollar is 1/e euros at spot rate– invest 1/e euros in euro asset, gives (1 + i∗)/e euros– sell (1 + i∗)/e euros forward at f , gives (1 + i∗)f/e dollars
• Two riskless transactions. Arbitrage should give
(1 + i) = (1 + i∗)f
eor
1 + i
1 + i∗=
f
e⇔ i− i∗ ≈ log
(f
e
)
Works well!
42
Uncovered interest parity (UIP)• Suppose we didn’t cover ourselves forward
• Convert back to dollars at spot rate. Risky return in dollars
(1 + i∗t )et+1
et
• Expectations hypothesis
ft = Et{et+1}
• Combine with covered interest parity
(1 + it) = (1 + i∗t )ft
et= (1 + i∗t )
Et{et+1}et
or1 + it1 + i∗t
= Et
{et+1
et
}
Zero expected excess return.43
Uncovered interest parity (UIP)
• Interest differentials and expected exchange rate changes
1 + it1 + i∗t
= Et
{et+1
et
}
• Implies high interest countries have exchange rates that depreciate
– doesn’t work, at least not for developed countries– high interest countries have appreciating currencies– suggests a big arbitrage opportunity– why?
44
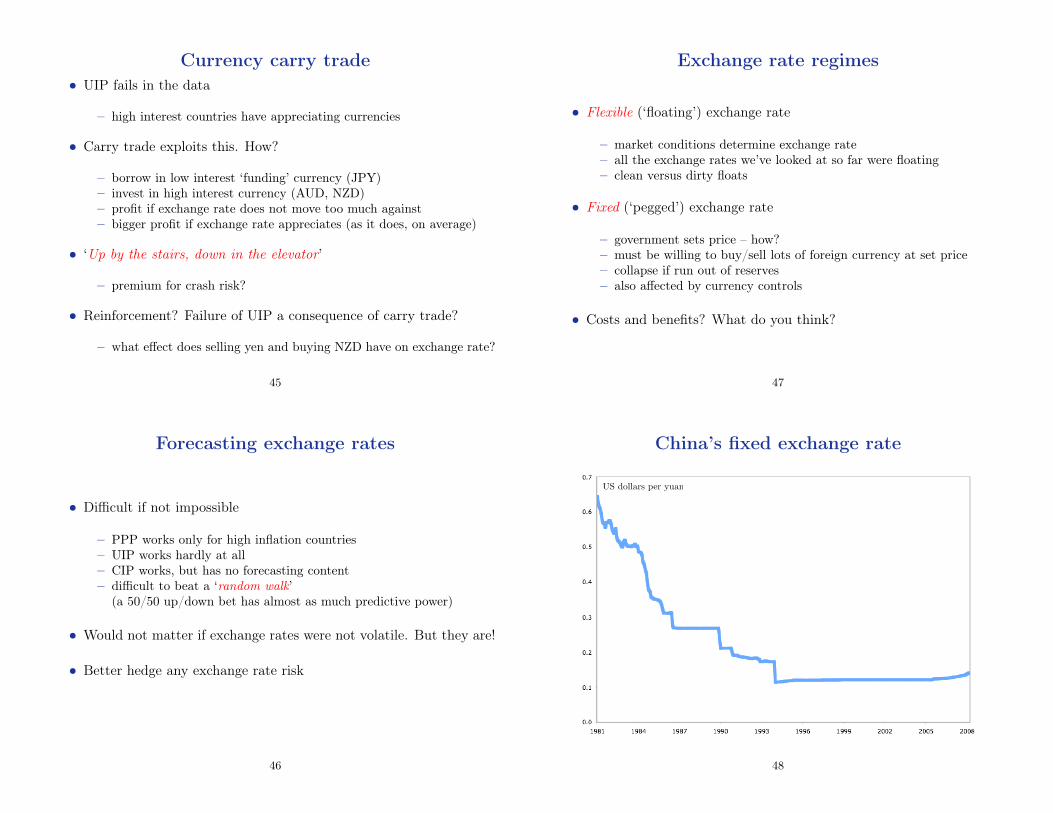
Currency carry trade• UIP fails in the data
– high interest countries have appreciating currencies
• Carry trade exploits this. How?
– borrow in low interest ‘funding’ currency (JPY)– invest in high interest currency (AUD, NZD)– profit if exchange rate does not move too much against– bigger profit if exchange rate appreciates (as it does, on average)
• ‘Up by the stairs, down in the elevator’
– premium for crash risk?
• Reinforcement? Failure of UIP a consequence of carry trade?
– what effect does selling yen and buying NZD have on exchange rate?
45
Forecasting exchange rates
• Difficult if not impossible
– PPP works only for high inflation countries– UIP works hardly at all– CIP works, but has no forecasting content– difficult to beat a ‘random walk’
(a 50/50 up/down bet has almost as much predictive power)
• Would not matter if exchange rates were not volatile. But they are!
• Better hedge any exchange rate risk
46
Exchange rate regimes
• Flexible (‘floating’) exchange rate
– market conditions determine exchange rate– all the exchange rates we’ve looked at so far were floating– clean versus dirty floats
• Fixed (‘pegged’) exchange rate
– government sets price – how?– must be willing to buy/sell lots of foreign currency at set price– collapse if run out of reserves– also affected by currency controls
• Costs and benefits? What do you think?
47
China’s fixed exchange rate
US dollars per yuan
48

China’s fixed exchange rate
• What problems might this cause?
• Does a low yuan help Chinese exports?
• Can a low yuan be sustained?
49
What have we learned today?
• International capital flows
– current account + capital & financial account = 0(deficit financed by selling assets)
– net foreign assets = sum of past current accounts– two perspectives: US not saving enough vs. great place to invest
• Exchange rates
– volatile– difficult to forecast. Really!
50