international green awards brisbane, australia 13 th august 2012 sustainability: the dollars and...
TRANSCRIPT
International Green Awards
Brisbane, Australia 13th August 2012
Sustainability: the dollars and sense
Professor Martin A. Blake DBA MBA BSc.Blake Advisory Pte Ltd., Singapore
Strategic Advisor – Moss, Australia
Strategic Advisor – Carbon Systems, Australia
© 2011 – 2012 Blake Advisory Pte. Ltd.
• Personal Context
• Existing Built Environment
• Marginal Abatement Cost Curves (MACC) and IRR Curves
• Case Study 1: Royal Mail Group
• Case Study 2: National Oil Company, Persian Gulf
• New Buildings• Integrated Design Process
• Case Study: United World College of South-East Asia
• The Blue Economy
• A Case Study Example
© 2011 – 2012 Blake Advisory Pte. Ltd.

• I am not a full time academic - but I have developed theory• I have delivered big projects and employed consultants• I have delivered internationally recognized energy projects• I have significant Board level experience with fiduciary
duties• I speak the language of business in a sustainability context• I love disrupting the status quo when it doesn’t work!
Personal Introduction
New Paradigm Assumptions
• “Positive Deviancy” necessary to challenge herd mentality• “C” words unnecessary! However, metrics are unequivocal• Sustainability projects can exceed core business IRR• Transactional vs. Transformational Paradigm
© 2011 – 2012 Blake Advisory Pte. Ltd.
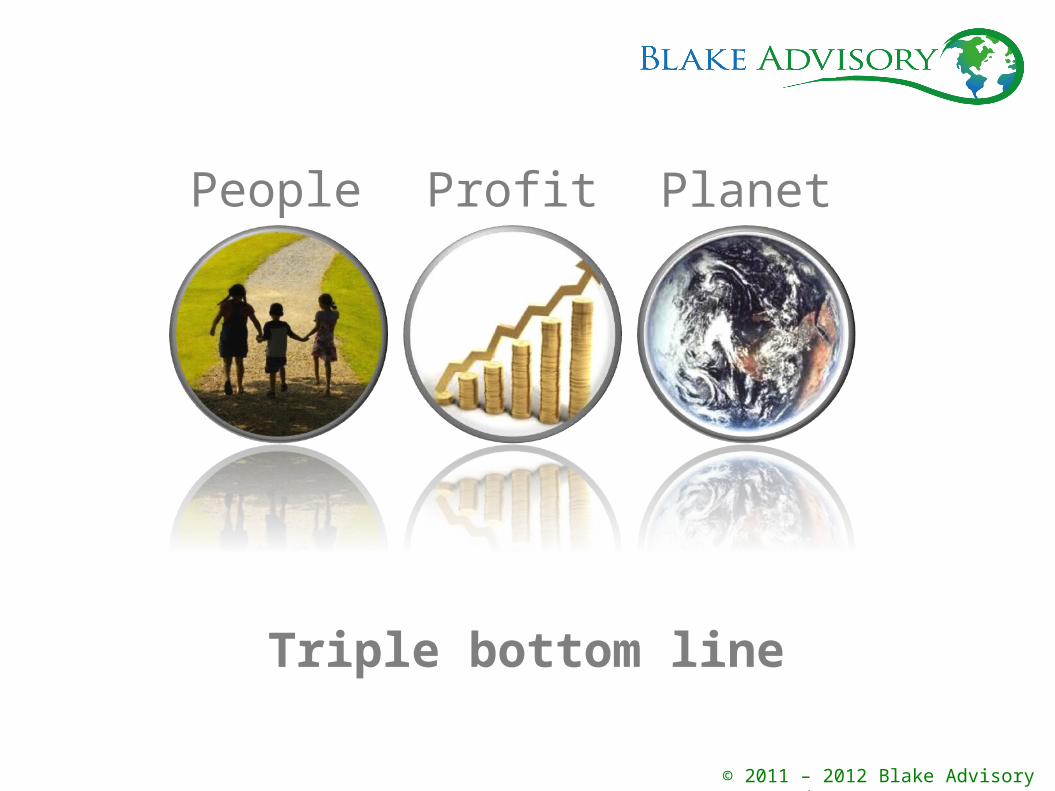
People Profit Planet
Triple bottom line
© 2011 – 2012 Blake Advisory Pte. Ltd.

The Business Case
• Environmental impact • Capital cost• Consultancy fees• Oversized servicing systems• Risk• Operating costs• Maintenance costs• Reliance on fossil fuels
REDUCE
© 2011 – 2012 Blake Advisory Pte. Ltd.

The Business Case
• Systems integration• Investor value• Customer interest• Property value• Profit margins• Resilience against future energy and water prices and volatility
INCREASE
© 2011 – 2012 Blake Advisory Pte. Ltd.

• De-bunking myths – there are significant paybacks!
• You cannot create business cases without disaggregated data
• Energy needs to be performance managed, not reported
• KPI’s and devolvement of P&L Accountability key
• Too many choices, technologies, manufacturers, derivatives, and therefore risks creates information overload and organisational paralysis!
• Ranking projects methodically brings clarity
• The use of Marginal Abatement Cost Curves and IRR Curves
Existing Buildings – Retrofit and Refurbishment
© 2011 – 2012 Blake Advisory Pte. Ltd.
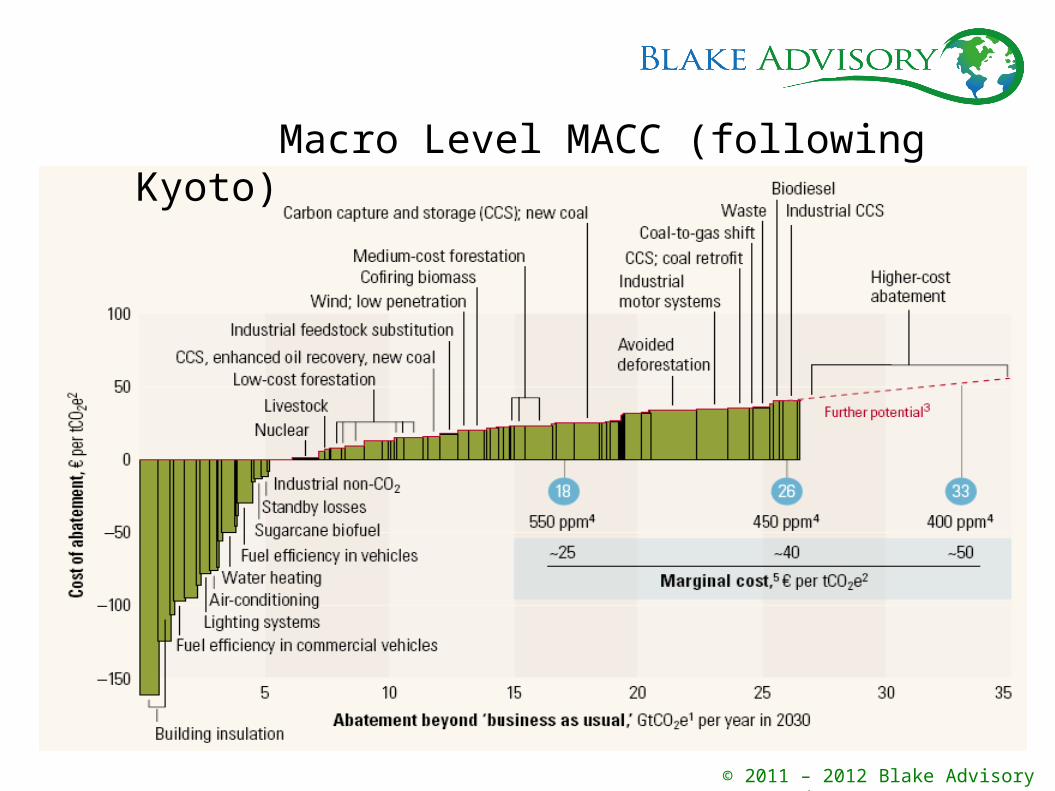
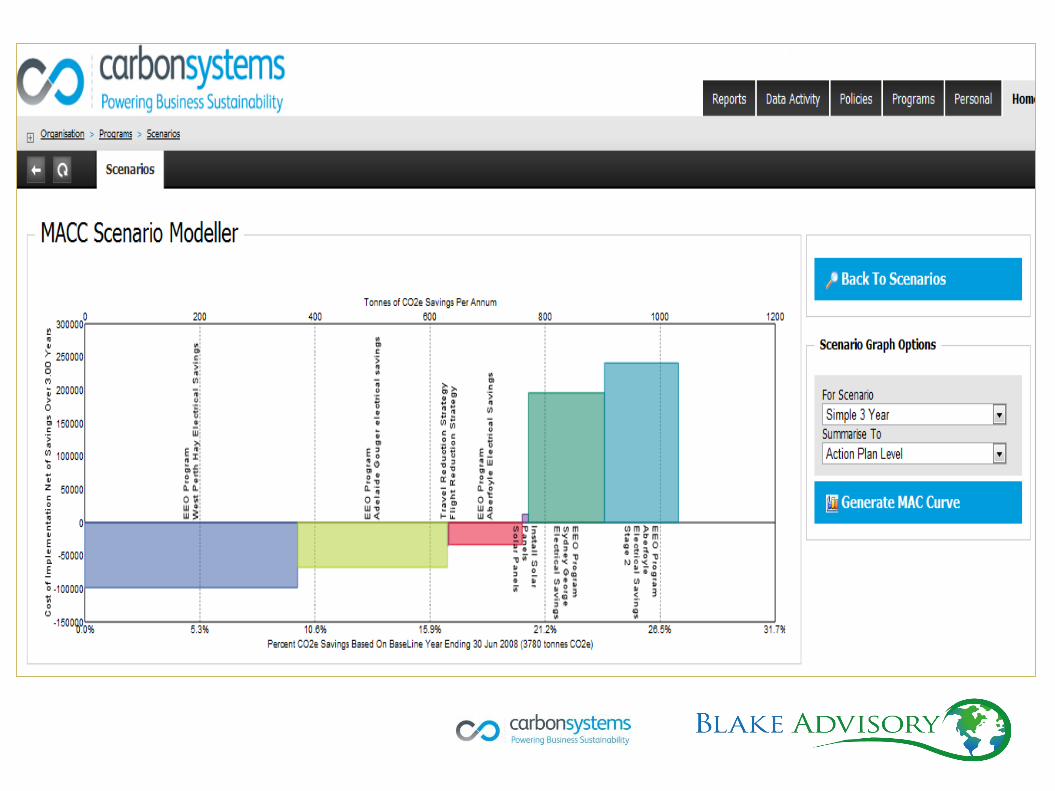
Macro Level MACC (following Kyoto)
© 2011 – 2012 Blake Advisory Pte. Ltd.
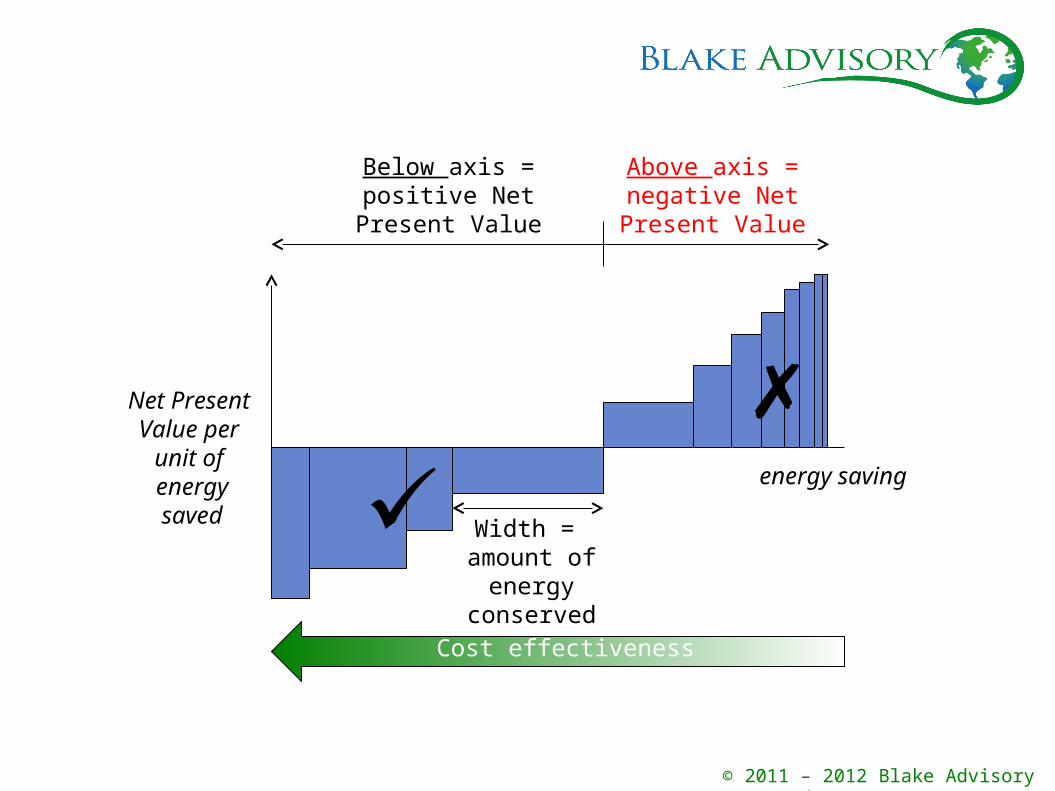
Cost effectiveness
Width = amount of energy
conserved
Below axis = positive Net
Present Value
Above axis = negative Net
Present Value
Net Present Value per
unit of energysaved
energy saving
✗✓
© 2011 – 2012 Blake Advisory Pte. Ltd.
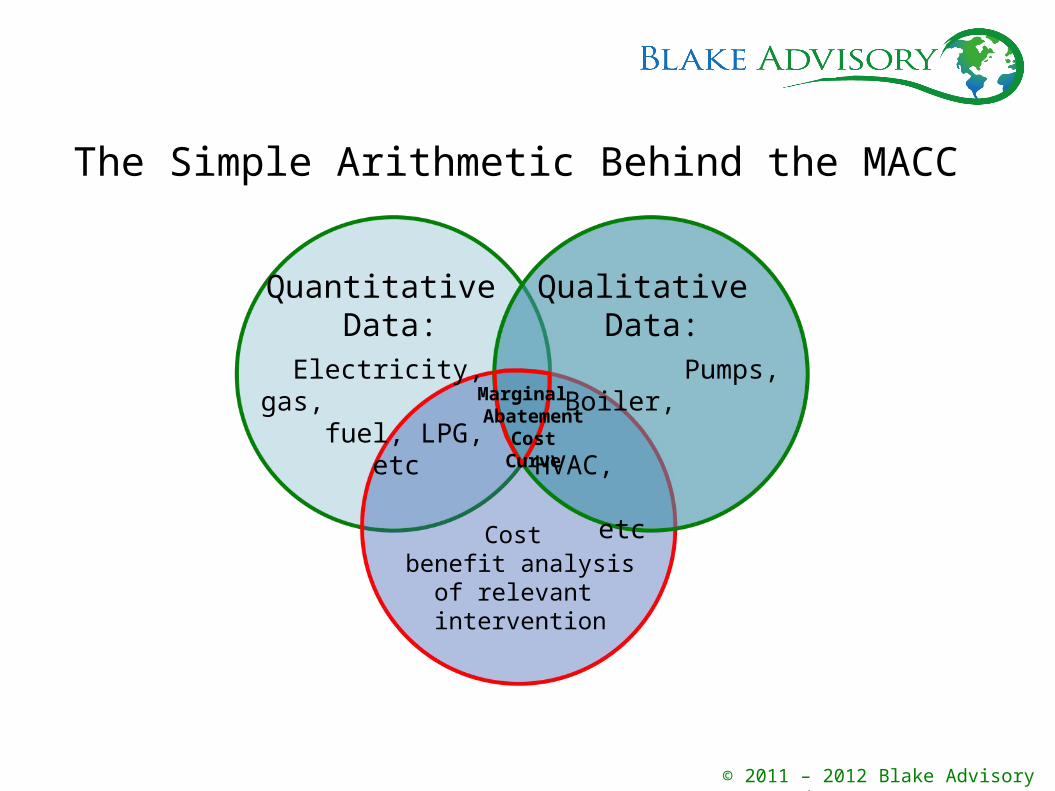
Qualitative Data:
Pumps, Boiler,
HVAC, etc
Quantitative Data:
Electricity, gas, fuel, LPG, etc
Cost benefit analysis
of relevant intervention
Marginal Abatemen
t Cost Curve
The Simple Arithmetic Behind the MACC
© 2011 – 2012 Blake Advisory Pte. Ltd.
Marginal Abatement Cost Curves andCumulative IRR Curves• Provides absolute clarity with a highly compelling business
case
• Creates project rankings based on NPV
• Unequivocal disclosure of ROI, IRR, PBP etc…
• Therefore, creates sophisticated tool to get Board approval
• Can be the basis of public disclosure on sustainability
• Discloses fiduciary duty to deploy
• Risks to deployment can be entered into corporate risk register
• Mitigates multiple risks and creates opportunities with a single strategy © 2011 – 2012 Blake Advisory Pte.
Ltd.

DATA
DATA
DATA
© 2011 – 2012 Blake Advisory Pte. Ltd.
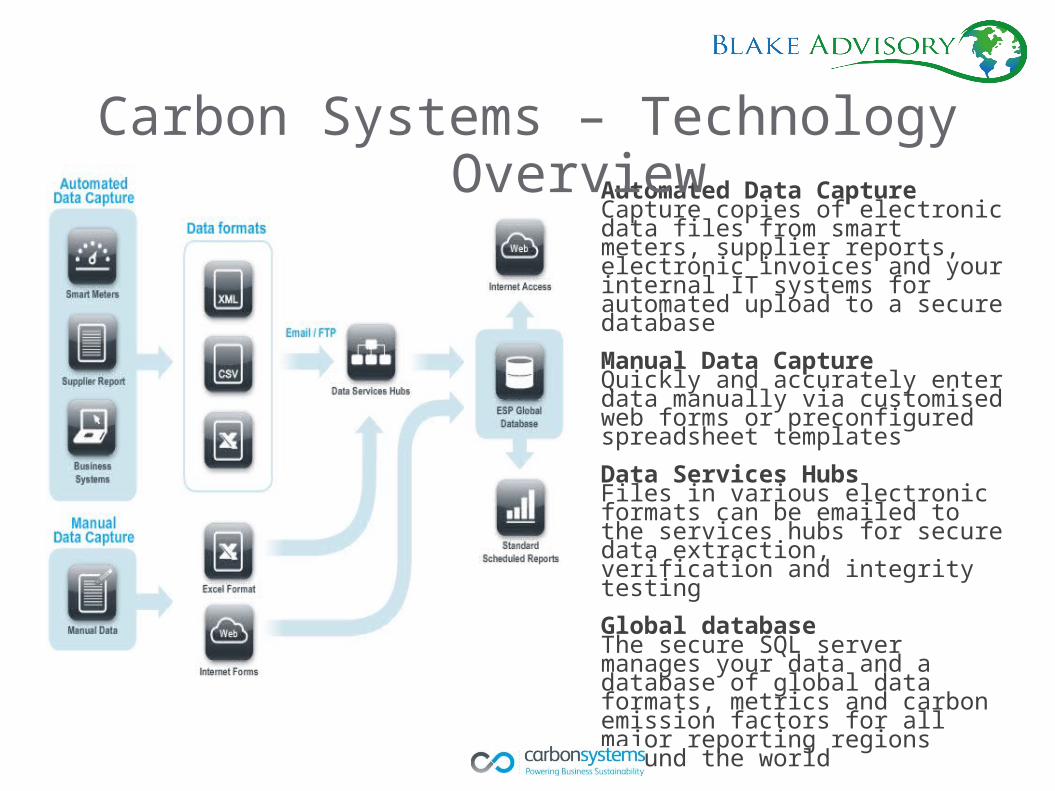
Automated Data CaptureCapture copies of electronic data files from smart meters, supplier reports, electronic invoices and your internal IT systems for automated upload to a secure database
Manual Data CaptureQuickly and accurately enter data manually via customised web forms or preconfigured spreadsheet templates
Data Services HubsFiles in various electronic formats can be emailed to the services hubs for secure data extraction, verification and integrity testing
Global databaseThe secure SQL server manages your data and a database of global data formats, metrics and carbon emission factors for all major reporting regions around the world
Carbon Systems – Technology Overview

Case Study 1:
Royal Mail Group
Real empirical case study75 National and International Awards
Most successful Energy Reduction Programme in Europesaving £30 million in fuel and energy costs per annum
© 2011 – 2012 Blake Advisory Pte. Ltd.
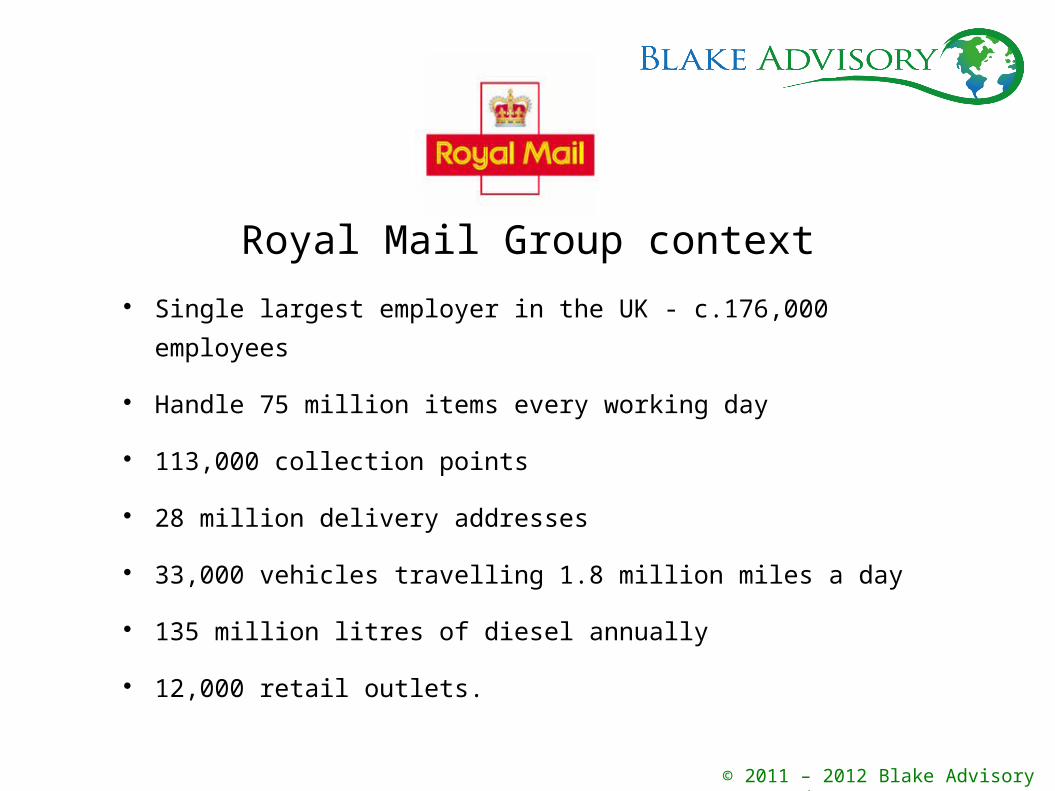
Royal Mail Group context Single largest employer in the UK - c.176,000
employees
Handle 75 million items every working day
113,000 collection points
28 million delivery addresses
33,000 vehicles travelling 1.8 million miles a day
135 million litres of diesel annually
12,000 retail outlets.
© 2011 – 2012 Blake Advisory Pte. Ltd.
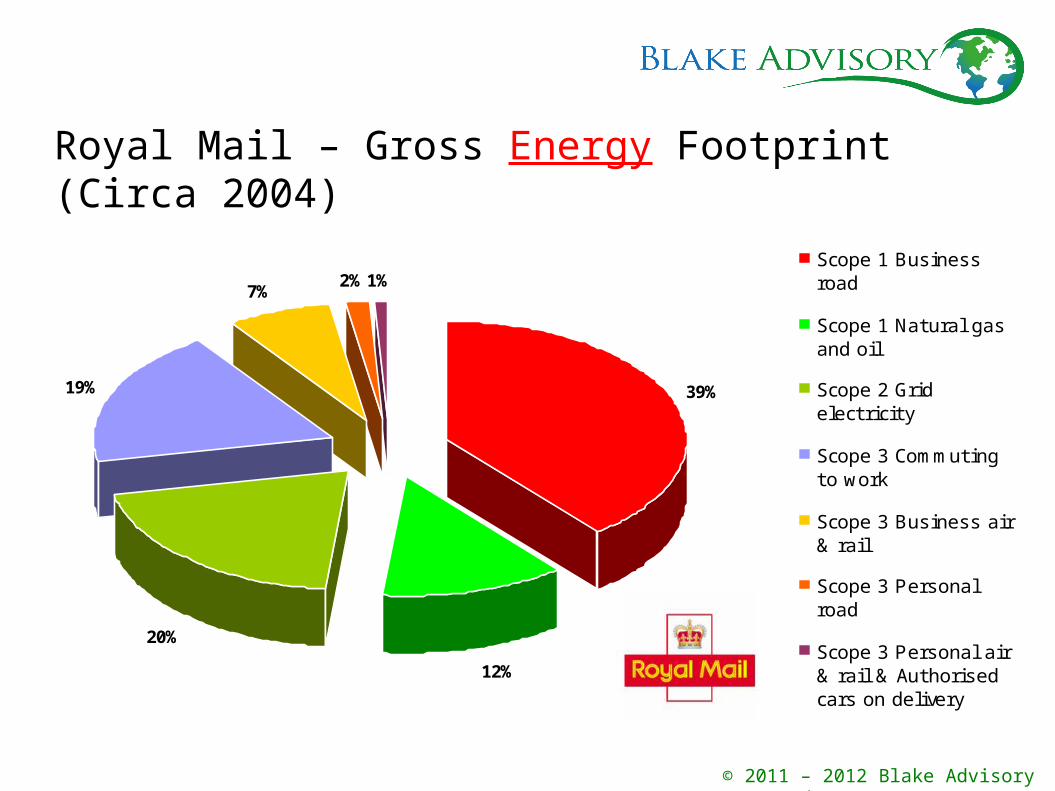
39%
12%
20%
19%
7%2%1%
Scope 1 Businessroad
Scope 1 Natural gasand oil
Scope 2 Gridelectricity
Scope 3 Commutingto work
Scope 3 Business air& rail
Scope 3 Personalroad
Scope 3 Personal air& rail & Authorisedcars on delivery
Royal Mail – Gross Energy Footprint (Circa 2004)
© 2011 – 2012 Blake Advisory Pte. Ltd.
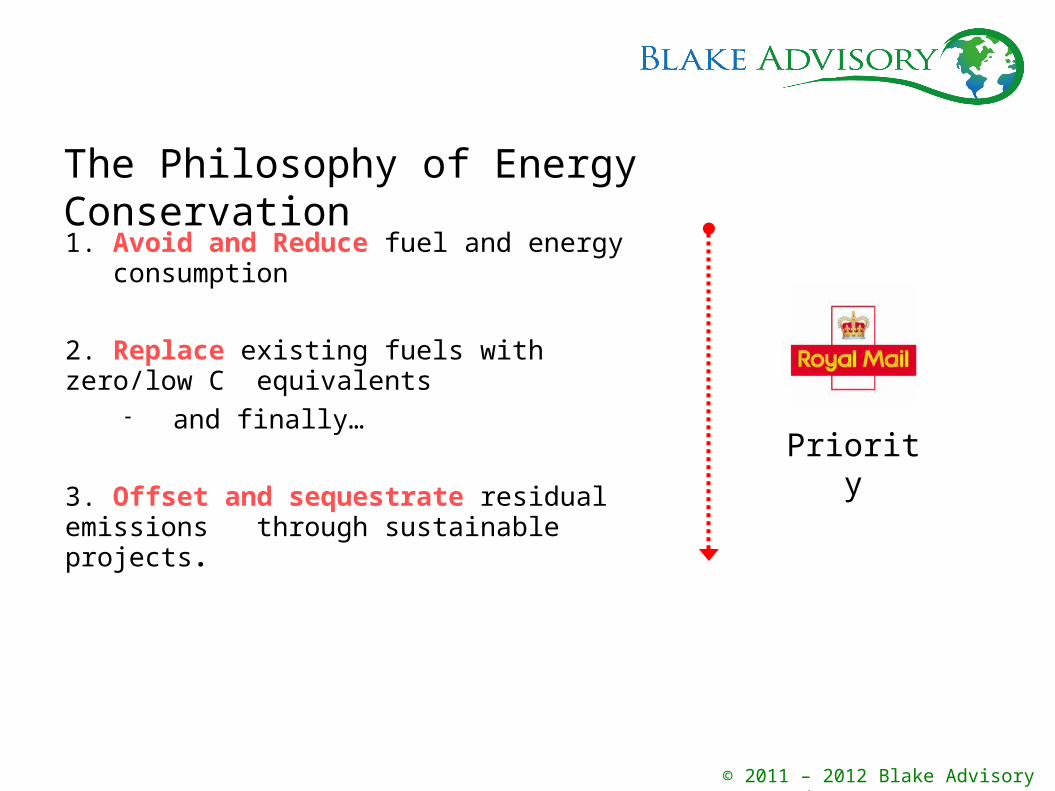
1. Avoid and Reduce fuel and energy consumption
2. Replace existing fuels with zero/low C equivalents and finally…
3. Offset and sequestrate residual emissions through sustainable projects.
Priority
The Philosophy of Energy Conservation
© 2011 – 2012 Blake Advisory Pte. Ltd.
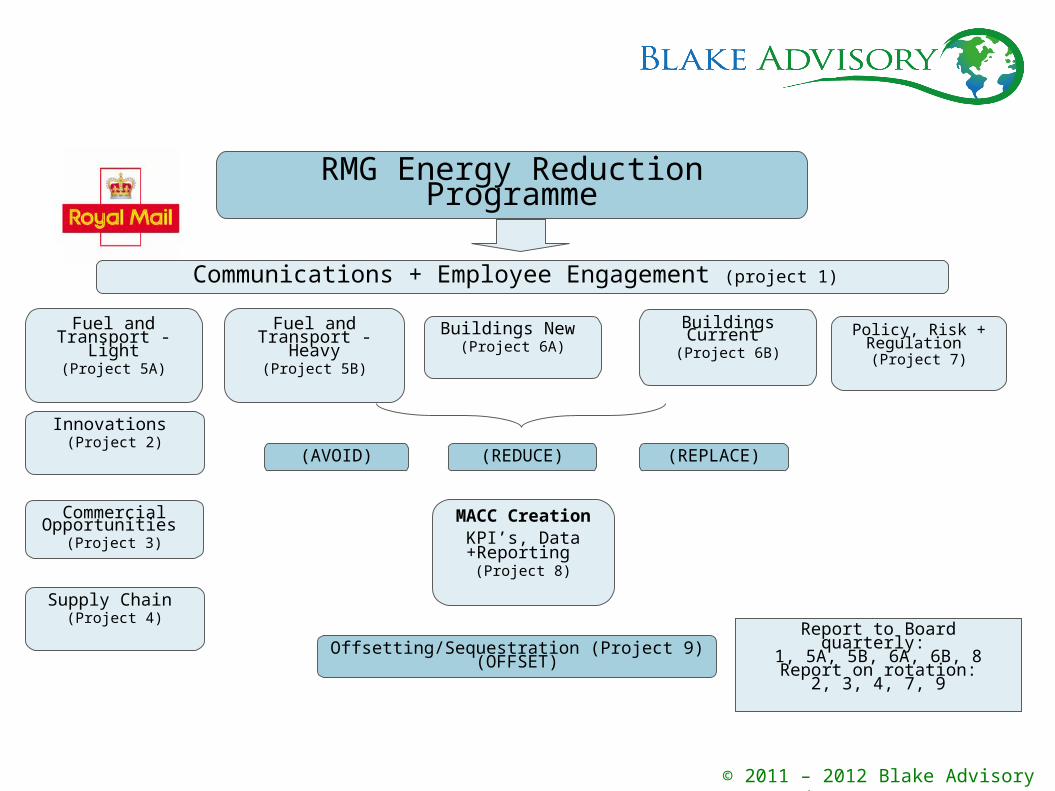
RMG Energy Reduction Programme
Communications + Employee Engagement (project 1)
Buildings Current (Project 6B)
Policy, Risk + Regulation (Project 7)
Fuel and Transport - Light
(Project 5A)
Fuel and Transport - Heavy
(Project 5B)
Buildings New (Project 6A)
(REDUCE)
Offsetting/Sequestration (Project 9)(OFFSET)
Supply Chain (Project 4)
Commercial Opportunities
(Project 3)
Innovations (Project 2)
MACC CreationKPI’s, Data +Reporting
(Project 8)
(AVOID)
Report to Board quarterly: 1, 5A, 5B, 6A, 6B, 8Report on rotation:
2, 3, 4, 7, 9
(REPLACE)
© 2011 – 2012 Blake Advisory Pte. Ltd.
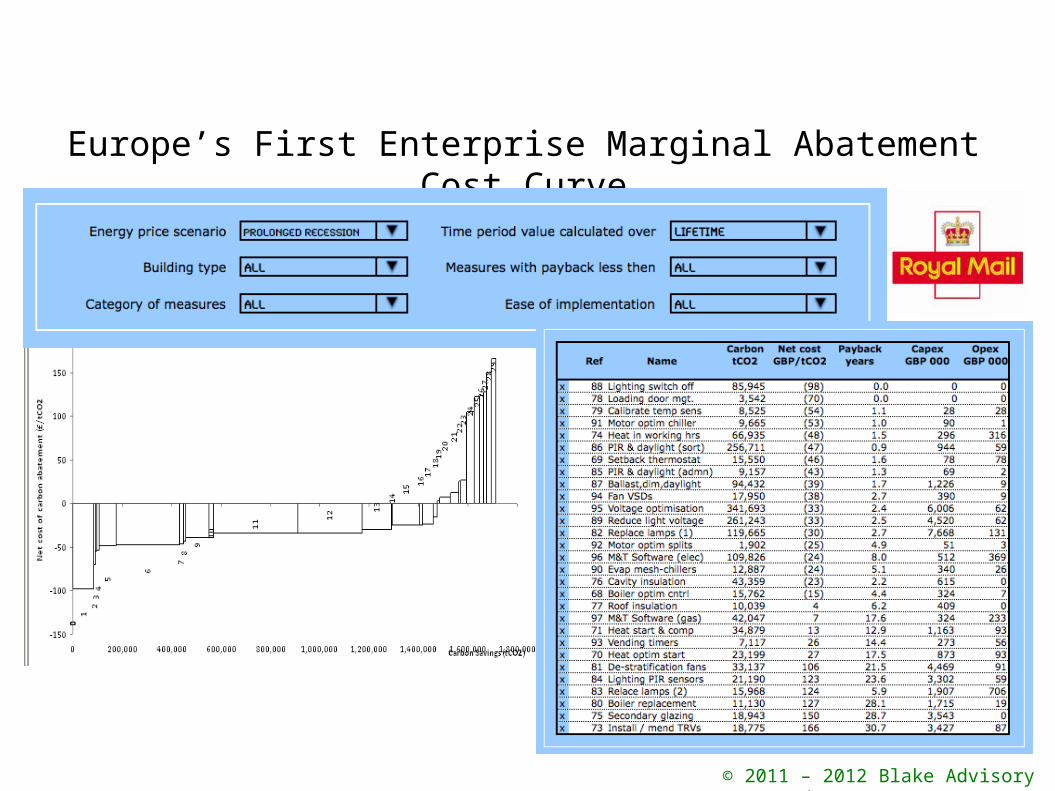
Europe’s First Enterprise Marginal Abatement Cost Curve
© 2011 – 2012 Blake Advisory Pte. Ltd.

Not just for Buildings!!Apply the Same methodology to Transport
and Logistics
© 2011 – 2012 Blake Advisory Pte. Ltd.
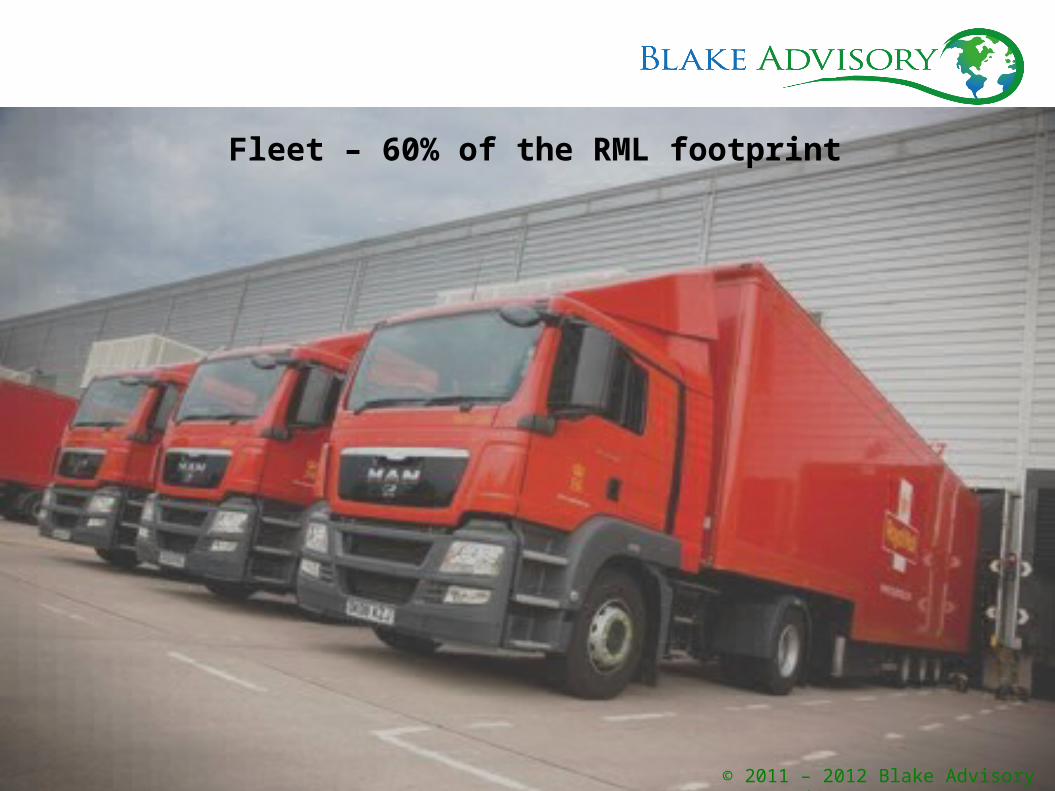
Fleet – 60% of the RML footprint
© 2011 – 2012 Blake Advisory Pte. Ltd.
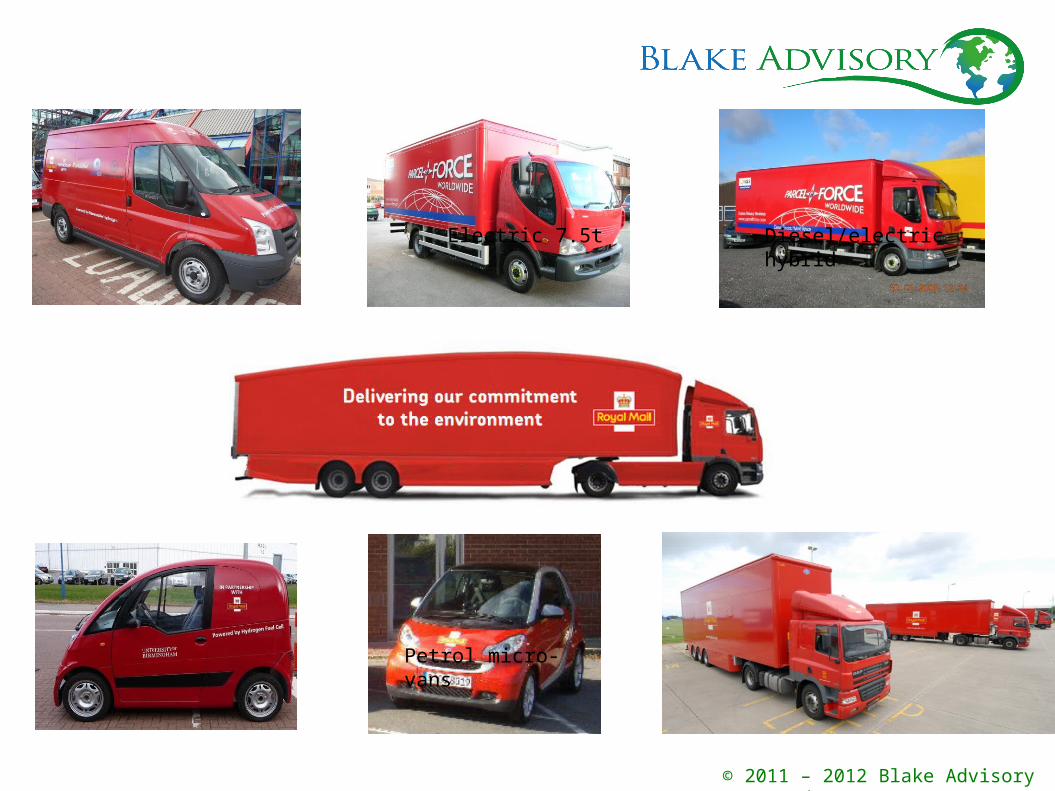
Electric 7.5t Diesel/electric hybrid
Double deck trailer
H 2 - ICE conversions
H2 Fuel Cell Petrol micro-vans
© 2011 – 2012 Blake Advisory Pte. Ltd.

Car Derived Small Panel Medium Panel Large Panel Sml People Carrier
Nos. 15,197 4,538 1,277 1,558 1,253Miles p.a. 14,000 17,000 16,500 21,500 13,000Lifecycle yrs: 3 4 4 4 3
Crew/Post Bus Heavy Small Heavy Medium Heavy Large Trailers
Nos. 3,257 2,191 345 1,351 2,448Miles p.a. 10,500 48,000 54,000 83,000 Lifecycle yrs: 5 5 5 4 7
© 2011 – 2012 Blake Advisory Pte. Ltd.

Co2 by Vehicle Type
© 2011 – 2012 Blake Advisory Pte. Ltd.

Transport MAC Curve
£800£750£700£650£600£550£500£450£400£350£300£250£200£150£100
£0 £50-£50
-£100200 400 600 800 1000 1200 1400 1600 1800 2000 2200 2400 2600 2800
Cos
t / t
CO
2 sa
ved
WTW CO2 t
Vehicle Technology MAC Curve - WTW
t CO2 £ / t CO2
Trailer Aero Kit 71 -111LGV Tractor Methane † 898 £1LGV Rigid Methane † 611 £3LGV 7.5t Methane † 317 £18LGV 7.5t Hybrid 404 £96LGV 7.5t e 47 £221CDV Methane 76 £274CDV e 60 £280LGV Rigid Hybrid 147 £327CDV Hybrid - Full 11 £651
† Technology not yet in production
© 2011 – 2012 Blake Advisory Pte. Ltd.
Case Study 2:
National Oil Company,Persian Gulf
in association with Booz & Co.
Demonstrating how to eliminate 16mt of Carbon and add USD $1 billion a year to the
profit margin with an IRR of 14%!
© 2011 – 2012 Blake Advisory Pte. Ltd.

Abatement PotentialMt CO2e
CCS w/ EOR
Flare gas recovery
Optimization of steam systems
Optimization of motor systems
Optimization of motor systems
Optimization of motor systems
O&M optimization and continuous emission control program
O&M optimization and continuous emission control program
O&M optimization and continuous emission control program
Optimization of motor systems
Optimization of heater/ furnace/ burner/ boiler / combustion efficiency
O&M optimization and continuous emission control program
Flare gas recovery
Optimization of heater/ furnace/ burner/ boiler / combustion efficiency
Optimization of heater/ furnace/ burner/ boiler / combustion efficiency
Optimization of heater/ furnace/ burner/ boiler / combustion efficiency
Site-wide process integration and optimization of heat requirements
Site-wide process integration and optimization of heat requirements
Flare gas recovery
Replace captive small-scale power generation with grid power
Capture and use CO2 as feedstock in urea processing
CO2 capture from hydrogen plant
Quantify savings opportunitiesFor each initiative, the abatement potential was calculated and costed…
Abatement CostUSD$ per tCO2e
Company-Wide Marginal Abatement Cost Curve 2030Abatement opportunities
© 2011 – 2012 Blake Advisory Pte. Ltd.
Op
tim
izat
ion
of
stea
m s
yste
ms
O&
M o
pti
miz
atio
n a
nd
co
nti
nu
ou
s em
issi
on
co
ntr
ol
pro
gra
m
Op
tim
izat
ion
of
mo
tor
syst
ems
(co
mp
ress
ors
, pu
mp
s, f
ans,
etc
.)
Op
tim
izat
ion
of
hea
ter/
fu
rnac
e/ b
urn
er/ b
oile
r /
com
bu
stio
n e
ffic
ien
cy
Fla
re g
as r
eco
very
CO
2 ca
ptu
re
fro
m
hyd
rog
en
pla
nt
Sit
e-w
ide
pro
cess
in
teg
rati
on
an
d
op
tim
izat
ion
of
hea
t re
qu
irem
ents
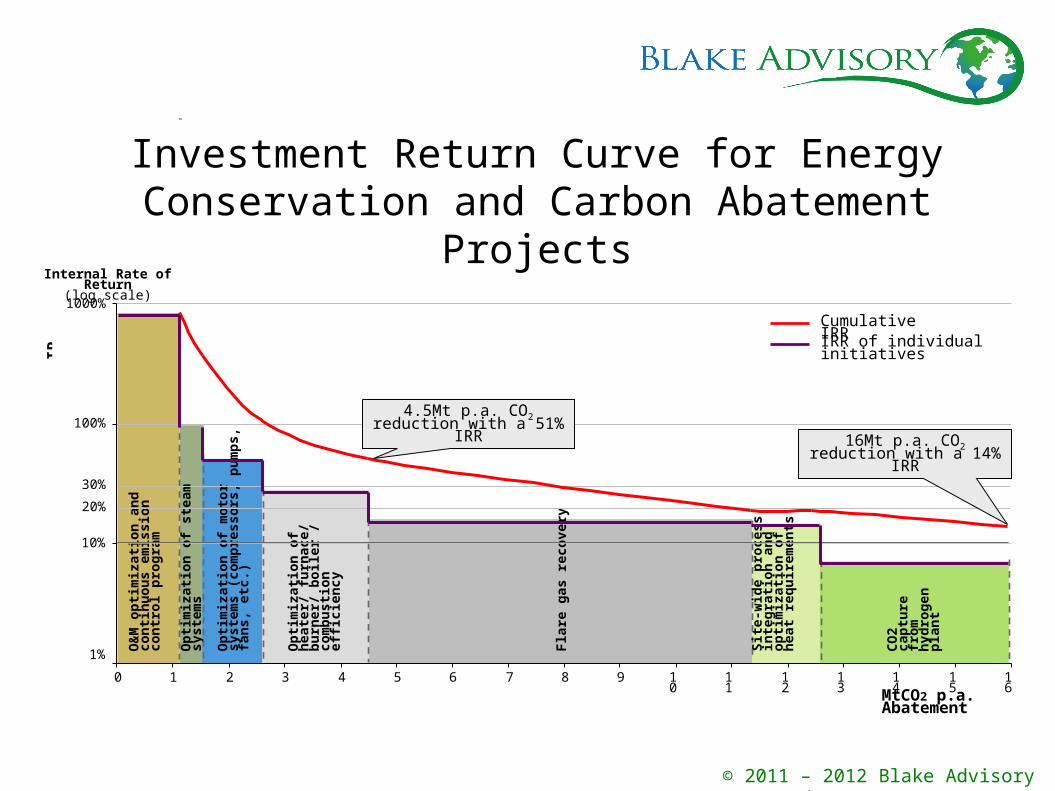
MtCO2 p.a. Abatement
IR R
Cumulative IRRIRR of individual initiatives
20%
30%
Internal Rate of Return(log scale)
1%
10%
100%
1000%
0 1 2 3 4 5 6 7 8 9 10 11 12 13 14 15 16
4.5Mt p.a. CO2 reduction with a 51% IRR
16Mt p.a. CO2 reduction with a 14% IRR
Investment Return Curve for EnergyConservation and Carbon Abatement Projects
© 2011 – 2012 Blake Advisory Pte. Ltd.

New BuildingsIntegrative Design Process (IDP)and the work of Amory Lovins
and the Rocky Mountain Institute
© 2011 – 2012 Blake Advisory Pte. Ltd.
© 2011 – 2012 Blake Advisory Pte. Ltd.
© 2011 – 2012 Blake Advisory Pte. Ltd.

Traditional Hierarchical Approach
© 2011 – 2012 Blake Advisory Pte. Ltd.

Collaborative integrated design team approach
Green Building rating system expert (e.g.
LEED)
Building design/simulation
specialists: acoustics, thermal, comfort,
daylighting
Valuation / appraisal expert Real estate expert /
marketing
Sub-trades, product suppliers, and manufacturers
Building operator, utilities, and
maintenance staff
Systems specialists: commissioning agent,
control system and security experts
Regulatory authorities: government agencies, planners, code officials
Community advisory panel /
academic experts
Program user groups: employees, students,
residents
Site design specialists: soils, geoscientists,
ecologists
Prime consultant team: Mechanical, electrical,
structural, civil engineers; landscape architectArchitect
Contractor Client
Project managerIDP champion / facilitatorCost consultant
© 2011 – 2012 Blake Advisory Pte. Ltd.
Case Study1:
United World College of South East Asia
Exemplary Singapore development achieving significant capex and energy savings through design
© 2011 – 2012 Blake Advisory Pte. Ltd.
© 2011 – 2012 Blake Advisory Pte. Ltd.

Area of Interest
Reference Model (kW/h)
UWCSEA Model
kW/h)
Modelled
Savings
Space Cooling
(60%)
3,729,537 1,844,571 50.54%
Lighting
(18%)
815,452.399 539,222.70 33.87%
Equipment
(8%)
N/A N/A N/A
Ventilation
(6%)
541,634 275,547 49.10%
Lifts and Escalators
(4%)
32,797 29,518 10.00%
Total Building modelled Energy Consumption
7,194,957 4,112,997 42.84%
The Results
© 2011 – 2012 Blake Advisory Pte. Ltd.
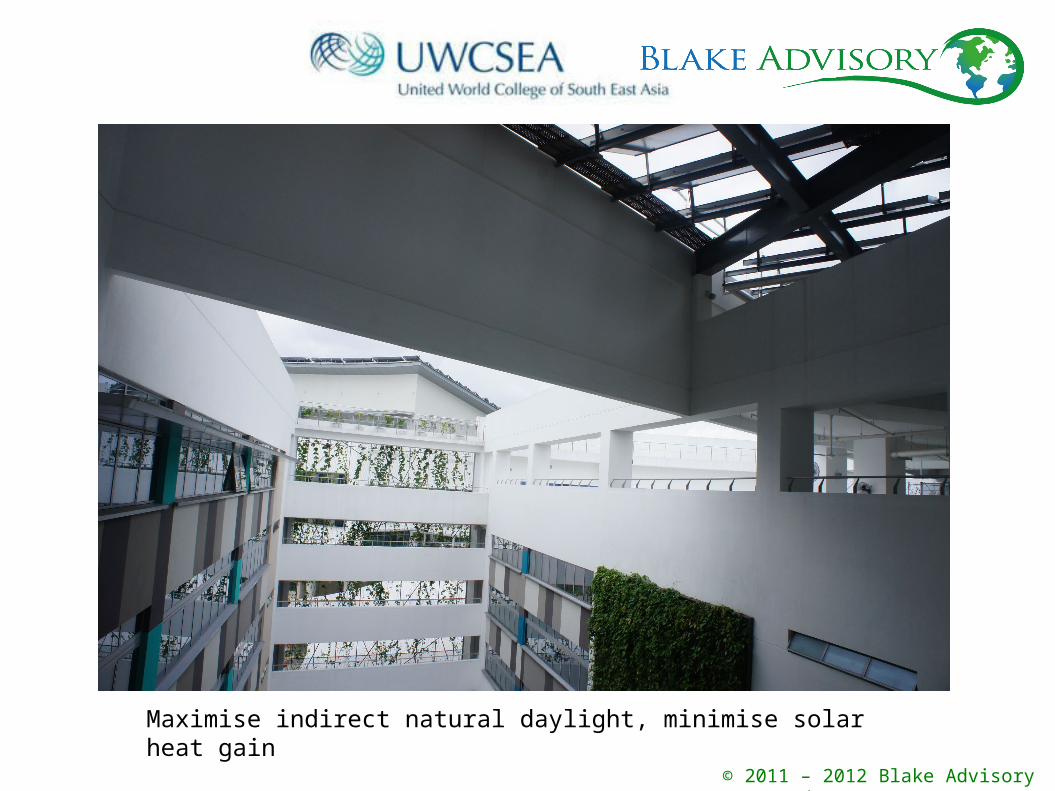
Maximise indirect natural daylight, minimise solar heat gain
© 2011 – 2012 Blake Advisory Pte. Ltd.
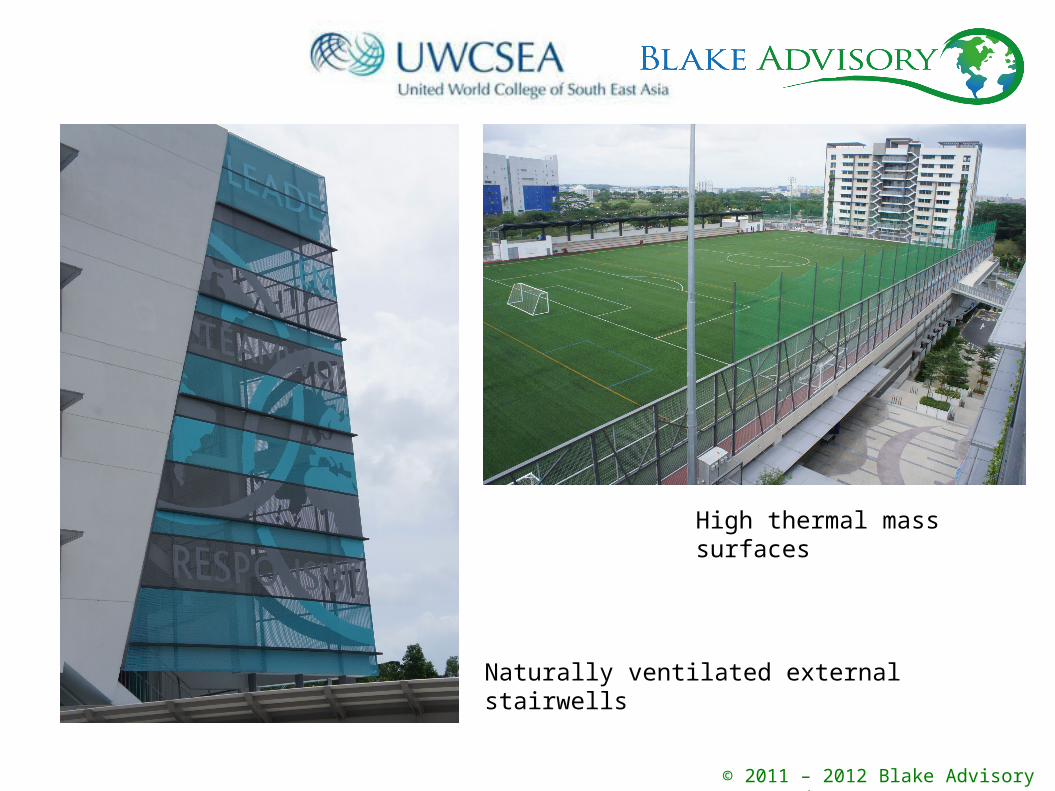
Naturally ventilated external stairwells
High thermal mass surfaces
© 2011 – 2012 Blake Advisory Pte. Ltd.

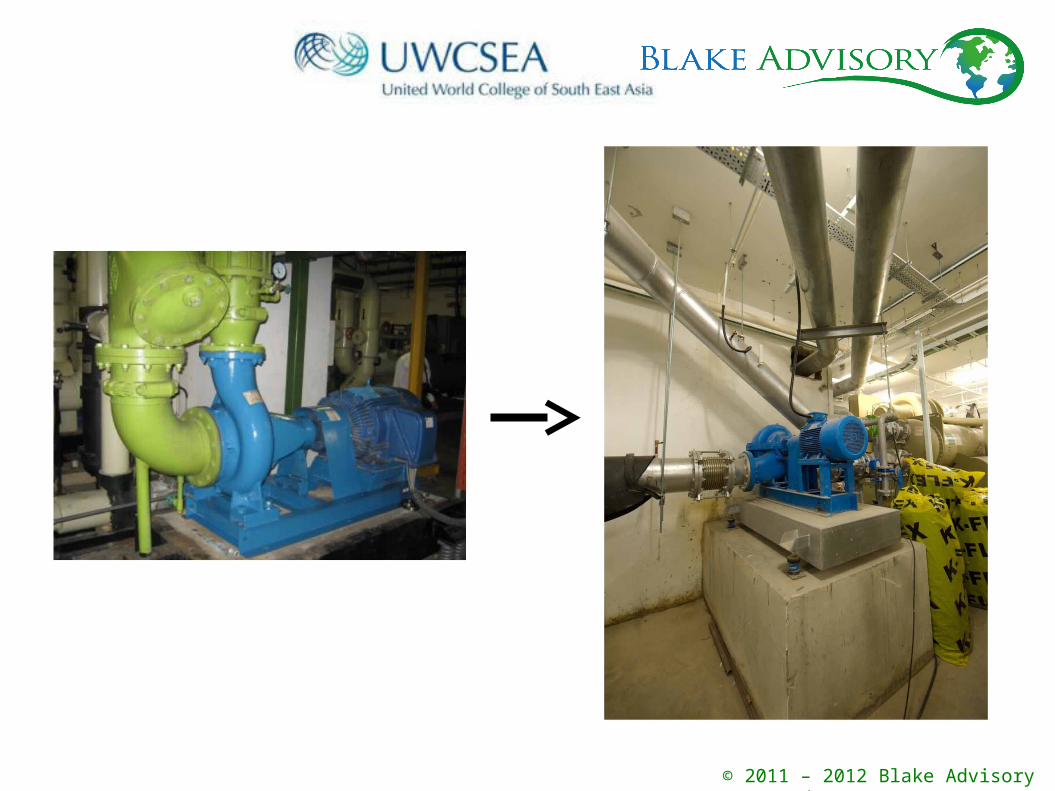
99% 1%
hydraulic pipe layout
vs.
Minimizing Frictional Losses
1%
Boolean pipe layout
optional
99%
© 2011 – 2012 Blake Advisory Pte. Ltd.
© 2011 – 2012 Blake Advisory Pte. Ltd.
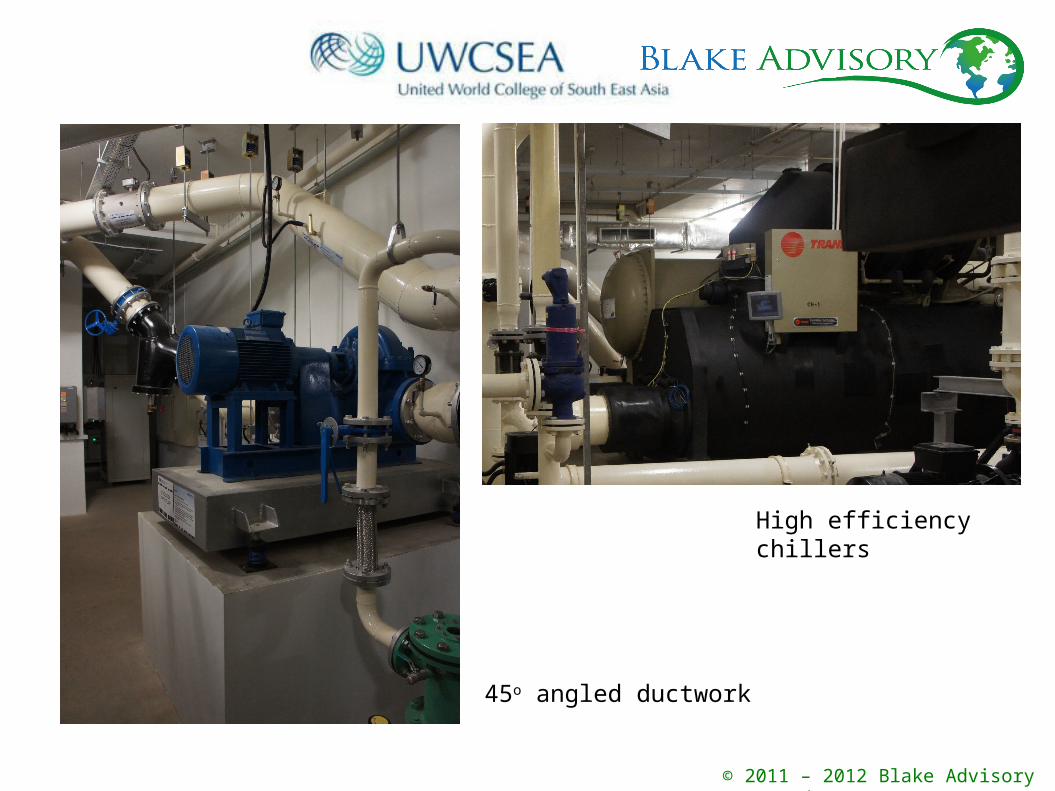
45o angled ductwork
High efficiency chillers
© 2011 – 2012 Blake Advisory Pte. Ltd.
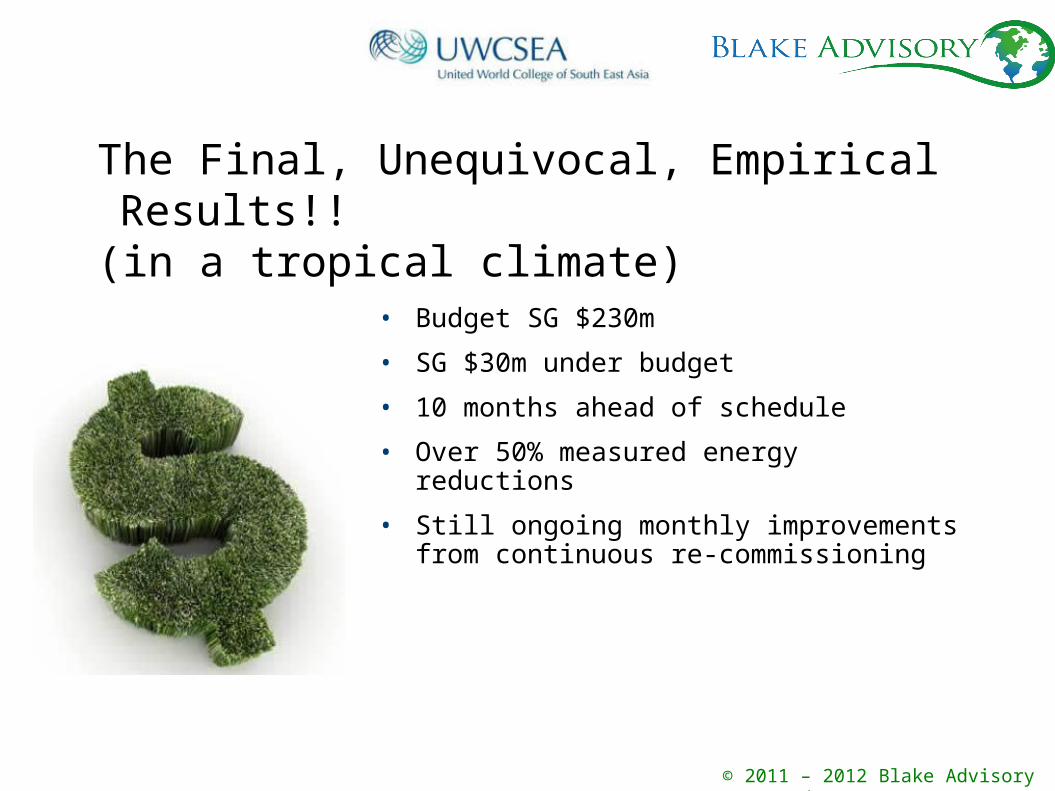
The Final, Unequivocal, Empirical Results!!
(in a tropical climate)• Budget SG $230m
• SG $30m under budget
• 10 months ahead of schedule
• Over 50% measured energy reductions
• Still ongoing monthly improvements from continuous re-commissioning
© 2011 – 2012 Blake Advisory Pte. Ltd.

A Case Study from the “Blue Economy”
© 2011 – 2012 Blake Advisory Pte. Ltd.
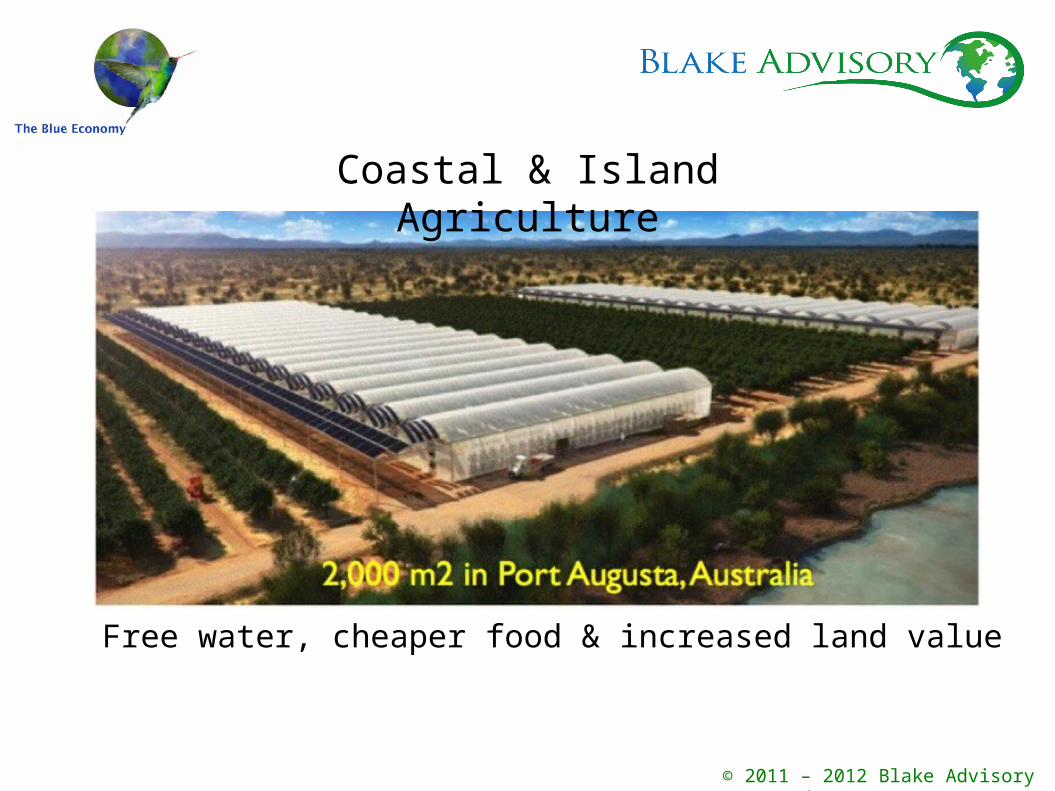
Free water, cheaper food & increased land value
Coastal & Island Agriculture
© 2011 – 2012 Blake Advisory Pte. Ltd.
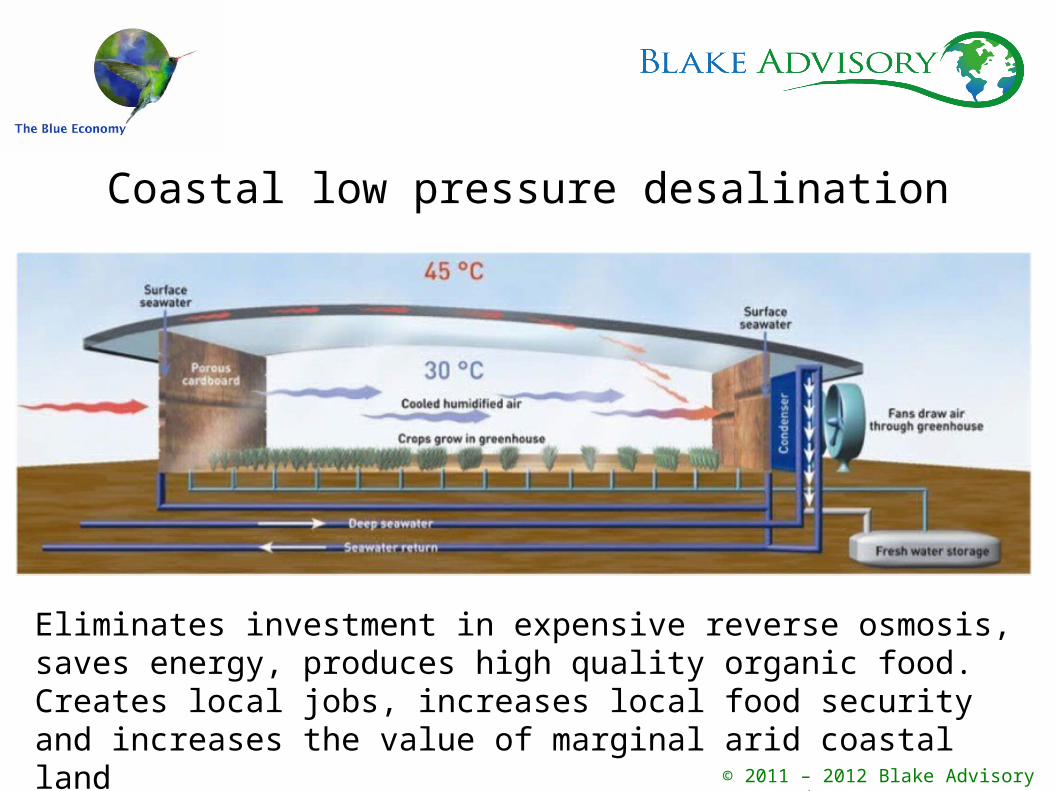
Eliminates investment in expensive reverse osmosis, saves energy, produces high quality organic food. Creates local jobs, increases local food security and increases the value of marginal arid coastal land
Coastal low pressure desalination
© 2011 – 2012 Blake Advisory Pte. Ltd.
Thank You!!
© 2011 – 2012 Blake Advisory Pte. Ltd.
www.martinblake.com
Email: [email protected]
Skype: martin_a_blake
LinkedIn: http://sg.linkedin.com/in/martinblake2010
Contact Details: Dr Martin A. BlakeBlake Advisory Ltd.
© 2011 – 2012 Blake Advisory Pte. Ltd.