international index of energy security risk index of ... thailand ... japan may turn away from...
TRANSCRIPT

Institute for 21st Century Energy • U.S. Chamber of Commerce
www.energyxxi.org
2012 Edition
InternatIonal Index of energy SecurIty rISk®
AssEssing Risk in A globAl EnERgy MARkEt

OUR MISSION
The mission of the U.S. Chamber of Commerce’s Institute for 21st Century Energy is to unify policymakers, regulators, business leaders, and the American public behind a common sense energy strategy to help keep America secure, prosperous, and clean. Through policy development, education, and advocacy, the Institute is building support for meaningful action at the local, state, national, and international levels.
The U.S. Chamber of Commerce is the world’s largest business federation representing the interests of more than 3 million businesses of all sizes, sectors, and regions, as well as state and local chambers and industry associations.
Copyright © 2012 by the U.S. Chamber of Commerce. All rights reserved. No part of this work, covered by the copyrights herein, may be reproduced or copied in any form or by any means—graphic, electronic, or mechanical, including photocopying, recording, taping, or information and retrieval systems—without written permission of the publisher.

2012 Edition
InternatIonal Index of energy SecurIty rISk®
AssEssing Risk in A globAl EnERgy MARkEt
2 2012 Edition
institute for 21st Century Energy
Contents
Foreword ............................................................................................................................................................4
Highlights ............................................................................................................................................................6
International Index of Energy Security Risk ......................................................................................................12Introduction ...........................................................................................................................................12Quantifying International Energy Security Risks ...................................................................................13International Results: 2010 ....................................................................................................................14OECD Energy Security Risks: 1980–2010 .............................................................................................15Large Energy User Group: Historical Trends 1980–2010 .......................................................................16Large Energy User Group Country Summaries.....................................................................................20
Australia .................................................................................................................................21Brazil ......................................................................................................................................23Canada ...................................................................................................................................25China ......................................................................................................................................27Denmark ................................................................................................................................30France ....................................................................................................................................32Germany ................................................................................................................................34India .......................................................................................................................................36Indonesia ...............................................................................................................................38Italy ........................................................................................................................................40Japan .....................................................................................................................................42Mexico ...................................................................................................................................44Netherlands ...........................................................................................................................46New Zealand ..........................................................................................................................48Norway ..................................................................................................................................50Poland ....................................................................................................................................52Russian Federation ................................................................................................................54South Africa ...........................................................................................................................56South Korea ...........................................................................................................................58Spain ......................................................................................................................................60Thailand .................................................................................................................................62Turkey ....................................................................................................................................64Ukraine ..................................................................................................................................66United Kingdom .....................................................................................................................68United States .........................................................................................................................70

www.energyxxi.org 3
international index of Energy security Risk
Appendix 1: Methodology Used to Develop the International Index of Energy Security Risk ..........................73
Appendix 2: International Energy Security Risk Index Scores by Country........................................................85OECD and Large Energy User Group
OECD Group Average ............................................................................................................86Australia .................................................................................................................................87Brazil ......................................................................................................................................88Canada ...................................................................................................................................89China ......................................................................................................................................90Denmark ................................................................................................................................91France ....................................................................................................................................92Germany ................................................................................................................................93India .......................................................................................................................................94Indonesia ...............................................................................................................................95Italy ........................................................................................................................................96Japan .....................................................................................................................................97Mexico ...................................................................................................................................98Netherlands ...........................................................................................................................99New Zealand ........................................................................................................................100Norway ................................................................................................................................ 101Poland ..................................................................................................................................102Russian Federation ..............................................................................................................103South Africa .........................................................................................................................104South Korea .........................................................................................................................105Spain ....................................................................................................................................106Thailand ...............................................................................................................................107Turkey ..................................................................................................................................108Ukraine ................................................................................................................................109United Kingdom ................................................................................................................... 110United States ....................................................................................................................... 111
International Energy Security Rink Scores for Top 75 Energy-Consuming Contries ............................ 112
Appendix 3. Data Sources .............................................................................................................................. 115

4 2012 Edition
institute for 21st Century Energy
Nearly three years ago, the Institute for 21st Century Energy’s (Energy Institute) unveiled its first-of-a-kind Index of U.S. Energy Security Risk (U.S. Index) to answer the simple question: Is our energy security getting better or worse?
The U.S. Index has proven to be enormously successful, having appeared at a time when energy security was once again occupying the attention of policymakers, who are increasingly viewing energy as a key driver of job growth at a time when the economy is facing severe headwinds.
The U.S. Index tells a cautionary tale. While energy security has been a perennial priority since around 1970, it is not really any better today than it was at the height of the Iran hostage crisis in 1980, and projections suggest only modest improvements in the foreseeable future.
As Energy Institute officials have traveled the country discussing energy security, one question kept popping up: In light of all the challenges we face, how does the energy security situation in the United States compare to that in other large developed and emerging energy consuming countries? This is the question that the new International Index of Energy Security Risk (International Index) is designed to address.
The International Index gives us the capability to chart energy security risks for virtually all countries since 1980, but our focus is on larger energy users. As one views the energy security landscape in these countries, it is evident that there are a number of shared concerns—oil certainly being the clearest example—but it is just as evident that many counties face unique circumstances. Policy approaches to energy also differ considerably from nation to nation.
For instance, European countries—many of which are resource poor—cite climate change as a main
driver of energy policy. European governments also are concerned over their dependence on Russian natural gas. This fear is not misplaced, as Russia has shown it is not averse to using natural gas as a geopolitical weapon and has been toying with the idea of joining with Qatar and Iran, which among them hold between 55% and 60% of global reserves, to create a “big gas troika”—essentially an OPEC for natural gas—to coordinate pricing and supply. The policy emphasis on climate change, however, has narrowed the range of options countries have available to them to address the risks created by Russian gas (for example, by tapping shale gas or switching to coal).
Or consider the case of Japan, which while very efficient, has no energy resources to speak of. Rocked by an earthquake and tsunami that led to the accident at the Fukushima Daiichi nuclear plant, it faces a series of stark choices about its energy future. Japan may turn away from nuclear power and turn to fossil fuels for electric power production, a decision that will ripple through Asian energy markets and beyond. Indeed, as a result of Fukushima, Germany reconsidered it stance on nuclear power and decided to abandon the technology entirely.
Or consider the large emerging economies of China, India, Brazil, and South Africa, which are among the large emerging economies featured in the new International Index. There is no getting away from the fact that greater supplies of energy will be needed in these countries to power economic growth and lift people from poverty, and much of it will likely be supplied by fossil fuels. Many analysts expect energy demand to be 50% higher in 20 years time with the majority of this growth coming from the large emerging economies. Some of these nations have large energy resources, others do not. All, however, are acting strategically—especially China—through a variety of means to secure adequate supplies of
Foreword

www.energyxxi.org 5
international index of Energy security Risk
energy, and some are becoming significant energy producers in their own right.
China is sitting atop a potentially huge reserve of shale gas according to a recent estimate from the Energy Information Administration (EIA). EIA also reports potentially very large shale resources in Brazil, South Africa, Mexico, and other developing countries, as well as Australia, Canada, France, Poland, and the U.S. In addition, recent “pre-salt” oil and natural gas finds in deep water off Brazil’s coast could turn that country from an oil importer to a major oil exporter. And China, India, Indonesia, and South Africa continue to produce and use vast amounts of coal.
The purpose of the Energy Institute’s new annual International Index is to help make sense of the significant transitions occurring in world energy markets and how the U.S. and other major energy users are coping with the energy security implications of these transitions.
The report that follows provides a detailed look at energy security from 1980 to 2010 for 25 developed and emerging economies. The Index was developed from 28 different metrics of energy security risk. Many of these metrics will be recognizable to those familiar with our U.S. Index, but given the uneven availability of international energy data, some differences from the U.S. Index are inevitable, and these are explained in the documentation. The report also discusses the results of our analysis and provides short energy security profiles for each of the 25 countries we examined. Appendices provide detailed data on each of the countries considered, and the Energy Institute’s webpage has an interactive tool that allows visitors to look at the data for the 75 largest energy-consuming countries in the International Index database.
With the U.S. Index, the Energy Institute created a data-driven method allowing us to answer from a domestic perspective the question: Is our energy security getting better or worse? With the new
International Index being unveiled in this report, we can now answer that question from an international perspective, too. We hope that in doing so, we can enrich the energy security debate at home and abroad and provide business and governments with better information to make better decisions.
Creating something as complex as the International Index would not have been possible without the diligent efforts of many people. In particular, our thanks go to Daniel E. Klein, President of Twenty-First Strategies of Santa Fe, New Mexico, and his assistant Christopher D. Russell, both of whom put in long hours to pull together an international database of energy security metrics that is truly remarkable in its breadth, depth, and versatility. There is nothing else quite like it anywhere, and it is the basis for the entire project. Thanks also are due to Brian Miller, Mallory Kastor, and the entire production team here at the U.S. Chamber of Commerce for producing a superb publication on a tight deadline. Our web-development department also did yeoman’s work in getting the report and interactive features of the International Index ready for the web. Energy Institute intern Kyle Roney also deserves special mention for the role he played in preparing this report. And last but not least, special thanks go to the entire Energy Institute team for designing and creating a product that we are confident will change the way we look at energy security both at home and abroad.
Karen A. HarbertPresident and CEOInstitute for 21st Century EnergyU.S. Chamber of Commerce

6 2012 Edition
institute for 21st Century Energy
This inaugural edition of the International Index of Energy Security Risk (International Index) is designed to complement the annual reports on U.S. Energy Security Risk, first published by the U.S. Chamber of Commerce’s Institute for 21st Century Energy in 2010.
The International Index measures energy security risks across different countries for the years 1980 through 2010. The risk index scores are calculated for the United States and 24 other countries that make up the large energy user group: Australia, Brazil, Canada, China, Denmark, France, Germany, India, Indonesia, Italy, Japan, Mexico, Netherlands, Norway, Poland, Russian Federation, South Africa, South Korea, Spain, Thailand, Turkey, Ukraine, and the United Kingdom. The scores for these countries are reported in relation to a reference index representing the average risks for Organization for Economic Co-operation and Development (OECD) member countries. The OECD average risk index is calibrated to a 1980 base year figure of 1,000.
2010 Highlights
Mexico was the most energy secure country in the large energy user group with a score 14% below the oECD average (table H-1). The Ukraine was least secure with a score 131% above the OECD average.
the U.s. ranks as the seventh most energy secure country in the group. With a 2010 score of 964, its energy security risk was about 2% below the OECD average.
table H-1. Energy security Risk scores and Rankings for 25 large Energy Using
Countries: 2010
Country Score Large Energy User Group Rank
Mexico 851 1United Kingdom 878 2Norway 940 3New Zealand 941 4Denmark 942 5Australia 942 6United States 964 7OECD 988 Canada 995 8Germany 1,006 9Indonesia 1,013 10France 1,028 11India 1,045 12Poland 1,061 13Russia 1,072 14China 1,098 15South Africa 1,100 16Spain 1,105 17Japan 1,119 18Turkey 1,154 19Italy 1,159 20Brazil 1,165 21Netherlands 1,239 22South Korea 1,361 23Thailand 1,689 24Ukraine 2,277 25
Highlights

www.energyxxi.org 7
international index of Energy security Risk
in general, countries with large energy resource bases and efficient economies enjoy the greatest comparative energy security. Countries that are not rich in energy resources but exhibit a high degree of energy efficiency also score reasonably well. Conversely, countries that do not use energy efficiently, even with large energy resources, do not score as well.
For many major emerging economies like brazil, China, india, and south Africa, rapid economic growth since around 2000 has increased energy demand and exacerbated underlying energy security risks. Trends suggest that the energy security risk scores for these countries compared to the OECD average will get worse before they get better.
Historical trends: 1980–2010
After falling during much of the 1980s and into the 1990s, overall energy security risks have been rising for more than a decade in nearly all countries in the large energy user group. Of the 23 countries in the large energy user group in existence in 1980,1 12 have higher total energy security risks in 2010 than they did in 1980, a year of extraordinarily high risk.
the disparities in risk among the countries in the large energy user group generally have been getting smaller even as overall risks rise. Between 1980 and 2010, the range of the highest and lowest risk scores has moved from 84% to 52% of the OECD average risk score.
oECD and large Energy User group Highlights
From a score of 1,000 in 1980, average oECD energy security risks fell steadily to 717 in 1998 before reversing course and rising to 988 in 2010. The declining risk in the first half of the period reflected lower scores in 22 of the 28 individual risk metrics.
1 Excludes the Russian Federation and the Ukraine.
Rising rise scores from 1998 to 2010 was almost as broad-based, with 18 metrics getting worse. Risks associated with import exposure, the reliability and diversity of fossil energy supplies worldwide, and energy prices, volatility, and expenditures all rose over this period. Energy intensity is one of the few metrics that improved consistently throughout the entire 31-year period.
Below is a summary of each nation in the top 25. Detailed reports for each follow.
Australia’s energy security risk score was ranked sixth in 2010, and it scores consistently have been among best of the large energy users. The country’s large volumes of coal and natural gas exports also contribute to improving the energy security of other countries. Many risk scores, however, are moving in the wrong direction, including those related to oil imports, energy use, and carbon dioxide emissions.
brazil’s energy security risk scores consistently have been much higher than the oECD average. In 2010, Brazil’s score of 1,165 was 18% higher than the OECD average, and it ranked 21st. Brazil is poised, however, to become a large producer and exporter of crude oil, and this should improve its energy security picture for the better. Risks related to energy use may offset some of these gains.
Canada’s energy security risk scores have tracked closely to the oECD average. In 2010, its overall risk score was just 1% higher than the OECD average, although in most years it has been slightly lower. Canada has extensive hydrocarbon resources and is a large energy producer and exporter. Canada can improve its own and other countries’ energy security by further developing its huge oil sands reserves provided necessary infrastructure, including the Keystone XL pipeline, is built bring this oil to international markets. Canada’s scores would be lower but for its energy use per capita risk scores, the highest of any country in the large energy user group.

8 2012 Edition
institute for 21st Century Energy
China has displayed the widest range of scores relative to the oECD average, from 1,497 in 1980 to just 712 in 1999, a level just below the oECD average, a tremendous improvement. However, over the last decade—a period of tremendous economic growth—a large portion of these gains was erased, and by 2010, the country’s overall energy security risk score was 1,100. China’s domestic energy production has not been able to keep pace with demand, and it imports a growing portion of the fuels it uses. The push for greater energy efficiency and stable and diverse energy supplies have taken on strategic importance, and the country is investing in energy projects and pursuing strategic alliances with energy companies overseas.
in 2010, Denmark was the fifth most energy secure country in the large energy user group. Its score of 942 was 5% below the OECD average. This is the first time Denmark has bested the OECD average. Denmark is a net exporter of oil and natural gas, but must import all of its coal. The country is one of the most energy efficient in the world, and its energy intensity in 2010 was the best among the group. It energy costs, however, are comparatively high.
France’s energy security score for 2010 was somewhat (4%) higher than the oECD average. This represents a big improvement: In 1980, France’s score was 24% higher than the OECD average. France displays a relatively high degree of energy efficiency that helps moderate a variety of risks, and its strategic decision to make nuclear power a substantial part of its energy mix has helped France lower its fossil fuel imports.
in the decade following reunification, germany’s energy security risk scores were roughly 10% higher than the oECD. Since about 2000, however, its scores, while worsening overall, have tended to tracked fairly closely with the OECD as a whole. The German economy is among the most efficient in the group. Energy costs are relatively very high, and Germany’s electricity prices have grown at a much faster rate than the OECD average.
india’s energy security risks, though rising, were better than the oECD average from 1980 to the mid-1990s, but since then its risks have grown both absolutely and relative to the oECD. India is the world’s fourth largest energy consumer, and it relies on imports to meet much of its demand. Hundreds of millions of Indians lack access to electricity. Coal is the dominant fuel in the electricity sector, and since 1980, India has added about 90 gigawatts of thermal generating capacity, most of which was coal-fired. Like many emerging economies, India’s economy is relatively inefficient in its energy use.
indonesia had for many years enjoyed energy security risk scores much lower than the oECD average, but since the mid-2000s, its scores have begun to edge higher than the oECD. In 2010, its risk score exceeded its 1980 score by roughly 40%, a level of increase matched by only two other countries in the large energy user group—Thailand and Turkey. The country was for many years a large exporter of oil, but because of a combination of increasing demand and declining production, in 2004 it became a net importer. Moreover, the amount of energy used to produce a unit of GDP in Indonesia is higher now than it was in 1980.
italy’s overall energy security risk has consistently been quite a bit higher than the oECD average, ranging from 31% to 17% above. At more than 1,100, its average risk score is one of the highest among developed countries. Like many Western European countries, Italy relies largely on imports to fuel its economy. Overall, Italy’s import risks have not grown relative to the OECD baseline. Italy uses energy more efficiently than is the norm for the OECD countries.
Japan has one of the highest energy security risk scores of any of the developed countries in the large energy users group, averaging about a third higher than the oECD average over the last 30 years. It has the second largest average risk score over the 1980 to 2010 period. With no domestic energy resources of any consequence, Japan imports

www.energyxxi.org 9
international index of Energy security Risk
virtually all of its fuels. Despite its many challenges, Japan has managed to close the gap with the OECD average over the years. While its score was 39% higher in 1980s, Japan’s energy security risk score was just 13% above the OECD baseline in 2010. The policy response to move away from nuclear power after the incident at the Fukushima Daiichi nuclear station, however, will pose significant energy security challenges going forward.
since 1980, Mexico’s energy security ranked as the first or second most secure country in the large energy user group. It is consistently number one by virtue of its comparatively good fossil fuel imports, energy expenditure, and per capita energy use scores. Mexico’s energy security risks, however, are worsening at a faster rate than for the OECD as a whole. As a result, Mexico’s advantages are shrinking: From a 1980 score 34% better than the OECD average, Mexico’s score in 2010 was just 14% better.
the netherlands is the least energy secure of all the developed countries in the large energy user group. From 1980 to 2010, its overall risk always was at least 20% above the OECD average, and over the period it has the highest average risk score—1,053—of any developed country in the group. The country depends on imports of oil and coal to meet domestic demand. The country also has a relatively large oil refining sector, and in 2010 it was the world’s fourth largest net exporter of refined petroleum, which moved its overall oil import risk lower than it would be otherwise.
new Zealand’s energy security risk scores have tracked the oECD average fairly closely over the past 30 years, staying within 10% on either side of the baseline. More recent trends, however, suggest that New Zealand’s energy security is worsening at a slightly faster rate than for the OECD as a whole.
in 2010, norway was among the eight countries in the large energy user group with energy security risk below the oECD average, and having the
third best score. From 1980 to the mid- to late-1990s, Norway’s overall risk increased relative to the OECD baseline. Since then, Norway’s risk has improved relative to the OECD even as it absolute risk has increased somewhat. For most of the 2000s, Norway’s risk has been at or below the OECD level. Norway scores very well in the fuel import measures compared to the OECD baseline, and it is a reliable supplier of fossil fuels to regional and global markets.
of the three former soviet bloc countries, Poland has displayed the lowest energy security risk for most of the period from 1980 to 2010. In the 1990s, Poland’s risk moved higher and then lower compared to the OECD average, but by the 2000s, its risk level was largely in line with the OECD level. Recently data suggest, however, that Poland’s risk may be rising faster than the OECD’s because of factors related to energy use and expenditures.
in 1992 (the first year for which data are available), the Russian Federation’s energy security was ranked third from the bottom. Since then, its risk scores have shown no discernable trend. Over the last decade, as the average OECD risk was getting progressively worse, Russia’s relative risk declined and it was just 9% above the OECD average in 2010. In 2010, Russia was the world’s largest producer of both crude oil and gas, and the fifth largest producer of coal. Its import-related energy security risks therefore are well below the OECD average. After decades of communist rule, however, Russia’s economy remains relatively inefficient. Nevertheless, Russia’s intensity measures are all showing improvement compared to the OECD, but the country still has a long way to go before its intensity measures are comparable.
south Africa’s energy security risk consistently has been higher than the oECD average for the entire period from 1980 to 2010, ranging from 16% to 1% higher. Trends over the past few years suggest that the county’s risk is growing, both absolutely and relative to the OECD. The country’s scores for individual measures of risk exhibit many of the drawbacks one would expect to see in a

10 2012 Edition
institute for 21st Century Energy
large emerging economy, but it also has advantages some other emerging economies lack, such as its large deposits of coal. Like most of the emerging economies, South Africa uses energy less efficiently than the OECD average and is increasing its carbon dioxide emissions rapidly.
For the entire period from 1980 to 2010, south korea’s total energy security risk scores averaged nearly half again as high as the oECD baseline. only the Ukraine had worse average scores over the period. Since 1990, the country’s risks scores consistently have placed it among the three most energy insecure countries in the large energy user group. The country produces no crude oil and small amounts of natural gas and coal. It is the world’s second largest importer of liquefied natural gas and third largest importer of coal. South Korea’s energy intensity measures are higher than their OECD averages, and the trends for many of these since 1980 indicate no improvement, and in some cases a worsening, relative to the OECD baseline.
spain’s overall energy security risk has been higher than the oECD group average for the entire period from 1980 to 2010. While its risk approached the OECD average in the late 1980s, since then the gap has widened in fits and starts, and in 2010, it was 12% higher. Spain produces almost no oil or natural gas, and little coal, so it must import large quantities of these fuels to meet domestic demand, which has increased significantly since the early 1990s. Spain has a lower energy intensity than the OECD average, and this has helped moderate the impact of rising energy costs.
in 2010, thailand’s energy security risk score was the second worst of the large energy user group. During the 1980s, Thailand’s total energy security risk improved rapidly, dropping over 300 points and coming at one point within 3% of the OECD average. Since about 1990, however, Thailand’s risk scores have grown sharply higher. Thailand relies on imports to satisfy large shares of domestic demand for oil, natural gas, and coal, which means its import exposure risks are higher than the OECD average or are moving higher. Moreover,
greater prosperity is pushing metrics measuring energy use and emissions per person higher.
since 1992, the Ukraine has had by far the worst energy security index scores of any country in the large energy user group, both nominally and compared to the oECD. Its scores over the period averaged about 181% higher than those for the OECD. A net importer of oil, natural gas, and coal, Ukraine scores particularly poorly on energy expenditures and energy use intensity. However, Ukraine’s overall risk has been trending downward. From its peak of 2,732—277% above the OECD average—in 1996, the country’s total risk score fell to 2,011 in 2009—still 130% above the OECD average but a considerable improvement, and recent trends suggest further improvements.
since the 1980s, the United kingdom has scored consistently in the top three most energy secure countries in the group of large energy users, and it has been the most energy secure of the European countries. Its risk scores have trended well below the OECD average. Since the mid-1990s, however, this advantage has been shrinking, from about 20% then to a 2010 value of 11%. The country is a large energy producer, and while its oil and natural gas import risks are better than the OECD average, the spread has been shrinking in recent years as net imports of these fuels have increased. The United Kingdom is also a fairly efficient economy, and its energy use trends have moved largely in line with the OECD average. New offshore oil and gas fields also are being developed in the North Sea. If these developments pan out, the United Kingdom should be able to maintain its position as one of most energy secure countries in the large energy users group. Its energy costs, however, are relatively high.
For most of the 1980 to 2010 period, U.s. energy security risks have run just slightly higher or lower (+ or – 3%) than the oECD average. In 2010, the U.S. was the seventh most energy secure country in the group of large energy users. The gains the United States has made relative to the OECD have been
www.energyxxi.org 11
international index of Energy security Risk
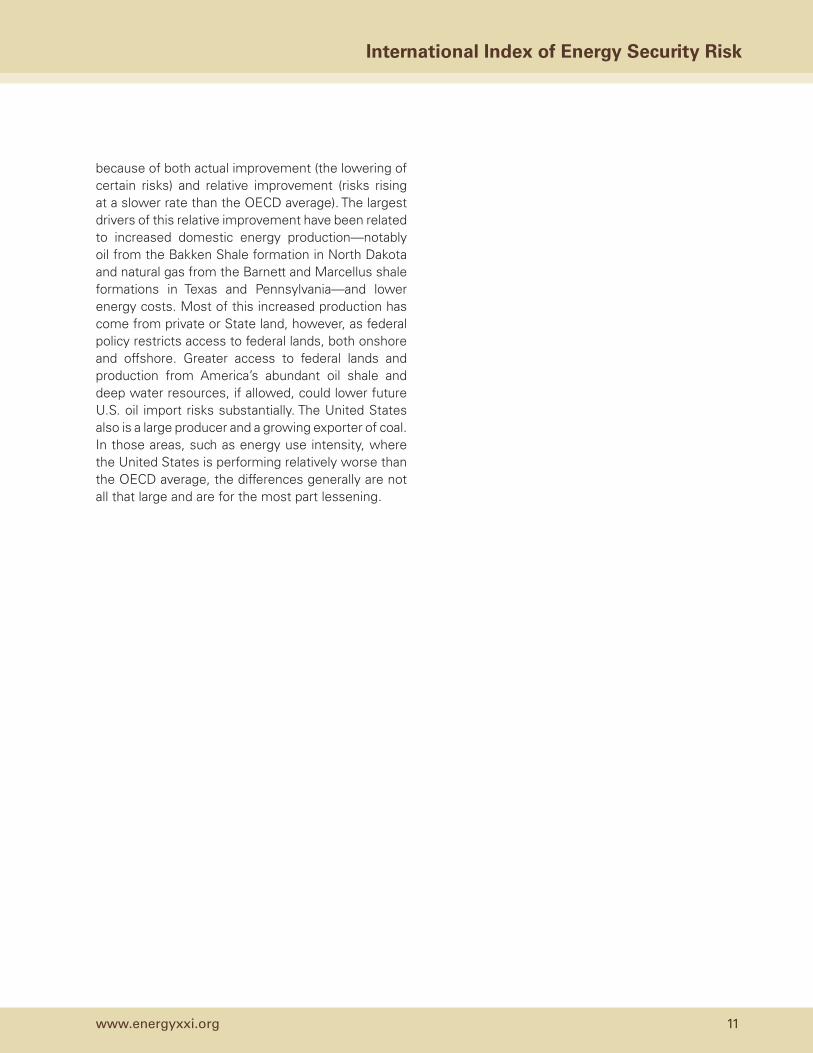
because of both actual improvement (the lowering of certain risks) and relative improvement (risks rising at a slower rate than the OECD average). The largest drivers of this relative improvement have been related to increased domestic energy production—notably oil from the Bakken Shale formation in North Dakota and natural gas from the Barnett and Marcellus shale formations in Texas and Pennsylvania—and lower energy costs. Most of this increased production has come from private or State land, however, as federal policy restricts access to federal lands, both onshore and offshore. Greater access to federal lands and production from America’s abundant oil shale and deep water resources, if allowed, could lower future U.S. oil import risks substantially. The United States also is a large producer and a growing exporter of coal. In those areas, such as energy use intensity, where the United States is performing relatively worse than the OECD average, the differences generally are not all that large and are for the most part lessening.

12 2012 Edition
institute for 21st Century Energy
introduction
This inaugural edition of the International Index of Energy Security Risk (International Index) is designed to complement the annual reports on U.S. Energy Security Risk (U.S. Index), first published by the U.S. Chamber of Commerce’s Institute for 21st Century Energy (Energy Institute) in 2010 and updated annually.
For over four decades, energy security has been a perennial concern not just in the U.S., but globally. It has only been recently, with the introduction in 2010 of the Energy Institute’s U.S. Index, that this concern has been matched with metrics allowing for a quantifiable assessment of energy security over time.
The U.S. Index introduced a first-of-its-kind capability to measure and track various aspects of our energy security risks. It provides two frames of reference: (1) historical measures of U.S. energy security back to 1970 and (2) forecasts of U.S. energy security calculated using the Energy Information Administration’s (EIA) Annual Energy Outlook (AEO) “business as usual” reference case projections.
The Energy Institute’s new International Index offers a third way to look at the question of U.S. energy security: Are U.S. energy security risks higher or lower relative to other countries, and how have these risks changed over time?
In an increasingly interconnected world, where the risks faced by other nations affect our risks as well, a well-designed index covering many countries can improve our understanding of global energy security risks. U.S. energy markets are not insular. Many aspects of U.S. energy security are by their very nature global. Recent years have seen global energy markets facing unprecedented challenges
as well as opportunities. In previous decades, when the U.S. comprised a larger share of global energy production and consumption, our policies and actions had a bigger impact on global markets. Increasingly, however, geopolitical risks are imposed upon us rather than set by us. We see this today in the high and wildly fluctuating oil prices that, in earlier years, would have been unusual in a struggling economy.
Energy is a fundamental prerequisite of growth and development around the world, and despite the global financial crisis, energy demand has been steadily growing, especially in the large emerging economies of China, India, and Brazil. The International Energy Agency (IEA) estimates that well over a billion people still lack access to modern energy services, and providing these energy services is a priority for many governments around the world to lift people out of poverty.
In large part, energy security is complicated because key energy resources are geopolitically concentrated. Most of the world’s oil and gas reserves are found in a handful of countries, several of which are in political turmoil and not especially friendly to U.S. interests. Further, there is relatively little overlap between those countries that are the leading energy resource countries and those that are the major energy consuming countries. Reliance on international trade is large, growing, and vulnerable to disruptions. For these global commodities, events anywhere can affect supply and prices everywhere, even for self-sufficient countries. Energy security risks, therefore, pose challenges to all countries.
It is this notion of America’s increasing vulnerabilities and interdependencies in a global energy market that prompted our effort to take the concepts and
international index of Energy security Risk®
2012 Edition

www.energyxxi.org 13
international index of Energy security Risk
methodologies shown in the U.S. Index and apply them on a broader international basis. Our purpose in undertaking this International Index is twofold:
First, an enhanced understanding of energy security in other countries can deepen our insight into that of the U.S. Through the development of these metrics, we can observe not only absolute trends of interest, but to also see relative movement among and across countries. In a global marketplace, both matter.
Second, communicating these energy security risks to an international audience helps the United States as well. Many of the benefits of improved technologies, greater energy efficiency, increased production, or democratic reforms anywhere can create energy security benefits everywhere.
We believe that the International Index breaks new ground in its breadth, depth, geographic coverage, and completeness. This effort helps in our mission to unify policymakers, regulators, business leaders, and the American public behind a common sense energy strategy and build support for meaningful energy action at the local, state, national, and international levels.
We also recognize that this effort to develop an International Index is a first step. As with the U.S. Index, we want to engage in a dialogue with users and energy experts to revise and improve the International Index, so that over time its usefulness will grow. We welcome your comments and suggestions.
Quantifying international Energy security Risks
The International Index was designed using a comparable architecture to the U.S. Index to measure energy security risks across different countries, but with some significant changes. The data used for the International Index are derived largely from EIA—which uses data from a variety of sources—and the International Energy
Agency (IEA). More details on how the International Index was developed can be found in Appendix 1.
The United States has an abundance of reliable and timely energy data that enabled a deep look into the geopolitical, economic, reliability, and environmental aspects of energy security risks. Some of this in-depth data, in both quantity and quality, simply could not be developed globally. Because of these data limitations, it is unavoidable that the International Index measures slightly different things and lacks some of the U.S. Index’s rich detail, but every effort was made to align it as closely as possible with the U.S. Index.
Instead of the U.S. Index’s 37 metrics, the International Index uses 28 metrics covering international energy supplies, fossil fuel imports, energy expenditures, energy use, transportation, power generation, and energy-related carbon dioxide emissions. Because different metrics were selected for the International Index, the input weight of each metric was different compared to the U.S. Index, but overall each metric category was assigned a weight comparable to that assigned to its corresponding metric category in the U.S. Index.
Data limitations also compelled a start date of 1980 instead of 1970. Further, because forecast data are not available at the desired level of detail, the series ends in the most recent year for which data are available (for this initial edition, 2010).
The results for the U.S. and all other countries are reported in reference to a common baseline index that represents the average for Organization for Economic Co-operation and Development (OECD) member countries.2 The OECD average index is
2 Although OECD membership has changed over its 50-plus year history, the OECD averages over the entire period from 1980 through 2010 were calculated using the current roster of OECD members. OCED membership today includes: Australia, Austria, Belgium, Canada, Chile, Czech Republic, Denmark, Estonia, Finland, France, Germany, Greece, Hungary, Iceland, Ireland, Israel, Italy, Japan, Luxembourg, Mexico, Netherlands, New Zealand, Norway, Poland, Portugal, Slovak Republic, Slovenia, South Korea, Spain, Sweden, Switzerland, Turkey, United Kingdom, and United States. Because OECD is used as the baseline against which other countries are compared, the list of OECD countries needed to remain fixed over time.

14 2012 Edition
institute for 21st Century Energy
calibrated to a 1980 base year figure of 1,000, and represents a high-water mark for energy security risk worldwide.3 The score for each individual country is then set in relation to the 1980 OECD average, and all subsequent years move in relation to that number. Hence, a country’s starting 1980 International Index value will be proportionately higher or lower than the 1980 OECD value of 1,000, and its changes over time will reflect both its absolute changes and those relative to the OECD baseline.
Pegging nations to the OECD average permits us to rank the energy security risks of countries against a developed country average, to track absolute and relative changes in risk up and down over time, and to make risk comparisons among different countries. As a result, the scores calculated for the U.S. as part of the International Index will not be identical to the corresponding scores for the United States in the U.S. Index, though the broader trends are similar.
Using the International Index, we can address many different questions: How does the energy security of the United States compare to that of the OECD as a whole, or to Germany or China? And how does Germany’s energy security compare with China’s? Has U.S. energy security been improving relative to other countries over time, or has it been getting worse? What have been the biggest drivers of rising or falling energy security risks in different countries? What appear to be the best strategies for lowering risks in different countries that have very different resource bases, policies, and economies?
3 Similarly in the U.S. Index, the 1970-2035 period of analysis is measured by benchmarking the index and all metrics to a 1980 value of 100.
international Results: 2010
International Index scores were calculated for the OECD and all other countries for each year over the 1980–2010 time frame. However, because of data limitations and weaknesses for many small or developing nations, this report focuses primarily on the world’s largest energy users—Australia, Brazil, Canada, China, Denmark, France, Germany, India, Indonesia, Italy, Japan, Mexico, New Zealand, Norway, Poland, Russian Federation, South Africa, South Korea, Spain, Thailand, Turkey, Ukraine, United Kingdom, and the United States.4 Collectively, these countries today account for roughly 80% of global energy demand.5
Table 1 shows how energy security risks in large energy-consuming countries fared against this OECD average in 2010. As you interpret the Table 1, consider it analogous to the leader board in a golf tournament where the best ranked score is the lowest numerical score and the worst ranked score the highest numerical score.
In 2010, Mexico was the most energy secure country in the large energy user group with a score 14% below the OECD average. The Ukraine was least secure with a score 131% above the OECD average. The U.S. ranks as the seventh most secure country, with a risk score of about 2% below the OECD average.
4 Scores for the top 75 energy-consuming countries in our database can be found at the end of Apprendix 2. These 75 countries accounted for 97% of global energy demand in 2010.
5 The large energy using and oil exporting countries of Iran and Saudi Arabia were not included in this analysis, but their scores are listed in the International Energy Security Risk Index Scores for Top 75 Energy Consuming Countries table in Appendix 2.

www.energyxxi.org 15
international index of Energy security Risk
table 1. Energy security Risk scores and Rankings for 25 large Energy Using Countries: 2010
Country Score Large Energy User Group Rank
Mexico 851 1United Kingdom 878 2Norway 940 3New Zealand 941 4Denmark 942 5Australia 942 6United States 964 7OECD 988 Canada 995 8Germany 1,006 9Indonesia 1,013 10France 1,028 11India 1,045 12Poland 1,061 13Russia 1,072 14China 1,098 15South Africa 1,100 16Spain 1,105 17Japan 1,119 18Turkey 1,154 19Italy 1,159 20Brazil 1,165 21Netherlands 1,239 22South Korea 1,361 23Thailand 1,689 24Ukraine 2,277 25
In general, countries with large energy resource bases and efficient economies enjoy the greatest comparative energy security advantage. Countries that may not be rich in energy resources but exhibit a high degree of energy efficiency also score reasonably well. Conversely, countries that have large resource bases but do not use energy as efficiently as other countries score relatively poorly.
Large emerging economies with rapidly growing economies—for example, Brazil, China, India, and
South Africa—for the most part do not score that well. Many of these countries lack significant energy resources, and their energy usage is much less efficient than it is in developed countries. Trends in many emerging economies also suggest that, compared to the OECD average, their energy security scores will get worse before they get better. These issues will be explored on more depth later in the report.
The 2010 snapshot in Table 1, however, tells only part of the story. The following sections look at the historical patterns for the OECD as a whole and for each of countries in our large energy users list.
oECD Energy security Risks: 1980–2010
The baseline against which the scores are calculated and compared is the OECD average. The OECD average was indexed with 1980 equaling 1,000 and subsequent years set in relation to that.
OECD members represent a cross-section of mostly developed countries with energy resources that vary greatly in their quantity and type, different climates, population densities, land-use patterns, industries, political cultures, and other attributes that affect energy use. Combining these country-specific measures into an OECD average provides a reference trend approximating the collective energy security risks for developed countries.
Figure 1 charts the average OECD energy risk scores from 1980 through 2010 (data for each metric are available in Appendix 2). The time trend of the OECD scores resembles a shallow U-shaped trough. From a score of 1,000 in 1980, energy security risks fell steadily to 717 in 1998 before reversing course and rising to 988 in 2010.
The decline in the index score from 1980 to 1998 reflected reductions across a broad range of risk categories, with 22 of the 28 individual risk metrics showing improvement. Over this period, the OECD benefited from lower risk in most global fuel supply risk indexes (the exception being crude oil reserves).

16 2012 Edition
institute for 21st Century Energy
Falling energy prices, especially the price of crude oil, over much of this period also contributed to lower energy expenditures across the board. OECD economies also exhibited greater efficiency and saw the share of less energy-intensive service
500
600
700
800
900
1000
1100
1980
1985
1990
1995
2000
2005
2010
Figure 1. oECD Average Energy security Risk index scores: 1980–2010
Ris
k In
dex
Sco
re (1
980=
1,00
0)
The rise in OECD risk from 1998 to 2010 was almost as broad-based as the decline in risk from 1980 to 1998, with 18 metrics getting worse. Risks associated with higher energy prices, volatility, and expenditures, especially related to crude oil, rose to very high levels over this period. Risk measures of import exposure and the reliability and diversity of fossil energy supplies worldwide also rose, driving total OECD energy security risk to its worst level. The exception was the improvement in crude oil reserves, which improved markedly with the addition of over 175 billion barrels of Canadian unconventional crude oil. Risks associated with carbon dioxide emissions from energy also have improved since 1998.
Energy intensity, however, is one of the few metrics that improved consistently throughout the entire 31-year period. The average OECD risk in 2010 would have been higher still had energy intensity not improved so much, underlying the importance
of energy efficiency as a way to mitigate energy security risk.
large Energy User group: Historical trends 1980–2010
The scores for individual countries were calculated and set in relation to this OECD baseline. Figure 2 shows how energy security risks in the large energy user countries fared against this OECD average in 2010 (the Ukraine is shown in inset).
Looking at the countries that make up the large energy user group individually, most, but by no means all, countries show a roughly U-shaped energy security risk profile over time. After falling during much of the 1980s and holding at comparatively low levels for much
industries increase. And while emissions of carbon dioxide from energy increased overall, emissions per dollar of GDP and per person declined.

www.energyxxi.org 17
international index of Energy security Risk
500
600
700
800
900
1,00
0
1,10
0
1,20
0
1,30
0
1,40
0
1,50
0A
ustr
alia
Bra
zil
Can
ada
Chi
naD
enm
ark
Fra
nce
Ger
man
yIn
dia
Ind
one
sia
Ital
yJa
pan
Mex
ico
Net
herl
and
sN
ew Z
eala
ndN
orw
ayP
ola
ndR
ussi
aS
out
h A
fric
aS
out
h K
ore
aS
pai
nT
haila
ndTu
rkey
Ukr
aine
Uni
ted
Kin
gd
om
Uni
ted
Sta
tes
OE
CD
1980
1985
1990
1995
2000
2005
2010
Fig
ure
2. E
ner
gy s
ecu
rity
Ris
k in
dex
sco
res
for
larg
e E
ner
gy U
ser
gro
up
: 198
0–20
10Risk Index Score
500
1,00
0
1,50
0
2,00
0
2,50
0
3,00
0A
ustr
alia
Bra
zil
Can
ada
Chi
naD
enm
ark
Fra
nce
Ger
man
yIn
dia
Ind
one
sia
Ital
yJa
pan
Mex
ico
Net
herl
and
sN
ew Z
eala
ndN
orw
ayP
ola
ndR
ussi
aS
out
h A
fric
aS
out
h K
ore
aS
pai
nT
haila
ndTu
rkey
Ukr
aine
Uni
ted
Kin
gd
om
Uni
ted
Sta
tes
OE
CD
1980
1985
1990
1995
2000
2005
2010
Risk Index Score

18 2012 Edition
institute for 21st Century Energy
of the 1990s, overall energy security risks have been rising for more than a decade. Of the 23 countries in the large energy user group extant in 1980, 12 have higher total energy security risks in 2010 than they did in 1980, a year of extraordinarily high risk.6
Also, it is worthwhile noting that the spread between the highest risk score and the lowest risk score has been narrowing over time. Removing the Russian Federation and the Ukraine from consideration,7 the high-low range moved from about 84% of the OECD average score in 1980 to about 52% of the OECD average score in 2010. This means the disparities in risk among the countries in the large energy user group generally have been getting smaller even as overall risks have been rising.
While the aggregate risks in many cases follow a similar pattern, beneath the surface there are significant variations among countries. As one looks deeper into the individual metrics, more distinct patterns emerge. For example, there are wide variations in energy efficiency, domestic fuels production, energy mix, and consumption levels. Often, countries will score relatively better on some measures but not others. Some countries are blessed with great mineral and fuel endowments while others are resource-scarce. Countries with greater rainfall and the right topography
6 This comparison excludes the Russian Federation and the Ukraine as data for these two countries were not available until 1992.
7 Pre-1992 data for the Russian Federation and the Ukraine are unavailable.
have significant hydroelectric opportunities that other countries may not. A country’s overall risk score reflects all of these relative advantages and disadvantages.
It is also true that policies matter and contribute to the differences among countries, and exploring these differences can lead to a better understanding of how policy choices regarding energy supply development, efficiency, and technology, among others, can improve energy security both over time and relative to other countries.
What comparative advantage countries have achieved over the past decade or so has been in slowing the relative increase in risk compared to other countries. In many cases, actual declines in some metrics—greater domestic natural gas production reducing import exposure risks, for example—have contributed to lowering the rise in overall risk.
We have observed how energy security risks change for countries, both over time and relative to other countries. These changes arise from global factors, country-specific factors, and policies. Collectively, over time we can observe how the changes affect the relative rankings among the large energy user group. Table 2 ranks energy security risks from the most secure to the least secure—that is, from best to worst—revealing a broad range of energy security risks among the countries selected.

www.energyxxi.org 19
international index of Energy security Risk
table 2. Energy security Rankings for large Energy User group: 1980–2010
1980 1985 1990 1995 2000 2005 2010Australia 3 6 4 4 3 3 6Brazil 13 9 15 16 18 17 21Canada 8 8 6 6 7 7 8China 23 22 18 12 6 14 15Denmark 19 17 14 17 11 9 5France 15 15 17 14 17 15 11Germany 16 16 23 13 8 10 9India 6 7 7 8 12 13 12Indonesia 2 2 2 3 4 4 10Italy 20 19 22 21 21 21 20Japan 18 20 20 23 20 18 18Mexico 1 1 1 1 2 1 1Netherlands 17 18 21 20 19 22 22New Zealand 7 5 5 5 5 5 4Norway 10 12 16 18 15 6 3Poland 22 21 10 10 9 8 13Russian Federation NA NA NA 22 22 20 14South Africa 12 13 9 9 10 12 16South Korea 21 23 19 24 24 23 23Spain 11 14 11 15 16 19 17Thailand 14 11 13 19 23 24 24Turkey 5 4 12 11 14 16 19Ukraine NA NA NA 25 25 25 25United Kingdom 4 3 3 2 1 2 2United States 9 10 8 7 13 11 7
Some countries, such as Mexico, the United Kingdom and Australia, consistently have had risk scores that compare favorably to the OECD average. Other countries, like Denmark, have improved considerably over the years, while others—notably China—improved only to slip back down the list. Still others, like India and Turkey, have gone from good to bad over the years, and some, like Brazil, the Netherlands, and South Korea, have gone from bad to worse. The table also shows that for many major emerging economies like China, India, and South Africa, rapid economic growth since around 2000 has increased energy demand and exacerbated underlying energy security risks.
Emerging trends, reflecting the new global energy landscape, could heighten energy insecurity and affect these scores going forward. Energy poverty haunts billions of people worldwide, and many developing countries have made the provision of modern energy services to their people a priority, knowing the positive impact reliable energy has on economic growth and prosperity.
At the same time as new demand growth is emerging, more and more global energy resources are becoming inaccessible. Resource nationalism is on the rise, state-owned oil companies command a growing share of global reserves, project costs are climbing rapidly, and qualified engineers and skilled
20 2012 Edition
institute for 21st Century Energy
workers are becoming increasingly scarce. These trends promise to place tremendous pressure on energy markets for years to come.
large Energy User group Country summaries
The summaries that follow provide a brief sketch of the energy security risks for each country in the large energy user group, including a description of how it compares to the OECD average and those aspects of energy security that have had the greatest impact, both positively and negatively. The countries are listed in alphabetical order.
Accompanying each country summary are: (1) a table showing those years with historically high and low energy security risks (more detailed data on the energy security risks for each country are presented in Appendix 3); (2) a chart showing that country’s energy security risk trend and the OECD average trend since 1980; and (3) a chart showing the variance, as a percent, between that country’s risk scores and the OECD average score, indicating trends in that country’s overall energy security risk vis-à-vis the OECD average.
As a word of caution, because the data for many countries are not as robust or as detailed as U.S. data, readers should place less emphasis on precise values or changes in metrics from one year to the next. Instead, placing more emphasis on broader trends within and across countries is more suited to the available data.

www.energyxxi.org 21
international index of Energy security Risk
500
600
700
800
900
1,000
1,100AustraliaOECD Average
1980
1985
1990
1995
2000
2005
2010
Ris
k In
dex
Sco
re
Australia vs. oECD: Risk index scores
-25
-20
-15
-10
-5
0
5AustraliaOECD Average
1980
1985
1990
1995
2000
2005
2010
Perc
ent
Australia: Risk Variance from oECD
Energy security Risk summary: Australia
Risk Scores:
2010 Energy Security Risk Score 942
2010 Large Energy User Group Rank 6
Score in Previous Year 882
Rank in Previous Year 4
Score in 1980 785
Best Energy Security Risk Score 642 (1994)
Worst Energy Security Risk Score 942 (2010)
Risk Scores Relative to OECD Average:
Average Annual Difference 1980-2010 -10%
Best Relative Score -22% (1980)
Worst Relative Score -5% (1999)
Australia is a large producer of coal and natural gas and its energy security risk scores consistently have been among the best of the large energy users. As a net energy exporter—it is the world’s largest exporter of coal and fourth largest exporter of liquefied natural gas (LNG)—Australia’s import exposure risks are well below the OECD average. Its large volume of exports also contributes to improving the energy security of other countries by enhancing the reliability and diversity of global and regional coal and natural gas supplies. The country depends on imports, however, for most of its oil.
Coal has been the mainstay of Australia’s energy supply, meeting about 40% of primary energy demand. The share of total energy demand met by oil has been declining over many years while the share of natural gas has roughly doubled since 1980.
Australia has enjoyed relatively low electricity prices over the years largely because inexpensive coal is the dominant fuel used in power production.
Australia
22 2012 Edition
institute for 21st Century Energy
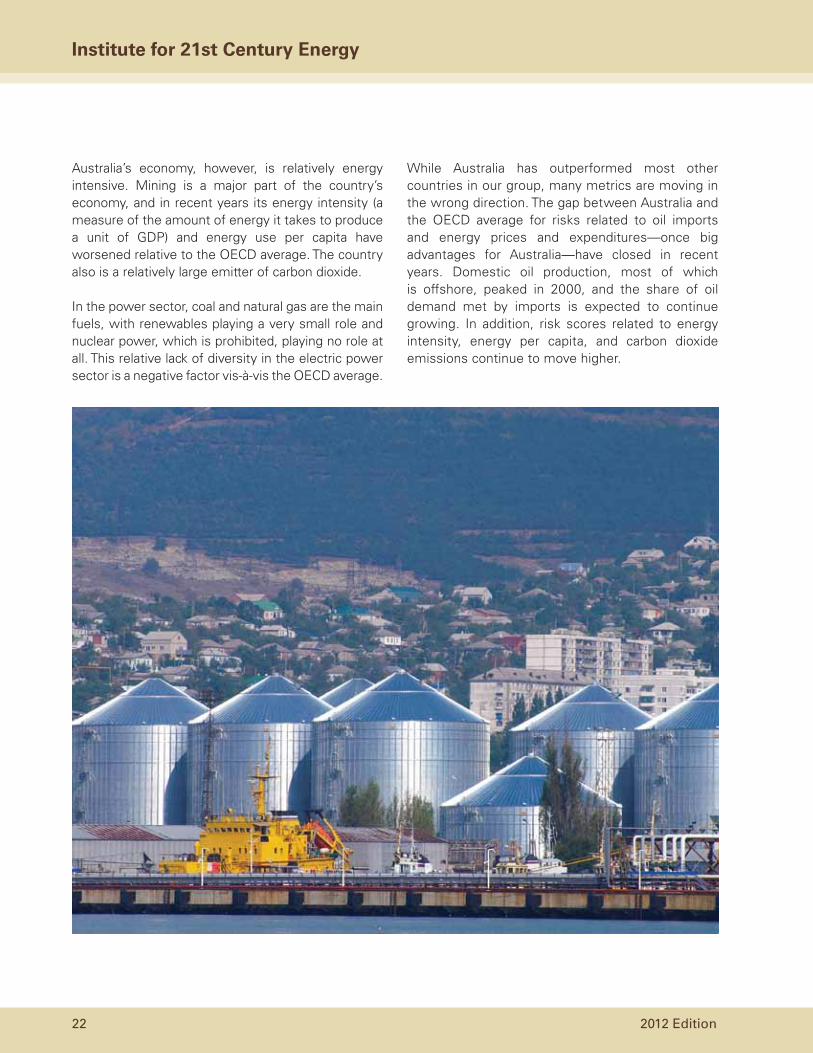
Australia’s economy, however, is relatively energy intensive. Mining is a major part of the country’s economy, and in recent years its energy intensity (a measure of the amount of energy it takes to produce a unit of GDP) and energy use per capita have worsened relative to the OECD average. The country also is a relatively large emitter of carbon dioxide.
In the power sector, coal and natural gas are the main fuels, with renewables playing a very small role and nuclear power, which is prohibited, playing no role at all. This relative lack of diversity in the electric power sector is a negative factor vis-à-vis the OECD average.
While Australia has outperformed most other countries in our group, many metrics are moving in the wrong direction. The gap between Australia and the OECD average for risks related to oil imports and energy prices and expenditures—once big advantages for Australia—have closed in recent years. Domestic oil production, most of which is offshore, peaked in 2000, and the share of oil demand met by imports is expected to continue growing. In addition, risk scores related to energy intensity, energy per capita, and carbon dioxide emissions continue to move higher.

www.energyxxi.org 23
international index of Energy security Risk
Energy security Risk summary: brazil
Risk Scores:
2010 Energy Security Risk Score 1,165
2010 Large Energy User Group Rank 21
Score in Previous Year 1,159
Rank in Previous Year 17
Score in 1980 1,147
Best Energy Security Risk Score 831 (2003)
Worst Energy Security Risk Score 1,165 (2010)
Risk Scores Relative to OECD Average:
Average Annual Difference 1980-2010 +15%
Best Relative Score +3% (1985)
Worst Relative Score +24% (2001)
Brazil provides an example of a country that could change its energy security picture dramatically for the better. For two decades after 1980, Brazil’s energy security risk scores were higher than the OECD average, rising from 15% above the OECD benchmark in 1980 to 24% above in 2001. From 2003 to 2009, however, the gap with the OECD was about 12%. While a big improvement, it was short lived and this gap widened to 18% in 2010.
Brazil is by far the largest economy in South America, and it has the largest population and energy appetite of any country on the continent. It also is a big and growing energy producer.
One of the biggest turnarounds has been its changing oil import posture. After many years of steadily increasing domestic production, in 2009 Brazil became
a net oil exporter. Brazil’s large ethanol industry—the world’s second biggest—has contributed to this by displacing some of the demand for petroleum-based
500
600
700
800
900
1,000
1,100
1,200BrazilOECD Average
1980
1985
1990
1995
2000
2005
2010
Ris
k In
dex
Sco
re
brazil vs. oECD: Risk index scores
-5
0
5
10
15
20
25
BrazilOECD Average
1980
1985
1990
1995
2000
2005
2010
Perc
ent
brazil: Risk Variance from oECD
Brazil

24 2012 Edition
institute for 21st Century Energy
liquid fuels (though recent declines in ethanol output have had to be made up with imports from the U.S.). Although Brazil has been a net importer of natural gas since 1999, its domestic production has risen and since 2007 has more than doubled, sending the country’s import risk for this product much lower. Coal, however, presents a growing import risk, as its domestic production has not kept pace with demand.
Brazil is poised to become a large producer and exporter of crude oil. Recent “pre-salt” finds in deep water off Brazil’s coast are significant. Two fields being developed for commercial production hold an estimated 8.3 billion barrels of oil equivalent in crude oil and natural gas. Overall, the pre-salt fields being explored off Brazil’s coast could contain as much as 50 billion barrels of oil equivalent. So in addition to improving its own energy security, it promises to reduce the reliability and diversity risks attached to global oil supplies.
Hydroelectric power dominates Brazil’s electricity generating sector, accounting for about three-quarters of total capacity. This reliance on hydroelectric power means that Brazil’s electric capacity diversity risks are much worse than the OECD average. While new hydroelectric capacity is being installed, Brazil is looking to diversify to avoid disruptions that could occur in the case of drought.
As with most of the emerging economies on the large energy user group, Brazil uses more energy and emits more carbon dioxide to produce a unit of GDP than the OECD average, and the rate of improvement generally is less than the OECD. Also characteristic of emerging economies, Brazil uses less energy and emits less carbon dioxide per person than the OECD average, but as the country develops further, these measures should move higher.

www.energyxxi.org 25
international index of Energy security Risk
Energy security Risk summary: Canada
Risk Scores:
2010 Energy Security Risk Score 995
2010 Large Energy User Group Rank 8
Score in Previous Year 922
Rank in Previous Year 7
Score in 1980 935
Best Energy Security Risk Score 712 (2002)
Worst Energy Security Risk Score 995 (2010)
Risk Scores Relative to OECD Average:
Average Annual Difference 1980–2010 -3%
Best Relative Score +8% (1983)
Worst Relative Score +1% (1999)
Over most of the period from 1980 to 2010, Canada’s energy security risks hewed closely to the OECD average. In 2010, its overall risk score was just 1% higher than the OECD average, although in most years it has been slightly lower.
While its energy security risk scores are very similar to those for the OECD average, its energy economy is very different from the average OECD country. Like Australia, Canada has extensive hydrocarbon resources and is a large energy producer and exporter. It is the world’s third largest producer of natural gas, sixth largest producer of crude oil, and fourth largest producer of coal. It is a large exporter of all of these commodities. The U.S. is the natural market for much of this energy, but Asia is becoming a bigger customer, particularly China.
As a result, Canada’s oil, natural gas, and coal have negligible import exposure risk, a situation that
500
600
700
800
900
1,000
1,100CanadaOECD Average
1980
1985
1990
1995
2000
2005
2010
Ris
k In
dex
Sco
re
Canada vs. oECD: Risk index scores
-10
-5
0
5CanadaOECD Average
1980
1985
1990
1995
2000
2005
2010
Perc
ent
Canada: Risk Variance from oECD
Canada

26 2012 Edition
institute for 21st Century Energy
compares very favorably with the OECD. Also, because Canada is a stable and reliable trading partner, Canadian production and exports of these fuels enhances energy security globally. In particular, the addition of about 175 billion barrels of oil reserves from Canada’s oil sands marked a major improvement in the risk index for global crude oil reserves, and as production from these reserves increases, diversity and reliability measures of world oil production should also improve.
In the electricity sector, Canada also is among the world’s largest producers of hydroelectric power. Roughly 60% of its generating capacity is hydroelectric, and an additional 10% is nuclear power. Conventional thermal capacity accounts for about 27%. Canada therefore scores better that the OECD average in non-carbon power generation. However, Canada’s power sector shows a higher level of capacity concentration than the OECD average.
Canada is a large country with a cold climate and a low population density, and a lot of energy is used for
space heating and travel. It is not surprising, therefore, that its risk measures of energy intensity and energy use per capita, especially in the transportation sector, are above the OECD average. In fact, Canada has the largest energy use per capita of any country in the large energy user group. This is also reflected in Canada’s relatively large carbon dioxide emissions per capita. Greater energy efficiency could improve all of these metrics.
On balance, Canada’s energy security is about average, but it has tremendous potential to improve its own security. It can also contribute to better the energy security of other nations through further development of its oil sands. Much will depend, however, on market conditions and the development of necessary infrastructure to bring this oil to international markets, including pipeline infrastructure to move this oil from Alberta to U.S. markets via the Keystone XL pipeline and to Asian markets via the Northern Gateway pipeline to Canada’s west coast.

www.energyxxi.org 27
international index of Energy security Risk
Energy security Risk summary: China
Risk Scores:
2010 Energy Security Risk Score 1,098
2010 Large Energy User Group Rank 15
Score in Previous Year 1,022
Rank in Previous Year 16
Score in 1980 1,497
Best Energy Security Risk Score 712 (1999)
Worst Energy Security Risk Score 1,497 (1980)
Risk Scores Relative to OECD Average:
Average Annual Difference 1980–2010 +19%
Best Relative Score -2% (1999)
Worst Relative Score +50% (1980)
Of all the countries in the large energy user group, China has displayed the widest range of risk relative to the OECD average. From a score of 1,497 in 1980, its energy security risk index plunged to just 712 in 1999, a level just below the OECD average. This represents a tremendous improvement over two decades. However, since 2000—a period of tremendous economic growth averaging over 10% a year—a large portion of these real and relative gains were erased. By 2010, its overall energy security risk score came in at nearly 1,100.
In the International Index, several of the metrics are developed as intensity ratios, where the denominator is the country’s GDP. This allows us to make comparisons among countries of different sizes, placing their energy use on a more consistent basis. For rapidly developing countries such as China, the trends in these intensity ratios reflect the rapid changes in energy use relative to the rapid changes in GDP.
In the two decades after 1980, many countries benefited from the generally improving conditions in global energy security metrics—things like the
500
600
700
800
900
1,000
1,100
1,200
1,300
1,400
1,500ChinaOECD Average
1980
1985
1990
1995
2000
2005
2010
Ris
k In
dex
Sco
re
China vs. oECD: Risk index scores
-505
10152025303540455055
ChinaOECD Average
1980
1985
1990
1995
2000
2005
2010
Perc
ent
China: Risk Variance from oECD
China

28 2012 Edition
institute for 21st Century Energy
reliability and diversity of international supplies of fossil fuels and lower crude oil prices—perhaps none so much as China.
But China also made large advances internally, many of which appear to be related to the introduction of market reforms by the government. Energy intensity, oil intensity, and carbon dioxide emissions intensity all showed very large improvements. Energy expenditures as a share of GDP also dropped sharply over this period.Since 2000, however, improving oil intensity has been about the only bright spot for China. Virtually every other national measure deteriorated or, at best, changed little. Rapid economic expansion over the decade increased the demand for energy. Indeed, China is now the world’s largest energy consumer, and its demand continues to grow rapidly.
China’s domestic energy production, however, has not been able to keep pace with demand growth. As a result, all fuel import-related measures of energy security now show much higher risks than in previous decades. China was until the early 1990s a net oil exporter, but is now the world’s second largest net oil importer (behind the United States). Also, over 70% of China’s energy is derived from coal, and while the country remains the world’s largest coal producer, demand for coal began outstripping domestic supplies, and in 2008 China became a net coal importer.
In 2007, China also became an importer of natural gas, most of which is in the form of LNG from Australia. Natural gas accounts for only about 3% of China’s energy mix, but its use is growing rapidly. EIA’s recent shale gas study, World Shale Gas Resources: An Initial Assessment of 14 Regions Outside the U.S.,8 suggests that China has a potentially huge shale gas resource9 on the order of 1.3 quadrillion
8 EIA. World Shale Gas Resources: An Initial Assessment of 14 Regions Outside the U.S.. April 5, 2011. Available at: http://www.eia.doe.gov/analysis/studies/worldshalegas/.
9 EIA’s World Shale Gas Resources report provides estimates of “technically-recoverable resources.” A technically-recoverable resource is a broad measure of potential value, which is different from a “technically recoverable reserve,” which has actual value and can be extracted.
cubic feet, a much larger resource than in any other country EIA examined. China is beginning to explore and tap these gas-bearing shale formations, and if they can be developed successfully, they could improve China’s energy security as shale gas is doing in the U.S.
China’s power sector also shows little capacity diversity. Coal provides about three-quarters of power production. Natural gas-fired and nuclear generating plants provide only a small portion of capacity at present, but the Chinese government plans on using more of both. China has 15 nuclear reactors and plans are in place for another 65.10 Renewable hydropower is the second largest source of power generation in China. Its Three Gorges Dam hydroelectric facility is the world’s largest. Wind capacity has grown rapidly in recent years, but a shortage of transmission infrastructure means much of it is unconnected to the grid.
China’s energy intensity has shown significant improvement over the years, but both in absolute terms and relative to the OECD baseline, it is still quite high by OECD standards and in 2010 was the third worst in the large energy user group, beating only Russia and the Ukraine. Since 2000, as its middle class has grown and vehicle ownership has become more common, China’s oil intensity and transportation energy intensity, both high to begin with, have gotten worse relative to the OECD average, and these trends are expected to continue.
Even in its per capita energy use and emissions measures, where China presently scores considerably better than the OECD average, the trends are moving in the wrong direction, as one would expect to see in a rapidly growing economy.
China’s energy-related carbon dioxide emissions also are the highest in the world, and these, too, continue to grow rapidly. Since about 2000, China’s economy
10 The accident at the Fukushima Daiichi plant in Japan in March 2011 caused a temporary suspension of government approvals for new nuclear plants. It has since been lifted.

www.energyxxi.org 29
international index of Energy security Risk
has been “recarbonizing” rather than decarbonizing. Again, this is a pattern that is observed in other emerging economies, as well.
Given China’s growing energy demand and worsening energy security situation, the push for greater energy efficiency and stable and diverse energy supplies has taken on strategic importance. Evidence shows that China is conducting an intensive search for all available energy supplies, ranging from coal to hydroelectric power, both at home and abroad.
A recent report11 commissioned by the Energy Institute notes that China is making a wide range
11 Institute for 21st Century Energy. China’s Quest for Energy. 2012. Available at: <http://www.energyxxi.org/sites/default/files/EnergyChina_Final%2011-22-11.pdf>.
of strategic investments to ensure reliable supplies of energy to sustain its economic growth. For example, the country is taking steps to strengthen its energy security through direct investment in energy projects and indirectly through investments in related energy infrastructure projects overseas. Chinese oil companies are also pursuing strategic alliances with energy companies overseas, including those operating in the Canadian oil and U.S. shale gas plays. Because of its size and energy appetite, how China handles these issues will impact not only its own energy security risks, but those of other countries, as well.

30 2012 Edition
institute for 21st Century Energy
Energy security Risk summary: Denmark
Risk Scores:
2010 Energy Security Risk Score 942
2010 Large Energy User Group Rank 5
Score in Previous Year 945
Rank in Previous Year 9
Score in 1980 1,331
Best Energy Security Risk Score 743 (2002)
Worst Energy Security Risk Score 1,370 (1981)
Risk Scores Relative to OECD Average:
Average Annual Difference 1980–2010 +12%
Best Relative Score -5% (2010)
Worst Relative Score +38% (1981)
In 2010 Denmark was the fifth most secure country in our large energy user group. It is the only year in the record showing Denmark with a score below the OECD average. Between 1997 and 2000, Denmark rapidly closed the gap with the OECD, and in 2010, its energy security risk fell to 5% below the OECD average.
Denmark produces small amounts of oil and natural gas almost entirely from fields located in the North Sea. Production of these fuels is enough, however, to make the country a net exporter of both beginning in 1996 for oil and 1984 for natural gas. The country produces no coal and must import what it uses. When all of these fuels are taken into account, the amount of money Denmark spends on imports is much lower than the OECD average.
In the power sector, thermal generators account for most of the capacity. Since about 1997, Denmark
has installed a relatively large amount of renewable capacity, mostly wind and biomass/waste. More natural gas also is being used. Each of these factors has helped reduce the need for coal imports, which
500
600
700
800
900
1,000
1,100
1,200
1,300
1,400DenmarkOECD Average
1980
1985
1990
1995
2000
2005
2010
Ris
k In
dex
Sco
re
Denmark vs. oECD: Risk index scores
-5
0
5
10
15
20
25
30
35
40DenmarkOECD Average
1980
1985
1990
1995
2000
2005
2010
Perc
ent
Denmark: Risk Variance from oECD
Denmark

www.energyxxi.org 31
international index of Energy security Risk
has lowered the country’s coal-related import risks (though this risk remains higher than the OECD average). The shift towards more expensive sources of energy, however, is seen in Denmark’s electricity prices, which have been well above the OECD average and over the past decade have been moving relatively higher still.
Moderating the risks from increasing energy prices is efficiency in use of energy. The country is one of the most energy efficient in the world, and its energy intensity in 2010 was the best among the large energy user group. Generally, the amount of energy, oil, or transportation fuel needed to create a dollar’s worth of GDP in Denmark is lower than the OECD average, and the average amount used by each person also is lower. Denmark’s carbon dioxide emission trends generally are in line with the OECD average.

32 2012 Edition
institute for 21st Century Energy
Energy security Risk summary: France
Risk Scores:
2010 Energy Security Risk Score 1,028
2010 Large Energy User Group Rank 11
Score in Previous Year 990
Rank in Previous Year 14
Score in 1980 1,236
Best Energy Security Risk Score 798 (1997)
Worst Energy Security Risk Score 1,236 (1980)
Risk Scores Relative to OECD Average:
Average Annual Difference 1980–2010 +13%
Best Relative Score +4% (2010)
Worst Relative Score +24% (1980)
France’s energy security score for 2010 was somewhat (4%) higher than the OECD average. This represents a big improvement over the period, as in 1980 France’s score was 24% higher than the OECD average.
France, the world’s sixth biggest economy in 2010, has very little in the way of energy resources, so it must rely on imports for much of its energy. Oil, natural gas, and coal production are negligible, and these commodities are imported to meet domestic demand. Energy import risks are therefore a big factor pushing France’s energy security risk index higher in recent years, though at a slower rate than the OECD average.
France displays a relatively high degree of energy efficiency that helps moderate a variety of risks. For example, the intensity and per capita measures of
energy expenditures have been below the OECD average over the period even as retail electricity prices generally have been above the average.
France
500
600
700
800
900
1,000
1,100
1,200
1,300FranceOECD Average
1980
1985
1990
1995
2000
2005
2010
Ris
k In
dex
Sco
re
France vs. oECD: Risk index scores
-5
0
5
10
15
20
25FranceOECD Average
1980
1985
1990
1995
2000
2005
2010
Perc
ent
France: Risk Variance from oECD
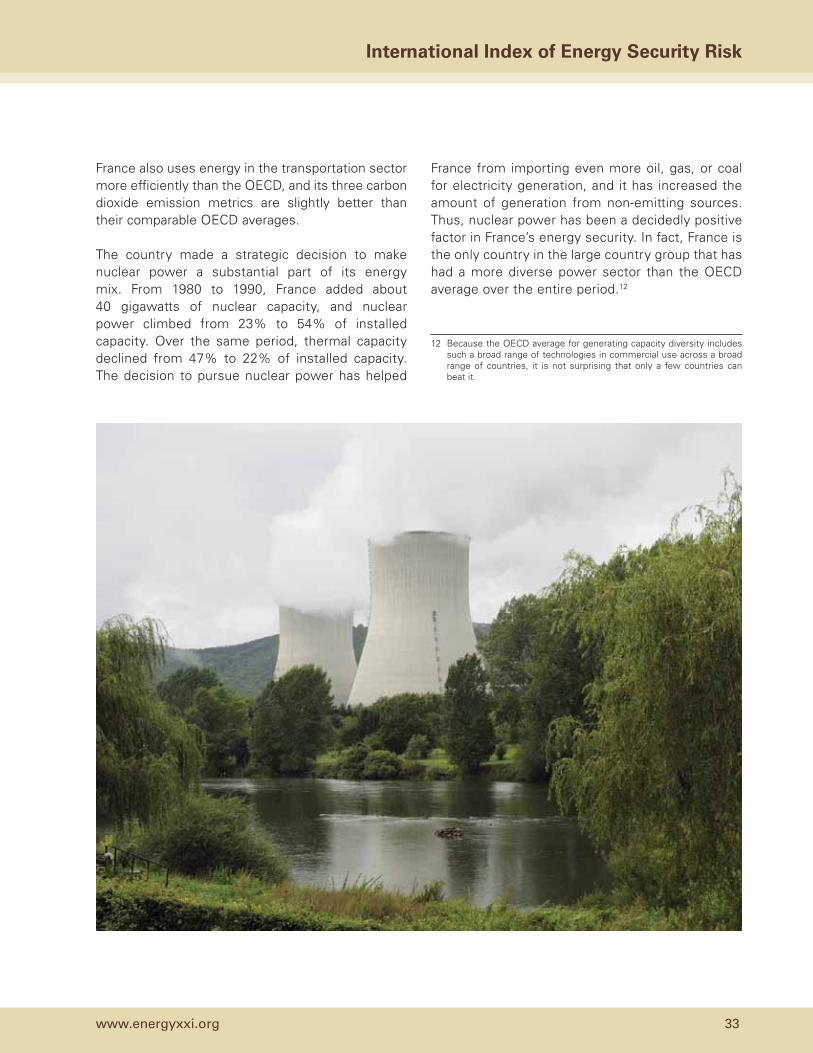
www.energyxxi.org 33
international index of Energy security Risk
France also uses energy in the transportation sector more efficiently than the OECD, and its three carbon dioxide emission metrics are slightly better than their comparable OECD averages.
The country made a strategic decision to make nuclear power a substantial part of its energy mix. From 1980 to 1990, France added about 40 gigawatts of nuclear capacity, and nuclear power climbed from 23% to 54% of installed capacity. Over the same period, thermal capacity declined from 47% to 22% of installed capacity. The decision to pursue nuclear power has helped
France from importing even more oil, gas, or coal for electricity generation, and it has increased the amount of generation from non-emitting sources. Thus, nuclear power has been a decidedly positive factor in France’s energy security. In fact, France is the only country in the large country group that has had a more diverse power sector than the OECD average over the entire period.12
12 Because the OECD average for generating capacity diversity includes such a broad range of technologies in commercial use across a broad range of countries, it is not surprising that only a few countries can beat it.

34 2012 Edition
institute for 21st Century Energy
Energy security Risk summary: germany
Risk Scores:
2010 Energy Security Risk Score 1,006
2010 Large Energy User Group Rank 9
Score in Previous Year 959
Rank in Previous Year 10
Score in 1980 1,255
Best Energy Security Risk Score 729 (2002)
Worst Energy Security Risk Score 1,255 (1980)
Risk Scores Relative to OECD Average:
Average Annual Difference 1980-2010 +12%
Best Relative Score -2% (2007)
Worst Relative Score +36% (2001)
Note: For consistency, East German data and West German data have been combined to yield “German” data from 1980 to 1990.
In the decade following reunification, Germany’s energy security risk scores were roughly 10% higher than the OECD. Since about 2000, however, its scores, while worsening overall, have tended to track fairly closely with the OECD as a whole.
Germany is the largest economy in Europe and fourth largest in the world. It also has the largest population in Europe. Its economy has a large manufacturing sector, and it is Europe’s top energy user.
The country relies on imports to meet a large share of its energy needs. It produces a very small amount of crude oil, a modest amount of natural gas, and a large amount of coal (it is the eighth largest producer in the
world). Germany’s demand for all of these products exceeds its domestic supply, making it reliant on imports of all these fuels. As a result, its import risks
Germany
500
600
700
800
900
1,000
1,100
1,200
1,300GermanyOECD Average
1980
1985
1990
1995
2000
2005
2010
Ris
k In
dex
Sco
re
germany vs. oECD: Risk index scores
-5
0
5
10
15
20
25
30
35
40GermanyOECD Average
1980
1985
1990
1995
2000
2005
2010
Perc
ent
germany: Risk Variance from oECD
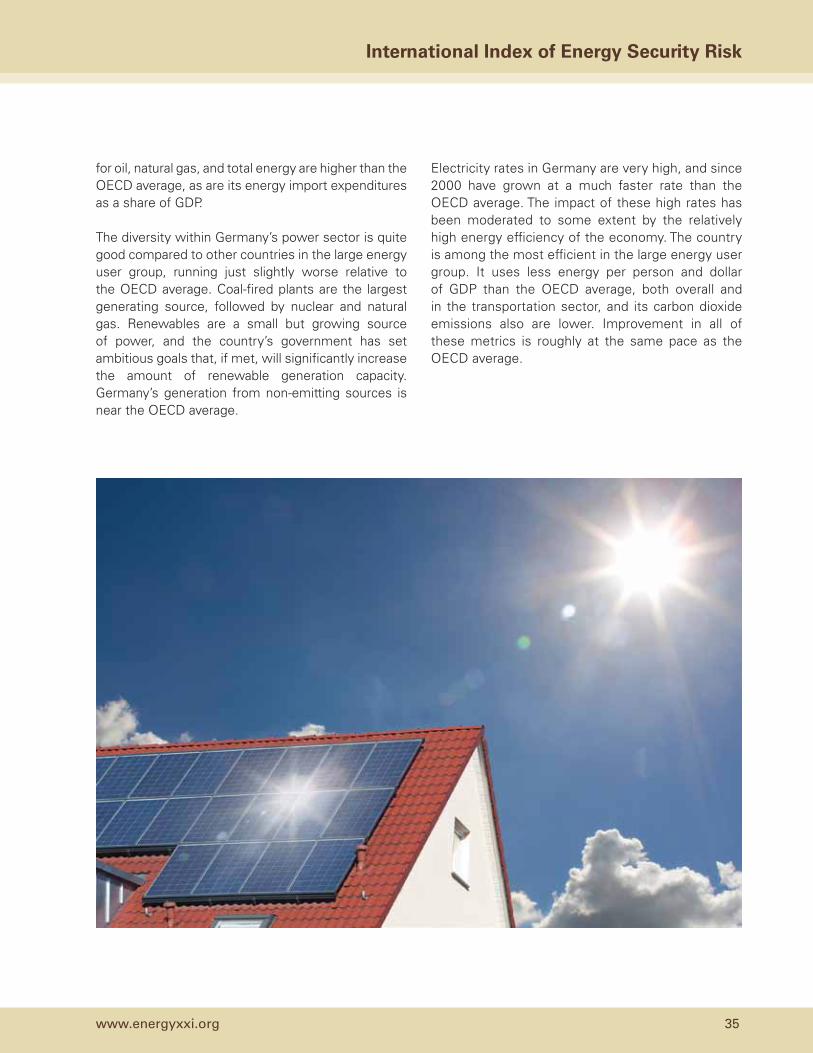
www.energyxxi.org 35
international index of Energy security Risk
for oil, natural gas, and total energy are higher than the OECD average, as are its energy import expenditures as a share of GDP.
The diversity within Germany’s power sector is quite good compared to other countries in the large energy user group, running just slightly worse relative to the OECD average. Coal-fired plants are the largest generating source, followed by nuclear and natural gas. Renewables are a small but growing source of power, and the country’s government has set ambitious goals that, if met, will significantly increase the amount of renewable generation capacity. Germany’s generation from non-emitting sources is near the OECD average.
Electricity rates in Germany are very high, and since 2000 have grown at a much faster rate than the OECD average. The impact of these high rates has been moderated to some extent by the relatively high energy efficiency of the economy. The country is among the most efficient in the large energy user group. It uses less energy per person and dollar of GDP than the OECD average, both overall and in the transportation sector, and its carbon dioxide emissions also are lower. Improvement in all of these metrics is roughly at the same pace as the OECD average.

36 2012 Edition
institute for 21st Century Energy
Energy security Risk summary: india
Risk Scores:
2010 Energy Security Risk Score 1,045
2010 Large Energy User Group Rank 12
Score in Previous Year 976
Rank in Previous Year 11
Score in 1980 863
Best Energy Security Risk Score 725 (1994)
Worst Energy Security Risk Score 1,045 (2010)
Risk Scores Relative to OECD Average:
Average Annual Difference 1980-2010 -1%
Best Relative Score -14% (1980)
Worst Relative Score +9% (2001)
From 1980 to the mid-1990s, India’s energy security risks were better than the OECD average. Since the mid-1990s, India’s risks have grown both absolutely and relative to the OECD, and rapid economic growth may push risks ever higher in the near term.
India has the world’s 11th largest economy, more by virtue of its very large population (the world’s second biggest) than its per capita GDP, which is below $1,000 per year (in 2005 dollars). India also is the world’s fourth largest energy consumer, and its energy demand is growing rapidly as its economy expands. Still, hundreds of millions of Indians lack access to electricity, and its per capita energy use is the lowest in the large energy user group.
India is unable to meet all of its domestic energy requirements, so it imports large amounts of fossil fuels. For most of the period under consideration,
India was a net importer of oil and natural gas. India is, however, among the world’s largest coal producers—only China and the United States produce more—and
India
500
600
700
800
900
1,000
1,100IndiaOECD Average
1980
1985
1990
1995
2000
2005
2010
Ris
k In
dex
Sco
re
india vs. oECD: Risk index scores
-15
-10
-5
0
5
10
IndiaOECD Average
1980
1985
1990
1995
2000
2005
2010
Perc
ent
india: Risk Variance from oECD

www.energyxxi.org 37
international index of Energy security Risk
was self-sufficient in this fuel until 2004. Since then, coal imports have grown rapidly, making India’s already challenging import posture even more challenging. This is especially the case in terms of fossil fuel import expenditures as a share of GDP, which since 2000 have grown worse compared to the OECD average.
In 2010, more than half of India’s total energy demand was met by coal and about a third was met by oil. Natural gas is a relatively small player in India’s energy economy, accounting for less than 10% of demand, and most of it is imported. (EIA suggests potential shale gas resources are nearly double India’s current reserve estimate.)
Coal is the dominant fuel in the electricity sector. Since 1980, India has added about 90 gigawatts of thermal generating capacity, most of which was coal-fired. Hydroelectric power has also been a large supplier of power. In 1980, it was about one-third of installed capacity, but that share has fallen to about one-fifth today. Still, India has the sixth largest hydroelectric capacity in the world. India also has (controversially) added about 4 gigawatts of nuclear power since 1980, bringing its total to less than 3% of capacity. More nuclear facilities are being planned.
India’s retail electricity rates are very low compared to the OECD average, which reflects a number of factors, including government policy. India’s power sector, however, is not very diverse.
Oil’s share of the India energy mix is lower than for most developed countries, and its per capita use of oil is well below the OECD average. As the economy expands further and vehicle ownership rises, oil’s share should grow.
Like many emerging economies, India’s economy is relatively inefficient in its energy use. Its overall measure of energy intensity, as well as its petroleum and transportation energy intensities, do not compare favorably with the OECD average. These measures, however, have been showing great improvement, as GDP grows faster than energy use.
India also is a major emitter of carbon dioxide. But analogous to its economy, India’s status as a large emitter is due more to its large population rather than its per capita emissions, which are comparatively small (but are growing). Nevertheless, India’s economy over the entire period since 1980 has been carbonizing consistently rather than decarbonizing—again, a not uncommon situation for an emerging economy.

38 2012 Edition
institute for 21st Century Energy
Energy security Risk summary: indonesia
Risk Scores:
2010 Energy Security Risk Score 1,013
2010 Large Energy User Group Rank 10
Score in Previous Year 941
Rank in Previous Year 8
Score in 1980 720
Best Energy Security Risk Score 613 (1992)
Worst Energy Security Risk Score 1,013 (2010)
Risk Scores Relative to OECD Average:
Average Annual Difference 1980–2010 -11%
Best Relative Score -28% (1980)
Worst Relative Score +2% (2010)
Indonesia had for many years enjoyed energy security risk scores much lower than the OECD average, but since the mid-2000s, its scores have begun to edge higher than the OECD. Its risk score in 2010 exceeded its 1980 score by roughly 40%, a level of increase only two other countries in the large energy user group—Thailand and Turkey—matched.
Since 1980, Indonesian primary energy demand has increased about 450%. Indonesia is rich in energy resources, producing large amounts of oil, natural gas, and, especially, coal. It is a large exporter of natural gas and coal (second only behind Australia). The country’s large exports of these products enhances the global supply diversity of these fuels.
Indonesia has had difficulty attracting private investment, which has affected its ability to replenish domestic supplies to meet rapidly growing demand.
The country was for many years a large exporter of oil, but because of a combination of increasing demand and declining production, in 2004 it became a net
Indonesia
500
600
700
800
900
1,000
1,100IndonesiaOECD Average
1980
1985
1990
1995
2000
2005
2010
Ris
k In
dex
Sco
re
indonesia vs. oECD: Risk index scores
-30
-25
-20
-15
-10
-5
0
5
IndonesiaOECD Average
1980
1985
1990
1995
2000
2005
2010
Perc
ent
indonesia: Risk Variance from oECD

www.energyxxi.org 39
international index of Energy security Risk
importer of oil, and in January 2009 it suspended its membership in OPEC.
As a result, Indonesia’s oil and natural gas import risks, while still favorable compared to the OECD average, are moving higher and are largely responsible for the Indonesia’s worsening energy security posture relative to OECD baseline.
The Indonesian power sector relies on fossil fuels for about 85% of its electricity generation, with coal alone accounting for about 40% of total generation. The use of coal in power generation is encouraged because of its abundant supply and low cost especially compared to fuel oil. The remainder comes from hydroelectric and geothermal power (Indonesia is the world’s third
largest producer of power from geothermal energy). There are no nuclear power plants operating in Indonesia. About 30% of the Indonesian population is unconnected to the power grid, and an additional 20 gigawatts in capacity, primarily coal, is being planned.
Like most other large emerging economies, emissions of carbon dioxide from energy pose an increasing risk relative to the OECD baseline.13 Perhaps the largest risks are those connected to energy use overall and in the transportation sector. The amount of energy used to produce a unit of GDP in Indonesia is higher now than it was in 1980.
13 The International Index only looks at carbon dioxide emissions from energy. Indonesia is also a very large emitter of carbon dioxide from deforestation.

40 2012 Edition
institute for 21st Century Energy
Energy security Risk summary: italy
Risk Scores:
2010 Energy Security Risk Score 1,159
2010 Large Energy User Group Rank 20
Score in Previous Year 1,127
Rank in Previous Year 21
Score in 1980 1,382
Best Energy Security Risk Score 919 (1997)
Worst Energy Security Risk Score 1,382 (1980)
Risk Scores Relative to OECD Average:
Average Annual Difference 1980-2010 +26%
Best Relative Score +17% (2010)
Worst Relative Score +38% (1980)
Italy’s overall energy security risk has consistently been quite a bit higher than the OECD average, ranging from 38% to 17% above. While its absolute risk has been growing since the mid-1990s, it was still lower in 2010 than in 1980. Nevertheless, at over 1,100, its average risk score is one of the highest among developed countries.
The seventh largest economy in the world and the fourth largest in Europe, Italy produces very little of its own energy supply. Like many Western European countries, it relies largely on imports to fuel its economy, and its import risks, especially those related to coal, are greater than the OECD average. Moreover, over the last decade, Italy’s natural gas production has been declining, increasing the country’s reliance upon gas imports, most of which arrive through pipelines. Overall, Italy’s import risks have not grown relative to
the OECD baseline, and the amount the country spends on total imports as a share of GDP is modestly better than the OECD baseline.
Italy
500
600
700
800
900
1,000
1,100
1,200
1,300
1,400ItalyOECD Average
1980
1985
1990
1995
2000
2005
2010
Ris
k In
dex
Sco
re
italy vs. oECD: Risk index scores
-5
0
5
10
15
20
25
30
35
40
45ItalyOECD Average
1980
1985
1990
1995
2000
2005
2010
Perc
ent
italy: Risk Variance from oECD

www.energyxxi.org 41
international index of Energy security Risk
Since the mid-1990s, Italy has been moving away from oil, once the dominant fuel in the sector, and towards natural gas, which is now the most widely used fuel for producing electricity. Coal use also has been growing. Non-emitting capacity is mostly hydroelectric—about 14 gigawatts, the 13th highest in the world. Italy’s small nuclear capacity did not produce any power after passage of an anti-nuclear power referendum in 1987 following the Chernobyl nuclear accident in 1986. Because of its reliance on first oil and now on expensive natural gas for electricity generation, Italy’s electricity prices are higher than the OECD baseline’s.
Italy uses energy more efficiently, and its people use less of it, than the norm for OECD countries, both overall and in the transportation sector. Its carbon dioxide emission trends have tended to be slightly better than the OECD as a whole, as well.

42 2012 Edition
institute for 21st Century Energy
Energy security Risk summary: Japan
Risk Scores:
2010 Energy Security Risk Score 1,119
2010 Large Energy User Group Rank 18
Score in Previous Year 1,071
Rank in Previous Year 18
Score in 1980 1,301
Best Energy Security Risk Score 906 (1998)
Worst Energy Security Risk Score 1,326 (1981)
Risk Scores Relative to OECD Average:
Average Annual Difference 1980–2010 +28%
Best Relative Score +13% (2010)
Worst Relative Score +39% (1986)
Japan has one of the highest energy security risk scores of any of the developed countries in the large energy users group, averaging just over a third higher than the OECD average during the last 31 years. It has the second largest average risk score over the 1980 to 2010 period. Japan has made some improvement, however, and while its overall risk has been climbing over the past decade, its level of risk in 2010 was lower than it was in 1980.
A densely populated country of about 127 million people, Japan was the world’s second largest economy until surpassed by China in 2010. It has a very advanced economy with a variety of industries that need reliable supplies of energy.
With no domestic energy resources of any consequence, Japan imports virtually all of its fuels. Despite its many challenges, Japan has
managed to close the gap with the OECD average over the years. From 39% higher in 1980s, Japan’s energy security risk score was just 13% above the
Japan
500
600
700
800
900
1,000
1,100
1,200
1,300
1,400JapanOECD Average
1980
1985
1990
1995
2000
2005
2010
Ris
k In
dex
Sco
re
Japan vs. oECD: Risk index scores
-5
0
5
10
15
20
25
30
35
40JapanOECD Average
1980
1985
1990
1995
2000
2005
2010
Perc
ent
Japan: Risk Variance from oECD

www.energyxxi.org 43
international index of Energy security Risk
OECD baseline in 2010. The policy response to move away from nuclear power after the incident at the Fukushima Daiichi nuclear station that was triggered by the March 2011 earthquake and tsunami, however, will pose significant energy security challenges going forward.
Japan produces very small quantities of crude oil and natural gas, and it 2001, it stopped producing coal altogether. As a consequence, Japan is among the world’s largest importers of oil, LNG, and coal. Its import exposure risks for all of these commodities, especially coal, are well above the OECD average, as are its import expenditures as a share of GDP. Moreover, because it imports nearly all of its fuel and is an island nation, it is not surprising that the country’s electricity prices also are well above the OECD average.
A great advantage Japan has is its high level of energy efficiency, which acts to moderate and offset some of the unavoidable risks of importing so much energy. For example, Japan’s import expenditures as a share of GDP and per person would be much higher if its economy were not as efficient as it is, and the country’s energy use measures compare quite favorably with the OECD average.
Japan also has a very efficient transportation sector. Its energy use and per capita energy use in this sector are two other measures that are clearly better than their corresponding OECD averages.
The diversity of generating capacity and the share of non-carbon emitting generation in Japan’s power sector are little different from the OECD. The policy reaction to the Fukushima Daiichi accident, however, could have a tremendous impact on these measures going forward. Japan heavily invested in nuclear power as a bulwark against unreliable supplies of imported fossil fuels. From 1980 to 2010, Japan added nearly 30 gigawatts of nuclear capacity (to 45 gigawatts), and in 2010, its 54 reactors accounted for roughly 16% of installed capacity. These plants also are Japan’s only significant source of emissions-free power.
The Fukushima accident created a public backlash against nuclear power that has not abated, and the government has forced many plants to close. If current plans go into effect, all of Japan’s nuclear power plants will be shuttered by the summer of 2012 and will not re-open. To fill the gap, Japan will have to import greater amounts of LNG, coal, and fuel oil to fuel existing plants including those brought out of retirement. These actions could, in turn, lead to greater fuel import insecurity, higher electricity costs and energy expenditures, greater carbon dioxide emissions, and a loss of generating capacity diversity going forward, hence offsetting many of the modest gains Japan has made against the OECD average.

44 2012 Edition
institute for 21st Century Energy
Energy security Risk summary: Mexico
Risk Scores:
2010 Energy Security Risk Score 851
2010 Large Energy User Group Rank 1
Score in Previous Year 783
Rank in Previous Year 1
Score in 1980 659
Best Energy Security Risk Score 551 (1994)
Worst Energy Security Risk Score 851 (2010)
Risk Scores Relative to OECD Average:
Average Annual Difference 1980-2010 -23%
Best Relative Score -34% (1980)
Worst Relative Score -11% (2002)
Except for a few years early in the 2000s, Mexico has consistently been the most energy secure of the large energy using countries over the last 30 years, and it is again number one in 2010. It is number one by virtue of its comparatively good fossil fuel import, energy expenditure, and per capita energy use scores. Energy security risks, however, are growing in Mexico and at a much faster rate than the OECD average. As a result, Mexico’s lead is growing smaller: From 34% better than the OECD in 1980, Mexico was just 14% better in 2010.
Mexico has a large energy sector, focused primarily on oil. The State-owned oil company Petroleos Mexicanos (Pemex) is one of the biggest in the world, and under the Mexican constitution, it is granted what amounts to a monopoly on the exploration, processing and sale of petroleum. Mexico is the world’s seventh largest oil producer, and it is a large
oil exporter. Production levels are declining, however. Output from Cantarell, Mexico’s largest oil field located off Mexico’s southeastern coast, has fallen
Mexico
500
600
700
800
900
1,000
1,100MexicoOECD Average
1980
1985
1990
1995
2000
2005
2010
Ris
k In
dex
Sco
re
Mexico vs. oECD: Risk index scores
-35
-30
-25
-20
-15
-10
-5
0
5
MexicoOECD Average
1980
1985
1990
1995
2000
2005
2010
Perc
ent
Mexico: Risk Variance from oECD

www.energyxxi.org 45
international index of Energy security Risk
sharply in recent years, and increases from other fields have not been enough to offset this decline.
Mexico is a fairly large producer of natural gas, but since 1989, imports have had to supplement domestic supplies and meet demand. The country also produces modest amounts of coal but has been a net importer of this fuel over the entire 31-period. Net imports of both natural gas and coal are growing.
In the power sector, thermal power dominates. Over the past decade or so, Mexico has been backing out oil-fired generators and replacing them mainly with natural gas. The country also employs coal, hydroelectric power, some renewables, and one nuclear reactor.Mexico enjoys a clear comparative advantage in those metrics measuring the costs of energy. The amount it spends on fuel imports per dollar of GDP generated is well below the OECD average. Moreover, its energy expenditures per dollar of GDP and per capita are lower, as are its costs for electricity.
The amount of energy each person uses, both overall and in the transport sector, and the amount of carbon dioxide each person emits also is less than the OECD average. The spread between the Mexican and OECD per capita consumption, however, has been narrowing over the last decade or so, and as Mexico continues to grow and develop and its middle class expands, the spread should narrow even further.
Mexico scores comparatively worse in those aspects related to energy and emissions intensity. Since 1980, these metrics have been consistently worse the OECD average—again, not unexpected given where Mexico is economically. These metrics have been showing improvement, but not at the rate experienced in the OECD as a whole. One exception to this may be petroleum intensity, which may improve at a faster rate as it is replaced in the power sector.

46 2012 Edition
institute for 21st Century Energy
Energy security Risk summary: netherlands
Risk Scores:
2010 Energy Security Risk Score 1,239
2010 Large Energy User Group Rank 22
Score in Previous Year 1,235
Rank in Previous Year 22
Score in 1980 1,284
Best Energy Security Risk Score 910 (1998)
Worst Energy Security Risk Score 1,308 (1981)
Risk Scores Relative to OECD Average:
Average Annual Difference 1980–2010 +28%
Best Relative Score +20% (1987)
Worst Relative Score +37% (2005)
The Netherlands is the least energy secure of all the developed countries in the large energy user group. From 1980 to 2010, its overall risk always was at least 20% above the OECD average, and over the period it has the highest average risk score—1,053—of any developed country in the group.
The Netherlands is a significant producer (seventh largest) and exporter (fourth largest) of natural gas, most of which is produced onshore. While both an oil and a coal producer, the country depends on imports for these products. The country has for its size a relatively large oil refining sector, and in 2010 it was the world’s fourth largest net exporter of refined petroleum, which moved its overall oil import risk lower than it would be otherwise. The Netherlands natural gas import exposure risk is better than the OECD as a whole, while its oil import risk is somewhat worse and its coal import risk much worse.
About 80% of the Netherland’s electricity generation is thermal capacity, mainly gas- and coal-fired plants. The country also has small amounts of nuclear and
Netherlands
500
600
700
800
900
1,000
1,100
1,200
1,300
1,400NetherlandsOECD Average
1980
1985
1990
1995
2000
2005
2010
Ris
k In
dex
Sco
re
netherlands vs. oECD: Risk index scores
-5
0
5
10
15
20
25
30
35
40
NetherlandsOECD Average
1980
1985
1990
1995
2000
2005
2010
Perc
ent
netherlands: Risk Variance from oECD

www.energyxxi.org 47
international index of Energy security Risk
renewable capacity, the latter of which is growing. This heavy concentration of natural gas facilities, however, means that the Netherland’s capacity diversity is worse than the OECD average. Its retail electricity prices also are above the OECD average, not surprising given the reliance in the power sector on relatively expensive natural gas.
Overall energy usage is something of a mixed bag, with its energy intensity at about the OECD average and its per capita energy usage above the average. The country’s transportation sector, however, generally has used less energy per dollar of GDP and less energy per person than the OECD, though the disparity is closing. This is especially the case with the amount of energy used per person in the transportation sector, which in 2010 was half again as large as the 1980 value.

48 2012 Edition
institute for 21st Century Energy
Energy security Risk summary: new Zealand
Risk Scores:
2010 Energy Security Risk Score 941
2010 Large Energy User Group Rank 4
Score in Previous Year 877
Rank in Previous Year 3
Score in 1980 869
Best Energy Security Risk Score 684 (1998)
Worst Energy Security Risk Score 941 (2010)
Risk Scores Relative to OECD Average:
Average Annual Difference 1980-2010 -7%
Best Relative Score -15% (1986)
Worst Relative Score -2% (2005)
New Zealand’s energy security risk scores have tracked the OECD average fairly closely over the past 30 years, staying within 10% on either side of the baseline. More recent trends, however, suggest that New Zealand’s energy security is worsening at a slightly faster rate than for the OECD as a whole.
Fuels that cannot be produced domestically must be imported into this island nation aboard ships. New Zealand has considerably more natural energy resources than Japan, but considerably less than Australia and the United Kingdom, the three other island nations in our large energy user group. It does not produce what would be considered large amounts of oil, natural gas, or coal, but its production of the latter two fuels are enough to satisfy domestic demand and, in the case of coal, to support an export trade. When set against the OECD average, New Zealand’s import-related risk metrics compare favorably.
The power sector in New Zealand is dominated by hydroelectric power, which in 2010 accounted for close to 58% of generating capacity, with thermal
New Zealand
500
600
700
800
900
1,000
1,100New ZealandOECD Average
1980
1985
1990
1995
2000
2005
2010
Ris
k In
dex
Sco
re
new Zealand vs. oECD: Risk index scores
-15
-10
-5
0
5New ZealandOECD Average
1980
1985
1990
1995
2000
2005
2010
Perc
ent
new Zealand: Risk Variance from oECD

www.energyxxi.org 49
international index of Energy security Risk
capacity (primarily coal) accounting for another 28% and non-hydro renewable about 14%. The vast amount of hydroelectric capacity in the country means New Zealand’s measure of non-carbon emitting generation is better than the OECD average, but its reliance on hydro means its capacity diversity measure is worse than the OECD average. Over most of the period, New Zealand has benefited from relatively low electricity rates, but since 2004, that advantage appears to have been lost as rates have crept up to, and in some years slightly above, the OECD average.
New Zealand also uses more energy, both overall and in the transport sector, to generate a dollar’s worth of GDP than the baseline of OECD countries. Its carbon dioxide emissions trend is also somewhat worse than the OECD average, but its emissions intensity and emissions per capita generally are in line OECD trends.

50 2012 Edition
institute for 21st Century Energy
Energy security Risk summary: norway
Risk Scores:
2010 Energy Security Risk Score 940
2010 Large Energy User Group Rank 3
Score in Previous Year 884
Rank in Previous Year 5
Score in 1980 997
Best Energy Security Risk Score 744 (2002)
Worst Energy Security Risk Score 997 (1981)
Risk Scores Relative to OECD Average:
Average Annual Difference 1980-2010 +7%
Best Relative Score -5% (2009)
Worst Relative Score +21% (1995)
In 2010, Norway was among the seven countries in the large energy user group with energy security risk below the OECD average, having the third best score. From 1980 to the mid- to late-1990s, Norway’s overall risk, while decreasing absolutely, increased relative to the OECD baseline. Since then, Norway’s risk has improved relative to the OECD even as its absolute risk has increased somewhat. For most of the 2000s, Norway’s risk has been at or below the OECD level.
Norway is among the wealthiest countries in the world with a high standard of living. It has a small population (under 5 million) and is rich in energy resources. Once an oil importer, Norway became an oil exporter as production from the North Sea began in earnest in 1975. In addition, Norway is one of the world’s largest exporters of natural gas, second only behind the Russian Federation.
Coal is used primarily for industrial purposes. With the opening of the Svea Norda mine on the island of Spitsbergen in the Svalbard archipelago, 2001,
Norway
500
600
700
800
900
1,000
1,100NorwayOECD Average
1980
1985
1990
1995
2000
2005
2010
Ris
k In
dex
Sco
re
norway vs. oECD: Risk index scores
-5
0
5
10
15
20
25NorwayOECD Average
1980
1985
1990
1995
2000
2005
2010
Perc
ent
norway: Risk Variance from oECD
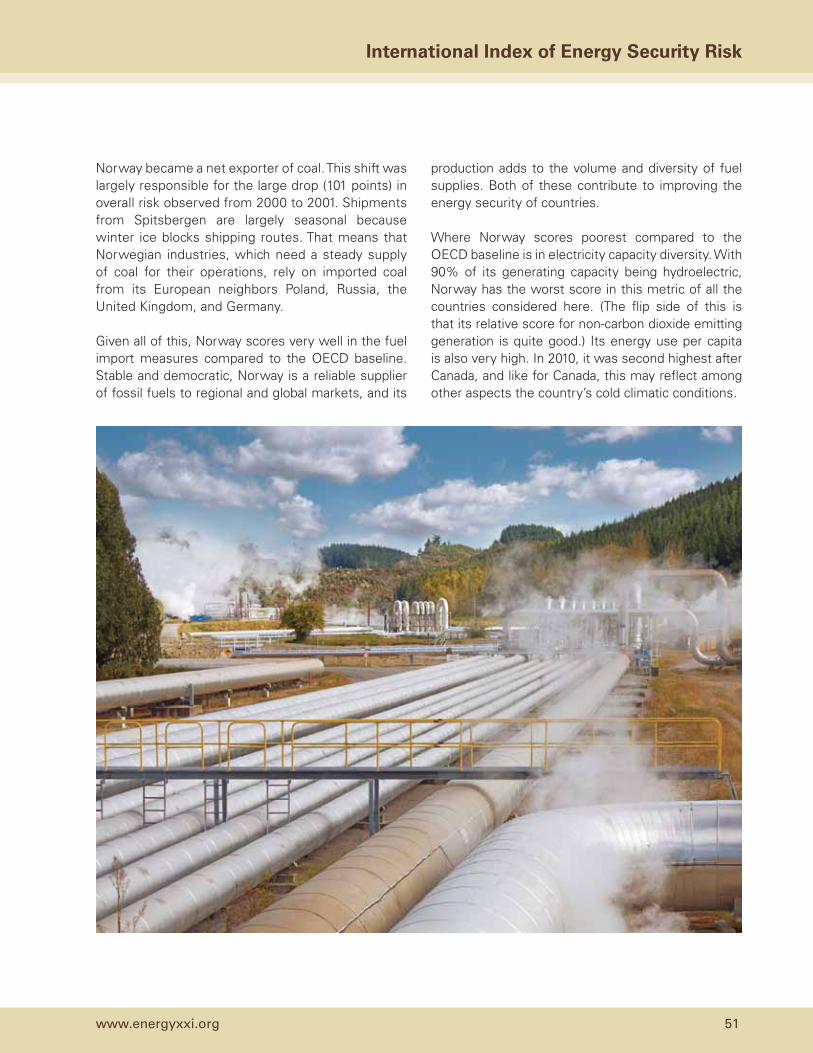
www.energyxxi.org 51
international index of Energy security Risk
Norway became a net exporter of coal. This shift was largely responsible for the large drop (101 points) in overall risk observed from 2000 to 2001. Shipments from Spitsbergen are largely seasonal because winter ice blocks shipping routes. That means that Norwegian industries, which need a steady supply of coal for their operations, rely on imported coal from its European neighbors Poland, Russia, the United Kingdom, and Germany.
Given all of this, Norway scores very well in the fuel import measures compared to the OECD baseline. Stable and democratic, Norway is a reliable supplier of fossil fuels to regional and global markets, and its
production adds to the volume and diversity of fuel supplies. Both of these contribute to improving the energy security of countries.
Where Norway scores poorest compared to the OECD baseline is in electricity capacity diversity. With 90% of its generating capacity being hydroelectric, Norway has the worst score in this metric of all the countries considered here. (The flip side of this is that its relative score for non-carbon dioxide emitting generation is quite good.) Its energy use per capita is also very high. In 2010, it was second highest after Canada, and like for Canada, this may reflect among other aspects the country’s cold climatic conditions.

52 2012 Edition
institute for 21st Century Energy
Energy security Risk summary: Poland
Risk Scores:
2010 Energy Security Risk Score 1,061
2010 Large Energy User Group Rank 13
Score in Previous Year 985
Rank in Previous Year 12
Score in 1980 1,429
Best Energy Security Risk Score 731 (2002)
Worst Energy Security Risk Score 1,429 (1980)
Risk Scores Relative to OECD Average:
Average Annual Difference 1980-2010 +17%
Best Relative Score -2% (2004)
Worst Relative Score +43% (1980)
Of the three economies in transition (or former Soviet Bloc countries) in the large energy users group, Poland displays the lowest energy security risk for most of the period from 1980 to 2010. In the 1990s, Poland’s risk moved higher and then lower compared to the OECD average, but by the 2000s, its risk level was largely in line with the OECD level. Recently data suggest, however, that Poland’s risk may be rising faster than the OECD’s.
Poland’s economy runs largely on coal. About 90% of its electric power and nearly 60% of its overall energy consumption comes from coal. It is the ninth largest coal producer in the world, and domestic production has been sufficient to meet demand over almost all of the period considered here. In 2010, however, Poland began importing coal for the first time since 1980.
The dominant position of coal in the Polish economy has energy security advantages and disadvantages. With very limited supplies of other fuels—Poland
Poland
500
600
700
800
900
1,000
1,100
1,200
1,300
1,400
1,500PolandOECD Average
1980
1985
1990
1995
2000
2005
2010
Ris
k In
dex
Sco
re
Poland vs. oECD: Risk index scores
-5
0
5
10
15
20
25
30
35
40
45PolandOECD Average
1980
1985
1990
1995
2000
2005
2010
Perc
ent
Poland: Risk Variance from oECD

www.energyxxi.org 53
international index of Energy security Risk
produces modest amounts of natural gas and negligible amounts of oil and has to import large amounts of these fuels—coal represents a secure domestic supply of very affordable energy, and it is a source of many jobs in the mining sector.
The almost complete reliance on coal for generating electricity has kept Polish electricity prices well below the OECD average for most of the period (though recent price data suggest that may be changing). Poland scores very poorly, however, in the metric for electric capacity diversity compared to the OECD average. The over-reliance on a single fuel is an issue the government recognizes. More natural gas would seem an obvious solution, but that would likely mean increasing pipeline natural gas from the Russian Federation. Not only is natural gas from Russia expensive, the Russian government has shown that it is willing to use its supplies geopolitically. Poland also is looking at diversifying its suppliers by constructing LNG facilities.
Domestic shale gas offers another option. EIA estimates that Poland, which has only 6 trillion cubic feet of recoverable natural gas reserves on the books, has potentially as much as 187 trillion
cubic feet of shale gas, but this will take many years to develop.
Poland also compares favorably to the OECD average in per capita energy use and carbon dioxide emission measures, typical for a country undergoing a transition to a market-based economy. Energy demand is expected to increase as Poles gain economically, and this could push these metrics higher. Although energy intensity is worse than the OECD average, the gap has been getting smaller, a positive development. Poland’s per capita transportation energy use is well below the OECD average, but both of its transportation-related metrics are losing ground to the OECD.
Even given its large coal consumption, Poland’s carbon dioxide emissions are still comparatively better than the OECD baseline, reflecting Poland’s economic transition. The Polish government has taken a keen interest in carbon capture and storage technologies as a way to help decarbonize its power sector. The government also is supporting a plan to install nuclear power, which it hopes could provide 17% of power generation by 2030 from none today.

54 2012 Edition
institute for 21st Century Energy
Energy security Risk summary: Russian Federation
Risk Scores:
2010 Energy Security Risk Score 1,072
2010 Large Energy User Group Rank 14
Score in Previous Year 991
Rank in Previous Year 15
Score in 1980 NA
Best Energy Security Risk Score 880 (2003)
Worst Energy Security Risk Score 1,115 (1999)
Risk Scores Relative to OECD Average:
Average Annual Difference 1980–2010 +26%
Best Relative Score +4% (2008)
Worst Relative Score +54% (1998)
Data for the Russian Federation begin in 1992, at which time its energy security was ranked third from bottom, ahead of only South Korea and the Ukraine. Since then, its risk scores have fluctuated within a band of 800 to 1,100 with no discernable trend. Russia’s overall risk vis-à-vis the OECD average peaked in 1998 at 54% above the OECD average. Over the last decade, as the average OECD risk was getting progressively worse, Russia’s relative risk declined to just 9% above the OECD in 2010.
Russia is a leading producer of all types of fossil energy, and energy exports contribute greatly to Russia’s economy. In 2010, Russia was the world’s largest producer of both crude oil and gas, and the fifth largest producer of coal. Its production of these fuels far outstrips domestic demand, and it is a large net exporter of all of them as well as
refined petroleum products. Its import-related energy security risks therefore are well below the OECD average.
Russian Federation
500
600
700
800
900
1,000
1,100
1,200
RussiaOECD Average
1980
1985
1990
1995
2000
2005
2010
Ris
k In
dex
Sco
re
Russia vs. oECD: Risk index scores
-505
10152025303540455055
RussiaOECD Average
1980
1985
1990
1995
2000
2005
2010
Perc
ent
Russia: Risk Variance from oECD

www.energyxxi.org 55
international index of Energy security Risk
Although Russia’s large volume of fossil fuel exports boosts the diversity of global and regional fossil fuel supplies, its low Freedom House ranking makes it a potentially more unreliable trading partner compared to countries displaying greater political and civil liberties. Indeed, with the largest proved natural gas reserves in the world, Russia has not been shy about using its clout to influence markets in Europe, which depends on Russia for much of much of its gas supplies. Moreover, Russia, Iran, and Qatar began discussing forming an OPEC for gas-exporting countries. Today, however, it is unclear how influential this group might become, although its individual members still wield market power.
Russia’s power sector is fairly diverse. About two-thirds of generation capacity is thermal—most of which is fired by natural gas. Hydropower and nuclear plants, at 21% and 10% respectively, provide most of the other generating capacity. To allow for greater exports of natural gas, Russia is planning to increase coal production and build more coal-fired power plants.
About the only other area where Russia is well ahead of the OECD average is in transportation energy use per person. This is not surprising given Russia’s well developed public transportation system, but this edge is beginning to shrink, will probably be continue to do so, as Russia’s economy develops further.
After decades of communist rule, Russia’s economy remains comparatively inefficient. All of the country’s energy and carbon dioxide emissions intensity measures show higher risks compared with the OECD average, and in some cases much higher. Behind only Ukraine, Russia has the worst energy intensity measure of any country in the large energy user group. Nevertheless, Russia’s intensity measures are all showing improvement compared to the OECD, but the country still has a long way to go before its intensity measures are comparable.

56 2012 Edition
institute for 21st Century Energy
Energy security Risk summary: south Africa
Risk Scores:
2010 Energy Security Risk Score 1,100
2010 Large Energy User Group Rank 16
Score in Previous Year 989
Rank in Previous Year 13
Score in 1980 1,091
Best Energy Security Risk Score 739 (1996)
Worst Energy Security Risk Score 1,100 (2010)
Risk Scores Relative to OECD Average:
Average Annual Difference 1980-2010 +6%
Best Relative Score -2% (1989)
Worst Relative Score +15% (1983)
South Africa’s energy security risk consistently has been higher than the OECD average for almost the entire period from 1980 to 2010. Trends over the past few years suggest that the county’s overall risk is growing, both absolutely and relative to the OECD. The country’s scores for individual measures of risk exhibit many of the drawbacks one would expect to see in a large emerging economy, but it also has advantages some other emerging economies lack, primarily its large deposits of coal.
South Africa is the wealthiest country in Africa and the second most populous. The country has relatively small reserves of oil—located offshore—and natural gas, so it relies on imports to meet demand for these products. The country is rich in coal, however. Its reserves and production are the sixth and seventh largest in the world, respectively, and it is a major exporter of coal, mainly to Europe, China, and India.
The country also has the world’s only commercial coal-to-liquids (CTL) facility, and it produces about 150,000 barrels per day of liquids, a substantial
South Africa
500
600
700
800
900
1,000
1,100
1,200 South AfricaOECD Average
1980
1985
1990
1995
2000
2005
2010
Ris
k In
dex
Sco
re
south Africa vs. oECD: Risk index scores
-5
0
5
10
15
20South AfricaOECD Average
1980
1985
1990
1995
2000
2005
2010
Perc
ent
south Africa: Risk Variance from oECD

www.energyxxi.org 57
international index of Energy security Risk
portion of South Africa’s liquids demand of about 550,000 barrels per day, and more CTL capacity is being planned. In addition, EIA estimates that South Africa may have 485 trillion cubic feet of technically recoverable shale gas, a substantial potential resource that if developed could lower the risks inherent in relying on imported natural gas.
This CTL capability has enhanced South Africa’s energy security by lessening its oil import exposure risk. Indeed, all of the South Africa import exposure risk measures are below the OECD. And even as the amount of money the country spends on fossil fuel imports as a share of GDP is higher than the OECD average, it is much lower than it was in 1980.
With such an abundance of coal, it is no surprise that coal dominates the power sector, accounting
for about 85% of generating capacity. The remaining capacity is natural gas and hydroelectric (including pumped storage). The predominance of one fuel in the power sector means that South Africa’s capacity diversity risk measure is much higher than the baseline of OECD countries.
Most of the emerging economies in our large energy user group use energy less efficiently than the OECD average and are increasing their carbon dioxide emissions rapidly, and South Africa is no exception. In addition to a growing middle class, the country has a large mining sector and other industries that use large amounts of energy. While energy use and emission risk measures have improved appreciably in OECD averages over time, they have improved more slowly, if at all, in South Africa (as they have in some other emerging economies).
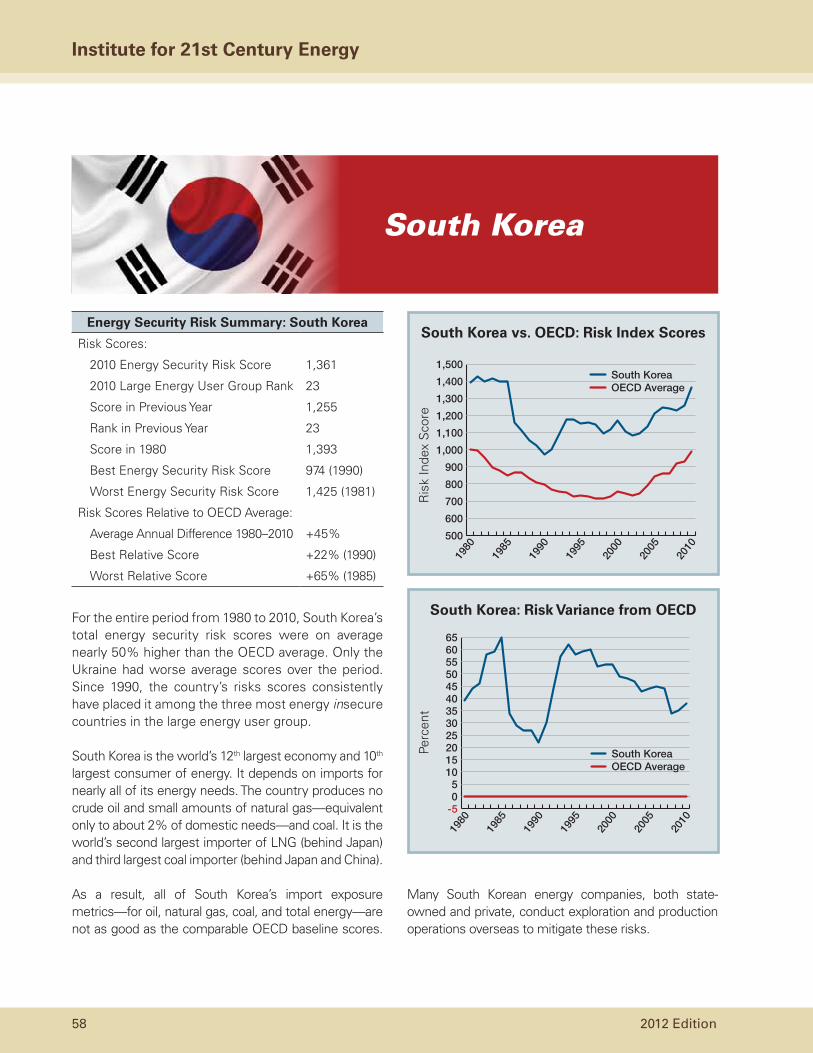
58 2012 Edition
institute for 21st Century Energy
Energy security Risk summary: south korea
Risk Scores:
2010 Energy Security Risk Score 1,361
2010 Large Energy User Group Rank 23
Score in Previous Year 1,255
Rank in Previous Year 23
Score in 1980 1,393
Best Energy Security Risk Score 974 (1990)
Worst Energy Security Risk Score 1,425 (1981)
Risk Scores Relative to OECD Average:
Average Annual Difference 1980–2010 +45%
Best Relative Score +22% (1990)
Worst Relative Score +65% (1985)
For the entire period from 1980 to 2010, South Korea’s total energy security risk scores were on average nearly 50% higher than the OECD average. Only the Ukraine had worse average scores over the period. Since 1990, the country’s risks scores consistently have placed it among the three most energy insecure countries in the large energy user group.
South Korea is the world’s 12th largest economy and 10th largest consumer of energy. It depends on imports for nearly all of its energy needs. The country produces no crude oil and small amounts of natural gas—equivalent only to about 2% of domestic needs—and coal. It is the world’s second largest importer of LNG (behind Japan) and third largest coal importer (behind Japan and China).
As a result, all of South Korea’s import exposure metrics—for oil, natural gas, coal, and total energy—are not as good as the comparable OECD baseline scores.
Many South Korean energy companies, both state-owned and private, conduct exploration and production operations overseas to mitigate these risks.
South Korea
500
600
700
800
900
1,000
1,100
1,200
1,300
1,400
1,500South Korea OECD Average
1980
1985
1990
1995
2000
2005
2010
Ris
k In
dex
Sco
re
south korea vs. oECD: Risk index scores
-505
101520253035404550556065
South Korea OECD Average
1980
1985
1990
1995
2000
2005
2010
Perc
ent
south korea: Risk Variance from oECD

www.energyxxi.org 59
international index of Energy security Risk
In the power sector, roughly half of the generating capacity in 2010 was coal fired, and a little more than one-fifth natural gas fired. South Korea also has a large nuclear program. Since 1980, it has added about 17 gigawatts of nuclear capacity, and its 20 nuclear reactors account for about one-fifth of total generating capacity and about one-third of generation. The replacement of large amounts of natural gas-fired capacity with nuclear capacity from 1985 to 1990 led to a sharp drop in South Korea’s natural gas exposure risk, which led to a large drop in overall risk. Greater imports of coal for power generation in the subsequent five years, however, offset much of the gains from lower gas imports.
Measures of power sector diversity and non-carbon emitting generation are comparable to the OECD average. Energy expenditures and retail electricity rates, however, are two areas where South Korea has a clear edge over the typical OECD country.
Not unusual for an emerging economy, South Korea’s intensity measures—these cover total energy, petroleum, transportation energy, and carbon dioxide emissions—are higher than their OECD averages, and the trends for many of these since 1980 indicate no improvement, and in some cases a worsening, relative to the OECD baseline.
Per capita measures of energy use, transportation energy use, and carbon dioxide emissions are three areas where South Korea scored better than the OECD average for most of the period. However, as Korea has developed, the trend in these has been towards higher risks, and two of these—per capita energy use and per capita carbon dioxide emissions—are now higher than the OECD baseline scores. And as one would expect, total carbon dioxide emissions are growing along with the economy.

60 2012 Edition
institute for 21st Century Energy
Energy security Risk summary: spain
Risk Scores:
2010 Energy Security Risk Score 1,105
2010 Large Energy User Group Rank 17
Score in Previous Year 1,082
Rank in Previous Year 19
Score in 1980 1,080
Best Energy Security Risk Score 782 (1997)
Worst Energy Security Risk Score 1,105 (2010)
Risk Scores Relative to OECD Average:
Average Annual Difference 1980-2010 +11%
Best Relative Score +3% (1989)
Worst Relative Score +18% (2005)
Spain’s overall energy security risk has been higher than the OECD as a whole for the entire period from 1980 to 2010. While its risk approached the OECD average in the late 1980s, since then the gap has widened in fits and starts, and in 2010, it was 12% higher.
Spain produces almost no oil or natural gas, and little coal, so it must import large quantities of these fuels to meet domestic demand, which has increased significantly since the early 1990s. Natural gas imports are largely from Algeria, both by pipeline and by LNG tankers. Its fossil fuel import risks are above those for the OECD average, as is the amount it pays for these imports as a share of GDP.
Spain has a relatively diverse electricity generation sector. This was not always so. At the beginning of the period, its chief sources of power were
hydroelectric—the availability of which is dependent on adequate rainfall—and conventional thermal plants, and little else. Beginning around 1983,
Spain
500
600
700
800
900
1,000
1,100
1,200 SpainOECD Average
1980
1985
1990
1995
2000
2005
2010
Ris
k In
dex
Sco
re
spain vs. oECD: Risk index scores
-5
0
5
10
15
20SpainOECD Average
1980
1985
1990
1995
2000
2005
2010
Perc
ent
spain: Risk Variance from oECD

www.energyxxi.org 61
international index of Energy security Risk
however, Spain began adding nuclear capacity, and by the end of the decade, it accounted for roughly 17% of capacity. The availability of Algerian gas also led to an increase in the amount of gas-fired capacity. Moreover, since 2000, the share of non-hydro renewables in the mix has climbed sharply and in 2010 accounted for 28% of capacity (but a much smaller share of actual output).
While the diversity of Spain’s power sector is an asset, its electricity prices are higher than the OECD average. In addition, Spain has recently had to trim its subsidies for renewable energy, and this may slow the construction of renewable capacity in the future.
Spain has a lower energy intensity than the OECD average, and this has helped moderate the impact of rising energy costs. These energy intensity metrics, however, are not improving at the same rate as the OECD average. Meanwhile, its carbon dioxide emissions have grown faster than the OECD average.
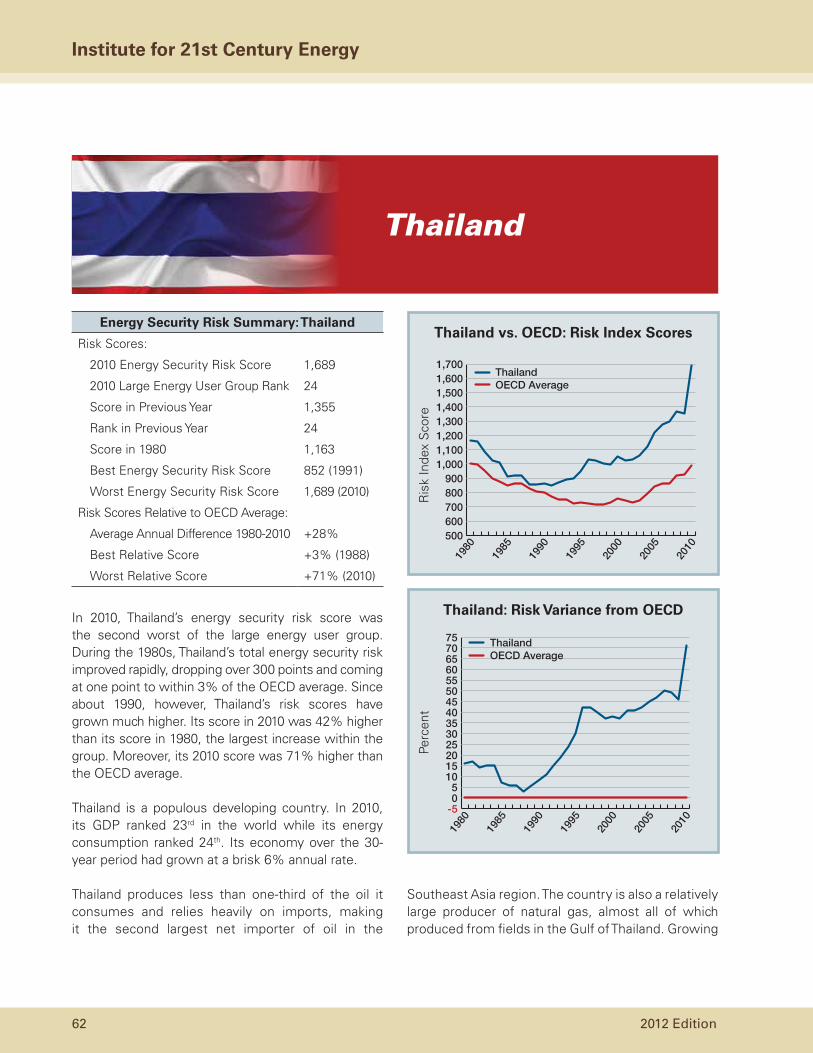
62 2012 Edition
institute for 21st Century Energy
Energy security Risk summary: thailand
Risk Scores:
2010 Energy Security Risk Score 1,689
2010 Large Energy User Group Rank 24
Score in Previous Year 1,355
Rank in Previous Year 24
Score in 1980 1,163
Best Energy Security Risk Score 852 (1991)
Worst Energy Security Risk Score 1,689 (2010)
Risk Scores Relative to OECD Average:
Average Annual Difference 1980-2010 +28%
Best Relative Score +3% (1988)
Worst Relative Score +71% (2010)
In 2010, Thailand’s energy security risk score was the second worst of the large energy user group. During the 1980s, Thailand’s total energy security risk improved rapidly, dropping over 300 points and coming at one point to within 3% of the OECD average. Since about 1990, however, Thailand’s risk scores have grown much higher. Its score in 2010 was 42% higher than its score in 1980, the largest increase within the group. Moreover, its 2010 score was 71% higher than the OECD average.
Thailand is a populous developing country. In 2010, its GDP ranked 23rd in the world while its energy consumption ranked 24th. Its economy over the 30-year period had grown at a brisk 6% annual rate.
Thailand produces less than one-third of the oil it consumes and relies heavily on imports, making it the second largest net importer of oil in the
Southeast Asia region. The country is also a relatively large producer of natural gas, almost all of which produced from fields in the Gulf of Thailand. Growing
Thailand
500600700800900
1,0001,1001,2001,3001,4001,5001,6001,700
ThailandOECD Average
1980
1985
1990
1995
2000
2005
2010
Ris
k In
dex
Sco
re
thailand vs. oECD: Risk index scores
-505
1015202530354045505560657075 Thailand
OECD Average
1980
1985
1990
1995
2000
2005
2010
Perc
ent
thailand: Risk Variance from oECD

www.energyxxi.org 63
international index of Energy security Risk
domestic production, however, has not been enough to overcome the growth in demand. Thailand also produces significant amounts of coal—it is ranked second in Southeast Asia after Indonesia—but it does rely on some imports, mainly for industrial purposes. These trends mean Thailand’s import exposure risks are higher than the OECD average or, in the case of natural gas, are moving in that direction. The country also spends a much higher amount on imported fuels as a share of GDP than the OECD as a whole.
In 2010, close to 60% of Thailand’s electricity generating capacity was conventional thermal. Oil capacity has been largely replaced by natural gas-
fired and, to a lesser extent coal-fired plants. It also has a modest amount of hydroelectric capacity. The cost of electricity is one of the few areas where Thailand appears to compare favorably with the OECD as a whole, but the data are not as robust as one would like.
Thailand’s energy intensity risk metrics—total energy, oil, and transportation energy—and carbon dioxide intensity metrics are all higher than the OECD averages. And while the metrics measuring energy use and emissions per person compare favorably to the OECD, greater prosperity is pushing each of these higher (as it is doing in other emerging economies).

64 2012 Edition
institute for 21st Century Energy
Energy security Risk summary: turkey
Risk Scores:
2010 Energy Security Risk Score 1,154
2010 Large Energy User Group Rank 19
Score in Previous Year 1,118
Rank in Previous Year 20
Score in 1980 809
Best Energy Security Risk Score 734 (1985)
Worst Energy Security Risk Score 1,154 (2010)
Risk Scores Relative to OECD Average:
Average Annual Difference 1980–2010 +3%
Best Relative Score -19% (1981)
Worst Relative Score +20% (2009)
Over the past 30 years, Turkey’s total energy security risk has moved in fits and starts, but overall it has worsened, both absolutely and in reference to the OECD average. In 1980, it was ranked number five; in 2010, it ranked number 19. The deterioration in Turkey’s energy security has occurred almost completely across the board, and the gap between it and the OECD appears to be widening.
Turkey is a large emerging economy that has undergone rapid economic growth in recent years. The country is a strategic crossroads for energy. It not only is a major transit point for the ocean-going oil trade, but the pipelines that crisscross the country are increasingly important in the movement of oil and natural gas from the Caspian region to Europe.
Turkey produces very little oil and natural gas, and while it is a large coal producer—the world’s twelfth
largest—it doesn’t produce enough of any of these fuels to satisfy domestic demand. Turkey relies to a large extent on imports, and its import exposure
Turkey
500
600
700
800
900
1,000
1,100
1,200 TurkeyOECD Average
1980
1985
1990
1995
2000
2005
2010
Ris
k In
dex
Sco
re
turkey vs. oECD: Risk index scores
-20
-15
-10
-5
0
5
10
15
20
25TurkeyOECD Average
1980
1985
1990
1995
2000
2005
2010
Perc
ent
turkey: Risk Variance from oECD

www.energyxxi.org 65
international index of Energy security Risk
risks are higher than the OECD average for all fuels, especially for natural gas. In 1987, Turkey became a net importer of natural gas, and since 1990, it has significantly increased its net coal imports. These shifts have had a big impact on Turkey’s energy security and are clearly seen in the shifting trends in the country’s overall risk scores. EIA reports that Turkey could have as much as 15 trillion cubic feet of shale gas that if realized would represent a dramatic increase over the current reserve estimate of about 0.2 trillion cubic feet. Turkey also is looking at potentially large reserves of natural gas offshore.
Generating capacity in Turkey’s power sector is divided between conventional thermal capacity (about two-thirds of the total) and hydroelectric capacity (about one-third). Natural gas-fired facilities account for over half of Turkey’s thermal capacity. Turkey has
no nuclear reactors, but the government’s goal is to build 20 reactors by 2030 to reduce Turkey’s natural gas and oil imports.
As one would expect to see in a rapidly growing emerging economy, the various energy intensity and carbon dioxide emissions measures also are worse than their corresponding OECD averages. Even those aspects of Turkey’s energy security that are relatively better than the OECD average are moving in the wrong direction. Electricity prices and per capita energy and carbon dioxide emissions all have been below the OECD average for all or a good portion of the period from 1980 to 2010, but these advantages relative to the OECD baseline are beginning to erode.

66 2012 Edition
institute for 21st Century Energy
Energy security Risk summary: Ukraine
Risk Scores:
2010 Energy Security Risk Score 2,277
2010 Large Energy User Group Rank 25
Score in Previous Year 2,011
Rank in Previous Year 25
Score in 1980 NA
Best Energy Security Risk Score 1,982 (2006)
Worst Energy Security Risk Score 2,732 (1996)
Risk Scores Relative to OECD Average:
Average Annual Difference 1980–2010 +184%
Best Relative Score +116% (2009)
Worst Relative Score +277% (1996)
Data for the Ukraine begins in 1992. Since then, the country has had by far the worst energy security index scores of any country in the large energy user group, both nominally and compared to the OECD. Its scores over the period averaged about 181% higher than those for the OECD. Unlike nearly all the other countries in the group, however, Ukraine’s overall risk has been trending downward. From its peak of 2,732—277% above the OECD average—in 1996, the country’s total risk score fell to 2,011 in 2009—still 130% above the OECD average but a considerable improvement. And although total risk spiked again in 2010, trends in the data suggest further absolute and relative improvement.
The Ukraine produces oil, natural gas, and coal, though not enough of any of these fuels to be self sufficient, and its import risks for everything except coal have been higher than the OECD average
for most of the period since 1992. As a result, the country’s expenditure of fossil fuels imports as a share of GDP have over the years been much higher
Ukraine
500
750
1,000
1,250
1,500
1,750
2,000
2,250
2,500
2,750UkraineOECD Average
1980
1985
1990
1995
2000
2005
2010
Ris
k In
dex
Sco
re
Ukraine vs. oECD: Risk index scores
-250
255075
100125150175200225250275300
UkraineOECD Average
1980
1985
1990
1995
2000
2005
2010
Perc
ent
Ukraine: Risk Variance from oECD

www.energyxxi.org 67
international index of Energy security Risk
than the OECD average. Nevertheless, most of Ukraine’s import metrics (again, except for coal), have shown improvement over the last 10 years.
The Ukraine’s power sector is quite diverse. It is one of the few countries with capacity diversity scores better than the OECD average (though only marginally). Roughly 70% of it generating capacity is thermal (coal, natural gas, and oil), and most of the remainder is nuclear with a little bit of hydroelectric. Accurate electricity price data are lacking.
The Ukraine’s total energy, transportation energy, and oil intensities scores and its carbon dioxide emissions intensity scores are the weakest among the large energy user group. It is obvious the country has a great deal of ground to make up in these areas. Nevertheless, even in these measures the country is making progress absolutely and against the OECD baseline. Typical of an economy in transition, its energy use and emissions per capita measures are better than the OECD’s, and these appear to be improving at about the same rate as the OECD.

68 2012 Edition
institute for 21st Century Energy
Energy security Risk summary: United kingdom
Risk Scores:
2010 Energy Security Risk Score 878
2010 Large Energy User Group Rank 2
Score in Previous Year 865
Rank in Previous Year 2
Score in 1980 793
Best Energy Security Risk Score 575 (1998)
Worst Energy Security Risk Score 878 (2010)
Risk Scores Relative to OECD Average:
Average Annual Difference 1980–2010 -17%
Best Relative Score -21% (1995)
Worst Relative Score -7% (2009)
Since the 1980s, the United Kingdom has scored consistently in the top three most energy secure countries in the group of large energy users, and it has been the most energy secure of the European countries. Its risk scores have trended well below the OECD average. Since the mid-1990s, however, this advantage has been shrinking, from about 20% then to a most recent value of 11%.
The United Kingdom has a large and diverse economy. In 2010, it was the fifth largest economy and the 11th largest consumer of energy in the world.
The country is a large energy producer as well as a large energy consumer, and it has significant quantities of oil, gas, and coal resources. It is the second largest producer of crude oil in Europe after Norway and was
until recently Europe’s second largest producer of natural gas also after Norway—it is now third behind the Netherlands. The United Kingdom also was at one
500
600
700
800
900
1,000
1,100UKOECD Average
1980
1985
1990
1995
2000
2005
2010
Ris
k In
dex
Sco
re
Uk vs. oECD: Risk index scores
-25
-20
-15
-10
-5
0
5UKOECD Average
1980
1985
1990
1995
2000
2005
2010
Perc
ent
Uk: Risk Variance from oECD
United Kingdom

www.energyxxi.org 69
international index of Energy security Risk
time a major coal producer. In 1980, it was second in Europe after Poland and fourth in the world, but in 2010, many Eastern European countries had higher production than the United Kingdom, and its global production fell to 22nd.
Most of the United Kingdom’s oil and natural gas reserves are below United Kingdom’s continental shelf in the North Sea. From 245,000 barrels per day in 1976, oil production peaked at nearly 2.6 million barrels per day in 1999. From 1981 to 2005, the United Kingdom was self-sufficient in petroleum, but beginning in 2006, the United Kingdom became a net importer of oil because of declining North Sea output, which in 2010 was at less than half its peak. A net exporter of natural gas from 1997 to 2003, the United Kingdom has since then been importing steadily larger amounts of natural gas.
While the risks to the United Kingdom from both oil and natural gas imports are better than the OECD average, the spread has been shrinking in recent years as net imports of these fuels have increased. This helps explain why the United Kingdom’s risks have moved higher.
One reason for the shift to net importer of natural gas has been the United Kingdom’s policy to convert a large portion of the power sector’s capacity to natural gas from coal. Still, coal accounts for a little more than a fifth of electricity production and is used in some industries. Coal production in 2010 was just 14% the level in 1980, so to meet demand, the United Kingdom imports large quantities of coal and has been doing so since 1984, the year United Kingdom coal miners went out on strike. (United Kingdom coal production from 1983 to 1984 dropped 57%—which shows up as a large upward spike in the United Kingdom’s risk index in 1984—and production since has never reached pre-strike levels.) Coal import exposure is one of the largest sources of risk for the United Kingdom.
In addition to natural gas and coal, the United Kingdom has 22 megawatts of nuclear capacity in the power sector, and in 2008 the U.K. government announced it would support additional nuclear power builds. Mandates also require the use of renewables. The United Kingdom is situated such that is has a rich wind resource, and wind accounts for most of the renewable capacity. The risks around electricity prices are a bit higher for the United Kingdom than the OECD average, and the data suggest this is may become a larger concern in the future.
The United Kingdom is also a fairly efficient economy. Its trends in the intensity and per capita aspects of overall energy use, transportation energy use, petroleum (intensity only) and carbon dioxide emissions have moved largely in line with the OECD average.
Looking to the future, the application of new drilling techniques, such as hydraulic fracturing, horizontal drilling, and new deep-water technologies could help the United Kingdom maintain if not increase its domestic production of oil and natural gas. For example, EIA estimates 20 trillion cubic feet of shale gas may be present in the United Kingdom, more than twice the estimated current proved figure of 9 trillion cubic feet. Some other shale gas estimates are considerably higher. New offshore oil and gas fields also are being developed in the North Sea. If these developments pan out, the United Kingdom should be able to maintain its position as one of most energy secure countries in the large energy users group.

70 2012 Edition
institute for 21st Century Energy
Energy security Risk summary: United states
Risk Scores:
2010 Energy Security Risk Score 964
2010 Large Energy User Group Rank 7
Score in Previous Year 909
Rank in Previous Year 6
Score in 1980 988
Best Energy Security Risk Score 746 (1994)
Worst Energy Security Risk Score 988 (1980)
Risk Scores Relative to OECD Average:
Average Annual Difference 1980–2010 +2%
Best Relative Score -2% (2008)
Worst Relative Score +7% (2000)
Note: It should be emphasized that the index data presented here and index data presented in the U.S. Index measure different metrics and are compared against different things. Therefore, the scores measured in two different indexes cannot be compared, even as the general trend is substantially the same. Moreover, the concern in this section is primarily with U.S. energy security risks in reference to those of the OECD average and other large energy users over time and not solely how U.S. energy security risks have fared over time, the latter being the focus of the Index of U.S. Energy Security Risk.
For most of the 1980 to 2010 period, U.S. energy security risks have run just slightly higher or lower (+ or – 3%) than the OECD average. The exception was the years 1996 through 2002, when U.S. risks averaged about 5% higher. In 2010, the United States
was the seventh most energy secure country in the group of large energy users. The gains the United States has made relative to the OECD have been
500
600
700
800
900
1,000
1,100USAOECD Average
1980
1985
1990
1995
2000
2005
2010
Ris
k In
dex
Sco
re
U.s.A. vs. oECD: Risk index scores
-5
0
5
10USAOECD Average
1980
1985
1990
1995
2000
2005
2010
Perc
ent
U.s.A.: Risk Variance from oECD
United States

www.energyxxi.org 71
international index of Energy security Risk
because of both actual improvement (the lowering of certain risks) and relative improvement (risks rising at a slower rate than the OECD average).
The United States is the world’s largest economy, third most populous country, and second largest energy consumer. In addition to being a very large energy user, it is also a very large energy producer, with an abundance of energy resources.
The United States is largely self-reliant in energy, with oil being the obvious exception. It has very large fossil fuel resources. In 2010, it was the world’s second biggest producer of oil, natural gas, and coal (behind Saudi Arabia, Russia, and China, respectively). The U.S., therefore, has a significant advantage over many countries in the large energy user group when import risks are considered.
Declining domestic oil production and rising imports as a share of demand have been a perennial concern in the U.S. for decades. Yet even given rapidly growing oil imports over the years, this has been a comparative advantage for the U.S. because the situation in the average OECD country has been even worse. U.S. oil output has grown 20% since 2008 on the strength of increased production on private and State lands, most notably tight oil production from the Bakken Shale formation in North Dakota. However, federal policy restricting access to federal lands, both onshore and offshore—exacerbated by the federal government’s reaction to the Deepwater Horizon oil spill in the Gulf of Mexico—could send U.S. production lower. Greater access to federal lands and production from America’s abundant oil shale and deep water resources, if allowed, could lower future U.S. oil import risks substantially.
In addition to growing supplies of petroleum, the use of biofuels is expected to grow considerably. Federal mandates call for the use of 36 billion gallons of biofuels by 2022, an amount that if realized could reduce gasoline consumption appreciably.
The United States also is a large producer of refined products and in 2009 became a net exporter of refined petroleum. These exports were not enough to offset the large amount of crude oil imports, however, but they contributed to a lower overall oil import risk than would be the case otherwise.
While oil imports are a source of risk for the U.S., the import exposure risks for natural gas have been low, and those of coal negligible. U.S. natural gas production also has shown a reversal in fortune, largely because of the application of hydraulic fracturing in the Barnett Shale in Texas and the Marcellus Shale centered in western Pennsylvania and surrounding states. Shale gas now accounts for about a one-third of U.S. production. It was not all that long ago that projections showed the U.S. becoming a natural gas importer, but what was once a shortage of natural gas has become a glut.
The United States also has proved coal reserves—over 250 years worth at the current rate of consumption. Dubbed the “Saudi Arabia of Coal,” it is a large producer and a growing exporter to world markets. Coal is particularly important as a reliable fuel for base load power generation and contributes to low-cost electricity.
As a large producer of energy resources, the U.S. contributes to the stability, reliability, and diversity of global energy resources. EIA projects rising coal exports from the United States, and the “shale gale” may make the U.S. an exporter of natural gas instead of an importer. To the extent the Keystone XL pipeline—which once completed would carry oil from the oil sands in Alberta, Canada, to U.S. refineries on the Gulf Coast—increases access to Canadian oil production, it would contribute to U.S. and global oil security.
Set against the OECD average, the United States also has comparatively lower energy costs, both in terms of energy costs per dollar of GDP and retail electricity rates, and this advantage appears to be growing. We anticipate that future editions of the International

72 2012 Edition
institute for 21st Century Energy
Index will show the United States increasing its edge in this regard through the continued use of coal and as the fall in natural gas prices begins to be reflected in data for 2011 and 2012.
The U.S. power sector is fairly diverse. Like almost every other country in the large energy user group, its risk scores are higher than the OECD average, though its scores are better than most other countries in the group. Thermal capacity—mostly fired by coal and natural gas, with very little oil—accounted for about 76% of total capacity in 2010, with nuclear accounting for 10%, hydroelectric close to 8%, and non-hydro renewables about 5%. Its share of non-emitting generation is only slightly above the OECD average. This situation could change appreciably in the coming years. Pending new environmental regulations, however, could shut in a large portion of base load coal-fired capacity, much of which would have to be replaced by natural gas-fired facilities or nuclear. In addition, as a result of renewable portfolio standards in many states, renewable capacity is expected to grow.
The United States uses more energy per person than all but two countries—Canada and Norway—in the large energy user group, and its per capita emissions of carbon dioxide also are considerably higher than
other countries in the group. These three metrics represent the largest source of risk for the U.S. compared to the OECD average. All three of these risks, however, have shown improvement relative to the OECD baseline over the last decade.
The United States also uses generally more energy overall and in the transportation sector to produce a dollar of GDP, than the OECD average, but the differences are not all that large. The same goes for carbon dioxide intensity. Since 2000, each of these metrics has been improving at about the same rate as the OECD average. New efficiency standards for appliances and vehicles may accelerate the improvement seen in these areas, also reducing gasoline demand.
Overall, then, U.S. energy security appears to be improving vis-à-vis the OECD baseline, even as the overall risk score continue to rise—in other words, U.S. energy security risks are increasing at a slower rate than the OECD average. The largest drivers of this relative improvement have been related to increased domestic energy production and lower energy costs. Moreover, in those areas where the United States is performing relatively worse than the OECD average, risks are climbing at about the same or at a slightly slower pace than the OECD average.

www.energyxxi.org 73
international index of Energy security Risk
introduction
The Energy Institute’s goal in creating the International Index of Energy Security Risk (International Index) is to be able to compare energy security risks across countries and country groups, and how these risks change over time. For the International Index, then, our interest is both in the absolute progress over time as well as the relative progress observed among countries, particularly large energy-consuming economies, and relative to a baseline average. Understanding the relative progress elsewhere gives us new insights into market conditions, policies, and other events that affect energy security more locally.
The methods used to develop it build off much of the work and concepts used in developing the Energy Institute’s Index of U.S. Energy Security Risk® (U.S. Index). When the U.S. Index was first developed, the task of reducing U.S. energy security risks to a single number posed large analytical challenges. The U.S. Index was constructed from a foundation of 37 metrics measuring broad aspects of energy security. The U.S. Index uses historical and forecast data covering the period 1970 to 2035 using “business-as-usual” forecasts from the Energy Information Administration (EIA).
Given that so much of the energy market activities take place in an increasingly globalized context, there seems to be ample justification in using the U.S. Index as a starting point for building the International Index. While sound in theory, the idea of extending the U.S. methodology to other countries proved to be more complex than anticipated, especially when it came to data availability. Accordingly, in developing the International Index, the measures and methodology developed for the U.S. Index had to be adapted.
The United States has a comparative wealth of richly detailed and comprehensive data covering long time spans. The international data available, however, are something of a mixed bag, and even at their best, they are not as complete and consistent as the United States data. The data typically do not have the historical coverage we have in the U.S., and often there are gaps. Data on energy prices and expenditures show gaps in coverage, particularly for non-OECD countries.
Further, whereas the U.S. has a detailed forecasting system extending 25 years into the future and dovetails well with historical data, the international forecasts necessarily entail aggregations that prevent the goal of country-by-country analysis.
Data Criteria and sources
Data limitations make it necessary to strike a balance between the theoretically ideal and the realistically possible. Not every risk metric can be measured with solid data, but that does not mean that less-than-perfect data cannot be used provided its usefulness and limitations are well understood. Even data we commonly view as reliable—U.S. employment, inflation rates, GDP, etc.—are themselves developed from samples and extrapolations, and are best thought of as estimates rather than complete compilations. These issues are magnified in dealing with international data. Our approach in the developing the U.S. Index was not to let the perfect be the enemy of the good, and that is the approach we also have taken in developing the International Index.
One of the first tasks in developing the U.S. Index was ensuring that the data we used were useful
Appendix 1: Methodology Used to Develop the international index of Energy security Risk®
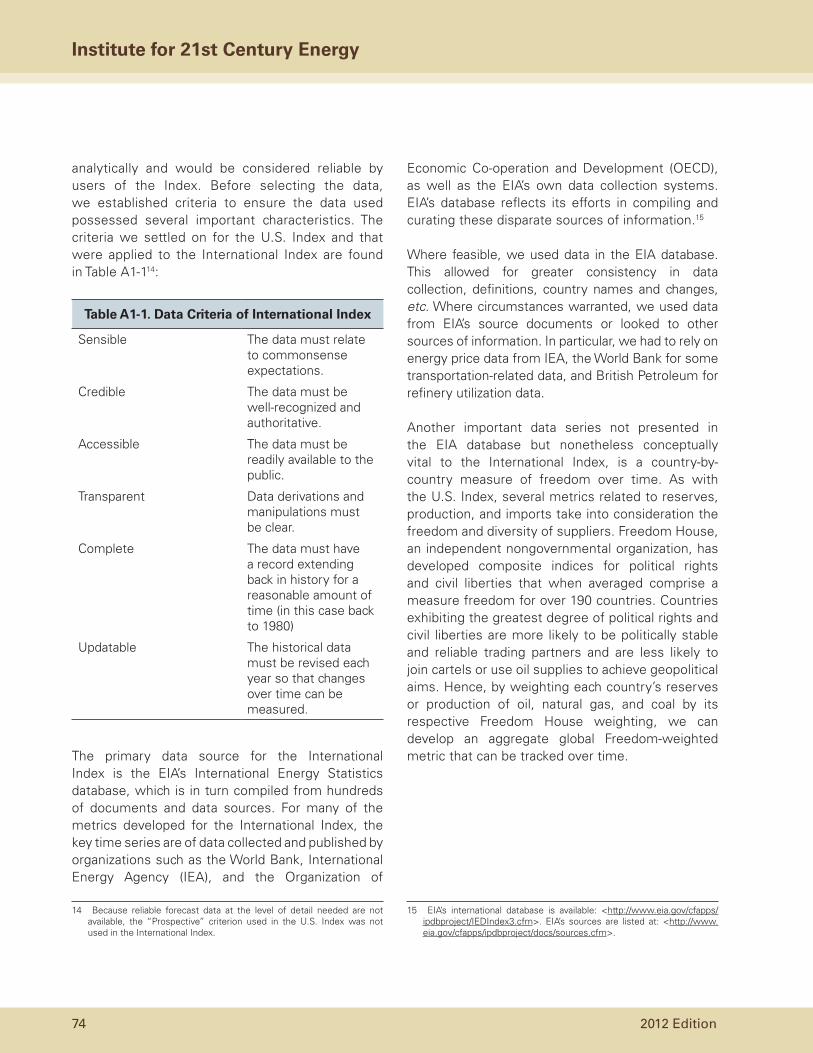
74 2012 Edition
institute for 21st Century Energy
analytically and would be considered reliable by users of the Index. Before selecting the data, we established criteria to ensure the data used possessed several important characteristics. The criteria we settled on for the U.S. Index and that were applied to the International Index are found in Table A1-114:
table A1-1. Data Criteria of international index
Sensible The data must relate to commonsense expectations.
Credible The data must be well-recognized and authoritative.
Accessible The data must be readily available to the public.
Transparent Data derivations and manipulations must be clear.
Complete The data must have a record extending back in history for a reasonable amount of time (in this case back to 1980)
Updatable The historical data must be revised each year so that changes over time can be measured.
The primary data source for the International Index is the EIA’s International Energy Statistics database, which is in turn compiled from hundreds of documents and data sources. For many of the metrics developed for the International Index, the key time series are of data collected and published by organizations such as the World Bank, International Energy Agency (IEA), and the Organization of
14 Because reliable forecast data at the level of detail needed are not available, the “Prospective” criterion used in the U.S. Index was not used in the International Index.
Economic Co-operation and Development (OECD), as well as the EIA’s own data collection systems. EIA’s database reflects its efforts in compiling and curating these disparate sources of information.15
Where feasible, we used data in the EIA database. This allowed for greater consistency in data collection, definitions, country names and changes, etc. Where circumstances warranted, we used data from EIA’s source documents or looked to other sources of information. In particular, we had to rely on energy price data from IEA, the World Bank for some transportation-related data, and British Petroleum for refinery utilization data.
Another important data series not presented in the EIA database but nonetheless conceptually vital to the International Index, is a country-by-country measure of freedom over time. As with the U.S. Index, several metrics related to reserves, production, and imports take into consideration the freedom and diversity of suppliers. Freedom House, an independent nongovernmental organization, has developed composite indices for political rights and civil liberties that when averaged comprise a measure freedom for over 190 countries. Countries exhibiting the greatest degree of political rights and civil liberties are more likely to be politically stable and reliable trading partners and are less likely to join cartels or use oil supplies to achieve geopolitical aims. Hence, by weighting each country’s reserves or production of oil, natural gas, and coal by its respective Freedom House weighting, we can develop an aggregate global Freedom-weighted metric that can be tracked over time.
15 EIA’s international database is available: <http://www.eia.gov/cfapps/ipdbproject/IEDIndex3.cfm>. EIA’s sources are listed at: <http://www.eia.gov/cfapps/ipdbproject/docs/sources.cfm>.

www.energyxxi.org 75
international index of Energy security Risk
time Dimensions and geographic Coverage of Metrics
For the time period covered, the International Index extends back to 1980, compared to a U.S. starting point of 1970. However, while some of the international data goes back to the 1970s or before, many of the data series do not, and this in turn would make the development of some pre-1980 metrics very difficult if not impossible.
Moreover, there is there is no forecast component to the International Index. The U.S. Index uses projections made by EIA’s Annual Energy Outlook out to the year 2035. EIA’s domestic projections are based on runs of the National Energy Modeling System, which produces very detailed forecasts that can be mapped to historical data. International projections, however, including models used in EIA’s International Energy Outlook or IEA’s World Energy Outlook, are more regionally aggregated and not readily broken down into country-by-country projections in anywhere near the detail needed. So at least for now, the International Index is historical only.16
Thanks to the decades-long efforts of EIA, IEA, and others, we have comprehensive, country-by-country information on many measures of energy production, energy consumption, population, GDP, carbon dioxide emissions, and other energy-related measures. Accordingly, for a wide range of energy security risk metrics, we develop time series for all individual countries as well as groups of countries such as the OECD nations. The International Index incorporates the risk index scores for all of the countries globally.
However, differences in geographic coverage also shape the limits of what is possible. Particularly for some of the smaller and/or developing nations, the data are less complete, and it became necessary to develop neutral proxy assumptions and methods for filling in gaps in the historical record. Because of these
16 The Energy Institute is exploring different approaches to incorporate world energy forecasts in future editions.
data limitations, as well as recognition that fewer than 25 of the major economies account for well over half of total world energy consumption, the focus of this published report is aimed at the countries listed below:
AustraliaBrazilCanadaChinaDenmarkFranceGermanyIndiaIndonesiaItalyJapanMexicoNetherlandsNew ZealandNorwayPolandRussian FederationSouth AfricaSouth KoreaSpainThailandTurkeyUkraineUnited KingdomUnited States
Metrics of Energy security Risk
The individual energy security measures selected were organized around eight broad categories that represent and balance some key and often competing aspects of energy security. These are found in table A1-2. Using these categories as guides, 28 individual metrics were developed covering a wide range of energy supplies, energy end uses, operations, and environmental emissions.
As one goal was to build upon the U.S. Index, the starting point was its 37 metrics measuring various geopolitical,

76 2012 Edition
institute for 21st Century Energy
economic, reliability, and environmental aspects of energy security risks. These metrics collectively spanned a broad range of energy security concerns.
The United States, however, has an abundance of reliable and timely energy data few other countries can match. It is unavoidable, then, that the International Index measures slightly different things and lacks the rich detail of the U.S. Index. While many of the metrics used to create the International Index measure
essentially the same things as those used in the U.S. Index, others are different or are missing entirely.
The metrics used in the Index have to strike a balance between what would be the most desirable measure in theory and what can reasonably be measured in reality. More often than we would have liked, the available historical data measured what actually happened, not what might have happened. In other words, much of the available data measure history, not risk.
table A1-2. Classification of Energy security Metrics Used in the international index
Metric Category general Description of the Metrics
global Fuels Measure the reliability and diversity of global reserves and supplies of oil, natural gas, and coal. Higher reliability and diversity mean a lower risk to energy security.
Fuel imports Measure the exposure of the national economies to unreliable and concentrated supplies of oil and natural gas, and coal. Higher supply reliability and diversity and lower import levels mean a lower risk to energy security.
Energy Expenditures Measure the magnitude of energy costs to national economies and the exposure of consumers to price shocks. Lower costs and exposure mean a lower risk to energy security.
Price & Market Volatility Measure the susceptibility of national economies to large swings in energy prices. Lower volatility means a lower risk to energy security.
Energy Use intensity Measure energy use in relation to population and economic output. Lower use of energy by industry to produce goods and services means a lower risk to energy security.
Electric Power sector Measure indirectly the reliability of electricity generating capacity. Higher diversity means a lower risk to energy security.
transportation sector Measure efficiency of energy use in the transport sector per unit of GDP and population. Greater efficiency means a lower risk to energy security.
Environmental Measure the exposure of national economies to national and international greenhouse gas emission reduction mandates. Lower emissions of carbon dioxide from energy mean a lower risk to energy security.

www.energyxxi.org 77
international index of Energy security Risk
In assessing security and risk, we are ultimately trying to understand the likelihood of an energy shock of some kind. However, the data we have available typically describes only what actually happened, and not what nearly happened or could have happened. So, in this sense some of the metrics are proxies for things that cannot be measured directly, such as political and civil freedom being used as a proxy measure for a country’s stability of supply. This does not mean that countries that perform poorly in these metric have been unreliable supplies in the past or necessarily will be unreliable suppliers in the future, but it does mean the risks of a disruption are higher in countries that do not score well in this metric when compared to countries that do score well.
Some metrics represented in the U.S. Index could not be replicated in the International Index because there simply were not usable data. Data on energy research and development expenditures by national governments and industry and data on college degrees in science, mathematics, engineering, and technology are not available in many OECD countries, so metrics covering these areas, which are included in the U.S. Index, are not included in the International Index.
In some instances we developed metrics not used in the U.S. Index. In particular, fuel imports and exports are a higher share of supply for many countries than in the United States. Coal is an example. The U.S. has long-term (over 200 years) and secure supplies of coal, so it did not feature in the import metrics of the U.S. Index the way oil and natural gas did. That is not the case in many other countries that rely on imported coal to meet domestic needs. Therefore, we developed a metric measuring the net import exposure of coal in addition to the metrics for oil and natural gas.
These fuel-specific measures, however, do not do a good job of reflecting how important that fuel is in the overall energy mix of the country. Consider two countries that meet most of their demand for a particular fuel, say natural gas, through imports. If in
one of these countries gas is a relatively small part of the energy mix and in the other gas is a very large part of the energy mix, their level of risk is quite different. To help account for these broader dependencies as well as the fuel-specific concerns, we have also developed a metric measuring total energy import exposure, which reflects the diversity of the different fuel mix in the country, helps even out the effects of outlying values for individual fuels, and picks up nuclear and renewable energies.
Energy price and expenditure data are very important measures of certain aspects of energy security, and there are central to the U.S. Index. In developing the International Index, it became clear early on that the availability and quality of these data varies greatly from country to country and that overall there is much less coverage of prices by sector and fuel compared to the United States. As a result, our efforts for the International Index were focused on overall energy prices rather than sector-level or end-use prices.
The primary source of energy price and expenditure data for the International Index is the IEA. Given IEA’s mission and origins, it is not surprising that the amount and extent of price data for OECD countries is much greater than it is for non-OECD countries, but even the coverage in many OECD countries is less than ideal.
To include energy price and expenditure metrics in the International Index, we had to develop proxies for energy prices for countries where IEA data were incomplete or unavailable. In general, where specific price information was not available, we developed proxy prices that would have a neutral effect on a country’s risk index. Using IEA price and consumption data for different fuels, we developed rough approximations of energy prices and expenditures that, while imperfect, meet the needs of the International Index.
Overall, for the International Index we have constructed 28 metrics, as shown in Figure A1-3.

78 2012 Edition
institute for 21st Century Energy
table A1-3. Metrics Used to Create international index of Energy security Risk
Metric by Classification
Definition importanceWeight
(Percent)
global Fuel Metrics 15
Security of World Oil Reserves
Global proved oil reserves weighted by each country’s relative Freedom Index and by an index of global diversity of oil reserves.
Indicates risk attached to the average barrel of global crude oil reserves. As a measure of reserves, it largely reflects longer-term concerns.
2
Security of World Oil Production
Global oil production weighted by each country’s relative Freedom Index and by an index of global diversity of oil production.
Indicates the level of risk attached to the average barrel of crude oil production globally.
3
Security of World Natural Gas Reserves
Global proved natural gas reserves weighted by each country’s relative Freedom Index and by an index of global diversity of gas reserves.
Indicates the risk attached to the average cubic foot of natural gas reserves globally. As a measure of reserves, it largely reflects longer-term concerns.
2
Security of World Natural Gas Production
Global natural gas production weighted by each country’s Freedom Index and by global diversity of gas production.
Indicates the level of risk attached to the average cubic foot of natural gas production globally.
3
Security of World Coal Reserves
Global proved coal reserves weighted by each country’s relative Freedom Index and by an index of global diversity of coal reserves.
Indicates the risk attached to the average ton of coal reserves globally. As a measure of reserves, it largely reflects longer-term concerns.
2
Security of World Coal Production
Global coal production weighted by each country’s relative Freedom Index and by an index of global diversity of coal production.
Indicates the level of risk attached to the average ton of coal production globally.
3

www.energyxxi.org 79
international index of Energy security Risk
table A1-3. Metrics Used to Create international index of Energy security Risk
Metric by Classification
Definition importanceWeight
(Percent)
Fuel import Metrics 16
Petroleum Import Exposure
Net petroleum imports as a percentage of total national petroleum supply, adjusted to reflect the reliability of international petroleum production (measured using the Freedom Index) and the diversity across producing countries.
Indicates the degree to which changes in import levels expose the country to potentially unreliable and/or concentrated supplies of crude and refined petroleum.
3
Natural Gas Import Exposure
Net natural gas imports as a percentage of total national gas supply, adjusted to reflect the reliability of international gas production (measured using the Freedom Index) and the diversity across producing countries.
Indicates the degree to which changes in import levels expose the country to potentially unreliable and/or concentrated supplies of natural gas.
2
Coal Import Exposure
Net coal imports as a percentage of total national coal supply, adjusted to reflect the reliability of international coal production (measured using the Freedom Index) and the diversity across producing countries.
Indicates the degree to which changes in import levels expose the country to potentially unreliable and/or concentrated supplies of coal.
2
Total Energy Import Exposure
Net energy imports as a share of total primary energy consumption.
Indicates the degree to the country is reliant on foreign sources for it energy needs.
4
Fossil Fuel Import Expenditures per GDP
Net fossil fuel import costs as a share of GDP.
Indicates the susceptibility of a country to imported fossil fuel price shocks.
5
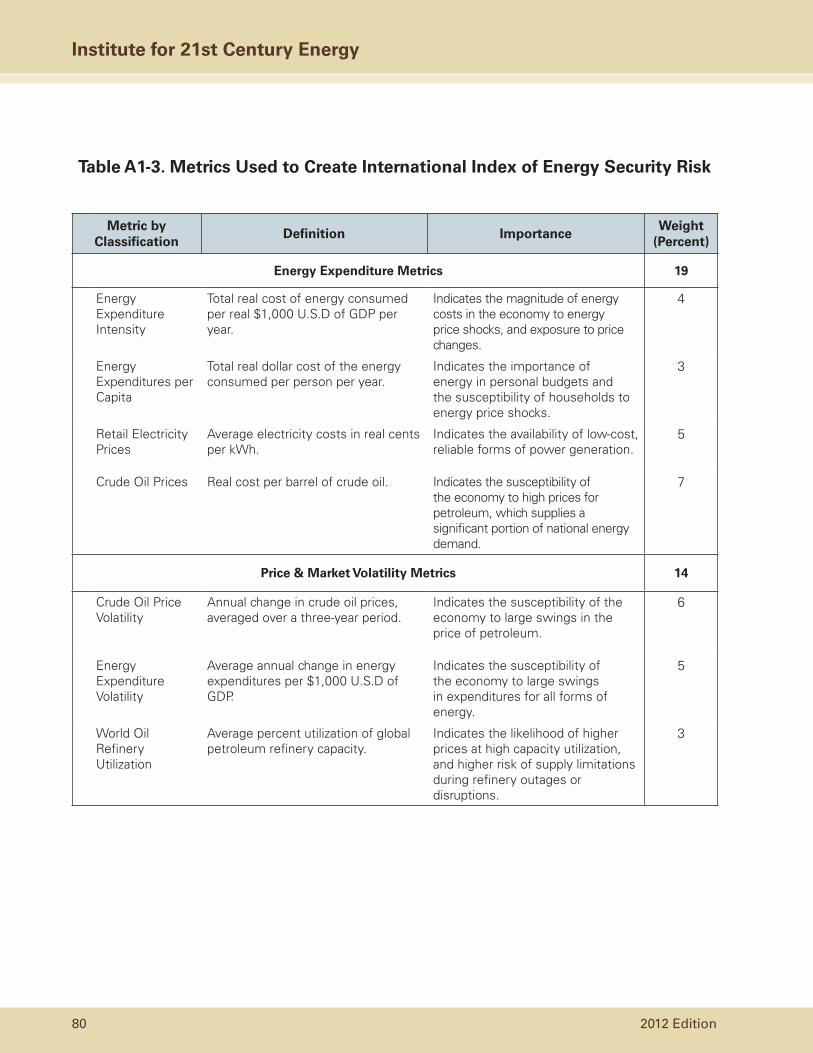
80 2012 Edition
institute for 21st Century Energy
table A1-3. Metrics Used to Create international index of Energy security Risk
Metric by Classification
Definition importanceWeight
(Percent)
Energy Expenditure Metrics 19
Energy Expenditure Intensity
Total real cost of energy consumed per real $1,000 U.S.D of GDP per year.
Indicates the magnitude of energy costs in the economy to energy price shocks, and exposure to price changes.
4
Energy Expenditures per Capita
Total real dollar cost of the energy consumed per person per year.
Indicates the importance of energy in personal budgets and the susceptibility of households to energy price shocks.
3
Retail Electricity Prices
Average electricity costs in real cents per kWh.
Indicates the availability of low-cost, reliable forms of power generation.
5
Crude Oil Prices Real cost per barrel of crude oil. Indicates the susceptibility of the economy to high prices for petroleum, which supplies a significant portion of national energy demand.
7
Price & Market Volatility Metrics 14
Crude Oil Price Volatility
Annual change in crude oil prices, averaged over a three-year period.
Indicates the susceptibility of the economy to large swings in the price of petroleum.
6
Energy Expenditure Volatility
Average annual change in energy expenditures per $1,000 U.S.D of GDP.
Indicates the susceptibility of the economy to large swings in expenditures for all forms of energy.
5
World Oil Refinery Utilization
Average percent utilization of global petroleum refinery capacity.
Indicates the likelihood of higher prices at high capacity utilization, and higher risk of supply limitations during refinery outages or disruptions.
3
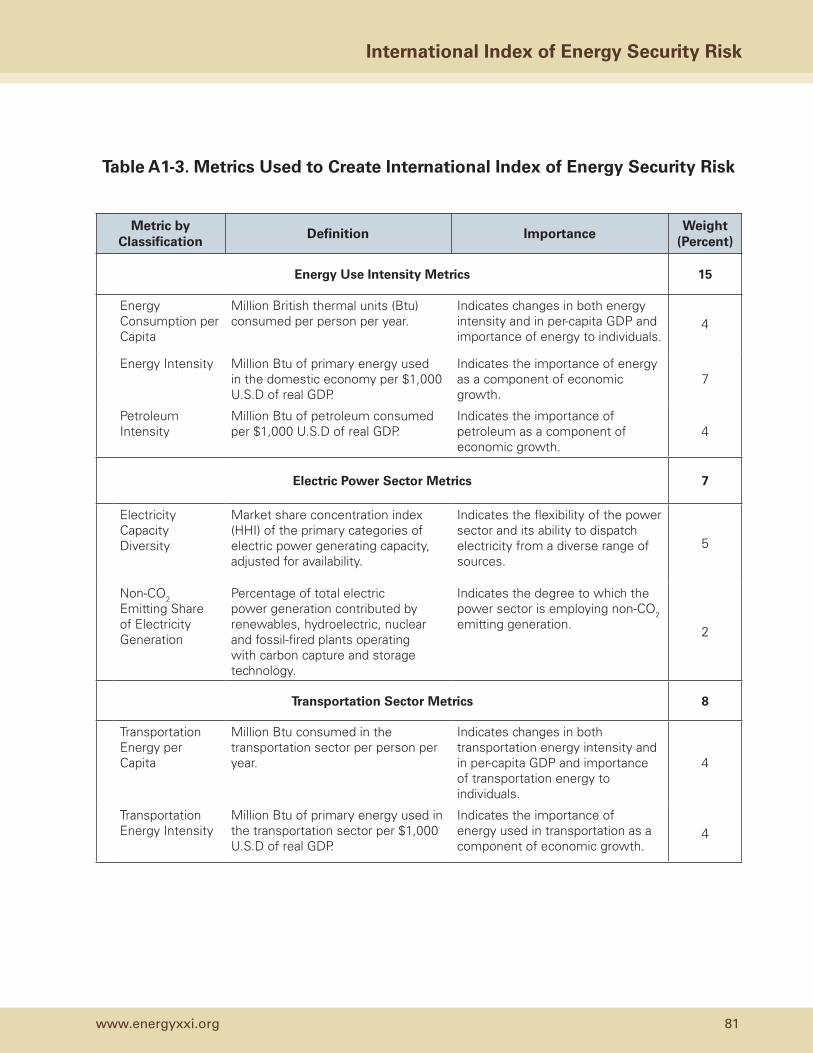
www.energyxxi.org 81
international index of Energy security Risk
table A1-3. Metrics Used to Create international index of Energy security Risk
Metric by Classification
Definition importanceWeight
(Percent)
Energy Use intensity Metrics 15
Energy Consumption per Capita
Million British thermal units (Btu) consumed per person per year.
Indicates changes in both energy intensity and in per-capita GDP and importance of energy to individuals.
4
Energy Intensity Million Btu of primary energy used in the domestic economy per $1,000 U.S.D of real GDP.
Indicates the importance of energy as a component of economic growth.
7
Petroleum Intensity
Million Btu of petroleum consumed per $1,000 U.S.D of real GDP.
Indicates the importance of petroleum as a component of economic growth.
4
Electric Power sector Metrics 7
Electricity Capacity Diversity
Market share concentration index (HHI) of the primary categories of electric power generating capacity, adjusted for availability.
Indicates the flexibility of the power sector and its ability to dispatch electricity from a diverse range of sources.
5
Non-CO2 Emitting Share of Electricity Generation
Percentage of total electric power generation contributed by renewables, hydroelectric, nuclear and fossil-fired plants operating with carbon capture and storage technology.
Indicates the degree to which the power sector is employing non-CO2 emitting generation. 2
transportation sector Metrics 8
Transportation Energy per Capita
Million Btu consumed in the transportation sector per person per year.
Indicates changes in both transportation energy intensity and in per-capita GDP and importance of transportation energy to individuals.
4
Transportation Energy Intensity
Million Btu of primary energy used in the transportation sector per $1,000 U.S.D of real GDP.
Indicates the importance of energy used in transportation as a component of economic growth.
4

82 2012 Edition
institute for 21st Century Energy
table A1-3. Metrics Used to Create international index of Energy security Risk
Metric by Classification
Definition importanceWeight
(Percent)
Environmental Metrics 6
CO2 Emissions Trend
Annual change in total national energy-related CO2 emissions.
Indicates the exposure of the economy to domestic and international emissions reduction mandates.
2
Energy-Related Carbon Dioxide Emissions per Capita
Metric tons of CO2 emissions (energy-related), per capita.
Indicates the joint effect of the amount of energy used per capita, and the carbon intensity of that energy use.
2
Energy-Related Carbon Dioxide Emissions Intensity
Metric tons of CO2 per $1,000 U.S.D of real GDP.
Indicates the importance of carbon-based fuels as a component of the economy. 2
normalizing the Metrics into indexes
Our interest in an International Index goes beyond an understanding of absolute trends in individual countries over time to include the relative trends observed across countries. Understanding the relative progress elsewhere can provide new insights into market conditions, policies, and other events affecting energy security at a national level. To achieve this, the International Index reflects a modified approach from that of the U.S. Index.
The various metrics used in the index are measured in many different units making it necessary to transform them into comparable “building blocks” that could then be assembled into an index.
When developing the U.S. Index, each of it 37 metrics and four sub-indexes was normalized by setting the value for the year 1980 at 100 and pegging the values for all other years in proportional relation to the 1980
value, either higher or lower.17 As a result, each of the 37 normalized metrics, the Geopolitical, Economic, Reliability, and Environmental Sub-Indexes and the overall U.S. Index has a 1980 score of 100.
For the International Index, the procedure described above is insufficient. If all the countries had energy security risk values of 100 in 1980, similar to the U.S. Index, then we would lose most of our ability to compare the relative positions of different countries.
For the International Index to be able to convey information about both changes in energy security risk within a country over time and changes in risk compared to other countries over time, an international benchmark against which the individual
17 For most of the metrics use in the U.S. Index, a lower value represents a lower risk, which makes the conversion to an index simple. With some metrics, however, a rising trend signals a declining risk. In these cases, additional transformations were needed. To normalize these types of metrics, various techniques were used to invert or “flip” the metric so that its index value moves in the opposite direction to its measured value so that increases became decreases and vice versa. Additionally, some of the metrics required further transformations to reflect non-linearities in the scale.
www.energyxxi.org 83
international index of Energy security Risk
countries could be compared had to be created. For this, we selected the average of the present roster of OECD nations.18
There are many other possible reference countries or groups of countries that could have served as a reference, but there is a benefit in having it account for a large share of global economic activity. If the reference country were small in size, some of the metrics would be more likely to have an unusually high or low value in 1980, and this in turn could make the relative values of other countries appear artificially low or high. This appearance of volatility is less likely with a larger reference group.
Using the world average as the reference group seems at first glance an attractive option, but there are large data gaps for some measures, particularly price and expenditure data in less-developed countries. Also, since a world average would be a mix of developed and undeveloped nations, any particular country of interest would likely show metric values far above or below this world average, which does not tell us all that much.
Hence, for this purpose a good reference measure should have large coverage across a range of developed nations, criteria the OECD group of nations best represents. Importantly, the OECD nations have the most complete data for our purposes, enabling an OECD-wide value for all of our metrics. The breadth of data also is favorable. For example, in 1980 the OECD nations accounted for 63% of the world’s energy consumption, compared to just 28% for the U.S. alone. In 2008, the OECD nations still accounted for 49% of the world’s energy consumption, while the U.S. share had slipped to 20%.
18 Although OECD membership has changed over its 50-plus year history, the OECD averages over the entire period from 1980 through 2010 were calculated using the current roster of OECD members. OECD membership today includes: Australia, Austria, Belgium, Canada, Chile, Czech Republic, Denmark, Estonia, Finland, France, Germany, Greece, Hungary, Iceland, Ireland, Israel, Italy, Japan, Luxembourg, Mexico, Netherlands, New Zealand, Norway, Poland, Portugal, Slovak Republic, Slovenia, South Korea, Spain, Sweden, Switzerland, Turkey, United Kingdom, and U.S.. Because OECD is used as the baseline against which other countries are compared, the list of OECD countries needed to remain fixed over time.
To set the OECD baseline, the same normalization procedures used for the U.S. Index (described above) were applied to the OECD. The 1980 value for each OECD metric value for was set at 1,000, and values for subsequent years moved lower or higher relative to this 1980 value.19 Whether future values approach or exceed this point will be determined in large part by developments in policy, international politics, energy markets, technology, and many other factors.
The values for each of the individual countries were calibrated to this reference trend. If, for example, a country’s 1980 value in, say energy intensity, was 17% higher than the OECD average value for that metric, the 1980 value would be set at 1,170, with data for subsequent years for that country rising or falling relative to that starting point. In this way, a country’s relative performance and its absolute performance can be observed.
Weighting the Metric indexes
For the International Index, we have chosen to forgo the use of separate Sub-Indexes of the kind used in the U.S. Index20 and to combine directly the metrics into a country’s overall risk score for each country. Part of the reason for this is simply data management; with over 200 countries in the database, multiple sub-indexes for each country would produce an overwhelming amount of data. But there are substantive reasons as well for not creating the separate sub-indexes, including the fact that the data that would be needed for a robust Economic or Reliability Sub-Index are not available in the quantity or quality that would be needed.
Moreover, because the International Index has fewer metrics and some metric categories are less well populated than others, we could not apply
19 It should be noted that the 1980 level is not a cap—the scale is open-ended.
20 The methodology used in the U.S. Index maps each of its 37 metrics to four Sub-Indexes representing Geopolitical, Economic, Reliability, and Environmental risks. These four Sub-Indexes were then weighted and combined to form the top-level U.S. Index.

84 2012 Edition
institute for 21st Century Energy
identical weightings for each individual metric in the U.S. Index to its counterpart in the International Index, as we would have preferred. Nevertheless, the weightings used in the U.S. Index were used as general guidance.
The weighing of the 28 International metrics began with placing them into logical groupings. Because there are no metrics on R&D or education, there are only eight categories of metrics in the International Index, compared to nine categories in the U.S. Index. Each of the categories includes at least two and no more than six metrics (Table A1-3).
For weighting the metrics, we next looked at the approximate weights of each category of metric the U.S. Index and assigned them similar shares in the International Index (Table A1-4). Fuel Imports were given a greater weighting in the International Index, and a dearth of reliable and current data meant that no R&D metrics were used. Next, we allocated weights to the individual metrics based on weight of the category to which it belongs and, where possible, its relative importance within that category.
table A1-4. input Weights by Metric Category
Category U.S. Index Weightings
International Index Weightings
Global Fuels 15.1 15
Fuel Imports 11.8 16
Energy Expenditures 18.3 19
Price & Market Volatility 12.6 14
Energy Use Intensity 15.3 15
Electric Power Sector 6.2 7
Transportations Sector 9.8 8
Environmental 7.6 6
R&D 3.3 NA
Using these steps, we were able to construct an energy security risk index for each country, as well as for the OECD and other country groupings. For each country, we have 28 metrics, each with a time series value that has been normalized into a risk measure where the OECD 1980 value is set to 1,000. For each country and each year, the 28 metrics are weighted according to the values shown in Table A1-3. The risk index for a country in any given year is then the sum of the metric values, each multiplied by its assigned weighted share.21 In this logic, the OECD reference group, where each metric was normalized so that 1980 equals 1,000, will similarly have a 1980 International Index value of 1,000.
21 Some countries are net exporters of certain types of energy, which means that for some countries, certain import-related metrics may have, at least theoretically, a negative risk score. In those instances, a risk index score of “0” is used.

www.energyxxi.org 85
international index of Energy security Risk
Appendix 2: international index of Energy security Risk scores by Country
Appendix 2 presents for the OECD group and the countries in the large energy user group the normalized index scores for the 28 individual metrics used to define, quantify, and construct the International Index and the overall scores. These are found in Tables A2-1 through A2-26.
In addition, risk scores for the top 75 energy-consuming countries in the International Index database are provided in Table A2-27. These countries together represent about 97% of global energy demand. The risk scores are provided for 1980 to 2010 in five-year increments. It should be noted that
data for many of countries, particularly price and expenditures data, are sparse if not lacking entirely. In general, where specific price information was not available, we developed proxy prices that would have a neutral effect on a country’s risk index. Using IEA price and consumption data for different fuels, we developed rough approximations of energy prices and expenditures that, while imperfect, meet the needs of the International Index.
These and other data also are available in spreadsheet form at the Energy Institute web site.

86 2012 Edition
institute for 21st Century Energy
international Energy security Risk index scores: oECD AverageMetric 1980 1985 1990 1995 2000 2005 2010
global FuelsGlobal Oil Reserves 1,000 1,045 1,243 1,313 1,280 871 883 Global Oil Production 1,000 909 777 741 689 728 712 Global Gas Reserves 1,000 1,364 869 927 996 981 939 Global Gas Production 1,000 1,480 927 671 751 806 874 Global Coal Reserves 1,000 1,071 665 570 563 632 730 Global Coal Production 1,000 1,049 795 826 623 975 1,129 Fuel importsOil Import Exposure 1,000 910 868 794 717 714 705 Gas Import Exposure 1,000 1,410 1,157 1,229 1,272 1,291 1,131 Coal Import Exposure 1,000 950 871 1,234 1,251 1,478 1,256 Total Energy Import Exposure 1,000 852 827 838 852 1,011 1,005 Fossil Fuel Import Expenditure per GDP 1,000 553 671 561 580 784 837 Energy ExpendituresEnergy Expenditure Intensity 1,000 715 740 612 540 669 751 Energy Expenditures per Capita 1,000 845 1,005 880 880 1,165 1,327 Retail Electricity Prices 1,000 858 944 964 706 765 870 Crude Oil Prices 1,000 608 395 269 390 618 862 Price & Market VolatilityCrude Oil Price Volatility 1,000 489 508 214 873 837 2,617 Energy Expenditure Volatility 1,000 448 377 227 183 677 1,206 World Oil Refinery Usage 1,000 1,021 1,210 1,219 1,237 1,325 1,192 Energy Use intensityEnergy Consumption per Capita 1,000 965 1,012 954 997 998 957 Energy Intensity 1,000 817 746 664 612 573 542 Petroleum Intensity 1,000 727 666 584 531 499 439 Electric Power sectorElectricity Capacity Diversity 1,000 912 876 876 896 926 925 Non-Carbon Generation 1,000 907 890 834 864 885 851 transportation sectorTransport Energy per Capita 1,000 1,000 1,134 1,095 1,177 1,209 1,143 Transport Energy Intensity 1,000 846 835 761 722 694 647 EnvironmentalCO2 Emissions Trend 1,000 971 1,035 1,089 1,183 1,230 1,160 CO2 per Capita 1,000 928 949 864 905 909 831 CO2 GDP Intensity 1,000 786 699 601 555 522 470
Total Index 1,000 847 797 731 758 842 988

www.energyxxi.org 87
international index of Energy security Risk
international Energy security Risk index scores: AustraliaMetric 1980 1985 1990 1995 2000 2005 2010
global FuelsGlobal Oil Reserves 1,000 1,045 1,243 1,313 1,280 871 883 Global Oil Production 1,000 909 777 741 689 728 712 Global Gas Reserves 1,000 1,364 869 927 996 981 939 Global Gas Production 1,000 1,480 927 671 751 806 874 Global Coal Reserves 1,000 1,071 665 570 563 632 730 Global Coal Production 1,000 1,049 795 826 623 975 1,129 Fuel importsOil Import Exposure 437 0 0 131 0 380 493 Gas Import Exposure 246 0 0 0 0 0 0 Coal Import Exposure 0 0 0 0 0 0 0 Total Energy Import Exposure 354 0 0 99 0 288 344 Fossil Fuel Import Expenditure per GDP 246 0 0 82 0 330 473 Energy ExpendituresEnergy Expenditure Intensity 456 431 415 396 351 486 491 Energy Expenditures per Capita 570 583 619 638 657 1,011 1,098 Retail Electricity Prices 635 556 661 629 442 641 707 Crude Oil Prices 1,000 608 395 269 390 618 862 Price & Market VolatilityCrude Oil Price Volatility 1,000 489 508 214 873 837 2,617 Energy Expenditure Volatility 456 783 181 193 465 733 888 World Oil Refinery Usage 1,000 1,021 1,210 1,219 1,237 1,325 1,192 Energy Use intensityEnergy Consumption per Capita 916 1,016 1,069 1,096 1,239 1,308 1,358 Energy Intensity 733 750 716 681 662 629 607 Petroleum Intensity 677 627 607 584 510 461 415 Electric Power sectorElectricity Capacity Diversity 1,196 1,238 1,246 1,260 1,275 1,271 1,280 Non-Carbon Generation 1,223 1,261 1,293 1,293 1,310 1,325 1,344 transportation sectorTransport Energy per Capita 1,146 1,388 1,446 1,470 1,595 1,629 1,370 Transport Energy Intensity 917 1,025 969 913 853 784 612 EnvironmentalCO2 Emissions Trend 1,000 1,196 1,346 1,454 1,792 1,998 2,156 CO2 per Capita 1,071 1,193 1,243 1,267 1,473 1,546 1,570 CO2 GDP Intensity 857 881 833 786 788 744 701
Total Index 785 744 673 649 700 803 942

88 2012 Edition
institute for 21st Century Energy
international Energy security Risk index scores: brazilMetric 1980 1985 1990 1995 2000 2005 2010
global FuelsGlobal Oil Reserves 1,000 1,045 1,243 1,313 1,280 871 883 Global Oil Production 1,000 909 777 741 689 728 712 Global Gas Reserves 1,000 1,364 869 927 996 981 939 Global Gas Production 1,000 1,480 927 671 751 806 874 Global Coal Reserves 1,000 1,071 665 570 563 632 730 Global Coal Production 1,000 1,049 795 826 623 975 1,129 Fuel importsOil Import Exposure 1,493 523 600 541 330 67 0 Gas Import Exposure 0 0 0 0 871 1,593 1,461 Coal Import Exposure 5,675 4,513 5,333 6,174 5,135 5,496 4,824 Total Energy Import Exposure 1,638 533 644 637 446 283 246 Fossil Fuel Import Expenditure per GDP 2,885 774 885 546 707 232 45 Energy ExpendituresEnergy Expenditure Intensity 1,332 1,051 820 495 894 1,127 1,250 Energy Expenditures per Capita 317 238 185 120 223 300 390 Retail Electricity Prices 1,028 1,148 1,134 792 888 906 999 Crude Oil Prices 1,000 608 395 269 390 618 862 Price & Market VolatilityCrude Oil Price Volatility 1,000 489 508 214 873 837 2,617 Energy Expenditure Volatility 1,332 738 822 1,239 1,092 1,547 3,650 World Oil Refinery Usage 1,000 1,021 1,210 1,219 1,237 1,325 1,192 Energy Use intensityEnergy Consumption per Capita 160 163 186 210 236 242 277 Energy Intensity 672 720 822 862 948 906 889 Petroleum Intensity 818 722 894 937 1,028 913 864 Electric Power sectorElectricity Capacity Diversity 2,562 2,639 2,774 2,853 2,534 2,130 1,995 Non-Carbon Generation 82 61 62 68 120 139 267 transportation sectorTransport Energy per Capita 189 174 242 302 335 337 419 Transport Energy Intensity 795 768 1,069 1,242 1,346 1,262 1,345 EnvironmentalCO2 Emissions Trend 1,000 1,038 1,278 1,557 1,855 1,991 2,462 CO2 per Capita 119 110 124 139 154 154 179 CO2 GDP Intensity 500 487 547 573 618 578 574
Total Index 1,147 874 888 866 926 939 1,165

www.energyxxi.org 89
international index of Energy security Risk
international Energy security Risk index scores: CanadaMetric 1980 1985 1990 1995 2000 2005 2010
global FuelsGlobal Oil Reserves 1,000 1,045 1,243 1,312 1,280 871 883 Global Oil Production 1,000 909 777 741 689 728 712 Global Gas Reserves 1,000 1,364 869 927 995 981 939 Global Gas Production 1,000 1,480 927 671 751 806 874 Global Coal Reserves 1,000 1,071 665 570 562 632 730 Global Coal Production 1,000 1,049 795 826 623 975 1,129 Fuel importsOil Import Exposure 59 0 0 0 0 0 0 Gas Import Exposure 0 0 0 0 0 0 0 Coal Import Exposure 156 0 0 0 0 0 0 Total Energy Import Exposure 45 0 0 0 0 0 0 Fossil Fuel Import Expenditure per GDP 42 0 0 0 0 0 0 Energy ExpendituresEnergy Expenditure Intensity 582 523 477 360 324 533 567 Energy Expenditures per Capita 769 749 736 566 596 1,066 1,153 Retail Electricity Prices 416 415 490 452 370 468 526 Crude Oil Prices 1,000 608 395 269 390 618 862 Price & Market VolatilityCrude Oil Price Volatility 1,000 489 508 214 873 837 2,617 Energy Expenditure Volatility 582 211 164 407 358 860 1,747 World Oil Refinery Usage 1,000 1,020 1,210 1,219 1,237 1,325 1,192 Energy Use intensityEnergy Consumption per Capita 1,925 1,911 1,929 2,009 2,051 2,136 2,037 Energy Intensity 1,458 1,333 1,251 1,278 1,116 1,068 1,001 Petroleum Intensity 1,202 855 845 811 742 753 677 Electric Power sectorElectricity Capacity Diversity 1,232 1,141 1,102 1,070 1,233 1,169 1,205 Non-Carbon Generation 311 284 312 299 380 354 321 transportation sectorTransport Energy per Capita 2,178 1,882 1,902 1,939 1,995 2,067 2,186 Transport Energy Intensity 1,649 1,313 1,233 1,234 1,086 1,033 1,074 EnvironmentalCO2 Emissions Trend 1,000 970 1,029 1,112 1,253 1,363 1,217 CO2 per Capita 1,465 1,347 1,334 1,349 1,452 1,516 1,299 CO2 GDP Intensity 1,109 940 865 859 790 758 638
Total Index 935 810 749 721 755 830 995

90 2012 Edition
institute for 21st Century Energy
international Energy security Risk index scores: ChinaMetric 1980 1985 1990 1995 2000 2005 2010
global FuelsGlobal Oil Reserves 1,000 1,045 1,243 1,313 1,280 871 883 Global Oil Production 1,000 909 777 741 689 728 712 Global Gas Reserves 1,000 1,364 869 927 996 981 939 Global Gas Production 1,000 1,480 927 671 751 806 874 Global Coal Reserves 1,000 1,071 665 570 563 632 730 Global Coal Production 1,000 1,049 795 826 623 975 1,129 Fuel importsOil Import Exposure 0 0 0 130 382 493 703 Gas Import Exposure 0 0 0 0 0 0 337 Coal Import Exposure 0 0 0 0 0 0 299 Total Energy Import Exposure 0 0 0 47 205 214 395 Fossil Fuel Import Expenditure per GDP 0 0 0 72 362 527 1,066 Energy ExpendituresEnergy Expenditure Intensity 2,804 1,787 1,119 602 571 680 894 Energy Expenditures per Capita 35 35 29 27 37 68 146 Retail Electricity Prices 280 313 258 238 312 318 350 Crude Oil Prices 1,000 608 395 269 390 618 862 Price & Market VolatilityCrude Oil Price Volatility 1,000 489 508 214 873 837 2,617 Energy Expenditure Volatility 2,804 2,596 891 1,131 368 752 674 World Oil Refinery Usage 1,000 1,021 1,210 1,219 1,237 1,325 1,192 Energy Use intensityEnergy Consumption per Capita 86 102 115 140 141 257 374 Energy Intensity 6,832 5,225 4,390 3,170 2,193 2,585 2,284 Petroleum Intensity 2,976 1,910 1,593 1,308 1,234 1,082 801 Electric Power sectorElectricity Capacity Diversity 1,155 1,158 1,188 1,176 1,177 1,177 1,156 Non-Carbon Generation 1,145 1,099 1,130 1,134 1,167 1,163 1,111 transportation sectorTransport Energy per Capita 10 12 17 28 37 72 149 Transport Energy Intensity 761 632 666 626 583 720 908 EnvironmentalCO2 Emissions Trend 1,000 1,283 1,567 1,976 1,967 3,806 5,860 CO2 per Capita 116 138 156 185 178 335 503 CO2 GDP Intensity 9,231 7,114 5,952 4,208 2,772 3,367 3,071
Total Index 1,497 1,216 966 809 745 889 1,098

www.energyxxi.org 91
international index of Energy security Risk
international Energy security Risk index scores: DenmarkMetric 1980 1985 1990 1995 2000 2005 2010
global FuelsGlobal Oil Reserves 1,000 1,045 1,243 1,313 1,280 871 883 Global Oil Production 1,000 909 777 741 689 728 712 Global Gas Reserves 1,000 1,364 869 927 996 981 939 Global Gas Production 1,000 1,480 927 671 751 806 874 Global Coal Reserves 1,000 1,071 665 570 563 632 730 Global Coal Production 1,000 1,049 795 826 623 975 1,129 Fuel importsOil Import Exposure 1,904 1,503 422 108 0 0 0 Gas Import Exposure 2,215 0 0 0 0 0 0 Coal Import Exposure 11,124 9,729 7,817 10,116 7,159 7,253 4,449 Total Energy Import Exposure 3,197 2,559 1,169 1,026 342 524 476 Fossil Fuel Import Expenditure per GDP 1,579 589 444 309 146 175 163 Energy ExpendituresEnergy Expenditure Intensity 565 273 417 448 375 444 484 Energy Expenditures per Capita 983 542 896 1,040 970 1,202 1,318 Retail Electricity Prices 1,489 969 1,516 1,652 1,380 1,822 1,984 Crude Oil Prices 1,000 608 395 269 390 618 862 Price & Market VolatilityCrude Oil Price Volatility 1,000 489 508 214 873 837 2,617 Energy Expenditure Volatility 565 522 566 277 369 360 747 World Oil Refinery Usage 1,000 1,021 1,210 1,219 1,237 1,325 1,192 Energy Use intensityEnergy Consumption per Capita 823 777 731 824 799 757 719 Energy Intensity 473 391 340 355 309 279 264 Petroleum Intensity 678 459 362 382 317 260 233 Electric Power sectorElectricity Capacity Diversity 1,572 1,567 1,531 1,499 1,434 1,451 1,545 Non-Carbon Generation 1,433 1,429 1,386 1,350 1,187 1,008 943 transportation sectorTransport Energy per Capita 628 713 807 920 989 1,014 1,039 Transport Energy Intensity 361 359 376 396 382 374 382 EnvironmentalCO2 Emissions Trend 1,000 975 879 1,065 839 798 777 CO2 per Capita 999 976 875 1,042 804 752 721 CO2 GDP Intensity 574 491 407 448 311 278 265
Total Index 1,331 1,024 873 878 787 841 942

92 2012 Edition
institute for 21st Century Energy
international Energy security Risk index scores: FranceMetric 1980 1985 1990 1995 2000 2005 2010
global FuelsGlobal Oil Reserves 1,000 1,045 1,243 1,313 1,280 871 883 Global Oil Production 1,000 909 777 741 689 728 712 Global Gas Reserves 1,000 1,364 869 927 996 981 939 Global Gas Production 1,000 1,480 927 671 751 806 874 Global Coal Reserves 1,000 1,071 665 570 563 632 730 Global Coal Production 1,000 1,049 795 826 623 975 1,129 Fuel importsOil Import Exposure 1,868 1,883 1,402 1,204 1,115 1,080 1,126 Gas Import Exposure 6,161 7,232 5,880 4,072 3,878 3,276 2,876 Coal Import Exposure 6,640 4,707 4,891 4,943 6,627 7,437 6,572 Total Energy Import Exposure 2,386 1,993 1,447 1,200 1,257 1,382 1,384 Fossil Fuel Import Expenditure per GDP 1,960 926 997 859 709 917 989 Energy ExpendituresEnergy Expenditure Intensity 760 367 394 350 265 345 357 Energy Expenditures per Capita 1,029 525 644 591 502 687 716 Retail Electricity Prices 1,673 977 1,384 1,319 711 876 873 Crude Oil Prices 1,000 608 395 269 390 618 862 Price & Market VolatilityCrude Oil Price Volatility 1,000 489 508 214 873 837 2,617 Energy Expenditure Volatility 760 453 629 380 195 410 810 World Oil Refinery Usage 1,000 1,021 1,210 1,219 1,237 1,325 1,192 Energy Use intensityEnergy Consumption per Capita 759 737 783 841 888 903 862 Energy Intensity 560 516 480 499 469 453 429 Petroleum Intensity 643 462 410 407 369 339 297 Electric Power sectorElectricity Capacity Diversity 725 672 764 765 769 765 756 Non-Carbon Generation 676 231 160 110 132 153 127 transportation sectorTransport Energy per Capita 682 664 792 864 927 875 773 Transport Energy Intensity 504 464 485 513 490 439 385 EnvironmentalCO2 Emissions Trend 1,000 812 752 762 822 847 824 CO2 per Capita 713 565 509 503 530 531 501 CO2 GDP Intensity 527 395 312 298 280 266 249
Total Index 1,236 1,001 931 827 849 913 1,028

www.energyxxi.org 93
international index of Energy security Risk
international Energy security Risk index scores: germanyMetric 1980 1985 1990 1995 2000 2005 2010
global FuelsGlobal Oil Reserves 1,000 1,045 1,243 1,313 1,280 871 883 Global Oil Production 1,000 909 777 741 689 728 712 Global Gas Reserves 1,000 1,364 869 927 996 981 939 Global Gas Production 1,000 1,480 927 671 751 806 874 Global Coal Reserves 1,000 1,071 665 570 563 632 730 Global Coal Production 1,000 1,049 795 826 623 975 1,129 Fuel importsOil Import Exposure 0 0 1,459 1,282 1,088 1,066 1,087 Gas Import Exposure 0 0 0 3,533 3,069 2,766 2,505 Coal Import Exposure 0 0 0 555 1,090 1,270 1,371 Total Energy Import Exposure 0 0 917 1,453 1,425 1,619 1,751 Fossil Fuel Import Expenditure per GDP 1,467 812 984 1,009 652 948 927 Energy ExpendituresEnergy Expenditure Intensity 908 650 672 484 273 395 381 Energy Expenditures per Capita 1,086 917 1,091 829 512 762 777 Retail Electricity Prices 1,474 921 1,510 1,608 843 1,314 1,808 Crude Oil Prices 1,000 608 395 269 390 618 862 Price & Market VolatilityCrude Oil Price Volatility 1,000 489 508 214 873 837 2,617 Energy Expenditure Volatility 493 221 186 318 207 524 824 World Oil Refinery Usage 1,000 1,021 1,210 1,219 1,237 1,325 1,192 Energy Use intensityEnergy Consumption per Capita 935 902 946 860 848 853 839 Energy Intensity 782 639 583 502 451 443 412 Petroleum Intensity 742 539 494 429 374 347 308 Electric Power sectorElectricity Capacity Diversity 1,148 1,030 964 976 945 931 1,024 Non-Carbon Generation 1,150 1,086 1,056 937 899 901 836 transportation sectorTransport Energy per Capita 786 786 891 860 881 810 729 Transport Energy Intensity 657 556 549 502 469 420 358 EnvironmentalCO2 Emissions Trend 1,000 960 938 844 809 802 751 CO2 per Capita 1,058 982 1,003 859 819 810 759 CO2 GDP Intensity 885 696 618 501 436 420 372
Total Index 1,255 1,003 1,082 814 761 847 1,006

94 2012 Edition
institute for 21st Century Energy
international Energy security Risk index scores: indiaMetric 1980 1985 1990 1995 2000 2005 2010
global FuelsGlobal Oil Reserves 1,000 1,045 1,243 1,313 1,280 871 883 Global Oil Production 1,000 909 777 741 689 728 712 Global Gas Reserves 1,000 1,364 869 927 996 981 939 Global Gas Production 1,000 1,480 927 671 751 806 874 Global Coal Reserves 1,000 1,071 665 570 563 632 730 Global Coal Production 1,000 1,049 795 826 623 975 1,129 Fuel importsOil Import Exposure 1,380 602 664 787 742 786 789 Gas Import Exposure 0 0 0 0 0 564 550 Coal Import Exposure 22 97 169 269 455 655 881 Total Energy Import Exposure 799 315 380 456 554 745 858 Fossil Fuel Import Expenditure per GDP 1,436 540 573 371 665 1,046 1,052 Energy ExpendituresEnergy Expenditure Intensity 866 780 633 367 564 756 695 Energy Expenditures per Capita 15 16 15 10 19 33 42 Retail Electricity Prices 284 317 261 208 231 288 318 Crude Oil Prices 1,000 608 395 269 390 618 862 Price & Market VolatilityCrude Oil Price Volatility 1,000 489 508 214 873 837 2,617 Energy Expenditure Volatility 866 628 817 646 723 1,150 1,032 World Oil Refinery Usage 1,000 1,021 1,210 1,219 1,237 1,325 1,192 Energy Use intensityEnergy Consumption per Capita 29 38 46 61 65 73 97 Energy Intensity 1,681 1,914 1,910 2,164 1,918 1,664 1,609 Petroleum Intensity 1,141 1,235 1,208 1,271 1,293 1,090 948 Electric Power sectorElectricity Capacity Diversity 1,069 1,089 1,139 1,159 1,137 1,109 1,092 Non-Carbon Generation 839 982 1,036 1,149 1,189 1,164 1,217 transportation sectorTransport Energy per Capita 9 14 19 32 25 26 44 Transport Energy Intensity 507 679 809 1,132 742 585 726 EnvironmentalCO2 Emissions Trend 1,000 1,536 1,987 2,988 3,444 4,063 5,928 CO2 per Capita 34 46 54 75 79 85 116 CO2 GDP Intensity 1,954 2,335 2,261 2,654 2,304 1,941 1,924
Total Index 863 779 752 762 809 879 1,045

www.energyxxi.org 95
international index of Energy security Risk
international Energy security Risk index scores: indonesiaMetric 1980 1985 1990 1995 2000 2005 2010
global FuelsGlobal Oil Reserves 1,000 1,045 1,243 1,313 1,280 871 883 Global Oil Production 1,000 909 777 741 689 728 712 Global Gas Reserves 1,000 1,364 869 927 996 981 939 Global Gas Production 1,000 1,480 927 671 751 806 874 Global Coal Reserves 1,000 1,071 665 570 563 632 730 Global Coal Production 1,000 1,049 795 826 623 975 1,129 Fuel importsOil Import Exposure 0 0 0 0 0 226 344 Gas Import Exposure 0 0 0 0 0 0 0 Coal Import Exposure 0 0 0 0 0 0 0 Total Energy Import Exposure 0 0 0 0 0 271 253 Fossil Fuel Import Expenditure per GDP 0 0 0 0 0 260 520 Energy ExpendituresEnergy Expenditure Intensity 497 610 376 343 138 524 725 Energy Expenditures per Capita 16 24 18 22 8 37 64 Retail Electricity Prices 1,000 858 944 964 706 765 870 Crude Oil Prices 1,000 608 395 269 390 618 862 Price & Market VolatilityCrude Oil Price Volatility 1,000 489 508 214 873 837 2,617 Energy Expenditure Volatility 497 720 137 512 823 1,054 1,631 World Oil Refinery Usage 1,000 1,021 1,210 1,219 1,237 1,325 1,192 Energy Use intensityEnergy Consumption per Capita 38 45 62 80 89 101 130 Energy Intensity 1,173 1,152 1,324 1,278 1,475 1,409 1,464 Petroleum Intensity 1,751 1,484 1,585 1,348 1,664 1,632 1,058 Electric Power sectorElectricity Capacity Diversity 1,197 1,288 1,193 1,223 1,230 1,264 1,254 Non-Carbon Generation 1,184 1,206 1,176 1,176 1,196 1,232 1,228 transportation sectorTransport Energy per Capita 22 27 36 53 68 75 101 Transport Energy Intensity 690 688 765 844 1,117 1,045 1,143 EnvironmentalCO2 Emissions Trend 1,000 1,181 1,818 2,504 3,103 3,853 5,129 CO2 per Capita 45 48 67 85 98 114 143 CO2 GDP Intensity 1,392 1,223 1,436 1,356 1,615 1,594 1,609
Total Index 720 687 635 626 720 813 1,013

96 2012 Edition
institute for 21st Century Energy
international Energy security Risk index scores: italyMetric 1980 1985 1990 1995 2000 2005 2010
global FuelsGlobal Oil Reserves 1,000 1,045 1,243 1,313 1,280 871 883 Global Oil Production 1,000 909 777 741 689 728 712 Global Gas Reserves 1,000 1,364 869 927 996 981 939 Global Gas Production 1,000 1,480 927 671 751 806 874 Global Coal Reserves 1,000 1,071 665 570 563 632 730 Global Coal Production 1,000 1,049 795 826 623 975 1,129 Fuel importsOil Import Exposure 1,871 1,907 1,333 1,172 1,030 965 1,053 Gas Import Exposure 4,696 4,978 3,826 2,709 3,103 2,841 2,647 Coal Import Exposure 10,172 8,443 6,984 9,050 7,880 7,634 6,568 Total Energy Import Exposure 2,628 2,539 1,968 1,764 1,818 2,017 2,194 Fossil Fuel Import Expenditure per GDP 1,379 826 1,207 912 1,150 1,202 1,329 Energy ExpendituresEnergy Expenditure Intensity 501 328 520 400 483 506 515 Energy Expenditures per Capita 613 412 759 618 812 883 881 Retail Electricity Prices 1,128 991 1,444 1,341 947 1,222 1,465 Crude Oil Prices 1,000 608 395 269 390 618 862 Price & Market VolatilityCrude Oil Price Volatility 1,000 489 508 214 873 837 2,617 Energy Expenditure Volatility 253 330 619 501 395 1,175 903 World Oil Refinery Usage 1,000 1,021 1,210 1,219 1,237 1,325 1,192 Energy Use intensityEnergy Consumption per Capita 532 521 581 604 646 684 637 Energy Intensity 503 416 398 391 384 392 372 Petroleum Intensity 691 500 469 458 398 360 315 Electric Power sectorElectricity Capacity Diversity 1,061 1,123 1,186 1,216 1,229 1,222 1,229 Non-Carbon Generation 1,026 1,027 1,197 1,178 1,158 1,190 1,070 transportation sectorTransport Energy per Capita 564 628 765 821 865 898 799 Transport Energy Intensity 531 501 523 532 514 514 467 EnvironmentalCO2 Emissions Trend 1,000 984 1,117 1,160 1,204 1,269 1,108 CO2 per Capita 519 508 576 593 611 639 558 CO2 GDP Intensity 495 405 394 384 363 366 326
Total Index 1,382 1,065 1,013 956 979 1,060 1,159

www.energyxxi.org 97
international index of Energy security Risk
international Energy security Risk index scores: JapanMetric 1980 1985 1990 1995 2000 2005 2010
global FuelsGlobal Oil Reserves 1,000 1,045 1,243 1,313 1,280 871 883 Global Oil Production 1,000 909 777 741 689 728 712 Global Gas Reserves 1,000 1,364 869 927 996 981 939 Global Gas Production 1,000 1,480 927 671 751 806 874 Global Coal Reserves 1,000 1,071 665 570 563 632 730 Global Coal Production 1,000 1,049 795 826 623 975 1,129 Fuel importsOil Import Exposure 1,924 1,983 1,533 1,372 1,179 1,120 1,124 Gas Import Exposure 7,880 8,370 5,274 3,849 3,515 3,082 2,741 Coal Import Exposure 8,117 7,862 6,888 8,143 7,407 7,710 6,416 Total Energy Import Exposure 2,788 2,684 2,143 1,991 1,801 2,091 2,219 Fossil Fuel Import Expenditure per GDP 1,795 983 871 980 912 897 984 Energy ExpendituresEnergy Expenditure Intensity 651 356 321 359 333 331 360 Energy Expenditures per Capita 768 501 564 665 640 676 755 Retail Electricity Prices 1,720 1,420 1,630 2,134 1,496 1,168 1,293 Crude Oil Prices 1,000 608 395 269 390 618 862 Price & Market VolatilityCrude Oil Price Volatility 1,000 489 508 214 873 837 2,617 Energy Expenditure Volatility 651 584 154 99 251 230 971 World Oil Refinery Usage 1,000 1,021 1,210 1,219 1,237 1,325 1,192 Energy Use intensityEnergy Consumption per Capita 636 635 742 817 865 868 833 Energy Intensity 539 452 423 440 449 425 398 Petroleum Intensity 750 544 511 510 471 426 347 Electric Power sectorElectricity Capacity Diversity 1,024 952 932 906 932 921 958 Non-Carbon Generation 1,001 888 925 871 846 892 900 transportation sectorTransport Energy per Capita 497 501 668 774 809 779 720 Transport Energy Intensity 422 356 380 417 420 381 344 EnvironmentalCO2 Emissions Trend 1,000 978 1,106 1,179 1,269 1,311 1,210 CO2 per Capita 639 604 668 701 747 767 712 CO2 GDP Intensity 542 429 380 378 388 375 340
Total Index 1,301 1,164 992 987 972 980 1,119

98 2012 Edition
institute for 21st Century Energy
international Energy security Risk index scores: MexicoMetric 1980 1985 1990 1995 2000 2005 2010
global FuelsGlobal Oil Reserves 1,000 1,045 1,243 1,313 1,280 871 883 Global Oil Production 1,000 909 777 741 689 728 712 Global Gas Reserves 1,000 1,364 869 927 996 981 939 Global Gas Production 1,000 1,480 927 671 751 806 874 Global Coal Reserves 1,000 1,071 665 570 563 632 730 Global Coal Production 1,000 1,049 795 826 623 975 1,129 Fuel importsOil Import Exposure 0 0 0 0 0 0 0 Gas Import Exposure 0 0 104 224 253 627 595 Coal Import Exposure 2,034 1,250 296 976 1,675 3,140 2,895 Total Energy Import Exposure 17 16 15 38 60 208 276 Fossil Fuel Import Expenditure per GDP 2 2 2 4 11 74 67 Energy ExpendituresEnergy Expenditure Intensity 134 197 225 200 367 441 470 Energy Expenditures per Capita 51 74 84 73 161 201 220 Retail Electricity Prices 768 344 423 355 477 601 495 Crude Oil Prices 1,000 608 395 269 390 618 862 Price & Market VolatilityCrude Oil Price Volatility 1,000 489 508 214 873 837 2,617 Energy Expenditure Volatility 134 299 418 382 417 312 591 World Oil Refinery Usage 1,000 1,021 1,210 1,219 1,237 1,325 1,192 Energy Use intensityEnergy Consumption per Capita 266 281 271 278 312 313 313 Energy Intensity 700 753 729 760 711 685 668 Petroleum Intensity 1,017 1,073 1,057 1,076 982 910 847 Electric Power sectorElectricity Capacity Diversity 1,127 1,154 1,084 1,068 1,087 1,137 1,172 Non-Carbon Generation 1,037 1,009 1,054 1,013 1,076 1,139 988 transportation sectorTransport Energy per Capita 262 265 381 391 459 492 565 Transport Energy Intensity 687 709 1,027 1,069 1,047 1,077 1,206 EnvironmentalCO2 Emissions Trend 1,000 1,168 1,257 1,337 1,594 1,655 1,945 CO2 per Capita 277 288 280 273 302 295 327 CO2 GDP Intensity 727 771 755 745 688 646 699
Total Index 659 612 569 551 630 706 851
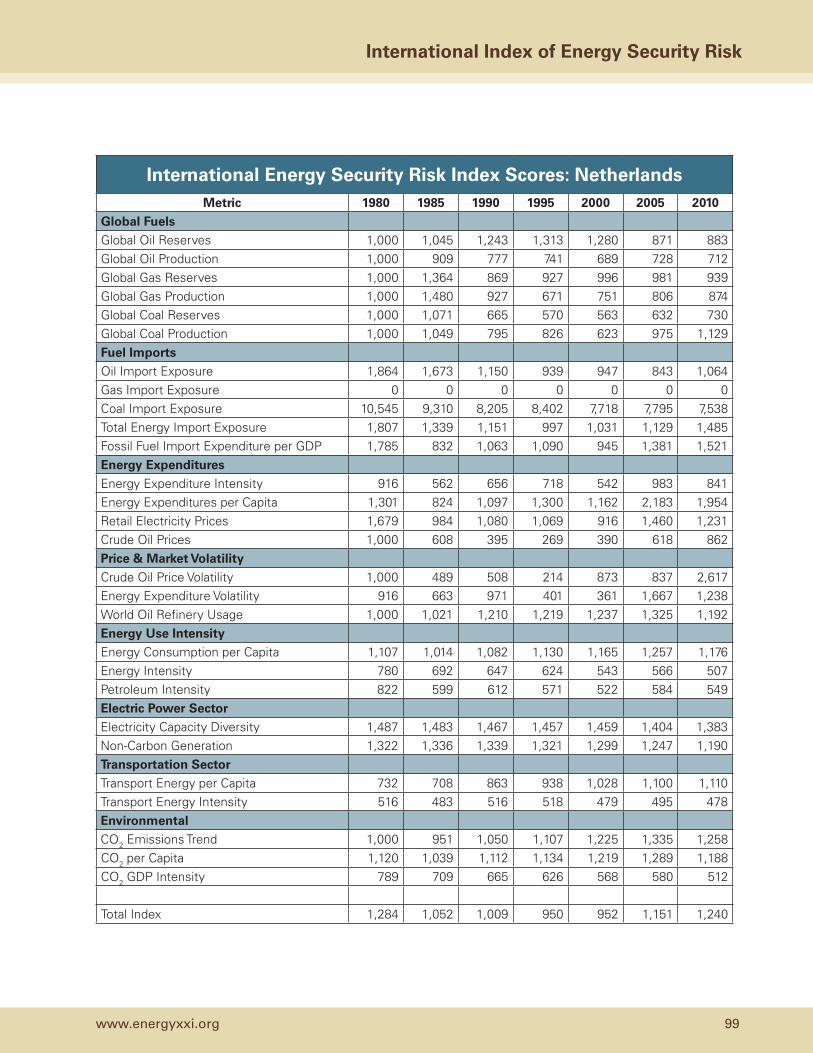
www.energyxxi.org 99
international index of Energy security Risk
international Energy security Risk index scores: netherlandsMetric 1980 1985 1990 1995 2000 2005 2010
global FuelsGlobal Oil Reserves 1,000 1,045 1,243 1,313 1,280 871 883 Global Oil Production 1,000 909 777 741 689 728 712 Global Gas Reserves 1,000 1,364 869 927 996 981 939 Global Gas Production 1,000 1,480 927 671 751 806 874 Global Coal Reserves 1,000 1,071 665 570 563 632 730 Global Coal Production 1,000 1,049 795 826 623 975 1,129 Fuel importsOil Import Exposure 1,864 1,673 1,150 939 947 843 1,064 Gas Import Exposure 0 0 0 0 0 0 0 Coal Import Exposure 10,545 9,310 8,205 8,402 7,718 7,795 7,538 Total Energy Import Exposure 1,807 1,339 1,151 997 1,031 1,129 1,485 Fossil Fuel Import Expenditure per GDP 1,785 832 1,063 1,090 945 1,381 1,521 Energy ExpendituresEnergy Expenditure Intensity 916 562 656 718 542 983 841 Energy Expenditures per Capita 1,301 824 1,097 1,300 1,162 2,183 1,954 Retail Electricity Prices 1,679 984 1,080 1,069 916 1,460 1,231 Crude Oil Prices 1,000 608 395 269 390 618 862 Price & Market VolatilityCrude Oil Price Volatility 1,000 489 508 214 873 837 2,617 Energy Expenditure Volatility 916 663 971 401 361 1,667 1,238 World Oil Refinery Usage 1,000 1,021 1,210 1,219 1,237 1,325 1,192 Energy Use intensityEnergy Consumption per Capita 1,107 1,014 1,082 1,130 1,165 1,257 1,176 Energy Intensity 780 692 647 624 543 566 507 Petroleum Intensity 822 599 612 571 522 584 549 Electric Power sectorElectricity Capacity Diversity 1,487 1,483 1,467 1,457 1,459 1,404 1,383 Non-Carbon Generation 1,322 1,336 1,339 1,321 1,299 1,247 1,190 transportation sectorTransport Energy per Capita 732 708 863 938 1,028 1,100 1,110 Transport Energy Intensity 516 483 516 518 479 495 478 EnvironmentalCO2 Emissions Trend 1,000 951 1,050 1,107 1,225 1,335 1,258 CO2 per Capita 1,120 1,039 1,112 1,134 1,219 1,289 1,188 CO2 GDP Intensity 789 709 665 626 568 580 512
Total Index 1,284 1,052 1,009 950 952 1,151 1,240

100 2012 Edition
institute for 21st Century Energy
international Energy security Risk index scores: new ZealandMetric 1980 1985 1990 1995 2000 2005 2010
global FuelsGlobal Oil Reserves 1,000 1,045 1,243 1,313 1,280 871 883 Global Oil Production 1,000 909 777 741 689 728 712 Global Gas Reserves 1,000 1,364 869 927 996 981 939 Global Gas Production 1,000 1,480 927 671 751 806 874 Global Coal Reserves 1,000 1,071 665 570 563 632 730 Global Coal Production 1,000 1,049 795 826 623 975 1,129 Fuel importsOil Import Exposure 1,747 1,437 738 848 788 860 668 Gas Import Exposure 0 51 0 0 0 0 0 Coal Import Exposure 0 0 0 0 0 0 0 Total Energy Import Exposure 1,128 646 370 483 496 671 501 Fossil Fuel Import Expenditure per GDP 1,125 524 380 430 340 616 556 Energy ExpendituresEnergy Expenditure Intensity 471 318 385 352 253 393 448 Energy Expenditures per Capita 464 356 443 436 349 619 717 Retail Electricity Prices 491 269 504 618 420 841 1,011 Crude Oil Prices 1,000 608 395 269 390 618 862 Price & Market VolatilityCrude Oil Price Volatility 1,000 489 508 214 873 837 2,617 Energy Expenditure Volatility 471 425 740 301 421 632 1,048 World Oil Refinery Usage 1,000 1,021 1,210 1,219 1,237 1,325 1,192 Energy Use intensityEnergy Consumption per Capita 787 863 1,043 1,076 1,090 1,057 1,031 Energy Intensity 800 772 906 868 789 672 645 Petroleum Intensity 609 460 557 564 522 507 474 Electric Power sectorElectricity Capacity Diversity 1,631 1,441 1,535 1,614 1,452 1,455 1,454 Non-Carbon Generation 133 327 283 236 394 496 536 transportation sectorTransport Energy per Capita 1,094 1,073 1,335 1,481 1,516 1,748 1,424 Transport Energy Intensity 1,112 959 1,160 1,196 1,097 1,111 890 EnvironmentalCO2 Emissions Trend 1,000 1,151 1,438 1,555 1,744 2,010 1,994 CO2 per Capita 498 547 665 674 724 784 741 CO2 GDP Intensity 507 489 578 544 524 499 463
Total Index 869 740 735 705 723 822 941

www.energyxxi.org 101
international index of Energy security Risk
international Energy security Risk index scores: norwayMetric 1980 1985 1990 1995 2000 2005 2010
global FuelsGlobal Oil Reserves 1,000 1,045 1,243 1,313 1,280 871 883 Global Oil Production 1,000 909 777 741 689 728 712 Global Gas Reserves 1,000 1,364 869 927 996 981 939 Global Gas Production 1,000 1,480 927 671 751 806 874 Global Coal Reserves 1,000 1,071 665 570 563 632 730 Global Coal Production 1,000 1,049 795 826 623 975 1,129 Fuel importsOil Import Exposure 0 0 0 0 0 0 0 Gas Import Exposure 0 0 0 0 0 0 0 Coal Import Exposure 8,503 7,007 5,921 7,186 4,193 0 0 Total Energy Import Exposure 65 65 35 45 21 0 0 Fossil Fuel Import Expenditure per GDP 29 15 5 4 2 0 0 Energy ExpendituresEnergy Expenditure Intensity 382 222 319 326 262 359 380 Energy Expenditures per Capita 833 540 833 1,006 923 1,346 1,446 Retail Electricity Prices 520 428 676 621 404 755 979 Crude Oil Prices 1,000 608 395 269 390 618 862 Price & Market VolatilityCrude Oil Price Volatility 1,000 489 508 214 873 837 2,617 Energy Expenditure Volatility 382 226 437 290 184 418 649 World Oil Refinery Usage 1,000 1,021 1,210 1,219 1,237 1,325 1,192 Energy Use intensityEnergy Consumption per Capita 1,603 1,820 1,970 2,000 2,130 2,093 1,996 Energy Intensity 736 749 755 648 605 558 524 Petroleum Intensity 468 407 375 322 279 262 249 Electric Power sectorElectricity Capacity Diversity 3,880 3,898 3,932 3,949 3,947 3,903 3,735 Non-Carbon Generation 2 5 3 4 4 5 0transportation sectorTransport Energy per Capita 1,027 1,280 1,518 1,573 1,523 1,575 1,202 Transport Energy Intensity 471 527 582 510 433 420 316 EnvironmentalCO2 Emissions Trend 1,000 1,011 1,036 1,128 1,229 1,253 1,177 CO2 per Capita 647 643 646 684 723 721 666 CO2 GDP Intensity 297 265 248 222 205 192 175
Total Index 997 924 904 886 845 823 940

102 2012 Edition
institute for 21st Century Energy
international Energy security Risk index scores: PolandMetric 1980 1985 1990 1995 2000 2005 2010
global FuelsGlobal Oil Reserves 1,000 1,045 1,243 1,313 1,280 871 883 Global Oil Production 1,000 909 777 741 689 728 712 Global Gas Reserves 1,000 1,364 869 927 996 981 939 Global Gas Production 1,000 1,480 927 671 751 806 874 Global Coal Reserves 1,000 1,071 665 570 563 632 730 Global Coal Production 1,000 1,049 795 826 623 975 1,129 Fuel importsOil Import Exposure 1,899 1,968 1,618 1,299 1,109 1,069 1,108 Gas Import Exposure 3,733 4,094 4,074 2,596 2,302 2,153 1,843 Coal Import Exposure 0 0 0 0 0 0 0 Total Energy Import Exposure 647 616 637 573 713 880 935 Fossil Fuel Import Expenditure per GDP 612 339 411 710 807 1,109 1,323 Energy ExpendituresEnergy Expenditure Intensity 413 296 306 604 486 634 768 Energy Expenditures per Capita 122 125 82 179 187 286 437 Retail Electricity Prices 332 153 95 491 458 748 997 Crude Oil Prices 1,000 608 395 269 390 618 862 Price & Market VolatilityCrude Oil Price Volatility 1,000 489 508 214 873 837 2,617 Energy Expenditure Volatility 326 146 123 445 404 586 1,847 World Oil Refinery Usage 1,000 1,021 1,210 1,219 1,237 1,325 1,192 Energy Use intensityEnergy Consumption per Capita 696 645 506 468 458 466 522 Energy Intensity 2,526 2,063 1,883 1,583 1,189 1,034 917 Petroleum Intensity 864 628 576 580 576 565 533 Electric Power sectorElectricity Capacity Diversity 1,523 1,530 1,519 1,528 1,520 1,512 1,484 Non-Carbon Generation 1,404 1,416 1,424 1,419 1,415 1,400 1,352 transportation sectorTransport Energy per Capita 212 198 182 212 284 357 550 Transport Energy Intensity 813 688 678 715 738 792 966 EnvironmentalCO2 Emissions Trend 1,000 984 778 718 682 671 692 CO2 per Capita 950 893 690 629 596 587 608 CO2 GDP Intensity 3,673 2,887 2,566 2,125 1,548 1,305 1,068
Total Index 1,429 1,210 821 781 778 839 1,061

www.energyxxi.org 103
international index of Energy security Risk
international Energy security Risk index scores: Russian FederationMetric 1980 1985 1990 1995 2000 2005 2010
global FuelsGlobal Oil Reserves NA NA NA 1,313 1,280 871 883 Global Oil Production NA NA NA 741 689 728 712 Global Gas Reserves NA NA NA 927 996 981 939 Global Gas Production NA NA NA 671 751 806 874 Global Coal Reserves NA NA NA 570 563 632 730 Global Coal Production NA NA NA 826 623 975 1,129 Fuel importsOil Import Exposure NA NA NA 0 0 0 0 Gas Import Exposure NA NA NA 0 0 0 0 Coal Import Exposure NA NA NA 0 0 0 0 Total Energy Import Exposure NA NA NA 0 0 0 0 Fossil Fuel Import Expenditure per GDP NA NA NA 0 0 0 0 Energy ExpendituresEnergy Expenditure Intensity NA NA NA 283 496 718 878 Energy Expenditures per Capita NA NA NA 57 110 220 324 Retail Electricity Prices NA NA NA 964 706 765 870 Crude Oil Prices NA NA NA 269 390 618 862 Price & Market VolatilityCrude Oil Price Volatility NA NA NA 214 873 837 2,617 Energy Expenditure Volatility NA NA NA 399 1,699 2,946 1,872 World Oil Refinery Usage NA NA NA 1,219 1,237 1,325 1,192 Energy Use intensityEnergy Consumption per Capita NA NA NA 919 906 1,010 1,021 Energy Intensity NA NA NA 4,560 4,104 3,304 2,769 Petroleum Intensity NA NA NA 2,072 1,658 1,330 1,089 Electric Power sectorElectricity Capacity Diversity NA NA NA 979 971 970 970 Non-Carbon Generation NA NA NA 961 939 936 1,015 transportation sectorTransport Energy per Capita NA NA NA 293 314 372 485 Transport Energy Intensity NA NA NA 1,455 1,420 1,218 1,317 EnvironmentalCO2 Emissions Trend NA NA NA 872 847 899 881 CO2 per Capita NA NA NA 850 835 912 915 CO2 GDP Intensity NA NA NA 4,219 3,783 2,983 2,481
Total Index NA NA NA 969 1,015 1,031 1,072

104 2012 Edition
institute for 21st Century Energy
international Energy security Risk index scores: south AfricaMetric 1980 1985 1990 1995 2000 2005 2010
global FuelsGlobal Oil Reserves 1,000 1,045 1,243 1,313 1,280 871 883 Global Oil Production 1,000 909 777 741 689 728 712 Global Gas Reserves 1,000 1,364 869 927 996 981 939 Global Gas Production 1,000 1,480 927 671 751 806 874 Global Coal Reserves 1,000 1,071 665 570 563 632 730 Global Coal Production 1,000 1,049 795 826 623 975 1,129 Fuel importsOil Import Exposure 1,939 2,004 1,275 827 661 692 726 Gas Import Exposure 0 0 0 0 0 0 2,215 Coal Import Exposure 0 0 0 0 0 0 0 Total Energy Import Exposure 803 635 472 317 269 320 376 Fossil Fuel Import Expenditure per GDP 2,994 1,155 856 594 527 806 1,164 Energy ExpendituresEnergy Expenditure Intensity 1,152 460 449 439 397 553 727 Energy Expenditures per Capita 326 119 114 106 103 164 244 Retail Electricity Prices 806 379 517 396 279 377 367 Crude Oil Prices 1,000 608 395 269 390 618 862 Price & Market VolatilityCrude Oil Price Volatility 1,000 489 508 214 873 837 2,617 Energy Expenditure Volatility 1,152 1,031 625 341 303 1,038 1,832 World Oil Refinery Usage 1,000 1,021 1,210 1,219 1,237 1,325 1,192 Energy Use intensityEnergy Consumption per Capita 440 484 447 475 497 527 574 Energy Intensity 1,553 1,875 1,763 1,970 1,915 1,773 1,713 Petroleum Intensity 758 796 801 861 816 793 744 Electric Power sectorElectricity Capacity Diversity 1,523 1,302 1,374 1,392 1,424 1,410 1,426 Non-Carbon Generation 1,419 1,371 1,348 1,338 1,332 1,355 1,358 transportation sectorTransport Energy per Capita 279 269 292 312 318 350 370 Transport Energy Intensity 986 1,042 1,152 1,295 1,227 1,179 1,105 EnvironmentalCO2 Emissions Trend 1,000 1,285 1,268 1,478 1,642 1,840 1,973 CO2 per Capita 611 671 610 648 675 717 744 CO2 GDP Intensity 2,157 2,597 2,404 2,686 2,601 2,415 2,221
Total Index 1,091 930 816 765 785 865 1,100

www.energyxxi.org 105
international index of Energy security Risk
international Energy security Risk index scores: south koreaMetric 1980 1985 1990 1995 2000 2005 2010
global FuelsGlobal Oil Reserves 1,000 1,045 1,243 1,313 1,280 871 883 Global Oil Production 1,000 909 777 741 689 728 712 Global Gas Reserves 1,000 1,364 869 927 996 981 939 Global Gas Production 1,000 1,480 927 671 751 806 874 Global Coal Reserves 1,000 1,071 665 570 563 632 730 Global Coal Production 1,000 1,049 795 826 623 975 1,129 Fuel importsOil Import Exposure 1,939 2,037 1,532 1,346 1,231 1,086 1,127 Gas Import Exposure 6,835 9,637 5,902 4,283 3,838 3,208 2,898 Coal Import Exposure 1,994 4,082 4,089 8,806 7,214 7,154 6,428 Total Energy Import Exposure 2,366 2,228 1,919 2,158 1,954 2,040 2,402 Fossil Fuel Import Expenditure per GDP 3,292 1,747 1,157 2,050 1,973 2,287 2,549 Energy ExpendituresEnergy Expenditure Intensity 1,208 640 439 747 677 860 921 Energy Expenditures per Capita 295 213 220 518 560 864 1,099 Retail Electricity Prices 1,439 952 887 888 586 550 465 Crude Oil Prices 1,000 608 395 269 390 618 862 Price & Market VolatilityCrude Oil Price Volatility 1,000 489 508 214 873 837 2,617 Energy Expenditure Volatility 1,208 1,888 586 425 1,238 1,160 1,217 World Oil Refinery Usage 1,000 1,021 1,210 1,219 1,237 1,325 1,192 Energy Use intensityEnergy Consumption per Capita 225 276 438 689 817 939 1,056 Energy Intensity 923 831 874 994 988 934 885 Petroleum Intensity 1,203 849 1,017 1,338 1,148 946 807 Electric Power sectorElectricity Capacity Diversity 1,227 838 753 861 917 917 1,023 Non-Carbon Generation 1,238 945 665 936 815 874 922 transportation sectorTransport Energy per Capita 35 160 311 594 610 736 718 Transport Energy Intensity 143 483 621 857 737 733 602 EnvironmentalCO2 Emissions Trend 1,000 1,308 1,838 2,895 3,331 3,748 4,255 CO2 per Capita 272 333 445 666 738 810 908 CO2 GDP Intensity 1,116 1,002 888 961 892 806 761
Total Index 1,393 1,396 974 1,155 1,168 1,210 1,361

106 2012 Edition
institute for 21st Century Energy
international Energy security Risk index scores: spainMetric 1980 1985 1990 1995 2000 2005 2010
global FuelsGlobal Oil Reserves 1,000 1,045 1,243 1,313 1,280 871 883 Global Oil Production 1,000 909 777 741 689 728 712 Global Gas Reserves 1,000 1,364 869 927 996 981 939 Global Gas Production 1,000 1,480 927 671 751 806 874 Global Coal Reserves 1,000 1,071 665 570 563 632 730 Global Coal Production 1,000 1,049 795 826 623 975 1,129 Fuel importsOil Import Exposure 1,914 1,911 1,411 1,383 1,157 1,127 1,127 Gas Import Exposure 8,621 7,896 4,427 4,187 3,887 3,484 2,900 Coal Import Exposure 2,174 1,648 1,731 2,911 3,519 4,255 4,269 Total Energy Import Exposure 2,471 1,879 1,541 1,791 1,676 2,000 1,881 Fossil Fuel Import Expenditure per GDP 1,271 726 729 835 741 1,283 1,249 Energy ExpendituresEnergy Expenditure Intensity 486 296 303 306 273 465 451 Energy Expenditures per Capita 404 257 321 345 369 686 653 Retail Electricity Prices 1,174 966 1,749 1,540 819 950 1,185 Crude Oil Prices 1,000 608 395 269 390 618 862 Price & Market VolatilityCrude Oil Price Volatility 1,000 489 508 214 873 837 2,617 Energy Expenditure Volatility 486 549 257 314 162 773 997 World Oil Refinery Usage 1,000 1,021 1,210 1,219 1,237 1,325 1,192 Energy Use intensityEnergy Consumption per Capita 397 423 487 530 666 727 656 Energy Intensity 476 487 460 469 492 493 453 Petroleum Intensity 661 535 505 551 544 519 446 Electric Power sectorElectricity Capacity Diversity 1,063 821 782 792 794 878 1,007 Non-Carbon Generation 984 759 664 735 800 935 841 transportation sectorTransport Energy per Capita 382 441 598 673 891 1,008 922 Transport Energy Intensity 459 508 564 596 658 683 637 EnvironmentalCO2 Emissions Trend 1,000 1,052 1,149 1,248 1,628 1,964 1,687 CO2 per Capita 410 419 449 482 616 690 557 CO2 GDP Intensity 492 483 424 427 455 468 385
Total Index 1,080 936 822 828 848 993 1,105

www.energyxxi.org 107
international index of Energy security Risk
international Energy security Risk index scores: thailandMetric 1980 1985 1990 1995 2000 2005 2010
global FuelsGlobal Oil Reserves 1,000 1,045 1,243 1,313 1,280 871 883 Global Oil Production 1,000 909 777 741 689 728 712 Global Gas Reserves 1,000 1,364 869 927 996 981 939 Global Gas Production 1,000 1,480 927 671 751 806 874 Global Coal Reserves 1,000 1,071 665 570 563 632 730 Global Coal Production 1,000 1,049 795 826 623 975 1,129 Fuel importsOil Import Exposure 1,928 1,532 1,304 1,257 950 777 692 Gas Import Exposure 0 0 0 0 255 913 571 Coal Import Exposure 360 508 246 1,000 1,468 2,223 3,064 Total Energy Import Exposure 3,086 1,596 1,490 1,580 1,209 1,279 1,235 Fossil Fuel Import Expenditure per GDP 3,597 1,409 1,394 1,680 1,408 1,807 3,501 Energy ExpendituresEnergy Expenditure Intensity 1,315 745 671 725 730 1,066 2,520 Energy Expenditures per Capita 67 45 62 94 92 166 450 Retail Electricity Prices 881 672 571 594 418 447 549 Crude Oil Prices 1,000 608 395 269 390 618 862 Price & Market VolatilityCrude Oil Price Volatility 1,000 489 508 214 873 837 2,617 Energy Expenditure Volatility 1,315 1,102 419 276 1,263 1,478 5,428 World Oil Refinery Usage 1,000 1,021 1,210 1,219 1,237 1,325 1,192 Energy Use intensityEnergy Consumption per Capita 53 67 111 175 203 277 303 Energy Intensity 1,040 1,102 1,206 1,345 1,605 1,778 1,697 Petroleum Intensity 1,956 1,506 1,667 1,841 1,923 1,925 1,602 Electric Power sectorElectricity Capacity Diversity 1,156 1,175 1,201 1,309 1,385 1,387 1,444 Non-Carbon Generation 1,301 1,206 1,272 1,298 1,317 1,333 1,328 transportation sectorTransport Energy per Capita 48 73 141 263 253 328 277 Transport Energy Intensity 943 1,203 1,531 2,018 2,001 2,106 1,552 EnvironmentalCO2 Emissions Trend 1,000 1,328 2,501 4,324 4,819 7,204 8,165 CO2 per Capita 56 68 120 194 205 294 322 CO2 GDP Intensity 1,108 1,128 1,301 1,488 1,622 1,890 1,804
Total Index 1,163 910 863 949 1,049 1,223 1,689

108 2012 Edition
institute for 21st Century Energy
international Energy security Risk index scores: turkeyMetric 1980 1985 1990 1995 2000 2005 2010
global FuelsGlobal Oil Reserves 1,000 1,045 1,243 1,313 1,280 871 883 Global Oil Production 1,000 909 777 741 689 728 712 Global Gas Reserves 1,000 1,364 869 927 996 981 939 Global Gas Production 1,000 1,480 927 671 751 806 874 Global Coal Reserves 1,000 1,071 665 570 563 632 730 Global Coal Production 1,000 1,049 795 826 623 975 1,129 Fuel importsOil Import Exposure 1,686 1,783 1,408 1,282 1,120 1,045 1,150 Gas Import Exposure 0 0 5,596 4,208 3,707 3,256 2,865 Coal Import Exposure 313 595 784 861 1,285 1,767 1,766 Total Energy Import Exposure 1,885 1,687 1,538 1,548 1,577 1,858 2,086 Fossil Fuel Import Expenditure per GDP 1,247 811 998 928 1,163 1,722 1,970 Energy ExpendituresEnergy Expenditure Intensity 586 389 470 420 486 718 795 Energy Expenditures per Capita 120 90 128 122 159 272 326 Retail Electricity Prices 918 421 467 599 590 730 1,025 Crude Oil Prices 1,000 608 395 269 390 618 862 Price & Market VolatilityCrude Oil Price Volatility 1,000 489 508 214 873 837 2,617 Energy Expenditure Volatility 586 670 806 816 554 871 1,665 World Oil Refinery Usage 1,000 1,021 1,210 1,219 1,237 1,325 1,192 Energy Use intensityEnergy Consumption per Capita 113 128 170 196 230 251 278 Energy Intensity 549 555 627 675 701 662 678 Petroleum Intensity 707 637 646 703 630 499 387 Electric Power sectorElectricity Capacity Diversity 1,135 1,138 1,135 1,164 1,132 1,140 1,121 Non-Carbon Generation 740 941 837 820 1,062 1,068 1,211 transportation sectorTransport Energy per Capita 107 118 169 205 197 199 220 Transport Energy Intensity 522 514 623 703 602 524 536 EnvironmentalCO2 Emissions Trend 1,000 1,357 1,888 2,233 2,944 3,366 3,977 CO2 per Capita 120 144 180 195 236 250 276 CO2 GDP Intensity 584 625 663 670 721 660 674
Total Index 809 734 829 787 843 936 1,154

www.energyxxi.org 109
international index of Energy security Risk
international Energy security Risk index scores: UkraineMetric 1980 1985 1990 1995 2000 2005 2010
global FuelsGlobal Oil Reserves NA NA NA 1,313 1,280 871 883 Global Oil Production NA NA NA 741 689 728 712 Global Gas Reserves NA NA NA 927 996 981 939 Global Gas Production NA NA NA 671 751 806 874 Global Coal Reserves NA NA NA 570 563 632 730 Global Coal Production NA NA NA 826 623 975 1,129 Fuel importsOil Import Exposure NA NA NA 1,118 793 823 754 Gas Import Exposure NA NA NA 3,409 2,950 2,608 1,857 Coal Import Exposure NA NA NA 1,358 371 450 890 Total Energy Import Exposure NA NA NA 1,197 1,129 1,279 956 Fossil Fuel Import Expenditure per GDP NA NA NA 8,577 6,189 7,337 5,377 Energy ExpendituresEnergy Expenditure Intensity NA NA NA 8,071 6,426 6,257 6,181 Energy Expenditures per Capita NA NA NA 593 447 658 708 Retail Electricity Prices NA NA NA 964 706 765 870 Crude Oil Prices NA NA NA 269 390 618 862 Price & Market VolatilityCrude Oil Price Volatility NA NA NA 214 873 837 2,617 Energy Expenditure Volatility NA NA NA 6,570 2,057 6,621 10,042 World Oil Refinery Usage NA NA NA 1,219 1,237 1,325 1,192 Energy Use intensityEnergy Consumption per Capita NA NA NA 659 573 663 603 Energy Intensity NA NA NA 8,975 8,248 6,299 5,267 Petroleum Intensity NA NA NA 2,683 1,592 1,486 1,282 Electric Power sectorElectricity Capacity Diversity NA NA NA 859 873 844 834 Non-Carbon Generation NA NA NA 834 697 652 673 transportation sectorTransport Energy per Capita NA NA NA 205 173 209 239 Transport Energy Intensity NA NA NA 2,787 2,493 1,986 2,087 EnvironmentalCO2 Emissions Trend NA NA NA 869 670 729 546 CO2 per Capita NA NA NA 648 522 593 459 CO2 GDP Intensity NA NA NA 8,823 7,514 5,636 4,007
Total Index NA NA NA 2,663 2,091 2,210 2,277

110 2012 Edition
institute for 21st Century Energy
international Energy security Risk index scores: United kingdomMetric 1980 1985 1990 1995 2000 2005 2010
global FuelsGlobal Oil Reserves 1,000 1,045 1,243 1,313 1,280 871 883 Global Oil Production 1,000 909 777 741 689 728 712 Global Gas Reserves 1,000 1,364 869 927 996 981 939 Global Gas Production 1,000 1,480 927 671 751 806 874 Global Coal Reserves 1,000 1,071 665 570 563 632 730 Global Coal Production 1,000 1,049 795 826 623 975 1,129 Fuel importsOil Import Exposure 57 0 0 0 0 0 162 Gas Import Exposure 1,920 2,083 738 38 0 256 1,177 Coal Import Exposure 181 825 873 1,845 2,900 5,488 3,249 Total Energy Import Exposure 204 356 167 108 111 401 809 Fossil Fuel Import Expenditure per GDP 92 59 43 19 19 60 231 Energy ExpendituresEnergy Expenditure Intensity 645 367 370 327 313 351 373 Energy Expenditures per Capita 780 492 575 544 606 752 792 Retail Electricity Prices 1,278 776 1,092 1,007 746 922 1,108 Crude Oil Prices 1,000 608 395 269 390 618 862 Price & Market VolatilityCrude Oil Price Volatility 1,000 489 508 214 873 837 2,617 Energy Expenditure Volatility 645 529 444 273 100 311 716 World Oil Refinery Usage 1,000 1,021 1,210 1,219 1,237 1,325 1,192 Energy Use intensityEnergy Consumption per Capita 764 751 786 790 800 798 706 Energy Intensity 632 561 506 475 413 372 332 Petroleum Intensity 526 443 413 389 320 292 255 Electric Power sectorElectricity Capacity Diversity 1,262 1,169 1,119 1,047 1,090 1,101 1,101 Non-Carbon Generation 1,239 1,136 1,106 1,010 1,067 1,067 1,211 transportation sectorTransport Energy per Capita 626 669 866 837 870 888 802 Transport Energy Intensity 518 499 557 503 449 414 378 EnvironmentalCO2 Emissions Trend 1,000 960 981 913 913 950 862 CO2 per Capita 855 817 822 755 743 756 666 CO2 GDP Intensity 707 610 529 454 383 353 314
Total Index 793 708 640 577 615 730 878

www.energyxxi.org 111
international index of Energy security Risk
international Energy security Risk index scores: United statesMetric 1980 1985 1990 1995 2000 2005 2010
global FuelsGlobal Oil Reserves 1,000 1,045 1,243 1,313 1,280 871 883 Global Oil Production 1,000 909 777 741 689 728 712 Global Gas Reserves 1,000 1,364 869 927 996 981 939 Global Gas Production 1,000 1,480 927 671 751 806 874 Global Coal Reserves 1,000 1,071 665 570 563 632 730 Global Coal Production 1,000 1,049 795 826 623 975 1,129 Fuel importsOil Import Exposure 715 580 616 582 595 636 570 Gas Import Exposure 206 423 449 520 580 551 316 Coal Import Exposure 0 0 0 0 0 0 0 Total Energy Import Exposure 586 431 482 487 569 676 551 Fossil Fuel Import Expenditure per GDP 513 289 279 239 318 458 409 Energy ExpendituresEnergy Expenditure Intensity 652 486 336 266 292 378 364 Energy Expenditures per Capita 958 799 618 519 663 922 883 Retail Electricity Prices 786 877 724 666 573 584 645 Crude Oil Prices 1,000 608 395 269 390 618 862 Price & Market VolatilityCrude Oil Price Volatility 1,000 489 508 214 873 837 2,617 Energy Expenditure Volatility 652 460 135 115 436 518 984 World Oil Refinery Usage 1,000 1,021 1,210 1,219 1,237 1,325 1,192 Energy Use intensityEnergy Consumption per Capita 1,679 1,584 1,664 1,684 1,728 1,669 1,579 Energy Intensity 1,144 963 905 863 760 684 650 Petroleum Intensity 1,065 837 771 711 640 600 530 Electric Power sectorElectricity Capacity Diversity 1,086 1,020 1,008 1,017 1,045 1,115 1,101 Non-Carbon Generation 1,099 1,041 993 981 1,016 1,029 991 transportation sectorTransport Energy per Capita 2,006 1,995 2,119 2,208 2,325 2,378 2,171 Transport Energy Intensity 1,366 1,213 1,153 1,132 1,023 974 894 EnvironmentalCO2 Emissions Trend 1,000 964 1,055 1,114 1,227 1,254 1,163 CO2 per Capita 1,656 1,524 1,591 1,574 1,636 1,596 1,410 CO2 GDP Intensity 1,128 927 865 807 720 654 581
Total Index 988 876 793 746 812 855 964
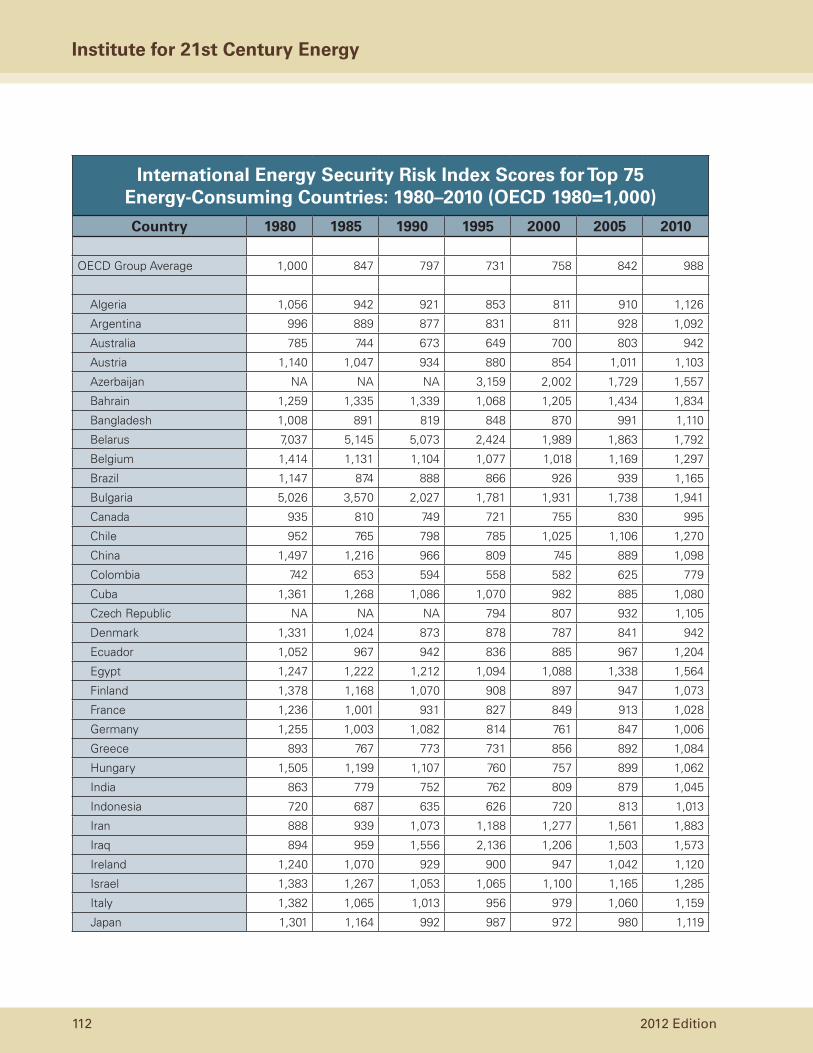
112 2012 Edition
institute for 21st Century Energy
international Energy security Risk index scores for top 75 Energy-Consuming Countries: 1980–2010 (oECD 1980=1,000)
Country 1980 1985 1990 1995 2000 2005 2010
OECD Group Average 1,000 847 797 731 758 842 988
Algeria 1,056 942 921 853 811 910 1,126
Argentina 996 889 877 831 811 928 1,092
Australia 785 744 673 649 700 803 942
Austria 1,140 1,047 934 880 854 1,011 1,103
Azerbaijan NA NA NA 3,159 2,002 1,729 1,557
Bahrain 1,259 1,335 1,339 1,068 1,205 1,434 1,834
Bangladesh 1,008 891 819 848 870 991 1,110
Belarus 7,037 5,145 5,073 2,424 1,989 1,863 1,792
Belgium 1,414 1,131 1,104 1,077 1,018 1,169 1,297
Brazil 1,147 874 888 866 926 939 1,165
Bulgaria 5,026 3,570 2,027 1,781 1,931 1,738 1,941
Canada 935 810 749 721 755 830 995
Chile 952 765 798 785 1,025 1,106 1,270
China 1,497 1,216 966 809 745 889 1,098
Colombia 742 653 594 558 582 625 779
Cuba 1,361 1,268 1,086 1,070 982 885 1,080
Czech Republic NA NA NA 794 807 932 1,105
Denmark 1,331 1,024 873 878 787 841 942
Ecuador 1,052 967 942 836 885 967 1,204
Egypt 1,247 1,222 1,212 1,094 1,088 1,338 1,564
Finland 1,378 1,168 1,070 908 897 947 1,073
France 1,236 1,001 931 827 849 913 1,028
Germany 1,255 1,003 1,082 814 761 847 1,006
Greece 893 767 773 731 856 892 1,084
Hungary 1,505 1,199 1,107 760 757 899 1,062
India 863 779 752 762 809 879 1,045
Indonesia 720 687 635 626 720 813 1,013
Iran 888 939 1,073 1,188 1,277 1,561 1,883
Iraq 894 959 1,556 2,136 1,206 1,503 1,573
Ireland 1,240 1,070 929 900 947 1,042 1,120
Israel 1,383 1,267 1,053 1,065 1,100 1,165 1,285
Italy 1,382 1,065 1,013 956 979 1,060 1,159
Japan 1,301 1,164 992 987 972 980 1,119

www.energyxxi.org 113
international index of Energy security Risk
international Energy security Risk index scores for top 75 Energy-Consuming Countries: 1980–2010 (oECD 1980=1,000)
Country 1980 1985 1990 1995 2000 2005 2010Kazakhstan NA NA NA 1,186 1,130 930 1,053
Kuwait 893 790 848 836 1,008 1,080 1,257
Libya 965 920 965 980 1,142 1,268 1,334
Malaysia 1,048 1,006 1,039 924 1,021 1,195 1,388
Mexico 659 612 569 551 630 706 851
Morocco 973 896 922 963 1,029 1,087 1,293
Netherlands 1,284 1,052 1,009 950 952 1,151 1,240
New Zealand 869 740 735 705 723 822 941
Nigeria 681 652 590 644 653 628 767
North Korea 1,717 1,548 2,099 1,323 1,349 1,250 1,985
Norway 997 924 904 886 845 823 940
Oman 1,012 959 991 823 989 1,237 1,534
Pakistan 1,027 955 906 892 969 1,052 1,365
Paraguay 2,955 2,466 2,333 1,609 1,831 1,686 1,773
Peru 848 699 640 702 754 780 875
Philippines 1,174 969 985 1,011 1,088 1,088 1,241
Poland 1,429 1,210 821 781 778 839 1,061
Portugal 1,134 1,233 1,122 1,147 987 1,128 1,231
Romania 1,801 942 1,063 761 763 890 932
Russia NA NA NA 969 1,015 1,031 1,072
Saudi Arabia 1,119 1,309 1,246 1,025 1,131 1,393 1,650
Serbia NA NA NA NA NA NA 1,538
Singapore 2,124 1,891 1,692 1,492 1,691 1,749 2,272
Slovakia NA NA NA 1,084 1,003 1,120 1,202
South Africa 1,091 930 816 765 785 865 1,100
South Korea 1,393 1,396 974 1,155 1,168 1,210 1,361
Spain 1,080 936 822 828 848 993 1,105
Sweden 1,436 1,155 964 914 912 958 1,074
Switzerland 1,423 1,071 979 908 955 886 1,030
Syria 1,412 1,422 1,758 1,242 1,395 1,352 1,511
Taiwan 1,340 1,141 1,064 1,114 1,146 1,175 1,622
Thailand 1,163 910 863 949 1,049 1,223 1,689
Trinidad and Tobago 981 1,183 978 1,056 1,077 1,425 1,899
Turkey 809 734 829 787 843 936 1,154
Turkmenistan NA NA NA 1,063 1,134 1,703 1,699

114 2012 Edition
institute for 21st Century Energy
international Energy security Risk index scores for top 75 Energy-Consuming Countries: 1980–2010 (oECD 1980=1,000)
Country 1980 1985 1990 1995 2000 2005 2010Ukraine NA NA NA 2,663 2,091 2,210 2,277
United Arab Emirates 883 1,261 1,297 1,250 1,145 1,204 1,514
United Kingdom 793 708 640 577 615 730 878
United States 988 876 793 746 812 855 964
Uzbekistan NA NA NA 3,475 2,912 2,907 3,136
Venezuela 974 947 701 677 762 789 958
Vietnam 861 810 673 758 776 1,047 1,526

www.energyxxi.org 115
international index of Energy security Risk
The Energy Institute relied primarily on government data from the Energy Information Administration (EIA) and the International Energy Agency (IEA) to develop its International Index of Energy Security Risk. Where historical data from government sources were not available, other widely-used and respected sources were employed. The following provides a list of the main sources of the data used to compile the metrics.
british Petroleum: BP Statistical Review of World Energy. Available at: http://www.bp.com/sectionbodycopy.do?categoryId=7500&contentId=7068481. For refinery capacity and utilization data.
Energy information Administration:
International Energy Statistics. Available at: http://www.eia.doe.gov/countries/data.cfm. For historical international energy production, consumption, reserve, import, export, electricity capacity and generation, and other energy data.
Annual Energy Review. Available at: http://www.eia.doe.gov/emeu/aer/contents.html. For crude oil price data.
Freedom House: Freedom in the World: Comparative and Historical Data. Available at: http://www.freedomhouse.org/template.cfm?page=439. For historical international political rights and civil liberties data. Freedom House’s annual index of political rights and civil liberties was used as a proxy for reliability of international trading partners.
international Energy Agency: IEA Statistics, Energy Prices and Taxes. Available at: http://www.iea.org/stats/index.asp. Subscription required. For energy price and expenditure data.
World bank: Development Indicators. Available at: http://data.worldbank.org/indicator. For population, gross domestic product, net energy imports, and transport energy.
Appendix 3: Data sources

Institute for 21st Century EnergyU.S. Chamber of Commerce
1615 H Street, NWWashington, DC 20062
Phone: (202) 463-5558 Fax: (202) [email protected]
www.energyxxi.org