international journal of business, management and … 5.1.18/116-127 r.aruna.pdf · sector. private...
TRANSCRIPT

Page 116
RESEARCH ARTICLE Vol.5.Issue.1.2018 Jan-Mar
INTERNATIONAL JOURNAL OF BUSINESS, MANAGEMENT
AND ALLIED SCIENCES (IJBMAS)
A Peer Reviewed International Research Journal
PERFORMANCE OF PRODUCT INNOVATION AND DEVELOPMENT
TOWARDS POLICES AND PREMIUM UNDER WRITTEN BY LIFE
INSURERS
R.ARUNA1, Prof.B.K.SURYA PRAKASH RAO 2 1Research scholar, Reg. No.pp.MAN.0440, Department of Management, Rayalseema
University Kurnool-518007,AP, India. [email protected] 2Research Supervisor, HOD, Department of Management sciences, RVR & JC college of
Engineering, Chowdavaram, Guntur-522019,AP,India. bksp_ [email protected]
ABSTRACT
Indian Life Insurance sector is one of the fastest growing sectors in India. It has
given a platform for economic growth and development. After Liberalization, the
Insurance industry has opened to the private players. With many players in
business, the Insurance Regulatory and Development Authority came with
innovative and constructive guidelines for both product innovation and services.
Insurance is one of the demanding financial products in India. It is a social
security tool in developing the nation. It's basic objective is to protect the family of
any uncertainty in life. Change is the watch world for the Insurance sector.
Insurance is an essential service to make life meaningful and worth living .Hence
the emerging needs, consumer education and privatization brought lot of changes
and challenges for the public life insurance in India .Life Insurance Company has
succeeded in meeting the challenges and has maintained their leading position in
life insurance industry due to its innovative practices.
This paper provides the overview of life insurance sector in India and analyses the
performance of the product innovation and development towards premium and
polices underwritten by life Insurers.
KEY WORDS: Growth and Market share of Premiums, IRDA, Life Insurers, New
polices, Product innovation and Development.
I. Introduction
Insurance is a social security tool in developing nation. Future is full of uncertainty.
Insurance basic motto is to protect the family of any uncertainty in life. So it is a long term investment
and knowledge about that.
In the post liberalization era, insurance has attracted by many private players. Customer
needs expectations and aspirations towards insurance products and are also more demanding in
nature. The insurance products act more as an umbrella for protection than as a financial instrument
for saving and tax planning. With more and more customers demanding innovative insurance

R.ARUNA & B.K.SURYA PRAKASH RAO ISSN:2349-4638 Vol.5. Issue.1.2018 (Jan-Mar)
Int.J.Buss.Mang.& Allied.Sci. (ISSN:2349-4638) 117
solutions to their problems, insurers have been competing with one another. The insurance industry
faces a healthy competition which really benefits the public. The public sector has improved its
product varieties and designed attractive schemes to compete with the private sector. Private players
also seem to be slowly but steadily increasing their competitive strength on par with the public sector.
PRODUCT INNOVATION AND DEVELOPMENT
Developing new products is a continuous process. The potential for new product
development is very vast in life insurance portfolio. The product innovation and development needs
a new vision, a new approach and a new strategy. This makes it essential that the insurance
companies must assign due weightage to the development of services and schemes which cater to the
changing needs and requirements of the customers. Public and private players have to work together
to ensure healthy growth and development of the insurance sector. Life insurance cover is needed by
individuals for various purposes.
PRODUCTS – AND ITS CATEGORISATION:
An insurance product is a more visible component which creates a main link between an
insurance company and its customers.
Term Insurance: A term insurance plan allows a customer to have an affordable life cover protection.
It is a pure risk cover and does not carry any separate cash value. Upon the death of the policyholder,
the insurance company will pay the sum assured to the beneficiary. In the event of survival, the
policy will not carry any maturity value.
Whole Life Insurance: In the whole life insurance policy, the risk covered is for the entire life of the
policyholder and the policy money and the bonus so accumulated are payable to the nominee or the
beneficiary only on the death of the policyholder. The new whole-life policy has gone a step further
and the customer gets a small sum of money at regular intervals while the policy runs its course.
Endowment Insurance: An endowment policy covers a fixed number of years. The designated
beneficiary gets the death benefit equal to the policy amount if the insured dies within the period
covered. If the insured survives at the end of this period, he is paid the policy amount. An
endowment policy covers risk for a specified period and at the end of which the sum assured is paid
back to the policyholder, usually with accumulated amount of bonus.
Money-Back Insurance: A money-back plan is a slightly modified form of the endowment plan. This
plan makes partial payments periodically during the term and the remaining on the expiry of the
plan. The emphasis is more on savings in these plans. The focus is more on the benefits to be accrued
and received as opposed to the premium pay-outs.
Children’s Insurance: Children’s insurance plans are deferred assurance plans providing risk cover
on life of the child after it has attained 18 years of age. The low premium rate under these plans is a
great attraction. A parent can help his children to take a policy at a rate which is considerably lower
than that what they would be called upon to pay at the attaining of majority. These policies are taken
on the life of the child and not the life of the parent.
Annuity and Pension Insurance: In Annuity and pension insurance plans, the insured agrees to pay
a series of premiums to the insurer and in return the insurer agrees to pay a specified sum to the
beneficiaries. A pension is also an annuity provided by an employer to the employees or their
dependents in consideration of the services rendered.
Key Man Insurance: Key man insurance is a new innovative concept in insurance business. It is a life
insurance policy taken by a business organization on the life of an important employee to protect the
business organization against any financial loss which may occur due to premature death of
employee while in service.
Loan Cover Insurance: The life insurance companies also offer a loan cover assurance policy that
aims to protect financially a borrower’s family if the loanee fails to survive the loan’s duration.
High Net worth Individuals’ (HNI) Insurance: Another sector which holds high potential but mostly
underinsured is the High Net worth Individuals sector. During the last few years, this sector has
grown rapidly. The number of individuals drawing significant amount of salaries is also increasing.
R.ARUNA & B.K.SURYA PRAKASH RAO ISSN:2349-4638 Vol.5. Issue.1.2018 (Jan-Mar)
Int.J.Buss.Mang.& Allied.Sci. (ISSN:2349-4638) 118
The insurers have brought some plans for these people. LIC has issued Jeevan Pramukh whereas
other insurers have different comparable plans to capture this segment. Mostly high premium and
high sum assured policies are sold under this category.
Housewives’ Insurance: Targeting the housewife segment can also be an intelligent strategy of the
life insurers. Insurance cover can be packaged as a gift to someone you love and care for. The middle
and high income group can definitely be brought into the net. There can be other niches as well that
can be carved out in this category.
Universal Life Insurance: Universal life policies are the products with features of both traditional and
unit-linked plans. Under these polices, the policyholders have the choice to change their premiums,
the term or the sum assured. The IRDA guidelines have classified all universal life policies as variable
insurance products (VIPs). Consequently, all VIPs will only be offered under non unit-linked
platform implying that they will now come under traditional plans.
Unit-Linked Insurance: ULIPs are differently structured products and give many choices to the
policyholder. The bullish market and the increased levels of income of households and their saving
rates have created craze and popularity to the ULIPs.
Group Insurance: Group insurance products are emerging as a business segment with considerable
potential. The cost effectiveness, tax benefits and the increasing need for organizations to retain their
skilled manpower and provide financial security drive this business. Group plans are cost-effective as
the premiums are calculated for a group of people in the organization and it is bulk business.
Micro Insurance: Micro-insurance refers to the insurance of low-income people. Low-income
households are vulnerable to risks and economic uncertainties.
II.Review of literature
M.Selva Kumar and J Vimal Priyan (2012) concluded that LIC continues to dominate insurance
sector. Private sector insurance companies also tried to increase their market share. Life insurance has
today become a mainstay of any market economy since it offers plenty of scope for garnering large
sums of money for long periods of time. The study compared premium, policies and market shares of
companies.
Neelaveni (2012) evaluated the performance of five life insurance companies at the time period of
2002-03 in terms of various plans and policies on the basis of annual growth rate. The study
concluded that life insurance Company being the public sector, was lagging behind due to
competition faced by private insurers whereas private life insurance companies had performed well
in terms of financial aspects
Rajeshwari and Christy (2012) examined the performance of individual agents in the Indian life
insurance industry by studying a number of individual agents performing in the industry, individual
business underwritten in terms of premium and policies and their spread over; in the few Indian
states and union territories. The study showed that agents were abiding by the rules and regulations
of IRDA.
Sonal Nena (2013) in her study-“Performance Evaluation of Life Insurance Corporation (LIC) of
India” has tried to analyse growth and performance of LIC. She analysed the major source of income
(Premium Earned) of the LIC, as well as the significant heads of expenses of LIC to measure the
performance .This study has proved that LIC has been success in terms of creating value for its
policyholders. The performance evaluation also showed consistent increase in its business. During the
study period there was no major change in the performance of the LIC. So it was finally concluded
that performance remained unchanged and LIC has maintained the market value of their products.
Choudhuri (2014) analysed that the customers are very much conscious about their needs and
requirements towards insurance. Based on the several factors, customers are now selecting different
kinds of products in their life where their awareness about the several existing life insurance products
varies situation wise, culture wise, nation wise, sector wise, industry wise and obviously over times.
On the other hand, like any other company, Life Insurance Corporation of India (LICI) is adopting
various strategies to develop customers’ awareness about the various products as well as involving in

R.ARUNA & B.K.SURYA PRAKASH RAO ISSN:2349-4638 Vol.5. Issue.1.2018 (Jan-Mar)
Int.J.Buss.Mang.& Allied.Sci. (ISSN:2349-4638) 119
the fulfillment of various needs and requirements of the customers through their selection of different
life insurance policies available in the market. Observing present scenario of the LICI customers’
product awareness and their current transactional life insurance policies, in this study the
investigation of customers’ product awareness and transaction gap in Life Insurance Corporation of
India has been conducted in Burdwan district, West Bengal. In this study, accepted 221 usable
responses were considered as the sample size and statistical package SPSS 16 was used to perform the
analyses.
Mouna Zerriaa and Hedi Noubbigh (2015) in their research paper, “Determinants of Life Insurance
Demand in the MENA Region” have tried to investigate the determinants of life insurance
consumption in the Middle East and North Africa (MENA) region using a sample of 17 countries over
the period 2000- 2012.They have used two measures of life insurance demand: insurance density and
insurance penetration. This research states that consumption increases with income, interest rates and
inflation and also it highlights that country’s level of financial development, life expectancy and
educational attainment stimulates life insurance demand in a nation.
III. Objectives of the study
1) To evaluate the performance of life insurers
2) To study the product innovation and development of life insurers
3) To examine the growth and market share of new policies issued by life insurers during
the study period 2000-2016.
4) To analyze the growth and market share of premiums underwritten by life insurers
during the study period
IV. Research Methodology
Collection of data: The study based on secondary data collected from the various published
records of IRDA
Annual reports, insurance journals, books etc.
Tools of analysis: The collected data recorded, analyzed and interpreted in the significant
manner with the
help of MEAN and STANDARD DEVATION.
Period of study: The data was collected during the period 2000-2016.
V. Data Analysis
Table 1 presents the information regarding the market share of the insurers in the total
number of new policies issued by them during the years 2000-01 to 2015-16. It shows that the life
insurance industry issued a total number of 267.39 crore new policies during 2015-16, of which LIC
issued 205.47 crore policies and private players 61.92 crore policies. While LIC registered a decrease in
policies by 1.86 percent in 2015-16 over, the private players experienced an increasing rate of 7.92 per
cent. A significant decline in LIC business and also an impact of global recession and economic
meltdown on insurance business. Due to the unfavorable business conditions during the study
period.
TABLE 1: GROWTH AND MARKET SHARE OF NEW POLICES ISSUED BY LIFE INSURERS
DURING 2000 TO 2016 (in corers)
YEAR LIC PRIVATE SECTOR TOTAL
NUMBER % NUMBER % AMOUNT %
2000-01 196.57 66.66% 98.33 33.34% 294.9 100
2001-02 224.91(14.42) 22.66% 767.54(7.71) 77.34% 992.45(18.26) 100
2002-03 245.46(9.13 22.93% 825.09(7.50) 77.07% 1070.55(9.08) 100
2003-04 269.68(9.17) 61.92% 165.88(101.05) 38.08% 435.56(12.83) 100
2004-05 239.78(-11.09) 51.78% 223.31(34.62) 48.22% 463.09(-8.44) 100
2005-06 315.91(31.75) 44.93% 387.14(73.37) 55.07% 703.05(35.29) 100
R.ARUNA & B.K.SURYA PRAKASH RAO ISSN:2349-4638 Vol.5. Issue.1.2018 (Jan-Mar)
Int.J.Buss.Mang.& Allied.Sci. (ISSN:2349-4638) 120
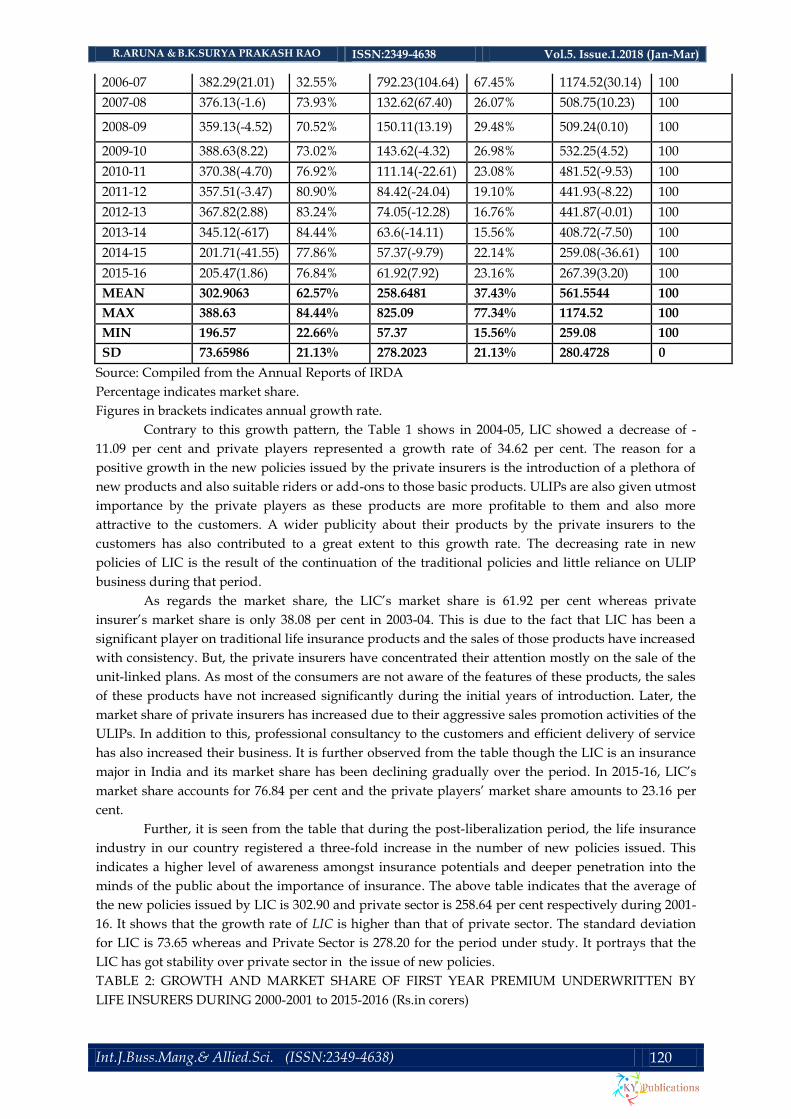
2006-07 382.29(21.01) 32.55% 792.23(104.64) 67.45% 1174.52(30.14) 100
2007-08 376.13(-1.6) 73.93% 132.62(67.40) 26.07% 508.75(10.23) 100
2008-09 359.13(-4.52) 70.52% 150.11(13.19) 29.48% 509.24(0.10) 100
2009-10 388.63(8.22) 73.02% 143.62(-4.32) 26.98% 532.25(4.52) 100
2010-11 370.38(-4.70) 76.92% 111.14(-22.61) 23.08% 481.52(-9.53) 100
2011-12 357.51(-3.47) 80.90% 84.42(-24.04) 19.10% 441.93(-8.22) 100
2012-13 367.82(2.88) 83.24% 74.05(-12.28) 16.76% 441.87(-0.01) 100
2013-14 345.12(-617) 84.44% 63.6(-14.11) 15.56% 408.72(-7.50) 100
2014-15 201.71(-41.55) 77.86% 57.37(-9.79) 22.14% 259.08(-36.61) 100
2015-16 205.47(1.86) 76.84% 61.92(7.92) 23.16% 267.39(3.20) 100
MEAN 302.9063 62.57% 258.6481 37.43% 561.5544 100
MAX 388.63 84.44% 825.09 77.34% 1174.52 100
MIN 196.57 22.66% 57.37 15.56% 259.08 100
SD 73.65986 21.13% 278.2023 21.13% 280.4728 0
Source: Compiled from the Annual Reports of IRDA
Percentage indicates market share.
Figures in brackets indicates annual growth rate.
Contrary to this growth pattern, the Table 1 shows in 2004-05, LIC showed a decrease of -
11.09 per cent and private players represented a growth rate of 34.62 per cent. The reason for a
positive growth in the new policies issued by the private insurers is the introduction of a plethora of
new products and also suitable riders or add-ons to those basic products. ULIPs are also given utmost
importance by the private players as these products are more profitable to them and also more
attractive to the customers. A wider publicity about their products by the private insurers to the
customers has also contributed to a great extent to this growth rate. The decreasing rate in new
policies of LIC is the result of the continuation of the traditional policies and little reliance on ULIP
business during that period.
As regards the market share, the LIC’s market share is 61.92 per cent whereas private
insurer’s market share is only 38.08 per cent in 2003-04. This is due to the fact that LIC has been a
significant player on traditional life insurance products and the sales of those products have increased
with consistency. But, the private insurers have concentrated their attention mostly on the sale of the
unit-linked plans. As most of the consumers are not aware of the features of these products, the sales
of these products have not increased significantly during the initial years of introduction. Later, the
market share of private insurers has increased due to their aggressive sales promotion activities of the
ULIPs. In addition to this, professional consultancy to the customers and efficient delivery of service
has also increased their business. It is further observed from the table though the LIC is an insurance
major in India and its market share has been declining gradually over the period. In 2015-16, LIC’s
market share accounts for 76.84 per cent and the private players’ market share amounts to 23.16 per
cent.
Further, it is seen from the table that during the post-liberalization period, the life insurance
industry in our country registered a three-fold increase in the number of new policies issued. This
indicates a higher level of awareness amongst insurance potentials and deeper penetration into the
minds of the public about the importance of insurance. The above table indicates that the average of
the new policies issued by LIC is 302.90 and private sector is 258.64 per cent respectively during 2001-
16. It shows that the growth rate of LIC is higher than that of private sector. The standard deviation
for LIC is 73.65 whereas and Private Sector is 278.20 for the period under study. It portrays that the
LIC has got stability over private sector in the issue of new policies.
TABLE 2: GROWTH AND MARKET SHARE OF FIRST YEAR PREMIUM UNDERWRITTEN BY
LIFE INSURERS DURING 2000-2001 to 2015-2016 (Rs.in corers)

R.ARUNA & B.K.SURYA PRAKASH RAO ISSN:2349-4638 Vol.5. Issue.1.2018 (Jan-Mar)
Int.J.Buss.Mang.& Allied.Sci. (ISSN:2349-4638) 121
YEAR
LIC PRIVATE SECTOR TOTAL
AMOUNT % AMOUNT % AMOUNT %
2000-01 9700.98 99.93 6.45 0.07 9707.43 100
2001-02 19588.77(101.93) 98.65 268.51(4062.95) 1.35 19857.2(104.56) 100
2002-03 15976.76(-8.44) 94.3 965.69(259.65) 5.7 16942.45(-14.68) 100
2003-04 17374.62(8.58) 87.67 2440.71(152.74) 12.33 19788.33(16.80) 100
2004-05 20653.06(19.05) 78.78 5564.57(127.99) 21.22 26217.63(32.49) 100
2005-06 28515.87(38.07) 73.52 10269.67(84.55) 26.48 38785.54(47.94) 100
2006-07 56223.56(97.17) 74.32 19425.65(89.16) 25.68 75649.21(95.04) 100
2007-08 59996.57(6.71) 64.02 33715.95(73.56) 35.98 93712.52(23.88) 100
2008-09 53179.08(-11.36) 60.89 34152(1.29) 39.11 87331.08(-6.81) 100
2009-10 71521.9(34.49) 65.08 38372.12(12.36) 34.92 109894.0(25.84) 100
2010-11 87012.35(21.66) 68.84 39385.84(2.64) 31.16 1263981.2(15.0) 100
2011-12 81862.25(-5.92) 71.85 32103.78(-18.4) 28.15 113966.03(-9.84) 100
2012-13 76611.5(-6.41) 71.36 30749.58(-4.22) 28.64 107361.08(-5.80) 100
2013-14 90808.79(18.53) 75.47 29516.43(-4.01) 24.53 120325.2(12.08) 100
2014-15 78507.72(13.55) 69.27 34820.23(17.97) 30.73 113329.52(-5.82) 100
2015-16 97891.5(24.69) 70.5 40970.8(17.66) 29.5 138862.3(22.53) 100
MEAN 54089.08 76.528125 22045.4988 23.47188 147231.93 100
MAXIMUM 97891.5 99.93 40970.8 39.11 1263981.2 100
MINIMUM 9700.98 60.89 6.45 0.07 9707.43 100
SD 30879.36392 12.498984 15647.6638 12.49898 311611.49 0
Source: Compiled from the Annual Reports of IRDA
Percentage indicates market share.
Figures in brackets indicates annual growth rate.
Table 2 shows that the on the growth rate and market share of new business/first year
premium underwritten by life insurers during the period, 2000-01 to 2015-16. It can be observed from
the table that during 2002-03, the first year premium of LIC shows a significant decline and registers
at -8.44 per cent. But, the private players have increased their first year premium by an annual growth
of 259.65 per cent. This is because the private players have succeeded in establishing themselves in
the insurance market through the adoption of intensive sales promotion methods. A small portion of
the LIC’s business has been taken over by the private players due to their intense sales campaign.
Despite private players’ positive growth in the first year premium, LIC’s first year premium has been
declined continuously during the period under study.
Afterwards, the private players have increased their premium collections marginally during
2014-015 when the total industry has shown a decrease of -5.82 per cent due to the presence of the
unfavorable Indian equity market conditions. As regards the market share, during 2014-15, the
market share of the LIC has been declined to 69.27 per cent and after increased marginally to 70.50 per
cent in 2015-16. Whereas the market share of the private players has 30.73 per cent in 2014-15 and
marginally declined to 29.50 per cent in 2015-16.The impact of economic downturn and the equity
meltdown in share market are the reasons for this decline in its market share.

R.ARUNA & B.K.SURYA PRAKASH RAO ISSN:2349-4638 Vol.5. Issue.1.2018 (Jan-Mar)
Int.J.Buss.Mang.& Allied.Sci. (ISSN:2349-4638) 122
On the whole, it may be observed that during the sixteen years period, the total first year
premium of the industry has been increased by around 10 times. As the first year premium is an
indicator of new business, during the post-liberalization period, all the life insurers have recorded, on
a satisfactory growth in their business. The above table specifies that the average value of the new
business premium of LIC is Rs 54089.08 and private sector is Rs.22045.49 during 2001-16. It indicates
that the growth rate of Private Sector is lower than that of LIC. But, the standard deviation for LIC is
30879.36 whereas Private Sector is 15647.66. The LIC is not having stability over the private sector
players.
It further states that with regard to the market share, the average amount of new business
premium collected by LIC is 76.53 and private sector is 23.47. It shows that the average amount of
new business premium of LIC is higher than that of Private Sector. The standard deviation of new
business premium for LIC is 12.49 whereas Private sector is12.49. It indicates that both the insurers
are maintaining stability in the collection of new business premium in life insurance.
TABLE 3: GROWTH AND MARKET SHARE OF RENEWAL PREMIUM UNDERWRITTEN BY LIFE
INSURERS DURING 2000-2001 to 2015-2016
(Rs.in.crores)
YEAR LIC PRIVATE SECTOR TOTAL
AMOUNT % AMOUNT % AMOUNT %
2000-01 27461.71 100 - - 27461.71 100
2001-02 30233.14(10.09) 99.99 4.03 0.01 30237.17(10.11) 100
2002-03 38651.73(27.85) 99.6 153.27(3705.7) 0.4 38805.1(28.34) 100
2003-04 46185.81(19.49) 98.55 679.62(343.12) 1.45 46865.43(20.77) 100
2004-05 54474.23(17.95) 96.18 2162.93(218.26) 3.82 56637.16(20.85) 100
2005-06 62276.35(14.32) 92.82 4813.87(122.56) 7.18 67090.22(18.46) 100
2006-07 71599.28(14.97) 89.02 8827.36(83.37) 10.98 80426.64(19.88) 100
2007-08 89793.42(25.41) 83.42 17845.4(102.16) 16.58 107638.89(33.83) 100
2008-09 104108.96(15.94) 77.43 30345.43(70.05) 22.57 134454.39(24.91) 100
2009-10 114555.41(10.03) 73.64 41000.94(35.11) 26.36 155556.35(15.69) 100
2010-11 116461.05(1.66) 70.48 48779.4(18.98) 29.52 165240.45(6.23) 100
2011-12 121027.03(3.92) 69.91 52102.91(6.81) 30.09 173129.94(4.77) 100
2012-13 132192.08(9.23) 73.5 47649.33(-8.55) 26.5 179841.41(3.88) 100
2013-14 146133.51(10.55) 75.34 47842.93(0.38) 24.66 193976.44(7.85) 100
2014-15 161159.94(10.28) 75.04 53613.26(12.06) 24.96 214773.2(10.72) 100
2015-16 168552.7(4.59) 73.9 59528.23(11.03) 26.1 228080.93(6.20) 100
MEAN 92804.147 83.30 27689.932 16.70 118763.46 100

R.ARUNA & B.K.SURYA PRAKASH RAO ISSN:2349-4638 Vol.5. Issue.1.2018 (Jan-Mar)
Int.J.Buss.Mang.& Allied.Sci. (ISSN:2349-4638) 123
MAX 168552.7 100 59528.23 30.09 228080.93 100
MIN 27461.71 69.91 4.03 0.01 27461.71 100
SD 46842.461 11.878054 23294.998 11.50603 69823.722 0
Source: Compiled from the Annual Reports of IRDA
Percentage indicates market share.
Figures in brackets indicates annual growth rate.
Table 3 refers that the growth rate and market share of renewal premium underwritten by
life insurers during 2000-01 to 2015-16. The renewal premium is a function of new business
underwritten in the previous year. The renewal premium underwritten by the private insurers has
remarkably increased during 2002-03 and 2007-2008. It shows their performance in creating and
nurturing new markets and also makes the new customers attracted to their products. These players
have also explored new business opportunities during this period. There is a consistent increase in the
growth rates of their renewal premium collection during the remaining period also. LIC, during this
period registers a volatile growth rate. However, it shows an increase in the absolute amount of
renewal premium.
The Table further shows that the market share of the LIC in the total renewal premium has
been declined from 100 per cent in 2000-01 to 73.90 per cent in 2015-16 whereas the private players’
market share has increased from 0.01 per cent to 26.10 per cent during the period. The reduced
market share with regard to LIC indicates clearly the higher amount of policy lapses due to heavy
termination of agents and lack of proper follow-up by the existing agents. The positive growth with
regard to private players is a testimony to the number of measures taken by them to reduce policy
lapses. Further, the private players have done business mostly on ULIPs and hence early withdrawal
of these plans has proved expensive to the customers. As a result, the policy lapses have decreased
and the persistency ratio has increased.
The above analysis shows the average .of renewal premium underwritten by LIC which is
Rs.92804.14 crore and Private Sector Rs. 27689.93 crore respectively. It shows that the average of
Private Sector is lower than that of LIC. The Standard Deviation for LIC is 46842.46 whereas the
private sector is 23294.99. It shows that the LIC is maintaining less stability over the Private Sector.
It further states that the market share of the LIC with regard to the average renewal premium
underwritten is 83.30 percent and the Private Sector is 16.70 percent. It visualizes that the average
amount of renewal premium of LIC is higher than the Private Sector. The standard deviation of
renewal premium with regard to the market share for LIC is 11.87, whereas private sector is 11.50
during 2001-16. But, the Private Sector insurers have got lower stability.
TABLE 4: GROWTH AND MARKET SHARE OF TOTAL PREMIUM UNDERWRITTEN BY LIFE
INSURERS DURING 2000-2001 to 2015-2016
(Rs.in. corers)
YEAR
LIC PRIVATE SECTOR TOTAL
AMOUNT % AMOUNT % AMOUNT %
2000-01 34892.02 99.98 6.45 0.02 34898.47 100
2001-02 49821.91(42.79) 99.46 272.5(4125.58) 0.54 50094.46(43.54) 100
2002-03 54628.49(9.65) 97.99 1119.0(310.59) 2.01 55747.55(11.28) 100
2003-04 63533.43(16.30) 95.32 3120.33(178.8) 4.68 66653.75(19.56) 100
R.ARUNA & B.K.SURYA PRAKASH RAO ISSN:2349-4638 Vol.5. Issue.1.2018 (Jan-Mar)
Int.J.Buss.Mang.& Allied.Sci. (ISSN:2349-4638) 124
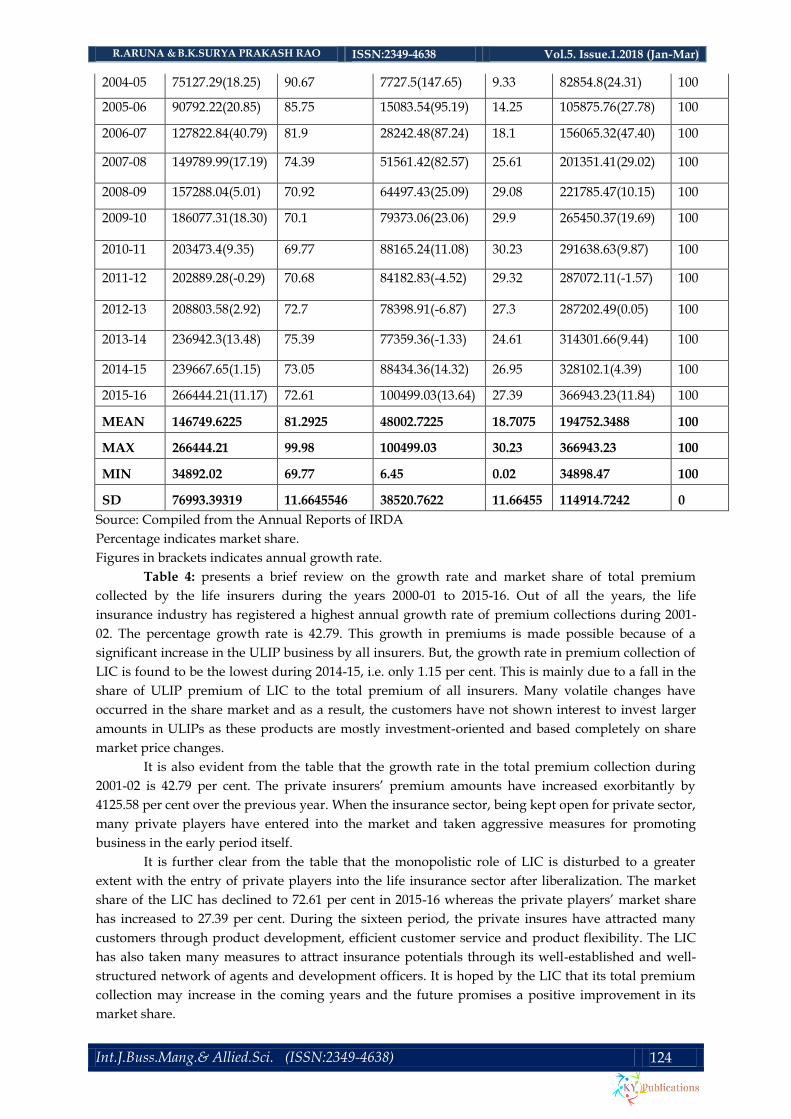
2004-05 75127.29(18.25) 90.67 7727.5(147.65) 9.33 82854.8(24.31) 100
2005-06 90792.22(20.85) 85.75 15083.54(95.19) 14.25 105875.76(27.78) 100
2006-07 127822.84(40.79) 81.9 28242.48(87.24) 18.1 156065.32(47.40) 100
2007-08 149789.99(17.19) 74.39 51561.42(82.57) 25.61 201351.41(29.02) 100
2008-09 157288.04(5.01) 70.92 64497.43(25.09) 29.08 221785.47(10.15) 100
2009-10 186077.31(18.30) 70.1 79373.06(23.06) 29.9 265450.37(19.69) 100
2010-11 203473.4(9.35) 69.77 88165.24(11.08) 30.23 291638.63(9.87) 100
2011-12 202889.28(-0.29) 70.68 84182.83(-4.52) 29.32 287072.11(-1.57) 100
2012-13 208803.58(2.92) 72.7 78398.91(-6.87) 27.3 287202.49(0.05) 100
2013-14 236942.3(13.48) 75.39 77359.36(-1.33) 24.61 314301.66(9.44) 100
2014-15 239667.65(1.15) 73.05 88434.36(14.32) 26.95 328102.1(4.39) 100
2015-16 266444.21(11.17) 72.61 100499.03(13.64) 27.39 366943.23(11.84) 100
MEAN 146749.6225 81.2925 48002.7225 18.7075 194752.3488 100
MAX 266444.21 99.98 100499.03 30.23 366943.23 100
MIN 34892.02 69.77 6.45 0.02 34898.47 100
SD 76993.39319 11.6645546 38520.7622 11.66455 114914.7242 0
Source: Compiled from the Annual Reports of IRDA
Percentage indicates market share.
Figures in brackets indicates annual growth rate.
Table 4: presents a brief review on the growth rate and market share of total premium
collected by the life insurers during the years 2000-01 to 2015-16. Out of all the years, the life
insurance industry has registered a highest annual growth rate of premium collections during 2001-
02. The percentage growth rate is 42.79. This growth in premiums is made possible because of a
significant increase in the ULIP business by all insurers. But, the growth rate in premium collection of
LIC is found to be the lowest during 2014-15, i.e. only 1.15 per cent. This is mainly due to a fall in the
share of ULIP premium of LIC to the total premium of all insurers. Many volatile changes have
occurred in the share market and as a result, the customers have not shown interest to invest larger
amounts in ULIPs as these products are mostly investment-oriented and based completely on share
market price changes.
It is also evident from the table that the growth rate in the total premium collection during
2001-02 is 42.79 per cent. The private insurers’ premium amounts have increased exorbitantly by
4125.58 per cent over the previous year. When the insurance sector, being kept open for private sector,
many private players have entered into the market and taken aggressive measures for promoting
business in the early period itself.
It is further clear from the table that the monopolistic role of LIC is disturbed to a greater
extent with the entry of private players into the life insurance sector after liberalization. The market
share of the LIC has declined to 72.61 per cent in 2015-16 whereas the private players’ market share
has increased to 27.39 per cent. During the sixteen period, the private insures have attracted many
customers through product development, efficient customer service and product flexibility. The LIC
has also taken many measures to attract insurance potentials through its well-established and well-
structured network of agents and development officers. It is hoped by the LIC that its total premium
collection may increase in the coming years and the future promises a positive improvement in its
market share.
R.ARUNA & B.K.SURYA PRAKASH RAO ISSN:2349-4638 Vol.5. Issue.1.2018 (Jan-Mar)
Int.J.Buss.Mang.& Allied.Sci. (ISSN:2349-4638) 125
The above table shows information on the average of total premium underwritten by the life
insurers during 2001-16. It is Rs.146749.62 crore LIC and 48002.72 for Private Sector. It indicates that
the average of Private Sector is higher than the LIC.
It further highlights from the table that the average total premium underwritten by LIC is
81.29 per cent and the Private Sector is 18.70 per cent with regard to their market share during 2001-
16. The standard deviation of total premium for LIC is 76993.39 whereas Private Sector is 38520.76
during the period. It indicates that the Private Sector insurers are having stability in collection of total
premium than LIC.
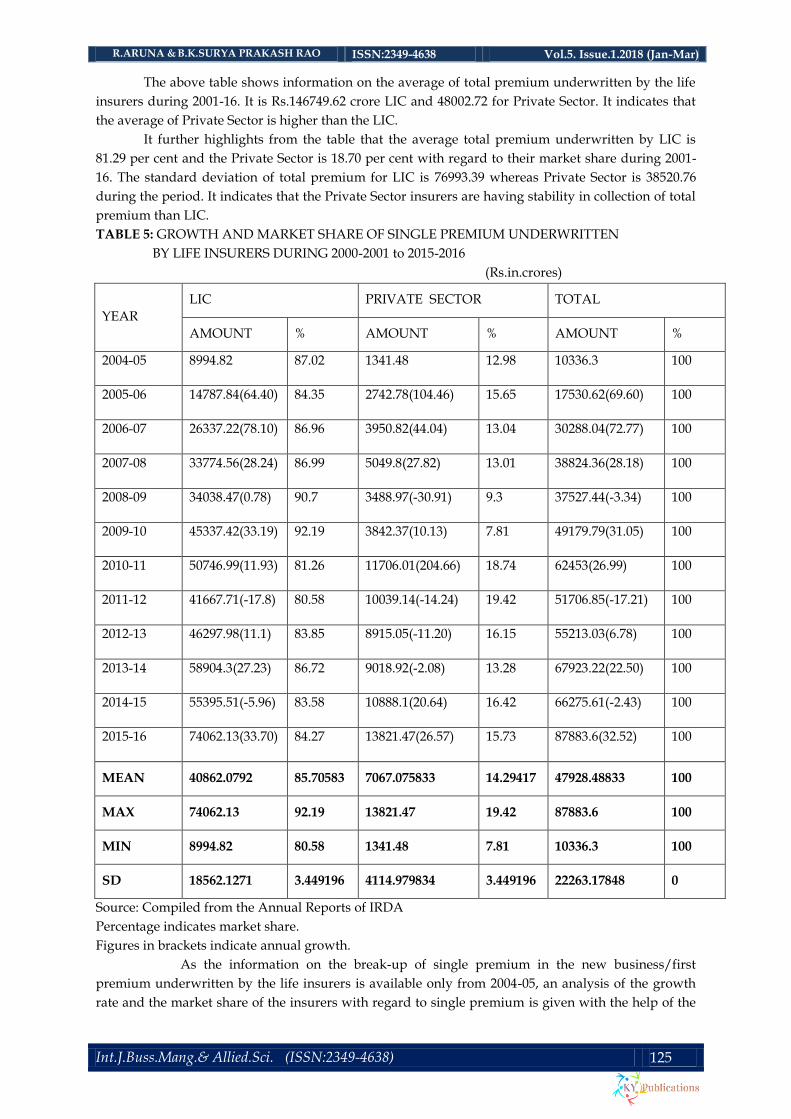
TABLE 5: GROWTH AND MARKET SHARE OF SINGLE PREMIUM UNDERWRITTEN
BY LIFE INSURERS DURING 2000-2001 to 2015-2016
(Rs.in.crores)
YEAR
LIC PRIVATE SECTOR TOTAL
AMOUNT % AMOUNT % AMOUNT %
2004-05 8994.82 87.02 1341.48 12.98 10336.3 100
2005-06 14787.84(64.40) 84.35 2742.78(104.46) 15.65 17530.62(69.60) 100
2006-07 26337.22(78.10) 86.96 3950.82(44.04) 13.04 30288.04(72.77) 100
2007-08 33774.56(28.24) 86.99 5049.8(27.82) 13.01 38824.36(28.18) 100
2008-09 34038.47(0.78) 90.7 3488.97(-30.91) 9.3 37527.44(-3.34) 100
2009-10 45337.42(33.19) 92.19 3842.37(10.13) 7.81 49179.79(31.05) 100
2010-11 50746.99(11.93) 81.26 11706.01(204.66) 18.74 62453(26.99) 100
2011-12 41667.71(-17.8) 80.58 10039.14(-14.24) 19.42 51706.85(-17.21) 100
2012-13 46297.98(11.1) 83.85 8915.05(-11.20) 16.15 55213.03(6.78) 100
2013-14 58904.3(27.23) 86.72 9018.92(-2.08) 13.28 67923.22(22.50) 100
2014-15 55395.51(-5.96) 83.58 10888.1(20.64) 16.42 66275.61(-2.43) 100
2015-16 74062.13(33.70) 84.27 13821.47(26.57) 15.73 87883.6(32.52) 100
MEAN 40862.0792 85.70583 7067.075833 14.29417 47928.48833 100
MAX 74062.13 92.19 13821.47 19.42 87883.6 100
MIN 8994.82 80.58 1341.48 7.81 10336.3 100
SD 18562.1271 3.449196 4114.979834 3.449196 22263.17848 0
Source: Compiled from the Annual Reports of IRDA
Percentage indicates market share.
Figures in brackets indicate annual growth.
As the information on the break-up of single premium in the new business/first
premium underwritten by the life insurers is available only from 2004-05, an analysis of the growth
rate and the market share of the insurers with regard to single premium is given with the help of the

R.ARUNA & B.K.SURYA PRAKASH RAO ISSN:2349-4638 Vol.5. Issue.1.2018 (Jan-Mar)
Int.J.Buss.Mang.& Allied.Sci. (ISSN:2349-4638) 126
table 5. It is observed from the Table that the LIC has experienced a gradual increase in the single
premium amount. Despite a very little increase in the growth rate by the LIC, the total industry has
suffered a lot and registered a decrease rate of 3.44 per cent. This is mainly due to a larger decline in
the amount of single premium collection by private players during this period. The private players
have experienced a decrease rate of 30.91 per cent in their single premium collection. The decline in
single premiums during this period is the result of the reduced demand, low interest rates and the
need for additional capital by many private insurers to promote business.
It appears clearly from the table that during 2005-06, both LIC and private sector players have
collected only smaller amounts of single premium as the non-single premium policies have occupied
a greater share in the total business. Though single premium policies are dominant in U.S. life
insurance market, our market has not reached to that stage. Later, there is a consistent increase in the
amount of single premium collected by the LIC. But, the private sector insurers have experienced a
decline in the single premium collection during 2008-09 and their market share has declined to 7.81
per cent whereas the LIC’s share has increased to 92.19 per cent.
On the whole, it can be observed that during the six-year period of analysis, both the public
and private insurers have offered customized solutions to the customers rather than traditional
solutions. While the unit- linked products are well-received by the customers, the private insurers are
instrumental in selling these products to the customers in good number ranging from 90 to 95 per
cent of their total business. As single premium products are attractive only to a limited number of
customers like celebrities in different fields and the individuals having uncertain incomes, there is
only a five-fold increase in the amount of premiums during this period.
It further analyses from the table that the average single premium underwritten by LIC is
Rs.40862.07 crores and the Private Sector is Rs.7067.07 crores with regard to the market share during
2004-16. LIC has a higher market share than that of Private Sector. The standard deviation of single
premium for LIC is 18562.12, whereas Private Sector is 4114.97 during the study period. It indicates
that the Private Sector is having consistency in collection of single premium.
IV. Conclusion
The study reveals that in insurance sector LIC is playing major role as market leader in the
entire market. The market share of the private firms is very less compared with LIC. For new polices
underwriting LIC occupied the market about 63 percent, while private firms having only 27 percent.
Secondly, for the first year premium underwriting policies LIC occupied around 77 percent and the
remaining capture only 23 percent. Renewal and total premium underwriting LIC occupied around
82 percent, whereas private parties having only 18 percent. Finally, for single premium policies also
LIC capture around 85 percent, while private companies occupied 15 percent only. Therefore the
study reveals that LIC is playing a dominant role in insurance sector inspite of tough competition in
the market. It is managed to survive in the market by introducing the innovative policies and services
to its investors.
References
[1]. Chaudhary, S. & Kirin, P. (2011) Life Insurance Industry in India - Current Scenario
International Journal of Management & Business Studies, 1(30), 146-150.
[2]. Motihar, M (2010): Principles and Practice of Insurance, Sharda Pustak Bhawan, Allahabad.
[3]. Ranade, A. and Rajeev Ahuja, (1999): Life Insurance in India Emerging Issues, Economic and
Political Weekly, January 16-23, 1999.
[4]. Rastogi, S. and Runa Shankar, (2007): Enhancing Competitiveness: The Case of the Indian Life
Insurance Company, Indian Institute of Management, and Kozhikode.
[5]. Arora, R.S... “Financial Reforms and Service Sector–A Study of Life Insurance Industry in
India”, In B.B. Tandon and A.K.
[6]. Vashisht (Eds.), Financial Sector Reforms–An Unpublished Agenda for Economic
Development: 259-270, New Delhi: Deep & Deep, 2002.

R.ARUNA & B.K.SURYA PRAKASH RAO ISSN:2349-4638 Vol.5. Issue.1.2018 (Jan-Mar)
Int.J.Buss.Mang.& Allied.Sci. (ISSN:2349-4638) 127
[7]. Chakraborty, Joy. “Private Life Insurance Companies in India – Growing Prospects and
Challenges”, Insurance Chronicle: 29-39, 2007.
[8]. John, Jimmy. “The War for Market Share – A View from India”, Insurance Chronicle: 37-39,
2008.
[9]. Verma, Vinay,“New Trends in Product Design: An Overview of Life Insurance Products”,
The Insurance Times, 23 (6): 16-28, 2003
[10]. www.irda.gov.in