international journal of computational intelligence and ... · different set of attributes (di) ......
TRANSCRIPT
International Journal of Computational Intelligence and Informatics, Vol. 7: No. 1, June 2017
ISSN: 2349 – 6363 1
A Combined Approach of Naive Bayes Classifier and
Relevance Vector Machine for Breast Cancer Diagnosis
B. M. Gayathri
Department of Computer Science
S.D.N.B.Vaishnav College for women
Chennai, India
C. P. Sumathi
Department of Computer Science
S.D.N.B.Vaishnav College for Women
Chennai, India
Abstract- Diagnosing cancer manually may have some limitations and it is difficult too. Many researches
are still under process for detecting cancer accurately. Many software applications are developed to
diagnose the disease and some are developed for analyzing data for effective usage. Machine learning
techniques are very popular for developing medical applications. There are many techniques under
machine learning for cancer detection which gives appropriate results. This article deals with diagnosing
breast cancer in combination of Naïve bayes and Relevance vector machine algorithms. Wisconsin
original breast cancer dataset is used for testing and training.
Keywords- Classification, LDA, Naïve Bayes Classifier, Relevance Vector Machine, RVM
1. INTRODUCTION
Cancer is one of the most dangerous diseases that cause cells in the body to change and grow out of control.
Mostly the women are affected by cancer such as breast cancer, cervical cancer, and ovarian cancer. Breast
cancer is said to be one of the leading cause of death among women. Breast cancer not only affects female but
also affect male, due to lifestyle factors and habits. Treating breast cancer is most painful and there are still many
research work undergoing for predicting breast cancer in early stage. Recently breast cancer specialists have
introduced new techniques for predicting breast cancer. It is a lab test known as circulating tumor cells, which
predicts, which patient may have recurrence of their cancer. Another test is done using images which is called as
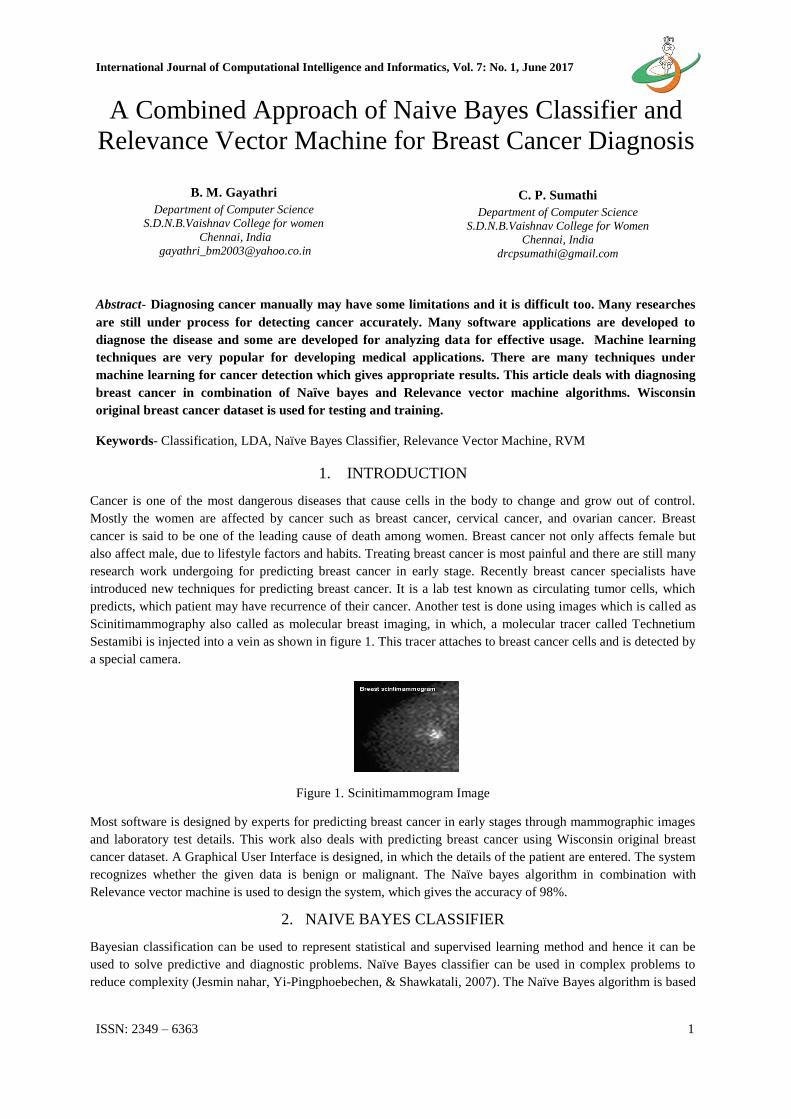
Scinitimammography also called as molecular breast imaging, in which, a molecular tracer called Technetium
Sestamibi is injected into a vein as shown in figure 1. This tracer attaches to breast cancer cells and is detected by
a special camera.
Figure 1. Scinitimammogram Image
Most software is designed by experts for predicting breast cancer in early stages through mammographic images
and laboratory test details. This work also deals with predicting breast cancer using Wisconsin original breast
cancer dataset. A Graphical User Interface is designed, in which the details of the patient are entered. The system
recognizes whether the given data is benign or malignant. The Naïve bayes algorithm in combination with
Relevance vector machine is used to design the system, which gives the accuracy of 98%.
2. NAIVE BAYES CLASSIFIER
Bayesian classification can be used to represent statistical and supervised learning method and hence it can be
used to solve predictive and diagnostic problems. Naïve Bayes classifier can be used in complex problems to
reduce complexity (Jesmin nahar, Yi-Pingphoebechen, & Shawkatali, 2007). The Naïve Bayes algorithm is based
International Journal of Computational Intelligence and Informatics, Vol. 7: No. 1, June 2017
2
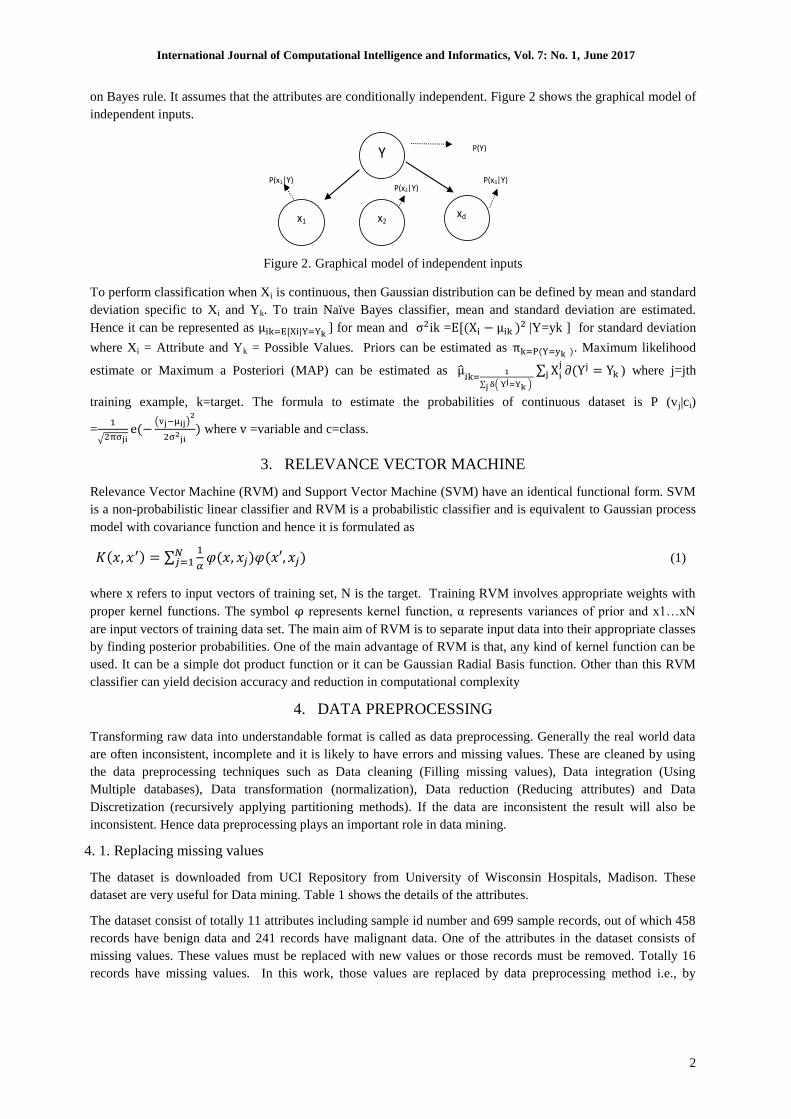
on Bayes rule. It assumes that the attributes are conditionally independent. Figure 2 shows the graphical model of
independent inputs.
Figure 2. Graphical model of independent inputs
To perform classification when Xi is continuous, then Gaussian distribution can be defined by mean and standard
deviation specific to Xi and Yk. To train Naïve Bayes classifier, mean and standard deviation are estimated.
Hence it can be represented as ] for mean and ik =
|Y=yk ] for standard deviation
where Xi = Attribute and Yk = Possible Values. Priors can be estimated as . Maximum likelihood
estimate or Maximum a Posteriori (MAP) can be estimated as
) where j=jth
training example, k=target. The formula to estimate the probabilities of continuous dataset is P (vj|ci)
=
where =variable and c=class.
3. RELEVANCE VECTOR MACHINE
Relevance Vector Machine (RVM) and Support Vector Machine (SVM) have an identical functional form. SVM
is a non-probabilistic linear classifier and RVM is a probabilistic classifier and is equivalent to Gaussian process
model with covariance function and hence it is formulated as
(1)
where refers to input vectors of training set, N is the target. Training RVM involves appropriate weights with
proper kernel functions. The symbol represents kernel function, α represents variances of prior and x1…xN
are input vectors of training data set. The main aim of RVM is to separate input data into their appropriate classes
by finding posterior probabilities. One of the main advantage of RVM is that, any kind of kernel function can be
used. It can be a simple dot product function or it can be Gaussian Radial Basis function. Other than this RVM
classifier can yield decision accuracy and reduction in computational complexity
4. DATA PREPROCESSING
Transforming raw data into understandable format is called as data preprocessing. Generally the real world data
are often inconsistent, incomplete and it is likely to have errors and missing values. These are cleaned by using
the data preprocessing techniques such as Data cleaning (Filling missing values), Data integration (Using
Multiple databases), Data transformation (normalization), Data reduction (Reducing attributes) and Data
Discretization (recursively applying partitioning methods). If the data are inconsistent the result will also be
inconsistent. Hence data preprocessing plays an important role in data mining.
4. 1. Replacing missing values
The dataset is downloaded from UCI Repository from University of Wisconsin Hospitals, Madison. These
dataset are very useful for Data mining. Table 1 shows the details of the attributes.
The dataset consist of totally 11 attributes including sample id number and 699 sample records, out of which 458
records have benign data and 241 records have malignant data. One of the attributes in the dataset consists of
missing values. These values must be replaced with new values or those records must be removed. Totally 16
records have missing values. In this work, those values are replaced by data preprocessing method i.e., by
Y
x1 x2 xd
P(Y)
P(x1|Y) P(x2|Y)
P(x3|Y)
International Journal of Computational Intelligence and Informatics, Vol. 7: No. 1, June 2017
3
finding the mean for that attribute. The dataset is normalized by finding Log10 value for the data in each and
every attribute. Data are normalized, so that it improves and speeds up the performance of algorithm and also all
the data comes under common scale.
Table 1. Attributes of Wisconsin Dataset
S.No Attributes/Features Range of values
1. Clumpthickness 1-10
2. Uniformity cell size 1-10
3. Uniformity cell shape 1-10
4. Marginal Adhesion 1-10
5. Single Epithelian Cell size 1-10
6. Bare Nuclei 1-10
7. Bland Chromatin 1-10
8. Normal Nucleoli 1-10
9. Mitosis 1-10
10. Class 2-benign
4-Malignant
4. 2. Variable selection using Linear Discriminant Analysis
The purpose of using Linear Discriminant Analysis (LDA) is that, it searches for a linear combination of
variables that separates two best classes. LDA performs dimensionality reduction by preserving the class
information as much as possible. The variables that are used in this analysis were selected by using Linear
Discriminant Analysis (Lorris Nanni & Alessandra lumini, 2010), Different combinations of variables were used
and the variables, that gave the highest accuracy were selected for evaluation. Four attributes were selected for
diagnosing breast cancer. By considering a set of N dimensional samples such as {α(1, α (2, …, α (N)} where
classes are represented by ω1(class 1), ω2(class2) and to obtain scalar y, project the samples α on a line
which is the projection of on w, where w=projection vectors, t=target, α=samples on a line and thus,
is a dimensionality reduction . To measure the separation between projections, the arithmetic means of each class
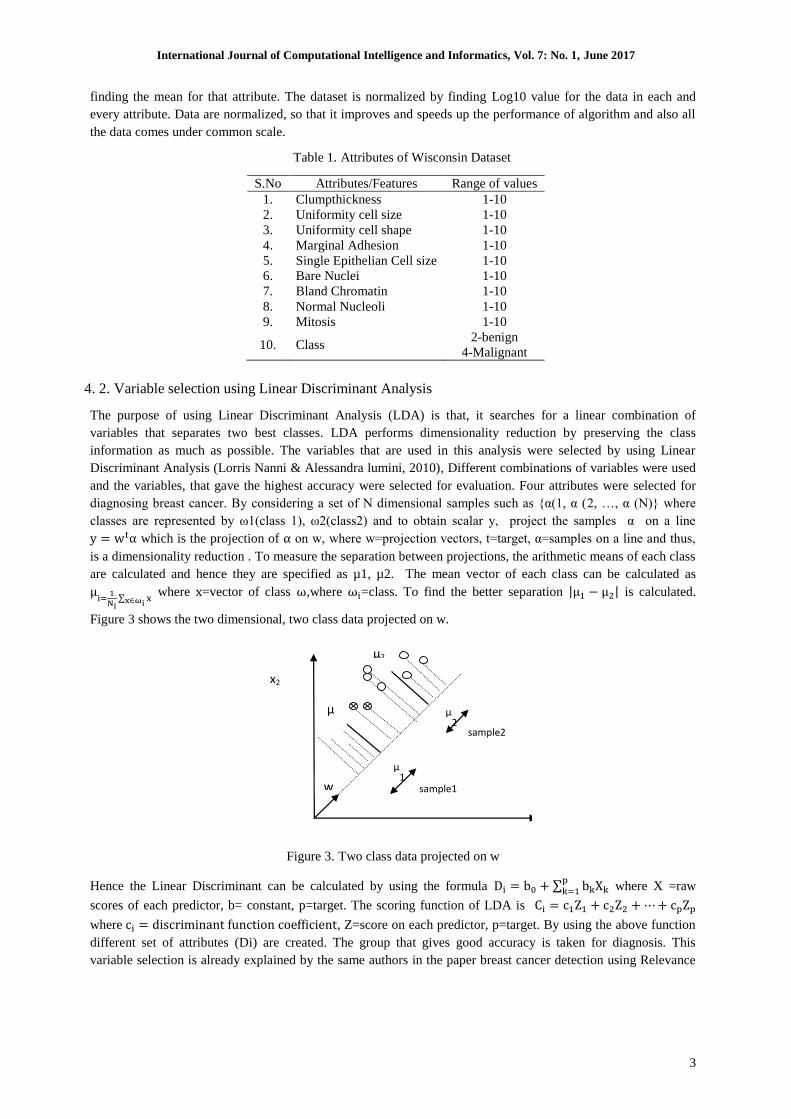
are calculated and hence they are specified as µ1, µ2. The mean vector of each class can be calculated as
where =vector of class ,where =class. To find the better separation is calculated.
Figure 3 shows the two dimensional, two class data projected on w.
Figure 3. Two class data projected on w
Hence the Linear Discriminant can be calculated by using the formula where X =raw
scores of each predictor, b= constant, p=target. The scoring function of LDA is
where , Z=score on each predictor, p=target. By using the above function
different set of attributes (Di) are created. The group that gives good accuracy is taken for diagnosis. This
variable selection is already explained by the same authors in the paper breast cancer detection using Relevance
µ
1
µ2
w
µ1
µ2
sample1
sample2
x2
International Journal of Computational Intelligence and Informatics, Vol. 7: No. 1, June 2017
4
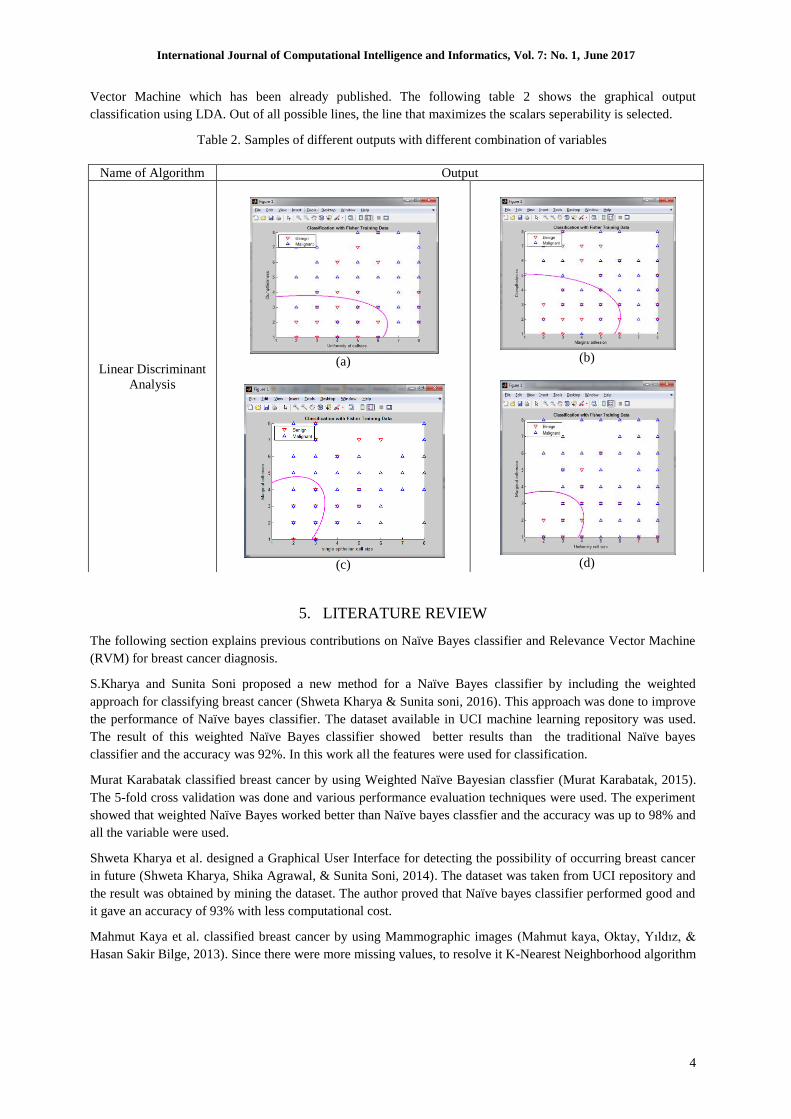
Vector Machine which has been already published. The following table 2 shows the graphical output
classification using LDA. Out of all possible lines, the line that maximizes the scalars seperability is selected.
Table 2. Samples of different outputs with different combination of variables
5. LITERATURE REVIEW
The following section explains previous contributions on Naïve Bayes classifier and Relevance Vector Machine
(RVM) for breast cancer diagnosis.
S.Kharya and Sunita Soni proposed a new method for a Naïve Bayes classifier by including the weighted
approach for classifying breast cancer (Shweta Kharya & Sunita soni, 2016). This approach was done to improve
the performance of Naïve bayes classifier. The dataset available in UCI machine learning repository was used.
The result of this weighted Naïve Bayes classifier showed better results than the traditional Naïve bayes
classifier and the accuracy was 92%. In this work all the features were used for classification.
Murat Karabatak classified breast cancer by using Weighted Naïve Bayesian classfier (Murat Karabatak, 2015).
The 5-fold cross validation was done and various performance evaluation techniques were used. The experiment
showed that weighted Naïve Bayes worked better than Naïve bayes classfier and the accuracy was up to 98% and
all the variable were used.
Shweta Kharya et al. designed a Graphical User Interface for detecting the possibility of occurring breast cancer
in future (Shweta Kharya, Shika Agrawal, & Sunita Soni, 2014). The dataset was taken from UCI repository and
the result was obtained by mining the dataset. The author proved that Naïve bayes classifier performed good and
it gave an accuracy of 93% with less computational cost.
Mahmut Kaya et al. classified breast cancer by using Mammographic images (Mahmut kaya, Oktay, Yıldız, &
Hasan Sakir Bilge, 2013). Since there were more missing values, to resolve it K-Nearest Neighborhood algorithm
Name of Algorithm Output
Linear Discriminant
Analysis
(a)
(c)
(b)
(d)
International Journal of Computational Intelligence and Informatics, Vol. 7: No. 1, June 2017
5
was used and the performance was evaluated by using traditional Naïve bayes classifier which gave an accuracy
of 81.69%
Gouda I. Salama et al., used various classifiers for detecting breast cancer (Gouda, Salama, M.B.Abdelhalim, &
Zeid, 2012). Each and every classifier was applied in various datasets such as Wisconsin Prognostic Breast
Cancer dataset (WPBC), Wisconsin Diagnostic Breast Cancer dataset (WDBC) and original dataset. Features
were selected by using Principal Component Analysis (PCA). Out of the different classifiers used Naïve bayes
showed the best accuracy of 95%.
Diana Dumitru has done investigation for predicting recurrent and non-recurrent events of breast cancer using
Naïve Bayes classifier (Diana Dumitru, 2009). The result showed that the performance of Naïve Bayes was good
and it worked equivalent to other machine learning techniques and also the computational cost was low. The
accuracy of this work was 72.24%. The dataset used for this work was Wisconsin Prognostic dataset, which was
taken from UCI Repository.
Daniele Soria had reviewed different supervised machine learning techniques such as C4.5 tree classifier, Naïve
Bayes and Multilayer perceptron (Daniele Soria, Jonathan, Garibaldi, & Elia Bianzoli, 2008). From these
algorithms, it was found that Naïve bayes worked better than other two, even if the normality of data strongly
violated. The dataset used for this work was taken from Nottingham Tenovus primary breast cancer Carcinoma
series. The authors reduced the attributes from 25 to 10 and the accuracy was 93.1%.
B.M.Gayathri and C.P.Sumathi proposed a machine learning algorithm using RVM for detecting breast cancer
(B.M.Gayathri & C.P.Sumathi, 2015), (B.M.Gayathri & C.P.Sumathi, 2016). Wisconsin Original dataset was
used for analysis. In this work the features were reduced by using Linear Discriminant Analysis (LDA). The
accuracy of this algorithm was 97%.
A.Bharathi, K.Anandakumar developed an effective machine learning approach using Relevance Vector Machine
(A.Bharathi & K.Anandakumar, 2015). The aim of the authors was to diagnose the investigational value using
three site of origin such as Lymphoma, Leukemia and Small Round Blue Cell Tumors (SRBCT) and apply these
in three different machine learning algorithms such as Fast Support Vector machine learning, Fast Extreme
Machine Learning, and Relevance vector machine learning. Out of these algorithms Relevance vector machine
learning gave good accuracy than the other algorithms. The features were selected using Analysis of Variance
(ANOVA) by specifying ranking scheme.
Elie Tcheimegni et al. proposed Relevance vector machine for diagnosing various diseases such as breast cancer,
liver disorders and diabetes (Elie Tcheimegni, Manohar Mareboyana, ClaudeTurner, & Kofi Nyarko, 2013). The
datasets used were from various hospitals. For example Breast cancer dataset was got from Wisconsin Hospital
Madrid, Liver disorders dataset from BUPA medical research Ltd. and Diabetes dataset from US National
Institute of Diabetes and Kidney diseases. For all these datasets Relevance Vector Machine worked in an
efficient way and for breast cancer diagnosis it gave an accuracy of 65.52%.
A.Bharathi and A.M.Natarajan have done cancer classification using Relevance Vector Machine and Support
Vector Machine in combination with Analysis of variance (ANOVA) for gene selection (A.Bharathi &
A.M.Natarajan, 2011). The genes that were selected using ANOVA were applied to RVM and SVM and
accuracy of RVM was 97.21%, which worked better than Support Vector Machine.
6. NAÏVE BAYES-RVM
In this review it is found that the algorithm Naïve Bayes and RVM were used separately and extensively and has
yielded good results. In this work it was experimented to test if the combined approach could yield better results
than used individually. Both Naïve bayes and Relevance vector machine are probabilistic classifier, which are
easy to implement with less computational cost.
6. 1. Research objective
The objective of this research is to develop a user friendly environment for detecting breast cancer and to
implement the Naïve Bayes classifier in combination with Relevance Vector Machine to get more accurate
International Journal of Computational Intelligence and Informatics, Vol. 7: No. 1, June 2017
6
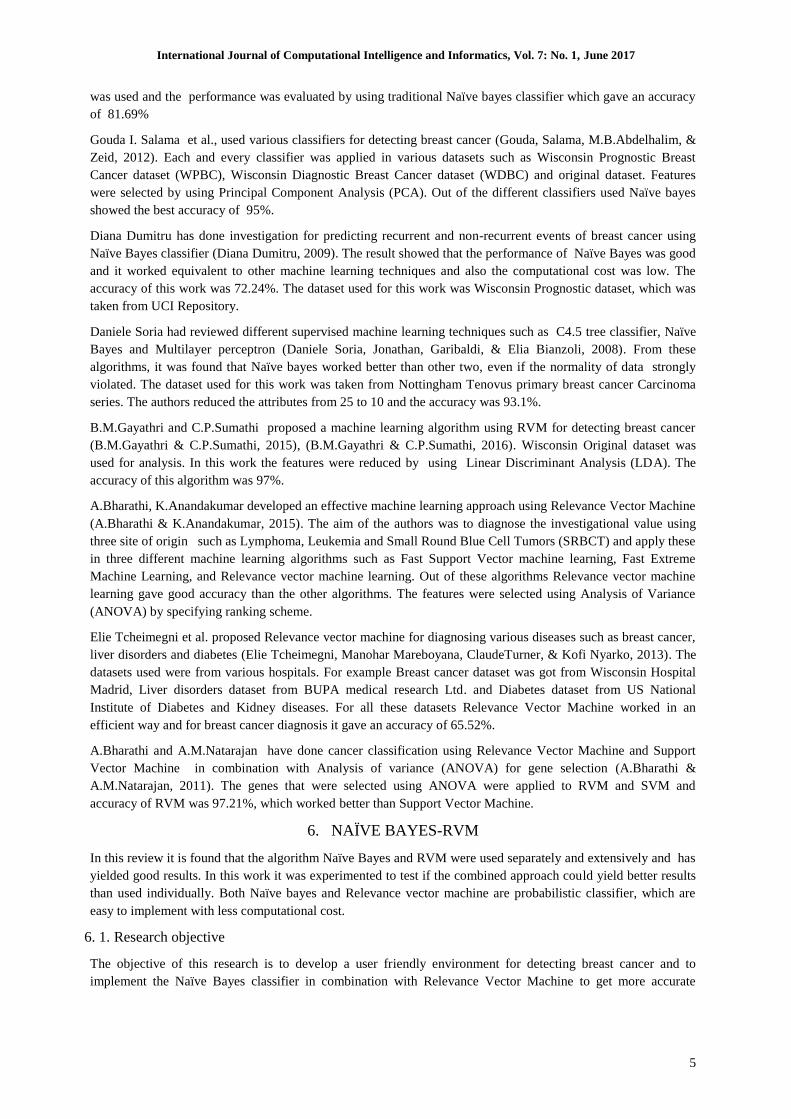
results with less features and computational cost. The GUI is designed using MATLAB software which is more
useful for analyzing data, developing algorithms and creating application models. Figure 4 shows the model
flowchart of proposed classifier.
Figure 4. Model Flow Chart of Naïve Bayes-RVM classification
7. IMPLEMENTATION AND OUTPUT
The Naïve Bayes-RVM algorithm is designed to reduce the computational complexity and predict whether the
cancer is benign or malignant. The interface is designed using GUIDE (GUI builder) in MATLAB. The dataset is
stored in database and 50% of data were retrieved for training. The dataset contains 699 samples with 16 missing
values. It had nine attributes which represent the characteristics of tumor (for eg. Clumpthickness, Uniformity
cell size, shape, Marginal adhesion etc.) out of which only four attributes were selected by using one of the data
preprocessing method called Linear Discriminant Analysis and the missing values are replaced by median
method. The best four attributes were selected for classification. Remaining 50% of data were entered manually
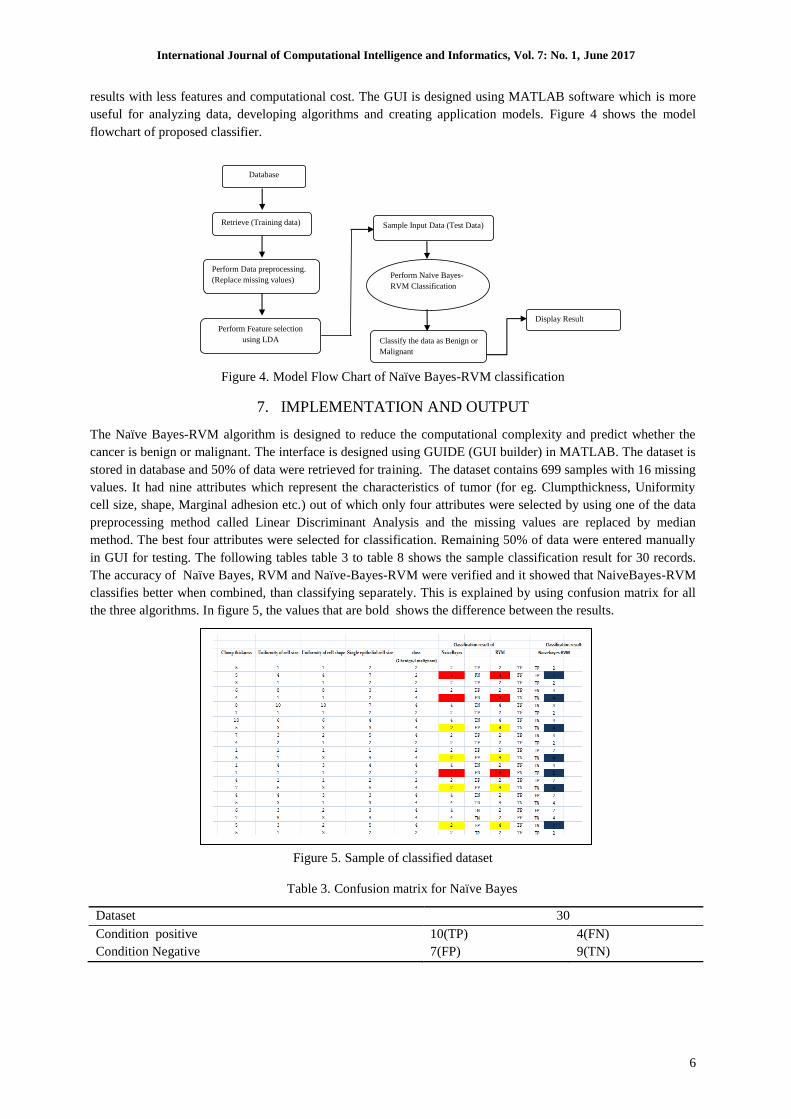
in GUI for testing. The following tables table 3 to table 8 shows the sample classification result for 30 records.
The accuracy of Naïve Bayes, RVM and Naïve-Bayes-RVM were verified and it showed that NaiveBayes-RVM
classifies better when combined, than classifying separately. This is explained by using confusion matrix for all
the three algorithms. In figure 5, the values that are bold shows the difference between the results.
Figure 5. Sample of classified dataset
Table 3. Confusion matrix for Naïve Bayes
Dataset 30
Condition positive 10(TP) 4(FN)
Condition Negative 7(FP) 9(TN)
Database
Retrieve (Training data)
Perform Data preprocessing.
(Replace missing values)
Perform Feature selection
using LDA
Sample Input Data (Test Data)
Perform Naïve Bayes-
RVM Classification
Classify the data as Benign or
Malignant
Display Result
International Journal of Computational Intelligence and Informatics, Vol. 7: No. 1, June 2017
7
Table 4. Performance evaluation of Naïve Bayes classifier
Algorithm Dataset Recall rate Precision Rate Accuracy
Naïve Bayes 30 71.4% 56% 63.3%
Table 5. Confusion Matrix for RVM
Dataset 30
Condition positive 11(TP) 3(FN)
Condition Negative 3(FP) 17(TN)
Table 6. Performance evaluation of RVM
Table 7. Confusion Matrix for Naïve Bayes - RVM
Dataset 30
Condition positive 11(TP) 3(FN)
Condition Negative 3(FP) 17(TN)
Table 8. Performance evaluation of Naïve Bayes –RVM classifier
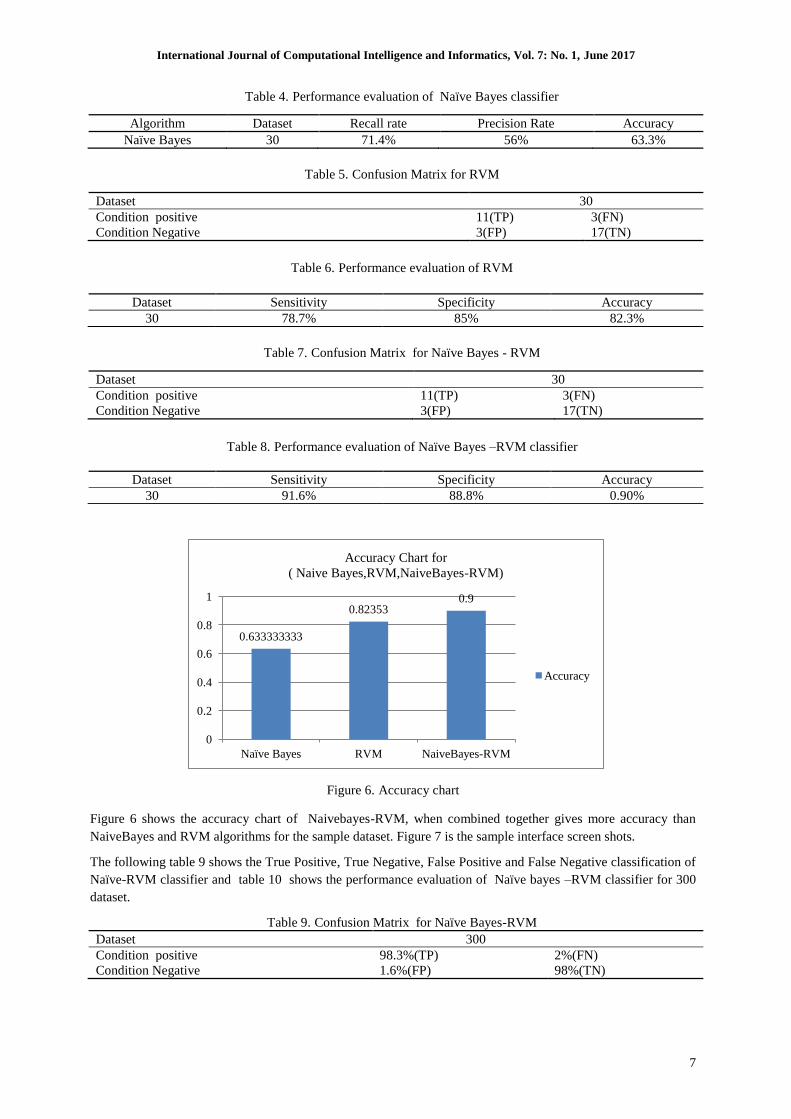
Figure 6. Accuracy chart
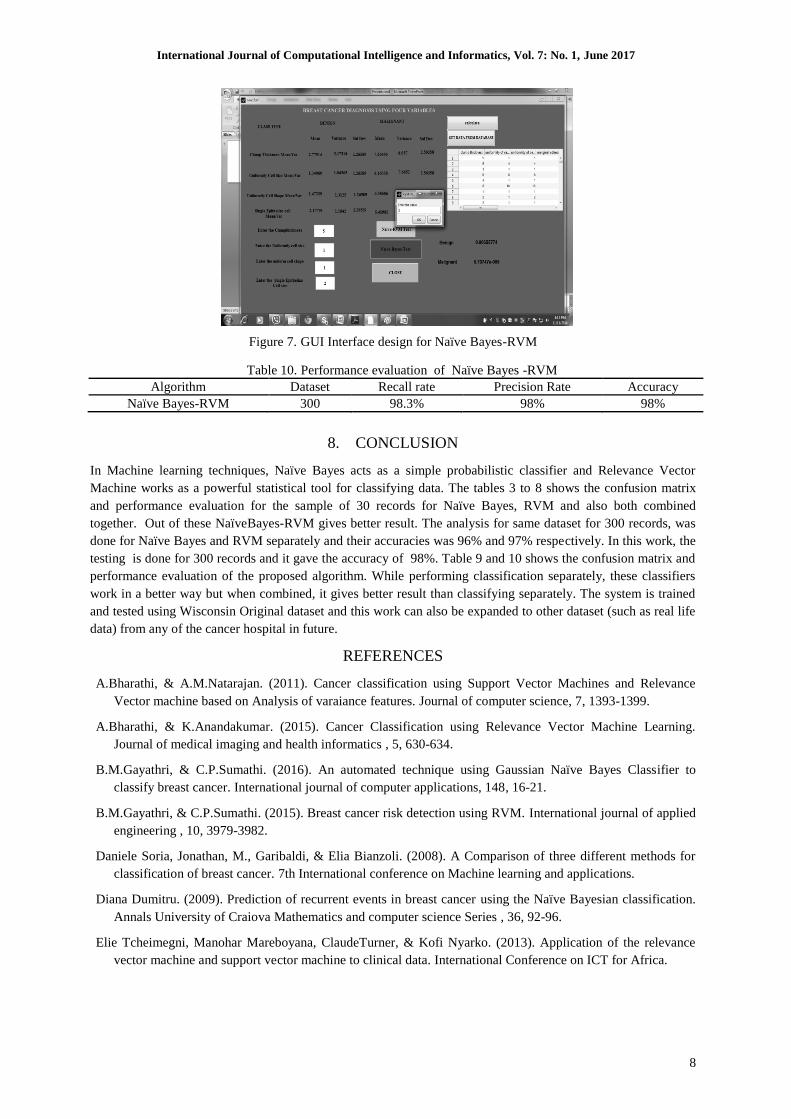
Figure 6 shows the accuracy chart of Naivebayes-RVM, when combined together gives more accuracy than
NaiveBayes and RVM algorithms for the sample dataset. Figure 7 is the sample interface screen shots.
The following table 9 shows the True Positive, True Negative, False Positive and False Negative classification of
Naïve-RVM classifier and table 10 shows the performance evaluation of Naïve bayes –RVM classifier for 300
dataset.
Table 9. Confusion Matrix for Naïve Bayes-RVM
Dataset 300
Condition positive 98.3%(TP) 2%(FN)
Condition Negative 1.6%(FP) 98%(TN)
0.633333333
0.82353 0.9
0
0.2
0.4
0.6
0.8
1
Naïve Bayes RVM NaiveBayes-RVM
Accuracy Chart for
( Naive Bayes,RVM,NaiveBayes-RVM)
Accuracy
Dataset Sensitivity Specificity Accuracy
30 78.7% 85% 82.3%
Dataset Sensitivity Specificity Accuracy
30 91.6% 88.8% 0.90%
International Journal of Computational Intelligence and Informatics, Vol. 7: No. 1, June 2017
8
Figure 7. GUI Interface design for Naïve Bayes-RVM
Table 10. Performance evaluation of Naïve Bayes -RVM
Algorithm Dataset Recall rate Precision Rate Accuracy
Naïve Bayes-RVM 300 98.3% 98% 98%
8. CONCLUSION
In Machine learning techniques, Naïve Bayes acts as a simple probabilistic classifier and Relevance Vector
Machine works as a powerful statistical tool for classifying data. The tables 3 to 8 shows the confusion matrix
and performance evaluation for the sample of 30 records for Naïve Bayes, RVM and also both combined
together. Out of these NaïveBayes-RVM gives better result. The analysis for same dataset for 300 records, was
done for Naïve Bayes and RVM separately and their accuracies was 96% and 97% respectively. In this work, the
testing is done for 300 records and it gave the accuracy of 98%. Table 9 and 10 shows the confusion matrix and
performance evaluation of the proposed algorithm. While performing classification separately, these classifiers
work in a better way but when combined, it gives better result than classifying separately. The system is trained
and tested using Wisconsin Original dataset and this work can also be expanded to other dataset (such as real life
data) from any of the cancer hospital in future.
REFERENCES
A.Bharathi, & A.M.Natarajan. (2011). Cancer classification using Support Vector Machines and Relevance
Vector machine based on Analysis of varaiance features. Journal of computer science, 7, 1393-1399.
A.Bharathi, & K.Anandakumar. (2015). Cancer Classification using Relevance Vector Machine Learning.
Journal of medical imaging and health informatics , 5, 630-634.
B.M.Gayathri, & C.P.Sumathi. (2016). An automated technique using Gaussian Naïve Bayes Classifier to
classify breast cancer. International journal of computer applications, 148, 16-21.
B.M.Gayathri, & C.P.Sumathi. (2015). Breast cancer risk detection using RVM. International journal of applied
engineering , 10, 3979-3982.
Daniele Soria, Jonathan, M., Garibaldi, & Elia Bianzoli. (2008). A Comparison of three different methods for
classification of breast cancer. 7th International conference on Machine learning and applications.
Diana Dumitru. (2009). Prediction of recurrent events in breast cancer using the Naïve Bayesian classification.
Annals University of Craiova Mathematics and computer science Series , 36, 92-96.
Elie Tcheimegni, Manohar Mareboyana, ClaudeTurner, & Kofi Nyarko. (2013). Application of the relevance
vector machine and support vector machine to clinical data. International Conference on ICT for Africa.
International Journal of Computational Intelligence and Informatics, Vol. 7: No. 1, June 2017
9
Gouda, I., Salama, G., M.B.Abdelhalim, & Zeid, M. A.-e. (2012). Breast cancer diagnosis on three different
datasets using Multi-classifiers. International Journal of computer and information technology , 01, 36-43.
Jesmin nahar, Yi-Pingphoebechen, & Shawkatali. (2007). Kernel based Naïve bayes classifier for breast cancer.
Journal of Biological Systems , 15.
Lorris Nanni, & Alessandra lumini. (2010). Orthogonal linear discriminant analysis and feature selection in
microarray data classification. International Journal of expert systems with applications , 37, 7132-7137.
Mahmut kaya, Oktay, Yıldız, y., & Hasan Sakir Bilge. (2013). Breast cancer diagnosis based on Naïve Bayes
Machine learning classifier with KNN Missing data imputation. Global Journal on technology,3rd World
conference on Innovation and computer science , 14.
Murat Karabatak. (2015). A new classifier for breast cancer detection based on Naïve Bayesian. Journal of the
international measurement confederation , 72, 32-36.
Shweta Kharya, & Sunita soni. (2016). Weighted Naïve Bayes classifier –Predictive model for breast cancer
detection. International Journal of computer applications , 133, 32-37.
Shweta Kharya, Shika Agrawal, & Sunita Soni. (2014). Naive Bayes Classifiers: A Probabilistic Detection
Model for Breast Cancer. International Journal of Computer Applications , 92, 26-31.