international journal of engineering technologies (ijet) 2... · tarık kaan yaĞan . v editorial...
TRANSCRIPT

International Journal of
Engineering Technologies
(IJET)
Printed ISSN: 2149-0104 e-ISSN: 2149-5262
Volume: 2 No: 2
June 2016
© Istanbul Gelisim University Press, 2016 Certificate Number: 23696
All rights reserved.

ii
International Journal of Engineering Technologies is an international peer–reviewed journal and published quarterly. The opinions, thoughts, postulations or proposals within the articles are but reflections of the authors and do not, in any way, represent those of the Istanbul Gelisim University.
CORRESPONDENCE and COMMUNICATION:
Istanbul Gelisim University Faculty of Engineering and Architecture
Cihangir Mah. Şehit P. Onb. Murat Şengöz Sk. No: 8 34315 Avcilar / Istanbul / TURKEY Phone: +90 212 4227020 Ext. 221
Fax: +90 212 4227401 e-Mail: [email protected]
Web site: http://ijet.gelisim.edu.tr http://dergipark.ulakbim.gov.tr/ijet
Twitter: @IJETJOURNAL
Printing and binding: Anka Matbaa
Sertifika No: 12328 Tel: +90 212 5659033 - 4800571 e-Posta: [email protected]

iii
International Journal of Engineering Technologies (IJET) is included in:
International Journal of Engineering Technologies (IJET) is
harvested by the following service:
Organization URL Starting
Date
Feature
The OpenAIRE2020 Project
https://www.openaire.eu/
2015
Open Access
iv
INTERNATIONAL JOURNAL OF ENGINEERING TECHNOLOGIES (IJET) International Peer–Reviewed Journal
Volume 2, No 2, June 2016, Printed ISSN: 2149-0104, e-ISSN: 2149-5262
Owner on Behalf of Istanbul Gelisim University Rector Prof. Dr. Burhan AYKAÇ
Editor-in-Chief
Prof. Dr. İlhami ÇOLAK
Associate Editors Dr. Selin ÖZÇIRA
Dr. Mehmet YEŞİLBUDAK
Layout Editor Seda ERBAYRAK
Proofreader
Özlemnur ATAOL
Copyeditor Mehmet Ali BARIŞKAN
Contributor
Ahmet Şenol ARMAĞAN
Cover Design Tarık Kaan YAĞAN

v
Editorial Board
Professor Ilhami COLAK, Istanbul Gelisim University, Turkey Professor Dan IONEL, Regal Beloit Corp. and University of Wisconsin Milwaukee, United States Professor Fujio KUROKAWA, Nagasaki University, Japan Professor Marija MIROSEVIC, University of Dubrovnik, Croatia Prof. Dr. Şeref SAĞIROĞLU, Gazi University, Graduate School of Natural and Applied Sciences, Turkey Professor Adel NASIRI, University of Wisconsin-Milwaukee, United States Professor Mamadou Lamina DOUMBIA, University of Québec at Trois-Rivières, Canada Professor João MARTINS, University/Institution: FCT/UNL, Portugal Professor Yoshito TANAKA, Nagasaki Institute of Applied Science, Japan Dr. Youcef SOUFI, University of Tébessa, Algeria Prof.Dr. Ramazan BAYINDIR, Gazi Üniversitesi, Turkey Professor Goce ARSOV, SS Cyril and Methodius University, Macedonia Professor Tamara NESTOROVIĆ, Ruhr-Universität Bochum, Germany Professor Ahmed MASMOUDI, University of Sfax, Tunisia Professor Tsuyoshi HIGUCHI, Nagasaki University, Japan Professor Abdelghani AISSAOUI, University of Bechar, Algeria Professor Miguel A. SANZ-BOBI, Comillas Pontifical University /Engineering School, Spain Professor Mato MISKOVIC, HEP Group, Croatia Professor Nilesh PATEL, Oakland University, United States Assoc. Professor Juan Ignacio ARRIBAS, Universidad Valladolid, Spain Professor Vladimir KATIC, University of Novi Sad, Serbia Professor Takaharu TAKESHITA, Nagoya Institute of Technology, Japan Professor Filote CONSTANTIN, Stefan cel Mare University, Romania Assistant Professor Hulya OBDAN, Istanbul Yildiz Technical University, Turkey Professor Luis M. San JOSE-REVUELTA, Universidad de Valladolid, Spain Professor Tadashi SUETSUGU, Fukuoka University, Japan Associate Professor Zehra YUMURTACI, Istanbul Yildiz Technical University, Turkey

vi
Dr. Rafael CASTELLANOS-BUSTAMANTE, Instituto de Investigaciones Eléctricas, Mexico Assoc. Prof. Dr. K. Nur BEKIROGLU, Yildiz Technical University, Turkey Professor Gheorghe-Daniel ANDREESCU, Politehnica University of Timisoara, Romania Dr. Jorge Guillermo CALDERÓN-GUIZAR, Instituto de Investigaciones Eléctricas, Mexico Professor VICTOR FERNÃO PIRES, ESTSetúbal/Polytechnic Institute of Setúbal, Portugal Dr. Hiroyuki OSUGA, Mitsubishi Electric Corporation, Japan Professor Serkan TAPKIN, Istanbul Arel University, Turkey Professor Luis COELHO, ESTSetúbal/Polytechnic Institute of Setúbal, Portugal Professor Furkan DINCER, Mustafa Kemal University, Turkey Professor Maria CARMEZIM, ESTSetúbal/Polytechnic Institute of Setúbal, Portugal Associate Professor Lale T. ERGENE, Istanbul Technical University, Turkey Dr. Hector ZELAYA, ABB Corporate Research, Sweden Professor Isamu MORIGUCHI, Nagasaki University, Japan Associate Professor Kiruba SIVASUBRAMANIAM HARAN, University of Illinois, United States Associate Professor Leila PARSA, Rensselaer Polytechnic Institute, United States Professor Salman KURTULAN, Istanbul Technical University, Turkey Professor Dragan ŠEŠLIJA, University of Novi Sad, Serbia Professor Birsen YAZICI, Rensselaer Polytechnic Institute, United States Assistant Professor Hidenori MARUTA, Nagasaki University, Japan Associate Professor Yilmaz SOZER, University of Akron, United States Associate Professor Yuichiro SHIBATA, Nagasaki University, Japan Professor Stanimir VALTCHEV, Universidade NOVA de Lisboa, (Portugal) + Burgas Free University, (Bulgaria) Professor Branko SKORIC, University of Novi Sad, Serbia Dr. Cristea MIRON, Politehnica University in Bucharest, Romania Dr. Nobumasa MATSUI, Faculty of Engineering, Nagasaki Institute of Applied Science, Nagasaki, Japan Professor Mohammad ZAMI, King Fahd University of Petroleum and Minerals, Saudi Arabia Associate Professor Mohammad TAHA, Rafik Hariri University (RHU), Lebanon Assistant Professor Kyungnam KO, Jeju National University, Republic of Korea Dr. Guray GUVEN, Conductive Technologies Inc., United States Dr. Tuncay KAMAŞ, Eskişehir Osmangazi University, Turkey

vii
From the Editor
Dear Colleagues,
On behalf of the editorial board of International Journal of Engineering Technologies (IJET), I would like to share our happiness to publish the sixth issue of IJET. My special thanks are for members of editorial board, editorial team, referees, authors and other technical staff.
Please find the sixth issue of International Journal of Engineering Technologies at http://dergipark.ulakbim.gov.tr/ijet. We invite you to review the Table of Contents by visiting our web site and review articles and items of interest. IJET will continue to publish high level scientific research papers in the field of Engineering Technologies as an international peer-reviewed scientific and academic journal of Istanbul Gelisim University. Thanks for your continuing interest in our work,
Professor ILHAMI COLAK Istanbul Gelisim University
[email protected] --------------------------------------------
http://dergipark.ulakbim.gov.tr/ijet Printed ISSN: 2149-0104
e-ISSN: 2149-5262

viii
ix
Table of Contents
Page From the Editor vii Table of Contents ix On Load Single Phase Solid State Tap Changer
Mohammad H. Taha 29-33 Review on Natural Dye-Sensitized Solar Cells (DSSCs)
Oluwaseun Adedokun, Kamil Titilope, Ayodeji Oladiran Awodugba 34-41 Artificial Neural Networks Study on Prediction of Dielectric Permittivity of Basalt/PANI Composites
Onder Eyecioglu, Mehmet Kilic, Yasar Karabul, Umit Alkan, Orhan Icelli
42-48
Determination of Some Physical Properties of Rapeseed
Mehmet Firat Baran, Mehmet Recai Durgut, Turkan Aktas, Poyraz Ulger, Birol Kayisoglu
49-55
Steering Wheel Tie Rod Fatigue Life Determination According to Turkish Mission Profiles
Arif Senol Sener 56-63 Improvement of Density, Viscosity and Cold Flow Properties of Palm Oil Biodiesel by Alcohol Addition
Erinc Uludamar, Vedat Karaman, Safak Yildizhan, Hasan Serin 64-67 Study on Machining Parameters for Thrust Force and Torque in Milling AA7039 Composites Reinforced with Al2O3/B4C/SiC Particles
Sener Karabulut 68-75 New Solidification Materials in Nuclear Waste Management
Neslihan Yanikomer, Sinan Asal, Sevilay Haciyakupoglu, Sema Akyil Erenturk
76-82

x
International Journal of Engineering Technologies, IJET
e-Mail: [email protected] Web site: http://ijet.gelisim.edu.tr
http://dergipark.ulakbim.gov.tr/ijet Twitter: @IJETJOURNAL

INTERNATIONAL JOURNAL of ENGINEERING TECHNOLOGIES Mohammad H. Taha, Vol.2, No.2, 2016
29
On Load Single Phase Solid State Tap Changer
Mohammad H. Taha
Electrical and Computer Engineering Department, Rafik Hariri University, Lebanon
Corresponding Author; Mohammad H. Taha, Electrical and Computer Engineering Department, Rafik Hariri University,
Lebanon, Tel: +9615603090, Fax: +9615601380, [email protected]
Received: 04.11.2016 Accepted: 01.06.2016
Abstract-In electric energy transmission and distribution system, voltage control is an essential part to maintain proper voltage
limit at the consumer’s terminal. On-load tap-changers are indispensable in regulating power transformers used in electrical
energy networks and industrial applications. General switching principles and application for the On-load tap-changers are
discussed and presented. A single phase Tap-Changer using a GTO with antiparallel thyristor to perform switching of one
upward or downward transition is described in this paper. The logic of operation, simulation and experimental results for
resistive, inductive loads are presented.
Keywords: Voltage control, thyristors, tap-changer, loads.
1. Introduction
For more than 100 years on load tap changer was the
essential part in general electrical power installation. The
main task of on load tap changer is the ability to regulate
output voltage without any interruption on any electric
network. This can be done by monitoring the output voltage
and changing the turns ration between the primary and
secondary winding in order to change the level of the
secondary voltage. [1-3].
On-load Tap-Changers are used when load disconnection
is not acceptable, so its main task is to transfer the
transformer load current from one regulating winding
tapping to another without any interruption of the current
from the transformer to the load. However, on load tap
changer design has not radically changed in the past two
decades [4-6], mainly because the performance has always
matched the system requirement. In general, reliability has
been the main criterion for a good design to fulfil the
relatively slow automatic voltage control characteristics.
Hence the conventional mechanical arrangement using oil
breaks contactors has been adequate [2, 3],
The more recent innovations in Tap-Changer design
have been orientated towards eliminating contact wear and
oil pollution to improve reliability and reduce maintenance.
Various methods have been employed to reduce the arcing
which is accompanied at the contacts, however some contact
erosion and oil contamination still take place [2,3].
Conventional transformer Tap-Changers inserts
resistance or reactance during the switching operation, and
the three or four transition stages often required many cycles
of the supply frequency. Solid-state Tap-Changers eliminate
the need for switching resistors or reactors and operate in less
than one cycle eliminate the maintenance and minimize the
arcing associated with switching transition [6-8].
There are several conditions which are very important for
the design of the Tap-Changers [1,2]:
1- Transformer rating.
2- Number of taps.
3- Tap voltage.
Furthermore, current should not be interrupted during the
operation of the on load tap changer.
2. Tapping Winding Arrangement
To select the tapping range from the tap changer few
comment arrangements are used. Usually the leads from the
winding can be taken off to get required range of the tapping
[2,3]. Three methods are in common use for providing
tapping at neutral end of a high voltage winding.
2.1. Tapping by Coarse/fine
Figure 1 shows the general arrangement of the
Coarse/fine tapping. As can be seen from the figure a
winding extension (coarse part) set on the main winding and
controlled by changeover selector. The fine section is set on
the main tapping winding. The lead from the fine section is
brought out by a special rotary (one for odd and one for even

INTERNATIONAL JOURNAL of ENGINEERING TECHNOLOGIES Mohammad H. Taha, Vol.2, No.2, 2016
30
tapping).In this arrangement to cover the range for the
required tap , the gauged selectors operates in a sequential
operation manner and this would make two revolutions, one
revolution with the coarse section out of service and the other
after the operation of the range over sector.
Fig.1. Coarse/ fine tapping arrangement
2.2. Arrangement by reverse tapping winding
Figure 2 shows the reverse tapping method. In this
arrangement main winding could be boosted or bucked by
using a main winding tapping separator. (This can be done
by either increasing or decreasing the number of the main
winding section in order to change the voltage ratio).
General reverse tapping winding arrangement can be
done by tapping ten sections and using two selectors (one for
odd and one for even tapping)
Fig. 2. Reverse tapping winding
2.3. Linear arrangement
Figure 3 shows a linear tapping arrangement, it acts like a
linear potentiometer which changes the output voltage
linearly with the number of tapping. Two type selectors are
used for even and odd taps. This arrangement has the
advantage of the mechanical design simplicity.
Fig. 3. Linear tapping winding
3. Thyristors Tap Changer
To illustrate the principle of operation consider a single
phase, using two antiparallel thyristors for each tap as shown
in Figure 4 The sequence of events for switching up or down
when the load current and voltage are in phase or out of
phase is presented below. Switching up will be achieved
when operation of thyristors TH3 and TH4 (normal
operation) are transferred to thyristors TH1 and TH2, the
voltage will increase from VB to VA. Switching down will
be achieved when thyristors TH5 and TH6 are turned-on and
the other thyristors are turned-off, the voltage will decrease
to VC. In practice many operational requirements have to be
considered and appropriate strategies developed[7-9].
1-At least one pair of inverse parallel connected thyristors
must be gated prior to transformer energization.
2- Transient on the load current durring transformer
energization or a sudden changing of load.
3- A sudden change of load current in either magnitude
and/or phase immediately prior to a tap change instruction.
4- Transformer currents on over load
5- Systems faults. [10-12]
Fig. 4. Thyristors tap changer
First consider the load as a purely resistive (voltage and
current are in phase)and the circuit is initialized by gating
thyristors TH3 and TH4. Then the load current is:
t)(sin R
VB =
Li
(1)
To switch up, let TH1 be turned on at any time over a
positive half cycle. Then:
Kirchoff’s voltage law for the circuit mesh including
TH1 and TH2 gives:
V12 - V34 - VAB = 0 (2)
But V12 =0, therefore:
V34 = -VAB (3)

INTERNATIONAL JOURNAL of ENGINEERING TECHNOLOGIES Mohammad H. Taha, Vol.2, No.2, 2016
31
TH3 has a reverse voltage which is ready to commutate.
When TH2 is turned-on to conduct over the negative half
cycle, again V12 =0, for the circuit mesh including TH2 and
TH4 equation (2) and(3) apply. Because VAB < 0, and
therefore V34 > 0, TH4 will commutate and the upward
transition will take place.
For switching down, let again TH3 and TH4 be turned on
throughout alternate half cycles. Let TH5 be turned on at any
time over a positive half cycle, therefore:
Kirchoff’s voltage law for the circuit mesh including TH5
and TH6 gives:
V34 - V56 - VBC = 0 (4)
But V56 =0, therefore:
V34 = VBC (5)
Note that: V12, V34 and V56 are the voltage drop
across the devices for each tap.
Thus, TH3 will still has a forward voltage and does not
turn-off, a short circuit will occur which may damage the
system. To avoid the short circuit, TH5 and TH6 must be
gated at the instant when the voltage on tap B and tap C is
about to change their polarities. Furthermore another
important factor is the device turn-off time which affects the
phenomena of the switching. If TH3 has not yet deionized
completely, it can be forced into conduction if a forward
voltage exists across it. If the device can get its forward
blocking capability as soon as the current ceases, switching
down transition is accomplished by transferring the
conduction from TH3 to TH6 or TH4 to TH5.
The operation with inductive load is not as the same as
the resistive load, the current keeps flowing through the
device when a reverse voltage exists across it. There is a
limit time to switch up or down as illustrated below.
Let TH3 and TH4 again be turned-on through alternate
half cycles, then the load current is:
) -t (sin Z
VB =
Li
(6)
z2
R2
( L) (7)
1tanL
R (8)
Now let TH1 be turned on at time less than the
impedance angle φ because TH4 is still conducting (the load
current still negative) then V34 = 0, therefore the upper half
of the transformer secondary winding will be short circuited
through TH1 and TH4. TH1 may not be turned-on until the
load current becomes positive, similarly TH2 may not be
turned-on until the load current becomes negative. Thus an
upward transition can only takes place when the voltage and
current have the same polarities. Downward transition can
only take place when the voltage and the current have
opposite polarities.
4. GTOs/Thyristors Tap-Changer
The use of two antiparallel thyristors as an element
switch for a Tap-Changer associated with certain problems as
mentioned before mainly with switch down transition. To
tackle these problems a GTO with antiparallel thyristor for
each tap could be used. This allows switching up or down
could be happen at any time when the current flows through
the GTO. The block diagram for the circuit configuration is
shown in Figure 5, the GTO conducts over a positive half
cycle and the thyristor over a negative half cycle. Under
normal operation GTO2 and TH2 are gated, for switching up
transition let GTO1 be turned on by injecting a positive
current into its gate and let GTO2 be turned-off by applying
a negative voltage between its gate and cathode. At the same
time the driving pulses will be removed from the gate of TH2
and transferred to the gate of TH1, this will have a reverse
voltage which will turned it off. For switching down , first
GTO3 will turn-on and GTO2 will turn-off, TH3 will
conduct over the negative half cycle while TH2 will have a
reverse voltage which turned it off.
Fig. 5. GTOs/ Thyristors tap changer
A control circuit is designed to ensure that only one tap
operates at a time, switching up or down depends on the
level of the output voltage and current. These are sensed by
voltage and current transformer and feed back to the control
circuit via a switching logic circuit which in turn selects the
right pulses for the required tap.
Since the three GTOs have the same common point for
their cathodes, a single unit power supply is enough for their
driving circuits. Referring to Figure 5 witching up or down
could be achieved by two different way:
1- If the input voltage changes, the voltage and current
sensors produce signals which are the necessary condition for
switching transition. This type of control is very useful, the
load voltage could be set to a fixed value. Any variation in

INTERNATIONAL JOURNAL of ENGINEERING TECHNOLOGIES Mohammad H. Taha, Vol.2, No.2, 2016
32
the input voltage causes the switching logic circuit to choose
the right tap to keep the output constant, when the output
voltage increases, the normal operation is overridden and a
different mode of operation takes place. A voltage
transformer is used to sense the output voltage, when this
voltage is higher or lower than a reference voltage . the
controller automatically choose the switching condition and
upward or down ward command will be achieved.
2- Manual switching by choosing the required tap in the
transformer. For switching up or down three position slide
switches. When the selected switch is closed, its output
connects to the control circuit unit which in turn choose the
required tap. This type of control is very useful at low
voltage for an induction motor starting and can be switched
to a rated voltage by a touch of a switch.
5. Simulation and Experimental Results
A single-phase GTO / thyristor switched Tap-Changer as
shown in Figure 5, was simulated designed and built.
The circuit was designed with power flows in one
direction and for switching up or down one step at a time
(45V), the primary of the transformer is connected to 210V
RMS input voltage, the. The secondary of the transformer is
tapped from 0 to 115% of the primary voltage. Referring to
Figure 5, tap (B) is the normal operation which connected to
a point gives 100% the input, tap (A) is the upward transition
which connected to a point gives 115% the input voltage, and
finally tap (C) downward transition is connected to a point
which gives 85% of the input voltage. The circuit was tested
under various load conditions, Simulation results for the
waveforms of the load voltages and currents for resistive and
inductive loads are shown in Figures 6 to 9. Experimental
results are shown in figures 10 to 15.
Fig. 6. Switching up simulation, for input and output voltage
and current for resistive load
Fig. 7. Switching down simulation, for input and output
voltage and current for resistive load
Fig. 8. Switching up simulation, for input and output voltage
and current for inductive load
Fig. 9. Switching down simulation, for input and output
voltage and current for inductive load
Fig. 10. Load voltage (A) and current (B) for resistive load
(switching up)
Fig. 11. Load voltage (A) and current (B) for resistive load
(switching down)
Fig. 12. Load voltage (A) and current (B) for inductive load
(switching up)
INTERNATIONAL JOURNAL of ENGINEERING TECHNOLOGIES Mohammad H. Taha, Vol.2, No.2, 2016
33
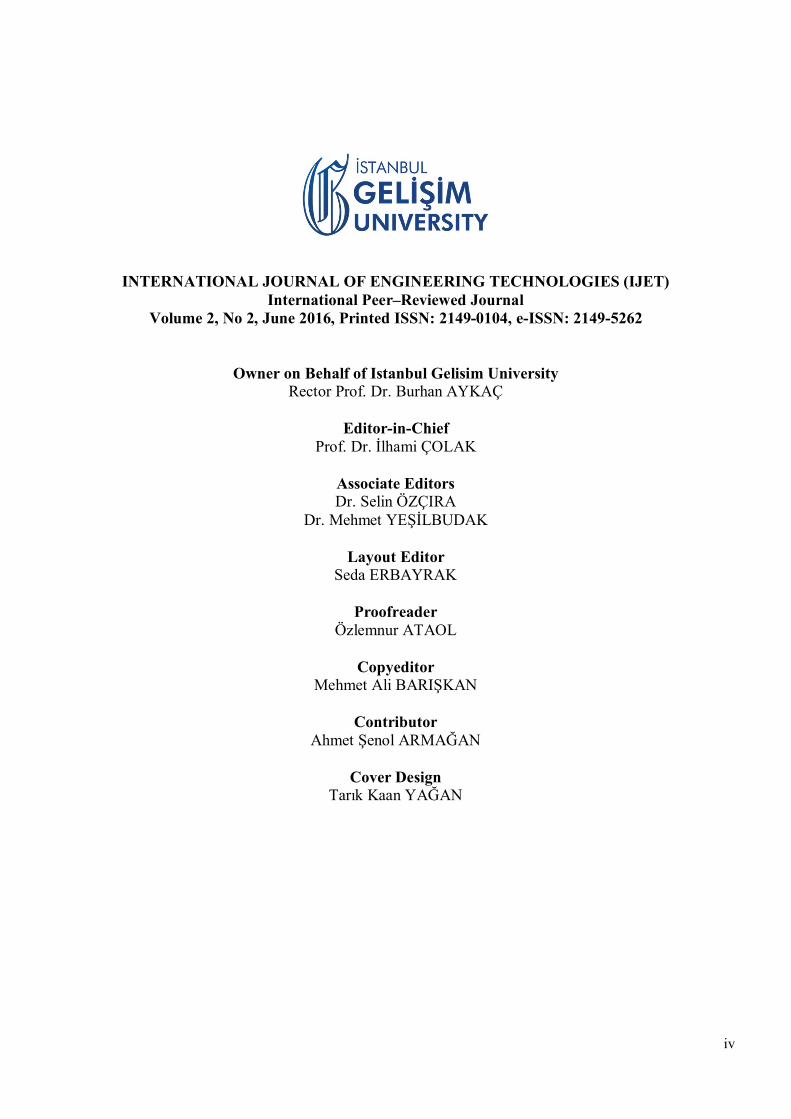
Fig. 13. Load voltage (A) and current (B) for inductive load
(switching down)
Fig. 14. GTO currents with resistive load (switching up)
A- Current through GTO1. B- Current through GTO2
Fig. 15. GTO currents with resistive load (switching down)
A- Current through GTO2, B- Current through GTO
6. Conclusion
The paper describes the operation of both GTO and
thyristor tap changers. For thyristors tap changer it was
illustrated that, switching up should be done when voltage
and current has the same direction and switching up when
they are in opposite direction otherwise a short circuit could
occur and damage the system. For GTO tape changer
switching up or down could be occurred at any time when
the GTO is conducting.
The circuit was responding satisfactorily to the switching
transition and this took place with a very low voltage
transient across the devices. It is possible to have multi-tap
transformers with power flows in either direction or
switching up or down to any required voltage within the
transformer rating. A microprocessor control could be
engaged for deciding the switching and could be used in the
electrical distribution networks which would replace the
conventional on load Tap-Changes which are extremely
expensive and require frequent maintenance.
PSIM software tools used to simulate the proposed tap
changer, this verified the performance of the controller of the
tap changer. Experimental results showed the system
behaviour against any change of the input voltage.
References
[1] R. Feinberg, “Modern Power Transformer Practice”,
Macmillan Press Ltd, 1979.
[2] D. O’kelly and G. Musgrave, “An Appraisal of
Transformer Tap-Changing Technique”, IEEE
Conference Publication, no. 137, pp. 105-109, Jan. 1973.
[3] A.F. Plessis, “Microprocessor Based Power Transformer
Voltage Control Scheme”, IFAC Symp, Pretoria, South
Africa, pp. 165-172, September 1980.
[4] H. Jiang, R. Shuttleworth, B.A.T. Al Zahawi, X. Tian,
and A. Power, “Fast response GTO assisted novel tap-
changer”, IEEE Trans. Power Del., vol. 16, no. 1, pp.
111–115, Jan. 2001.
[5] R. Shuttleworth, X. Tian, C. Fan, and A. Power, “New
tap changing scheme”, Inst. Elect. Eng., Electic Power
Applications, vol. 143, no. 1, pp. 108–112, Jan. 1996.
[6] J. Harlow, “Discussion of Fast response GTO assisted
novel tap changer”, IEEE Trans. Power Del., vol. 16, no.
4, pp. 826–827, Oct. 2001.
[7] G.H. Cooke and K.T. Williams, “Thyristor assisted on-
load tap-changers for transformers”, Power Electronics
and Variable-Speed Drives, pp. 127–131, Jul. 1990.
[8] G. H. Cooke and K. T. Williams “New thyristor assisted
diverter switch for on-load transformer tap-changers”,
Inst. Elect. Eng., Electric Power Applications, vol.139,
no. 6, pp. 507–511, Nov. 1992.
[9] T. Larsson, R. Innanen, and G. Norstrom, “Static
electronic tap-changer for electric machines and voltage
control”, IEEE Fast Phase and Drives Conf., May 1997,
pp. TC3/4.1–TC3/4.3.
[10] V. Sanchez, R. Echavarria, M. Cotoragea and A.
Claudio, “Design and implementation of a fast on-load
tap-changing regulator using soft-switching
commutation techniques”, PESC, pp. 488–493, Jun.
2000.
[11] R. Echavarria, V. Sanchez, M. Ponce, M. Cotorogea,
and A. Claudio, “Analysis and design of a
quasiresonant fast on-load tap changing regulator”, J.
Circuit, Syst, Comput., vol. 13, no. 4, Aug. 2004.
[12] R. Echavarria, V. Sanchez, M. Ponce, A. Claudio and
M. Cotorogea, “Parametric analysis of a quasiresonant
fast on-load tap-changing regulator”, PESC, 2002, pp.
1809–1814.
INTERNATIONAL JOURNAL of ENGINEERING TECHNOLOGIES Oluwaseun Adedokun et al., Vol.2, No.2, 2016
34
Review on Natural Dye-Sensitized Solar Cells
(DSSCs)
Oluwaseun Adedokun‡, Kamil Titilope, Ayodeji Oladiran Awodugba
Department of Pure and Applied Physics, Ladoke Akintola University of Technology, P.M.B. 4000, Ogbomoso, Nigeria
([email protected], [email protected], [email protected])
‡Corresponding Author: Oluwaseun Adedokun, Department of Pure and Applied Physics, Ladoke Akintola University of
Technology, P.M.B. 4000, Ogbomoso, Nigeria, Tel: +2347031195750, [email protected]
Received: 22.03.2016 Accepted: 25.04.2016
Abstract-In a conversion system of pure and non-convectional solar energy to electricity, dye sensitized solar cells (DSSCs)
encourage the fabrication of photovoltaic devices providing high conversion efficiency at low cost. The dye as a sensitizer
plays a vital role in performance evaluation of DSSCs. Natural dyes (organic dyes) has come to be a worth-while substitute to
the rare and expensive inorganic sensitizers because of its cost effective, extreme availability and biodegradable. Different
parts of a plant like fruits, leaves, flowers petals and bark have been tested over the years as sensitizers. The properties,
together with some other parameters of these pigments give rise to improve in the operation standard of DSSCs. This review
hash-out the history of DSSC with a focus on the recent developments of the natural dyes applications in this specific area with
their overall appearance, the various components and the working principle of DSSCs as well as the work done over the years
on natural dye based DSSCs.
Keywords: Natural dye, DSSCs, photovoltaic device, Photo-electrode, photo-sensitizer.
1. Introduction
Solar energy provides a clean, renewable and cheaper
energy source for human race, while serving as a primary
energy source for another type of energy sources, namely;
wind energy, water, bio-energy and fossil fuel. The solar
cells used in harvesting the solar power are commonly
categorized into different types in respect to the composition
of their material e.g organic dye solar cells, non-crystal,
multiple crystal, and single crystal silicon solar cells. A solar
cell usually signifies the cell that is made from silicon crystal
material. Nevertheless, the production cost of the solar cells
based on silicon crystal material compared to the dye-
sensitized solar cells (DSSCs) is high. DSSCs have triggered
a great attention and they are of powerful interest due to the
advantages of its lower cost of manufacturing.
DSSCs are devices that convert solar to electric energy
by light sensitization established on wide energy band
semiconductor [1]. DSSC shows a very promising future in
the field of photovoltaic cells [2, 3]. DSSC also known as
Grätzel cell is a new type of solar cell [4], and have attracted
a great interest due to their minimal production cost, and
environmental friendliness. DSSC comprises of a counter
electrode, an electrolyte containing iodide and triiodide ions,
and a nano-crystalline porous semiconductor electrode-
absorbed dye. The dye which acts as sensitizers in DSSCs
plays an important task in absorption and conversion of
incident light ray to electricity.
Dyes are classified into organic (natural dye) and
inorganic dye. Inorganic dyes such as Ruthenium (Ru) dyes
are presently known to be the most significant dye for the
fabrication of DSSCs with great efficiency. However, they
are quite expensive and difficult in their purification.
Therefore, in finding alternative to the expensive and rare
inorganic sensitizers, natural dyes are considered as the best
viable alternative. The main advantages of using natural
pigment as sensitizer in DSSCs are low fabrication cost, easy
achievability, low time of energy payback, flexibility,
availability supply of raw materials, non-environmental risk,
and great performance at diffuse light and multicolor options.
Different parts of plant e.g leaves, flowers petal and barks
have been examined as sensitizers [5]. The nature and some
other parameters of these pigments gave rise to varying
performance in their efficiency [5].
The operations of DSSCs are based on the photo-
sensitization created by the dyes on wide band-gap
mesoporous metal oxide semiconductors; this sensitization is
INTERNATIONAL JOURNAL of ENGINEERING TECHNOLOGIES Oluwaseun Adedokun et al., Vol.2, No.2, 2016
35
due to the dye absorption of part of the visible light spectrum
[6, 7]. The use of natural pigments as sensitizing dye for the
transformation of solar to electric energy is remarkable
because, it enhances the economical aspect and in addition, it
has important advantages from the environmental perspective
[8, 9]. DSSCs became more interesting since large
collections of dye including natural dye can be used as light
harvesting elements to provide the charge carriers. This
review hash-out the history of DSSC with a focus on the
recent developments of the natural dyes applications in this
specific area with their overall appearance, the various
components and the working principle of DSSCs as well as
the work done over the years on natural dye based DSSCs.
2. Structure and Operation of DSSCs
2.1. Structure of DSSC
DSSC differs from other solar cell devices both by its
basic construction and the physical processes behind its
operation. In contrast to the first and second generation, PV
devices based on solid-state semiconductor materials, the
typical DSSC arrangement combines liquid and solid phases.
DSSC comprises of a transparent conducting glass electrode
(anode) that allows the passage light through the cell [11,
12]. Transparent glasses are used as electrode substrates due
of their availability, affordable cost, and great transparency
in the visible spectrum. The fluorine tin dioxide F:SnO2
coating has a transparent conductive face. The mesh titanium
nanoparticle TiO2 acts as a dye container, and provides
electron passage through the cell. The TiO2 particles are
coated with dye molecules (light sensitizer) that convert
photons into excited electrons and cause current to flow. The
dye is surrounded by the electrolyte layer (usually iodide)
that acts as a source to compensate the lost electron. The
counter electrodes (cathode) on the other side of the cell are
typically coated with platinum or graphite.
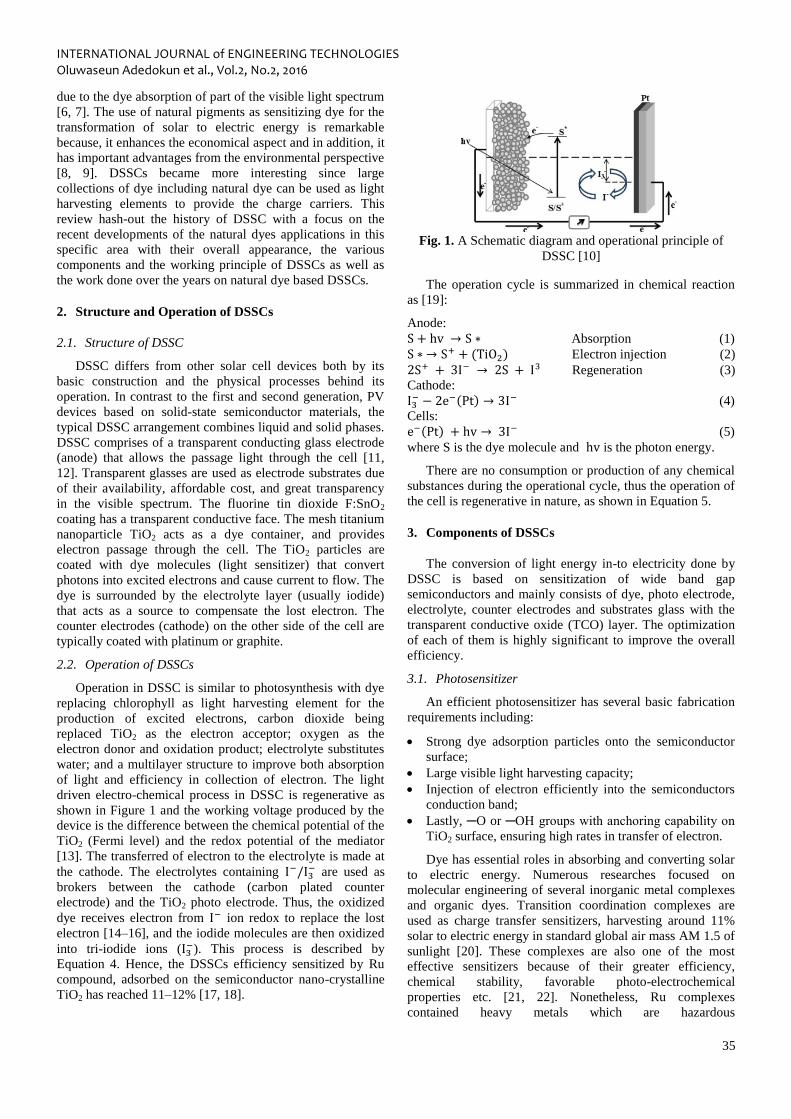
2.2. Operation of DSSCs
Operation in DSSC is similar to photosynthesis with dye
replacing chlorophyll as light harvesting element for the
production of excited electrons, carbon dioxide being
replaced TiO2 as the electron acceptor; oxygen as the
electron donor and oxidation product; electrolyte substitutes
water; and a multilayer structure to improve both absorption
of light and efficiency in collection of electron. The light
driven electro-chemical process in DSSC is regenerative as
shown in Figure 1 and the working voltage produced by the
device is the difference between the chemical potential of the
TiO2 (Fermi level) and the redox potential of the mediator
[13]. The transferred of electron to the electrolyte is made at
the cathode. The electrolytes containing I−/I3− are used as
brokers between the cathode (carbon plated counter
electrode) and the TiO2 photo electrode. Thus, the oxidized
dye receives electron from I− ion redox to replace the lost
electron [14–16], and the iodide molecules are then oxidized
into tri-iodide ions (I3−). This process is described by
Equation 4. Hence, the DSSCs efficiency sensitized by Ru
compound, adsorbed on the semiconductor nano-crystalline
TiO2 has reached 11–12% [17, 18].
Fig. 1. A Schematic diagram and operational principle of
DSSC [10]
The operation cycle is summarized in chemical reaction
as [19]:
Anode:
S + hv → S ∗ Absorption (1)
S ∗ → S+ + (TiO2) Electron injection (2)
2S+ + 3I− → 2S + I3 Regeneration (3)
Cathode:
I3− − 2e−(Pt) → 3I− (4)
Cells:
e−(Pt) + hv → 3I− (5)
where S is the dye molecule and hv is the photon energy.
There are no consumption or production of any chemical
substances during the operational cycle, thus the operation of
the cell is regenerative in nature, as shown in Equation 5.
3. Components of DSSCs
The conversion of light energy in-to electricity done by
DSSC is based on sensitization of wide band gap
semiconductors and mainly consists of dye, photo electrode,
electrolyte, counter electrodes and substrates glass with the
transparent conductive oxide (TCO) layer. The optimization
of each of them is highly significant to improve the overall
efficiency.
3.1. Photosensitizer
An efficient photosensitizer has several basic fabrication
requirements including:
Strong dye adsorption particles onto the semiconductor
surface;
Large visible light harvesting capacity;
Injection of electron efficiently into the semiconductors
conduction band;
Lastly, ─O or ─OH groups with anchoring capability on
TiO2 surface, ensuring high rates in transfer of electron.
Dye has essential roles in absorbing and converting solar
to electric energy. Numerous researches focused on
molecular engineering of several inorganic metal complexes
and organic dyes. Transition coordination complexes are
used as charge transfer sensitizers, harvesting around 11%
solar to electric energy in standard global air mass AM 1.5 of
sunlight [20]. These complexes are also one of the most
effective sensitizers because of their greater efficiency,
chemical stability, favorable photo-electrochemical
properties etc. [21, 22]. Nonetheless, Ru complexes
contained heavy metals which are hazardous
INTERNATIONAL JOURNAL of ENGINEERING TECHNOLOGIES Oluwaseun Adedokun et al., Vol.2, No.2, 2016
36
environmentally, aside from their complicated and expensive
synthesis. Moreover, Ru complexes have the tendency to
degrade in the presence of water [4, 23-24].
Grätzel and his group developed many Ru complex
photosensitizers [22] which represent the most efficient
sensitizers (̴ 11%) because of their intense range of
absorption from the visible to the near-infrared region [25,
26]. Regardless of their chemical stability and the possible
exchange of charging with semiconducting solids, Ru
complexes have large visible light-harvesting capacity which
makes them a wise choice for the manufacture of solar
energy conversion devices [27, 28].
3.2. Electrolytes
The electrolyte plays a very essential role in the DSSC by
enabling the transport of charge between the photo-electrode
and counter electrode. The ideal electrolyte solvent is one
that has small vapor pressure, very low viscosity, high
dielectric properties and high boiling point. From industrial
point view, factor like easy processing, robustness (chemical
inertness), and environmental sustainability are also
important. Presently, the most successful redox mediator
used in DSSC includes a liquid electrolyte containing the
redox couple iodide/triiodide. The redox electrolyte
comprises of iodine, iodides and often additional additives.
Ionic liquids are promising alternative electrolytes which
provide advantages like high thermal and chemical stability,
non-volatility, and excellent ionic conductivity. Finding a
superior redox couple is one of the main challenges for future
DSSCs research.
3.3. Conductive Glass or Substrates
Clear conductive glasses are usually employed as
substrate due to their relatively minimal cost, abundant in
supply, high optical. Conductive coating is made by
deposition of one side of the substrate in form of thin
transparent conductive oxide (TCO). This layer is crucial
because it enables the penetration of sunlight into the cell
while conducting electron carriers to outer circuit. The
conductive film ascertain a very low electrical resistance of
about 10-20 Ω per square at room temperature. The
nanostructure wide band gap oxide semiconductor (electron
acceptor) is applied on the conductive side.
3.4. Photo-Electrode
The photo-electrode in a DSSC comprises of a
nanostructure semiconductor materials, clipped to a
transparent conducting substrate. The most widely used
semiconductor material is TiO2 because TiO2 is an
inexpensive, nontoxic and abundant material. The electrode
comprises of interconnected nanoparticles, with size ranging
between 15-30 nm. They appear as a transparent porous
electrode, with an average thickness of 10-15 μm. The
deposition techniques mainly employed for the film
preparation are screen printing and doctor blading. Both
methods involve the deposition of viscous colloidal TiO2
onto a substrate before sintering process. Sintering is
commonly carried out at temperatures of 450-500 ºC. The
high temperature results in electrical interconnection among
the nanoparticles, and eventually forms the nanostructure
porous electrode. The sensitization of dye is performed by
dipping the electrode into a dye solution for some time.
3.5. Counter Electrode
The counter electrode is an essential component in DSSC
where the reduction of mediator takes place. It comprises of
fluorine-doped tin oxide (FTO), glass coated with platinum
to ensure more reversible transfer of electron. The counter
electrode enables electrons transfer coming from the external
circuit back to the redox electrolyte. Furthermore, it serves to
carry the photo-current over the width of each solar cell.
Therefore, the counter electrode must be conducting
efficiently and show a low over-voltage for redox couple
reduction. Until now, platinum (Pt) has been the desired
material for the counter electrode because of its excellent
performance in reduction of I3− [29].
4. Reviews of Dyes Used in DSSCs
The dyes applied in DSSCs are categorized into two
types which are organic and inorganic dyes. Inorganic dyes
comprises of metal complex, e.g polypyridyl complexes of
Ruthenium and Osmium, metal porphyrin, phthalocyanine
and inorganic quantum dots, while organic dye comprises of
natural and synthetic dyes.
4.1. Natural Dye Sensitizers
Another type of dye sensitizers used is the organic or
natural dye. Natural dyes offers a suitable alternative to high
cost inorganic based DSSCs. Naturally, the fruits, flowers
and leafs of plant shows different colors from red to purple
and include different natural dyes which can be extracted
using simple procedure and used for DSSC fabrication [30].
Consideration have been made on natural pigments as a
promising alternative sensitizer dyes for DSSC because of
their simple production technique, affordable cost, complete
biodegradation, easy availability, purity grade, environmental
friendly, high reduction of noble metal, and chemical
synthesis cost [31–33]. Plant pigmentation results from the
electronic structure of pigments reacting with sunlight to
change the wavelengths as may be perceived by the viewer.
The pigment can be described by the maximum absorption
wavelength (λmax) [34]. The performance of natural dye
sensitizer in DSSC has been estimated using fill factor (FF),
energy conversion efficiency (η) (Jsc), open circuit voltage
(Voc), and short circuit current. Many parts of a plant have
been tested by Researchers (see Table 1) and various useful
dyes have been highlighted as photo-sensitizers for DSSC
from natural products [35-42].
Common pigments are (a) Betalains (b) Carotenoids (c)
Chlorophyll and (d) Flavonoids as Anthocyanins etc.
Structures of some natural dyes employed in DSSCs are
shown in Figure 2, 3 and 4.
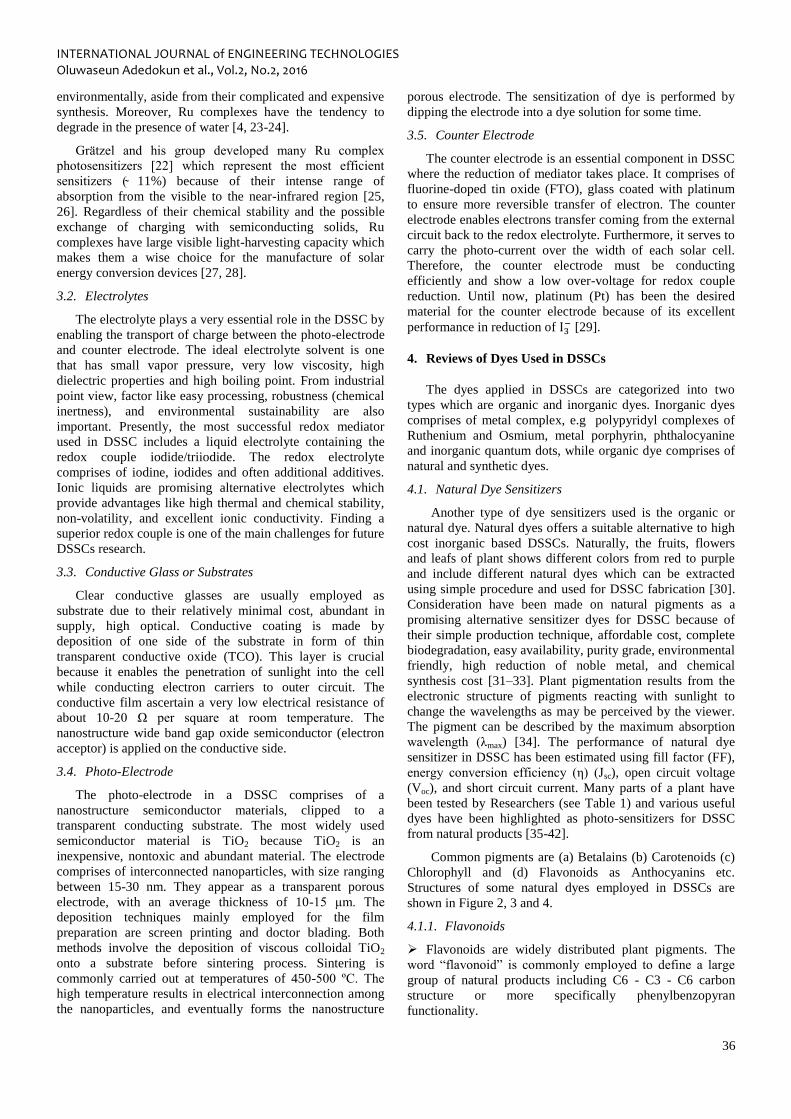
4.1.1. Flavonoids
Flavonoids are widely distributed plant pigments. The
word “flavonoid” is commonly employed to define a large
group of natural products including C6 - C3 - C6 carbon
structure or more specifically phenylbenzopyran
functionality.

INTERNATIONAL JOURNAL of ENGINEERING TECHNOLOGIES Oluwaseun Adedokun et al., Vol.2, No.2, 2016
37
Table 1. Photovoltaic parameters of natural dye based DSSCs
Natural dyes Jsc (mAcm-2
) Voc (V) FF Efficiency (%) References
Bougainvillea 2.10 0.30 0.57 0.36 35
Sicilian Indian 2.70 0.38 0.54 0.50
Perilla 1.36 0.522 0.69 0.50 36
Tangerine peel 0.74 0.592 0.63 0.28
Petunia 0.85 0.616 0.60 0.32
Yellow rose 0.74 0.609 0.57 0.26
Violet 1.02 0.498 0.64 0.33
Begonia 0.63 0.537 0.72 0.24
Flowery knotweed 0.60 0.554 0.62 0.21
Lily 0.51 0.498 0.67 0.17
Fructus lycii 0.53 0.689 0.46 0.17
Mangosteen pericap 2.69 0.686 0.63 1.17
Bauhinia tree 0.96 0.572 0.66 0.36
Rhododendron 1.61 0.585 0.61 0.57
Chinese rose 0.90 0.483 0.62 0.27
Cofee 0.85 0.559 0.68 0.33
Marigold 0.51 0.542 0.83 0.23
Lithospermum 0.14 0.337 0.58 0.03
Rose 0.97 0.595 0.66 0.38
Mixed rosella blue pea 0.82 0.38 0.47 0.15 37
Kelp 0.43 0.44 0.62 38
Capsicum 0.23 0.41 0.63
Black rice 1.14 0.55 0.52
Rosa xanthina 0.64 0.49 0.52
Erythrina variegate 0.78 0.48 0.55
Annatto 0.53 0.56 0.66 0.19 39
Bixin 1.10 0.57 0.59 0.37
Norbixin 0.38 0.53 0.64 0.13
Crocin 0.45 0.58 0.60 0.16 40
Crocetin 2.84 0.43 0.46 0.56
Syrup of Calafate 1.50 0.38 0.2 41
Fruit of Calafate 6.20 0.47 0.36
Skin of Jaboticaba 7.20 0.59 0.54
Nerium olender 2.46 0.41 0.59 0.59 42
Hibiscus rosasinesis 4.04 0.40 0.63 1.02
Hibiscus surattensis 5.45 0.39 0.54 1.14
Ixora macrothyrsa 1.31 0.40 0.57 0.30
Sesbania grandiflora 4.40 0.41 0.57 1.02
INTERNATIONAL JOURNAL of ENGINEERING TECHNOLOGIES Oluwaseun Adedokun et al., Vol.2, No.2, 2016
38
Over 5000 naturally occurring flavonoids have been
extracted from various plants, and divided according to their
chemical structure as follows: flavonols, flavones,
flavanones, isoflavones, catechins, anthocyanin, and
chalcones. There are three classes of flavonols which are:
flavonoids (2-phenylbenzopyrans), isoflavonoids (3-
benzopyrans), and neoflavanoids (4-bezopyrans). Flavonoids
contain 15-carbon (C15) based structure with two phenyl-
rings joined by three carbon bridges, forming a third ring.
The phenyl ring oxidation degree (C-ring) identifies the
different colors of flavonoids. However, not all flavonoids
have the capability of absorbing visible light, although they
have similar structures. Flavonoid molecules are
characterized by loose electrons; thus, the energy required
for electron excitation to LUMO is lowered, allowing visible
light to energize the pigment molecules. Flavonoids regularly
occur in fruits, where animals that feed and diffuse the seeds
of fruits are attracted, as well as in flowers where insect
pollinators are attracted. Many flavones and flavonols absorb
radiations most concentrated in ultraviolet (UV) region
forming special UV patterns on flowers which are visible to
bees. They are also present in the leaves of many species,
where they protect plants by screening out harmful
ultraviolet radiation from the Sun. Flavonols, Anthocyanins,
and proanthocyanidins are three major subcategories of
flavonoid compounds.
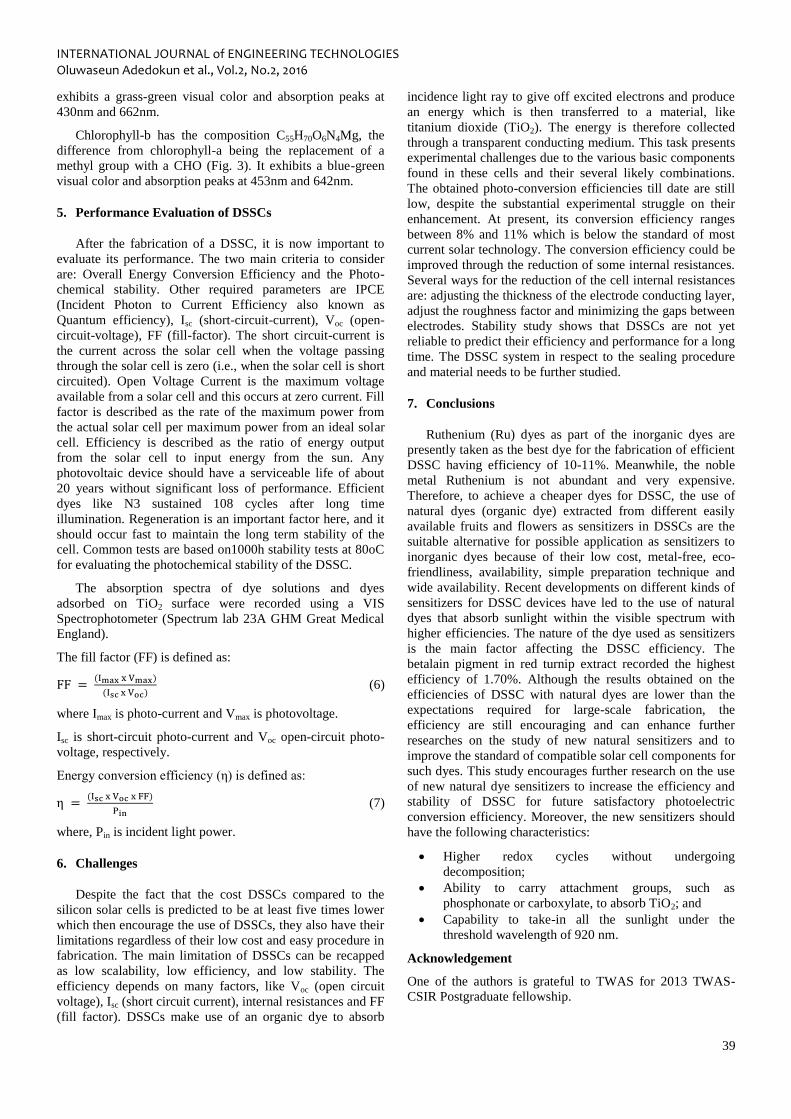
4.1.2. Carotenoids
Carotenoids are organic pigments found in both
chloroplasts and chromoplasts of plants and some other
photosynthetic organisms, including some fungi and bacteria.
Carotenoids play two important roles in plants and algae:
absorption of light energy for use in photosynthesis, and
protection of chlorophyll from photo-damage [43].
Carotenoid pigments do make provisions for many flowers
and fruits with typically red, yellow and orange colors, and
numbers of carotenoid derived aromas. There are over 600
carotenoids known and are divided into two categories;
carotenes (pure hydrocarbons) and xanthophylls (which
contain oxygen). All carotenoids are tetraterpenoids,
meaning that they are produced from 8 isoprene molecules
and contain 40 carbon atoms. Generally, carotenoids absorb
wavelengths ranging from 400-550 nanometers (violet to
green light).
Fig. 2. Structure of Flavonoid (Anthocyanin)
Fig. 3. Structure of Chlorophyll a and b
Fig. 4. Structure of carotenoids
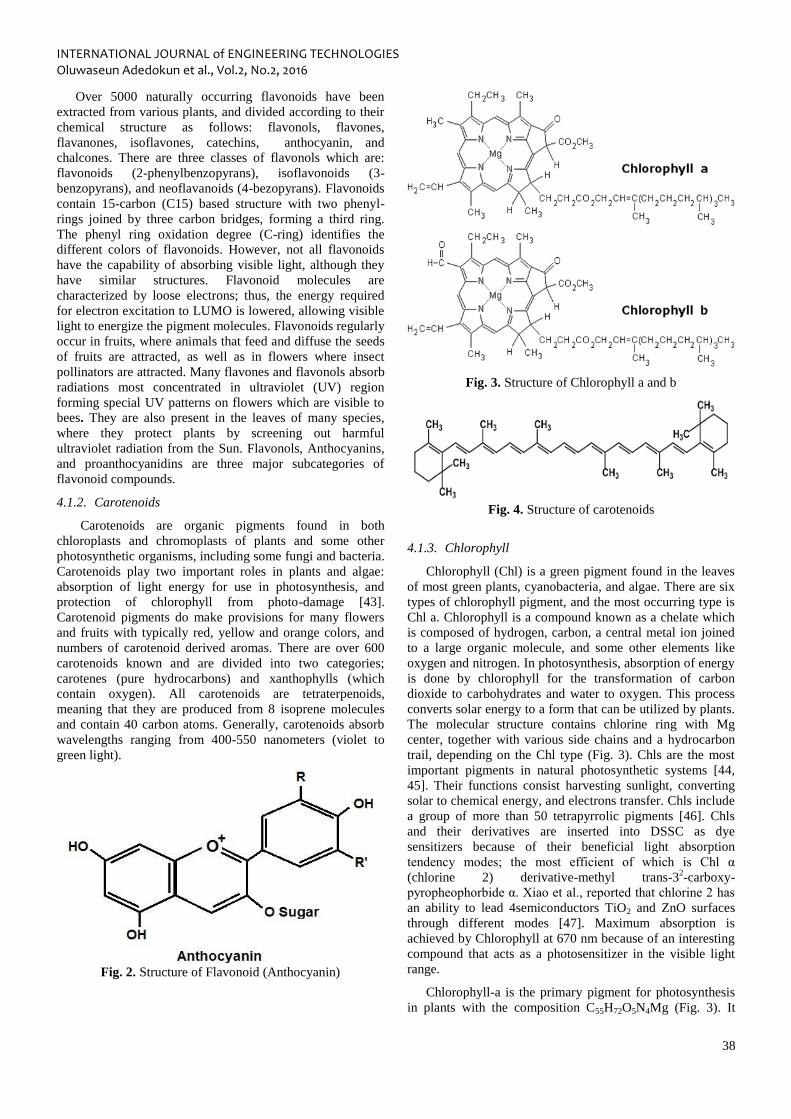
4.1.3. Chlorophyll
Chlorophyll (Chl) is a green pigment found in the leaves
of most green plants, cyanobacteria, and algae. There are six
types of chlorophyll pigment, and the most occurring type is
Chl a. Chlorophyll is a compound known as a chelate which
is composed of hydrogen, carbon, a central metal ion joined
to a large organic molecule, and some other elements like
oxygen and nitrogen. In photosynthesis, absorption of energy
is done by chlorophyll for the transformation of carbon
dioxide to carbohydrates and water to oxygen. This process
converts solar energy to a form that can be utilized by plants.
The molecular structure contains chlorine ring with Mg
center, together with various side chains and a hydrocarbon
trail, depending on the Chl type (Fig. 3). Chls are the most
important pigments in natural photosynthetic systems [44,
45]. Their functions consist harvesting sunlight, converting
solar to chemical energy, and electrons transfer. Chls include
a group of more than 50 tetrapyrrolic pigments [46]. Chls
and their derivatives are inserted into DSSC as dye
sensitizers because of their beneficial light absorption
tendency modes; the most efficient of which is Chl α
(chlorine 2) derivative-methyl trans-32-carboxy-
pyropheophorbide α. Xiao et al., reported that chlorine 2 has
an ability to lead 4semiconductors TiO2 and ZnO surfaces
through different modes [47]. Maximum absorption is
achieved by Chlorophyll at 670 nm because of an interesting
compound that acts as a photosensitizer in the visible light
range.
Chlorophyll-a is the primary pigment for photosynthesis
in plants with the composition C55H72O5N4Mg (Fig. 3). It
INTERNATIONAL JOURNAL of ENGINEERING TECHNOLOGIES Oluwaseun Adedokun et al., Vol.2, No.2, 2016
39
exhibits a grass-green visual color and absorption peaks at
430nm and 662nm.
Chlorophyll-b has the composition C55H70O6N4Mg, the
difference from chlorophyll-a being the replacement of a
methyl group with a CHO (Fig. 3). It exhibits a blue-green
visual color and absorption peaks at 453nm and 642nm.
5. Performance Evaluation of DSSCs
After the fabrication of a DSSC, it is now important to
evaluate its performance. The two main criteria to consider
are: Overall Energy Conversion Efficiency and the Photo-
chemical stability. Other required parameters are IPCE
(Incident Photon to Current Efficiency also known as
Quantum efficiency), Isc (short-circuit-current), Voc (open-
circuit-voltage), FF (fill-factor). The short circuit-current is
the current across the solar cell when the voltage passing
through the solar cell is zero (i.e., when the solar cell is short
circuited). Open Voltage Current is the maximum voltage
available from a solar cell and this occurs at zero current. Fill
factor is described as the rate of the maximum power from
the actual solar cell per maximum power from an ideal solar
cell. Efficiency is described as the ratio of energy output
from the solar cell to input energy from the sun. Any
photovoltaic device should have a serviceable life of about
20 years without significant loss of performance. Efficient
dyes like N3 sustained 108 cycles after long time
illumination. Regeneration is an important factor here, and it
should occur fast to maintain the long term stability of the
cell. Common tests are based on1000h stability tests at 80oC
for evaluating the photochemical stability of the DSSC.
The absorption spectra of dye solutions and dyes
adsorbed on TiO2 surface were recorded using a VIS
Spectrophotometer (Spectrum lab 23A GHM Great Medical
England).
The fill factor (FF) is defined as:
FF = (Imax x Vmax)
(Isc x Voc) (6)
where Imax is photo-current and Vmax is photovoltage.
Isc is short-circuit photo-current and Voc open-circuit photo-
voltage, respectively.
Energy conversion efficiency (η) is defined as:
η = (Isc x Voc x FF)
Pin (7)
where, Pin is incident light power.
6. Challenges
Despite the fact that the cost DSSCs compared to the
silicon solar cells is predicted to be at least five times lower
which then encourage the use of DSSCs, they also have their
limitations regardless of their low cost and easy procedure in
fabrication. The main limitation of DSSCs can be recapped
as low scalability, low efficiency, and low stability. The
efficiency depends on many factors, like Voc (open circuit
voltage), Isc (short circuit current), internal resistances and FF
(fill factor). DSSCs make use of an organic dye to absorb
incidence light ray to give off excited electrons and produce
an energy which is then transferred to a material, like
titanium dioxide (TiO2). The energy is therefore collected
through a transparent conducting medium. This task presents
experimental challenges due to the various basic components
found in these cells and their several likely combinations.
The obtained photo-conversion efficiencies till date are still
low, despite the substantial experimental struggle on their
enhancement. At present, its conversion efficiency ranges
between 8% and 11% which is below the standard of most
current solar technology. The conversion efficiency could be
improved through the reduction of some internal resistances.
Several ways for the reduction of the cell internal resistances
are: adjusting the thickness of the electrode conducting layer,
adjust the roughness factor and minimizing the gaps between
electrodes. Stability study shows that DSSCs are not yet
reliable to predict their efficiency and performance for a long
time. The DSSC system in respect to the sealing procedure
and material needs to be further studied.
7. Conclusions
Ruthenium (Ru) dyes as part of the inorganic dyes are
presently taken as the best dye for the fabrication of efficient
DSSC having efficiency of 10-11%. Meanwhile, the noble
metal Ruthenium is not abundant and very expensive.
Therefore, to achieve a cheaper dyes for DSSC, the use of
natural dyes (organic dye) extracted from different easily
available fruits and flowers as sensitizers in DSSCs are the
suitable alternative for possible application as sensitizers to
inorganic dyes because of their low cost, metal-free, eco-
friendliness, availability, simple preparation technique and
wide availability. Recent developments on different kinds of
sensitizers for DSSC devices have led to the use of natural
dyes that absorb sunlight within the visible spectrum with
higher efficiencies. The nature of the dye used as sensitizers
is the main factor affecting the DSSC efficiency. The
betalain pigment in red turnip extract recorded the highest
efficiency of 1.70%. Although the results obtained on the
efficiencies of DSSC with natural dyes are lower than the
expectations required for large-scale fabrication, the
efficiency are still encouraging and can enhance further
researches on the study of new natural sensitizers and to
improve the standard of compatible solar cell components for
such dyes. This study encourages further research on the use
of new natural dye sensitizers to increase the efficiency and
stability of DSSC for future satisfactory photoelectric
conversion efficiency. Moreover, the new sensitizers should
have the following characteristics:
Higher redox cycles without undergoing
decomposition;
Ability to carry attachment groups, such as
phosphonate or carboxylate, to absorb TiO2; and
Capability to take-in all the sunlight under the
threshold wavelength of 920 nm.
Acknowledgement
One of the authors is grateful to TWAS for 2013 TWAS-
CSIR Postgraduate fellowship.
INTERNATIONAL JOURNAL of ENGINEERING TECHNOLOGIES Oluwaseun Adedokun et al., Vol.2, No.2, 2016
40
References
[1] M. Gratzel, (2003) Dye-sensitized solar cells, J.
Photochem. Photobiol. C, 4: 145-153.
[2] B. O’Regan, M. Gratzel, (1991) A Low-cost high-
efficiency solar cell based on dye-sensitized colloidal TiO2
films, Nature, 353: 737-740.
[3] J. O. Ozuomba, A. J. Ekpunobi, P. I. Ekwo, (2011) The
viability of prophyrin local dye in the fabrication of dye-
sensitized solar cells, Digest J. Nanomaterials and
Biostructures, 6(3): 1043 – 1051.
[4] M. Gratzel, (1991) Review article photo-electrochemical
Cells, Nature 414, 338–344.
[5] M.R. Narayan, (2012) Review: Dye sensitized Solar Cells
based on natural photosensitizers, Renewable and
Sustainable Energy Reviews 16:208– 215.
[6] M. Grätzel, (2005) Solar Energy Conversion by Dye-
Sensitized Photovoltaic Cells, Inorg. Chem. 44: 6841-6851.
[7] N.M. Gómez-Ortíz, I.A. Vázquez-Maldonado, A.R.
Pérez-Espadas, G.J. Mena-Rejón, J.A. Azamar-Barrios, G.
Oskam, (2009) Dye-sensitized solar cells with natural dyes
extracted from a chiote seeds. Sol. Energy Mater. Sol. Cells,
94: 40-44.
[8] A. Kay and M. Gratzel, (1993) Natural Pigment-Based
Dye-Sensitized Solar Cells, J. Phys. Chem., 97 (23): 6272–
6277.
[9] M. K. Nazeeruddin, A. Kay, I. Rodicio, (1993)
Conversion of light to electricity by cis-X2bis(2,2'-bipyridyl-
4,4'-dicarboxylate) ruthenium(II) charge-transfer sensitizers
(X = Cl-, Br-, I-, CN-, and SCN-) on nanocrystalline titanium
dioxide electrodes, J. Amer. Chem. Soc., 115 (14): 6382-
6390.
[10] I. Jinchu, C.O Sreekala, K.S. Sreelatha, (2014) Dye
sensitized solar cells using Natural dyes as chromophores –
Review, Material Science Forum 741: 39-51.
[11] C. Bauer, G. Boschloo, E. Mukhtar, A. Hagfeldt, (2002)
Interfacial electron-transfer dynamics in Ru(tcterpy)(NCS)3-
sensitized TiO2 nanocrystalline solar cells. J PhysChem B,
106:12693–704.
[12] L. Antonio, S. Hegedus, (2003) Handbook of
photovoltaic science and engineering. 1st ed.. UK: John
Wiley & Sons Ltd Publishers
[13] N.J. Cherepy, G.P. Smestad, M. Grätzel, J.Z. Zhang,
(1997) Ultrafast electron injection: implications for a photo-
electrochemical cell utilizing an anthocyanin dye-sensitized
TiO2 nano-crystalline electrode. Journal of Physical
Chemistry; 101: 9342–51.
[14] G.P. Smestad, (1998) Education and solar conversion:
demonstrating electron transfer, Sol Energy Mater Sol Cells;
55:157–78.
[15] G. Calogero, G.D. Marco, (2008) Red Sicilian orange
and purple eggplant fruite as natural sensitizers for dye-
sensitized solar cells, Sol Energy Mater Sol Cells; 92:1341–
6.
[16] C. Bauer, G. Boschloo, E. Mukhtar, A. Hagfeldt (2002)
Ultrafast studies of electron injection in Ru dye sensitized
SnO2 nanocrystalline thin film, Int. J Photo- energy; 4:17–20.
[17] Y. Chiba, A. Islam, Y. Watanabe, R. Komiya, N.
Koide, L.Y. Han, (2006) Dye sensitized solar cells with
conversion efficiency of 11.1%. Jpn J Appl Phys, 45: L638–
L640.
[18] R. Buscaino, C. Baiocchi, C. Barolo, C. Medana, M.
Gratzel, M.D.K. Nazeeruddin, (2008) A mass spectrometric
analysis of sensitizer solution used for dye sensitized solar
cell. Inorg Chim Acta, 361:798–805.
[19] D. Matthews, P. Infelta, M. Grätzel, (1996) Calculation
of the photocurrent-potential characteristic for regenerative,
sensitized semiconductor electrodes. Solar Energy Materials
and Solar Cells, 44:119–55.
[20] N.A. Ludin, A.M. Al-Alwani Mahmoud, A. Mohamad,
A.H. Kadhum, K. Sopian, N. S. Abdul Karim, (2014)
Review on the development of natural dye photosensitizer
for dye-sensitized solar cells, Renewable and Sustainable
Energy Reviews 31: 386–396.
[21] Hao S, Wu J, Huang Y, Lin J. (2006). Natural dyes as
photosensitizers for dye-sensitized solar cell. Sol. Energy 80:
209–214.
[22] Hernandez-Martinez A.R., Estevez M, Vargas S,
Quintanilla F, Radriguez R. (2012) Natural pigment based
dye-sensitized solar cells. J Appl Res Technol., 10: 38–47.
[23] Zhang D, Lanier S.M., Downing J.A., Avent J.L., Lum
J., Mc Hale J.L. (2008) Betalain pigments for dye-sensitized
solar cells. J Photo chem Photo bio l A: Chem, 195:72–80.
[24] P.S. Greg, M. Grätzel (1998) Demonstrating electron
transfer and nanotechnology: a natural dye sensitized
nanocrystalline energy converter. J Chem Educ., 75:752–6.
[25] Monari A, Assfeld X, Beley M, Gros P.C. (2011)
Theoretical study of new ruthenium based dyes for dye-
sensitized solar cells. J Phys Chem A, 115:3596–603.
[26] M.K. Nazeeruddin, P. Péchy, T. Renouard, (2001)
Engineering of efficient panchromatic sensitizers for
nanocrystalline TiO2 based solar cells. J Am Chem Soc.,
123:1613–24.
[27] A.O. Adeloye, P.A. Ajibade, (2011) A high molar
extinction coefficient mono- anthracenyl bipyridyl
heteroleptic Ruthenium(II) complex: synthesis, photo-
physical and electrochemical properties. Molecules,
16:4615–31.
INTERNATIONAL JOURNAL of ENGINEERING TECHNOLOGIES Oluwaseun Adedokun et al., Vol.2, No.2, 2016
41
[28] Yuancheng Q, Peng Q. (2012) Review articles:
Ruthenium sensitizers and their application in dye sensitized
solar cells. Int. J Photoenergy, 2012: 21 (Article ID291579).
[29] Luque A, Hegedus S. (2003) Handbook of photovoltaic
science and engineering. The Netherlands: Elsevier.
[30] Chang H, Lo Y.J. (2010) Pomegranate leaves and
mulberry fruit as natural sensitizers for dye sensitized solar
cells. Sol Energy, 84:1833–7.
[31] Kishiomoto S, Maoka T, Sumitomo K, Ohmya A.
(2005) Analysis of carotenoid composition in petals of
calendula (Calendula of ficinalis L).Biosci Biotechnol
Biochem., 69:2122–8.
[32] Keka S, Saha P.D., Datta S. (2012) Extraction of
natural dye from etals Flam of forest (Buteamonosperma)
flower: process optimization using response surface
methodology (RSM). J Dyes Pigment, 94: 212–6.
[33] Nishantha M.R., Yapa YPYP, Perera VPS. (2012)
Sensitization of photoelectrochemical solar cells with a
natural dye extracted from Kopsia flavida fruit. Proceed Tech
Sess., 28:54–8.
[34] Davies KM. (2004) Plant pigments and their
manipulation, USA: Blackwell Publishing Ltd. Annual Plant
Reviews; 342.
[35] Calogero G, Marco G.D., Cazzanti S., Caramori S.,
Argazzi R., Carlo A.D., (2010) Efficient dye-sensitized solar
cells using red turnip and purple wild Sicilian prickly pear
fruits. International Journal of Molecular Sciences 11: 254–
267.
[36] Zhou H., Wu L., Gao Y., Ma T. (2011) ‘Dye-sensitized
solar cells using 20 natural dyes as sensitizers’. J.
Photochem. Photobiol. A: Chem. 219: 188–194.
[37] Wongcharee K., Meeyoo V., Chavadej S. (2007) Dye-
sensitized solar cell using natural dyes extracted from rosella
and blue pea flowers. Sol. Energy Mater. Sol. Cells, 91: 566–
571.
[38] Hao S, Wu J, Huang Y, Lin J. (2006) Natural dyes as
photosensitizers for dye-sensitized solar cell. Sol. Energy 80:
209–214.
[39] Gòmez-Ortíz N.M., Vázquez-Maldonado I.A., Pérez-
Espadas A.R., Mena-Rejón G.J., Azamar-Barrios J.A.,
Oskam G. (2009) Dye-sensitized solar cells with natural dyes
extracted from achiote seeds. Sol. Energy Mater. Sol. Cells,
94: 40-44.
[40] Yamazaki E, Murayama M, Nishikawa N, Hashimoto
N, Shoyama M, Kurita O. (2007) Utilization ofnatural
carotenoids as photosensitizers for dye-sensitized solar cells.
Sol. Energy 81: 512–516.
[41] Polo AS, Iha NYM. (2006) Blue sensitizers for solar
cells: natural dyes from Calafate and Jaboticaba. Sol. Energy
Mater. Sol. Cells, 90: 1936–1944.
[42] Hernández-Martínez AR, Vargas S, Estevez M,
Rodríguez R. (2010) Dye-sensitized solar cells from
extracted bracts bougainvillea betalain pigments. In: 1st
International Congress on Instrumentation and Applied
Sciences, 1–15.
[43] G.A. Armstrong, J.E. Hearst (1996) Carotenoids 2:
Genetics and molecular biology of carotenoid pigment
biosynthesis. FASEB J. 10 (2): 228–37. PMID 8641556.
[44] X.F. Wang, J. Xiang, P. Wang, Y. Koyama (2005) Dye
sensitized solar cells using chlorophyll a derivate as the
sensitizer and carotenoids having different conjugation
lengths as redox spacers. Chem Phys Lett., 408: 409–14.
[45] H. Chang, M.J. Kao, T.L. Chen, H.G. Kuo, K.C.
Choand, X.-P. Lin, (2011) Natural sensitizer for dye-
sensitized solar cells using three layers of photoelectrode thin
films with a Schottky barrier. Am J Eng Appl Sci., 4: 214–
22.
[46] H.I. Scheer In: B.R. Green, W.W. Parson, Editors.
(2003) Light-harvesting antennas in photosynthesis.
Dordrecht: Kluwer Academic Publishers; p. 513.
[47] X.F. Wang, K. Osomu, H. Eiji, Z. Haoshen, S. Shin
ichi, T. Hitoshi, (2010). TiO2 and ZnO based solar cells using
a chlorophyll a derivative sensitizer for light-harvesting and
energy conversion. J Photochem Photobiol A: Chem, 210:
145–52.
INTERNATIONAL JOURNAL of ENGINEERING TECHNOLOGIES Onder Eyecioglu et al., Vol.2, No.2, 2016
42
Artificial Neural Networks Study on Prediction of
Dielectric Permittivity of Basalt/PANI Composites
Onder Eyecioglu*‡, Mehmet Kilic**, Yasar Karabul **, Umit Alkan***, Orhan Icelli**
*Department of Mechatronics Engineering, Faculty of Engineering and Architecture, Istanbul Gelişim University, 34215,
Istanbul, Turkey.
**Department of Physics, Faculty of Science and Letters, Yildiz Technical University, 34220 Istanbul, Turkey.
***Department of Computer Engineering, Faculty of Engineering and Architecture, Istanbul Gelişim University, 34215,
Istanbul, Turkey.
([email protected], [email protected], [email protected], [email protected], [email protected])
‡ Corresponding Author: Onder Eyecioglu, Department of Mechatronics Engineering, Faculty of Engineering and Architecture,
Istanbul Gelisim University, 34215, Istanbul, Turkey, Tel: +90 212 422 7020/288, [email protected]
Received: 29.03.2016 Accepted: 30.04.2016
Abstract-In the present study, the dielectric permittivity change of basalt (two type basalt; CM-1, KYZ-13) reinforced PANI
composites were studied to determine the effects of PANI additivities (10.0, 25.0, 50.0 wt.%) at several frequencies from 100
Hz to 17.5 MHz by a dielectric spectroscopy method at the room temperature and artificial neural networks (ANNs)
simulation. Also, the dielectric permittivity at 30.0 wt.% of PANI additivity was obtained by ANNs without experimental
process. That process, a significant predictive instrument was produced which allows optimization of dielectric properties for
numerous composites without substantial experimentation. It has been observed that PANI additivities decreased to dielectric
constant of composites at low frequencies. Furthermore, the ANNs method have satisfactory accuracy for prediction of
dielectric parameters.
Keywords: Artificial neural networks, dielectric permittivity, basalt, PANI, composite.
1. Introduction
There is growing interest in reinforcing polymer matrix
composites with basalt reinforced polymers because of their
moderate cost, high stiffness and strength, excellent
corrosion and oxidation resistance, and heat resistance and
thermal stability. Basalt is a very common volcanic rock,
dark colored and comparatively rich in iron and magnesium,
which is located at almost every country in the world. Basalt
is used for a wide variety of purposes. It has been used in the
rock industry to create industrial construction, highway
engineering and building tiles for other purposes [1].
Polyaniline (PANI) is one of the most promising conductive
polymers for technological applications due to its easy
synthesis, high environmental stability, huge electrical
conductivity, as well as a comparatively low cost [2, 3].
PANI is synthesized for specific applications like organic
electronics [3], circuit component (such as varistors [4],
super capacitors [3, 5]), electrochemical catalysis [5, 6],
corrosion protection [7, 8] and sensors [9].
Artificial neural networks (ANNs) are becoming well-
known because of their achievement where complicated
nonlinear relationships occur amongst data. ANNs are
biologically influenced computer programs created to
simulate the way in which the human brain processes
knowledge. ANNs collect this information through detecting
the relationships and patterns in learned via experience and
data. The broad use of ANNs is a result of their ability and
versatility to model nonlinear systems without earlier
information of an empirical model. They do not require a
specific formulation of the physical or mathematical
relationships of the undertaking issue. These give ANNs an
advantage over traditional fitting methods for numerous
application. [10].
In this work, the dielectric permittivity values of basalt
reinforced PANI were determined at several frequencies
from 100 Hz to 17.5 MHz by using experimental Impedance
spectroscopy technique, and this data was used to develop an
artificial neural networks model for next prediction of
dielectric permittivity. The data samples were produced three
different composite (10.0, 25.0, 50.0 wt.%). Then, we
INTERNATIONAL JOURNAL of ENGINEERING TECHNOLOGIES Onder Eyecioglu et al., Vol.2, No.2, 2016
43
calculated the dielectric permittivity for 30.0 wt.% PANI
additivity as a sample application of developed ANNs model.
2. Materials and Method
2.1. Materials
Basalt samples (two type basalt samples and coded CM-
1, KYZ-13) obtained from different regions of Van in
Turkey. Chemical analyses of the basalt samples are taken by
X-ray fluorescence (XRF) instrument. Operating conditions
of the XRF device of Philips PW-2400 were fixed at 50 mA
and 60 kV. The results of chemical analysis of basalt samples
are given in Table 1.
Table 1. Chemical composition of basalt samples [1].
Sample
Comp.. CM-1 KYZ-13
SiO2 41.668 47.790
TiO2 2.0800 1.3950
Al2O3 13.106 16.918
Fe2O3 13.823 10.878
MnO 0.1920 0.1630
MgO 9.7540 7.6190
CaO 10.602 11.357
Na2O 5.2610 3.1370
K2O 1.7370 0.5190
P2O5 1.7770 0.2240
Polyaniline (emeraldine base, average Mw ~5000) was
purchased from Sigma-Aldrich. To investigate effects of
PANI additive percentages (10.0, 25.0, 50.0 wt.%) on the
dielectric properties of basalt mechanically modified by
PANI. These composites were prepared by mixing of basalt
samples with PANI and were molded by compression in a
cold press at room temperature. Each one of these mixtures
prepared as a pellet having 13±0.02 mm diameter,
0.500±0.050 g weight and 1.9-2.2 mm thickness.
2.2. Dielectric Measurements
The dielectric measurements were carried out with a two-
point probe arrangement. Dielectric measurements have been
performed by using an HP 4194A Impedance Analyzer in the
frequency range from 100 Hz–15 MHz at room temperature
with a high accuracy (0.17% typ.) In this work, the overall
errors the dielectric measurements are 2.5% and the RMS
amplitude of the instruments is ~500mV.
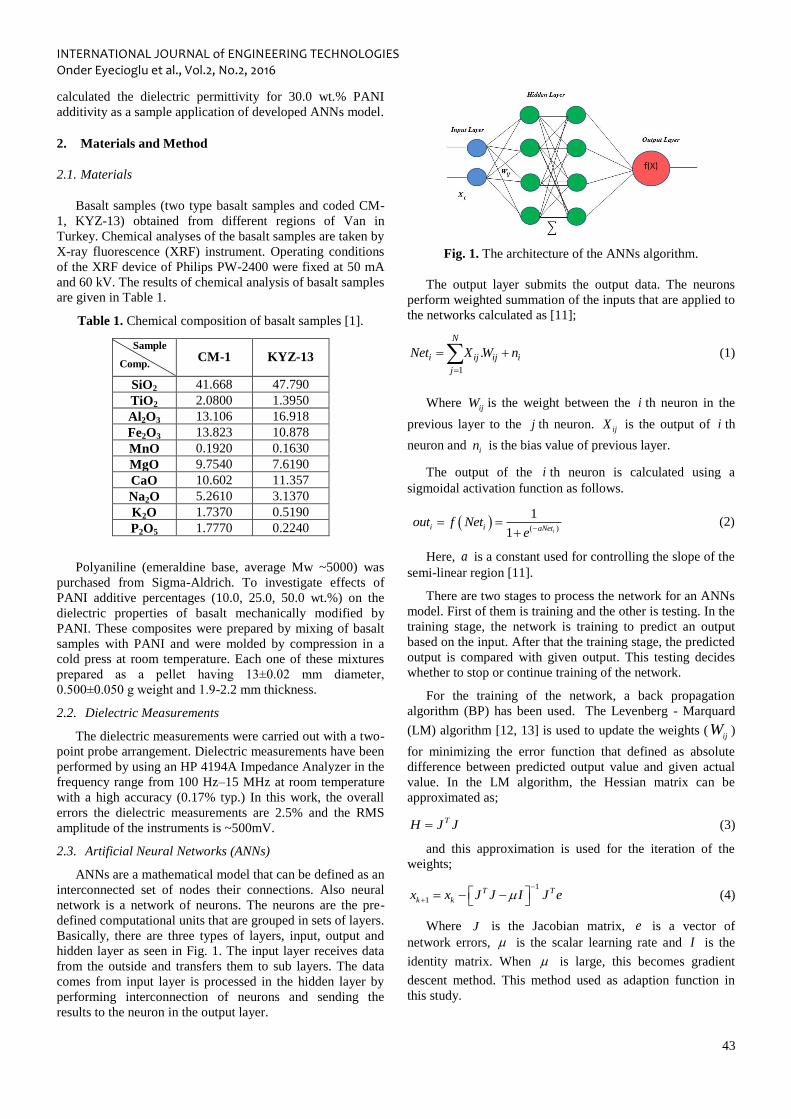
2.3. Artificial Neural Networks (ANNs)
ANNs are a mathematical model that can be defined as an
interconnected set of nodes their connections. Also neural
network is a network of neurons. The neurons are the pre-
defined computational units that are grouped in sets of layers.
Basically, there are three types of layers, input, output and
hidden layer as seen in Fig. 1. The input layer receives data
from the outside and transfers them to sub layers. The data
comes from input layer is processed in the hidden layer by
performing interconnection of neurons and sending the
results to the neuron in the output layer.
Fig. 1. The architecture of the ANNs algorithm.
The output layer submits the output data. The neurons
perform weighted summation of the inputs that are applied to
the networks calculated as [11];
1
.
N
i ij ij i
j
Net X W n
(1)
Where ijW is the weight between the i th neuron in the
previous layer to the j th neuron. ijX is the output of i th
neuron and in is the bias value of previous layer.
The output of the i th neuron is calculated using a
sigmoidal activation function as follows.
( )
1
1 ii i aNet
out f Nete
(2)
Here, a is a constant used for controlling the slope of the
semi-linear region [11].
There are two stages to process the network for an ANNs
model. First of them is training and the other is testing. In the
training stage, the network is training to predict an output
based on the input. After that the training stage, the predicted
output is compared with given output. This testing decides
whether to stop or continue training of the network.
For the training of the network, a back propagation
algorithm (BP) has been used. The Levenberg - Marquard
(LM) algorithm [12, 13] is used to update the weights (ij
W )
for minimizing the error function that defined as absolute
difference between predicted output value and given actual
value. In the LM algorithm, the Hessian matrix can be
approximated as;
TH J J (3)
and this approximation is used for the iteration of the
weights;
1
1
T T
k kx x J J I J e
(4)
Where J is the Jacobian matrix, e is a vector of
network errors, is the scalar learning rate and I is the
identity matrix. When is large, this becomes gradient
descent method. This method used as adaption function in
this study.
INTERNATIONAL JOURNAL of ENGINEERING TECHNOLOGIES Onder Eyecioglu et al., Vol.2, No.2, 2016
44
The prediction accuracy performance of the networks was
calculated using coefficient of determination ( R ) and
relative error ( RE );
1
2 2
1 1
( )( )
N
i i i i
i
N N
i i i
i i
y y x x
R
y y x x
(5)
% 100i i
i
x yRE
x
(6)
where iy and ix are predicted and actual values
respectively.
3. Results
Dielectric spectroscopy is most reliable and powerful
experimental technique which has been effectively used for
the characterization of electrical properties of the polar
materials [14]. The DS technique is based on analyzing the
alternative current (a.c.) response of a materials to a
sinusoidal perturbation, and subsequent calculation of
dielectric parameters as a function of frequency and
temperature [15].
The dielectric analysis gives the permittivity and
conductivity of material as a complex permittivity *( )
parameter. Dielectric permittivity is a principal parameter
that determines the coupling and distribution of
electromagnetic energy during microwave and
radiofrequency processing [15, 16]. The frequency
dependence complex dielectric permittivity *( ) is given
by
*( ) ( ) ( )i (7)
Here, , ( ) and ( ) are the angular frequency,
the real part of complex permittivity (or called dielectric
constant) and the imaginary part of the complex dielectric
permittivity (or called loss factor), respectively. In dielectric
material ( ) represents the alignment of dipoles, which is
the energy storage component and ( ) represents the ionic
conduction component [15].
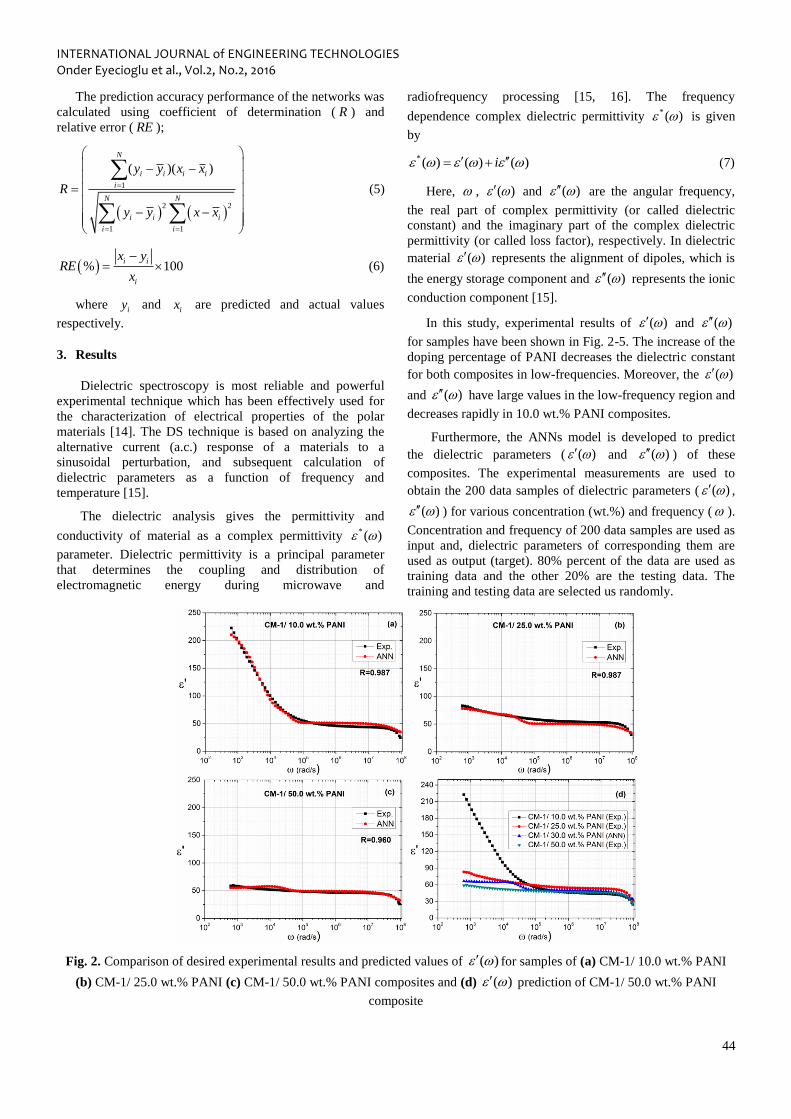
In this study, experimental results of ( ) and ( )
for samples have been shown in Fig. 2-5. The increase of the
doping percentage of PANI decreases the dielectric constant
for both composites in low-frequencies. Moreover, the ( )
and ( ) have large values in the low-frequency region and
decreases rapidly in 10.0 wt.% PANI composites.
Furthermore, the ANNs model is developed to predict
the dielectric parameters ( ( ) and ( ) ) of these
composites. The experimental measurements are used to
obtain the 200 data samples of dielectric parameters ( ( ) ,
( ) ) for various concentration (wt.%) and frequency ( ).
Concentration and frequency of 200 data samples are used as
input and, dielectric parameters of corresponding them are
used as output (target). 80% percent of the data are used as
training data and the other 20% are the testing data. The
training and testing data are selected us randomly.
Fig. 2. Comparison of desired experimental results and predicted values of ( ) for samples of (a) CM-1/ 10.0 wt.% PANI
(b) CM-1/ 25.0 wt.% PANI (c) CM-1/ 50.0 wt.% PANI composites and (d) ( ) prediction of CM-1/ 50.0 wt.% PANI
composite

INTERNATIONAL JOURNAL of ENGINEERING TECHNOLOGIES Onder Eyecioglu et al., Vol.2, No.2, 2016
45
Fig. 3. Comparison of desired experimental results and predicted values of ( ) for samples of (a) CM-1/ 10.0 wt.% PANI
(b) CM-1/ 25.0 wt.% PANI (c) CM-1/ 50.0 wt.% PANI composites and (d) ( ) prediction of CM-1/ 30.0 wt.% PANI
composite
The comparisons of experimental results and output
values predicted by ANNs of CM-1 are illustrated in Fig. 2-
3. The figures show the variation of ( ) and ( ) with
the frequency for various concentration (10.0 wt.%, 25.0
wt.% and 50.0 wt.%,). From these figures, it is seen that the
high accuracy between experimental and simulated data.
Therefore, it can be concluded easily that the outputs
efficiently modeled by the ANNs model.
Also, it can be concluded from Fig. 4 and Fig. 5, that the
KYZ-13 values can be efficiently modeled by the ANNs
model similar to the CM-1.
Fig. 4. Comparison of desired experimental results and predicted values of ( ) for samples of (a) KYZ-13/ 10.0 wt.% PANI
(b) KYZ-13/ 25.0 wt.% PANI (c) KYZ-13/ 50.0 wt.% PANI composites and (d) ( ) prediction of KYZ-13/ 50.0 wt.%
PANI composite
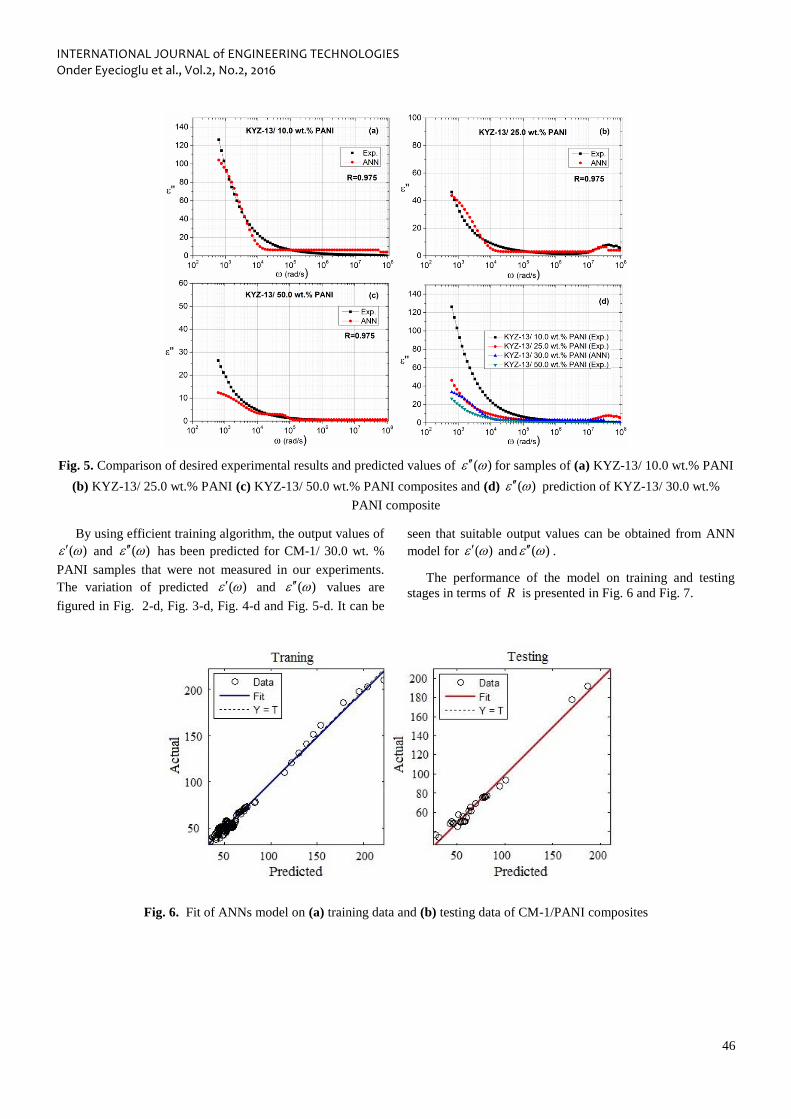
INTERNATIONAL JOURNAL of ENGINEERING TECHNOLOGIES Onder Eyecioglu et al., Vol.2, No.2, 2016
46
Fig. 5. Comparison of desired experimental results and predicted values of ( ) for samples of (a) KYZ-13/ 10.0 wt.% PANI
(b) KYZ-13/ 25.0 wt.% PANI (c) KYZ-13/ 50.0 wt.% PANI composites and (d) ( ) prediction of KYZ-13/ 30.0 wt.%
PANI composite
By using efficient training algorithm, the output values of
( ) and ( ) has been predicted for CM-1/ 30.0 wt. %
PANI samples that were not measured in our experiments.
The variation of predicted ( ) and ( ) values are
figured in Fig. 2-d, Fig. 3-d, Fig. 4-d and Fig. 5-d. It can be
seen that suitable output values can be obtained from ANN
model for ( ) and ( ) .
The performance of the model on training and testing
stages in terms of R is presented in Fig. 6 and Fig. 7.
Fig. 6. Fit of ANNs model on (a) training data and (b) testing data of CM-1/PANI composites
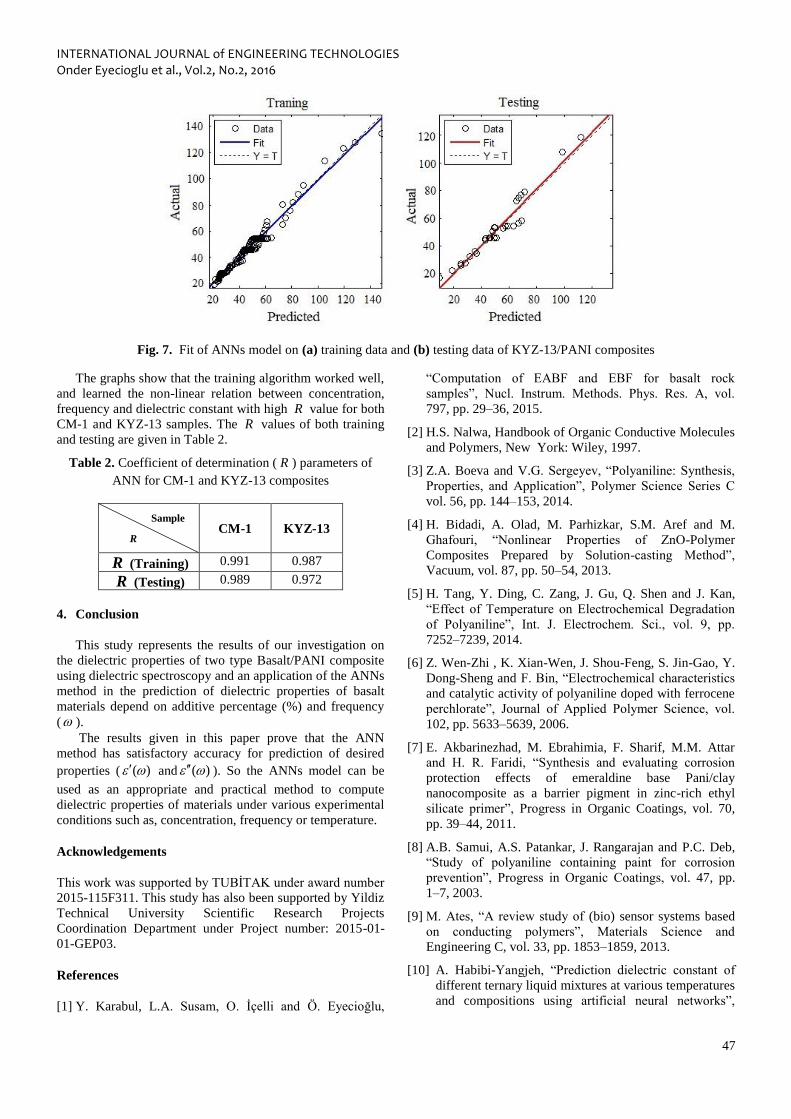
INTERNATIONAL JOURNAL of ENGINEERING TECHNOLOGIES Onder Eyecioglu et al., Vol.2, No.2, 2016
47
Fig. 7. Fit of ANNs model on (a) training data and (b) testing data of KYZ-13/PANI composites
The graphs show that the training algorithm worked well,
and learned the non-linear relation between concentration,
frequency and dielectric constant with high R value for both
CM-1 and KYZ-13 samples. The R values of both training
and testing are given in Table 2.
Table 2. Coefficient of determination ( R ) parameters of
ANN for CM-1 and KYZ-13 composites
Sample
R CM-1 KYZ-13
R (Training) 0.991 0.987
R (Testing) 0.989 0.972
4. Conclusion
This study represents the results of our investigation on
the dielectric properties of two type Basalt/PANI composite
using dielectric spectroscopy and an application of the ANNs
method in the prediction of dielectric properties of basalt
materials depend on additive percentage (%) and frequency
( ).
The results given in this paper prove that the ANN
method has satisfactory accuracy for prediction of desired
properties ( ( ) and ( ) ). So the ANNs model can be
used as an appropriate and practical method to compute
dielectric properties of materials under various experimental
conditions such as, concentration, frequency or temperature.
Acknowledgements
This work was supported by TUBİTAK under award number
2015-115F311. This study has also been supported by Yildiz
Technical University Scientific Research Projects
Coordination Department under Project number: 2015-01-
01-GEP03.
References
[1] Y. Karabul, L.A. Susam, O. İçelli and Ö. Eyecioğlu,
“Computation of EABF and EBF for basalt rock
samples”, Nucl. Instrum. Methods. Phys. Res. A, vol.
797, pp. 29–36, 2015.
[2] H.S. Nalwa, Handbook of Organic Conductive Molecules
and Polymers, New York: Wiley, 1997.
[3] Z.A. Boeva and V.G. Sergeyev, “Polyaniline: Synthesis,
Properties, and Application”, Polymer Science Series C
vol. 56, pp. 144–153, 2014.
[4] H. Bidadi, A. Olad, M. Parhizkar, S.M. Aref and M.
Ghafouri, “Nonlinear Properties of ZnO-Polymer
Composites Prepared by Solution-casting Method”,
Vacuum, vol. 87, pp. 50–54, 2013.
[5] H. Tang, Y. Ding, C. Zang, J. Gu, Q. Shen and J. Kan,
“Effect of Temperature on Electrochemical Degradation
of Polyaniline”, Int. J. Electrochem. Sci., vol. 9, pp.
7252–7239, 2014.
[6] Z. Wen-Zhi , K. Xian-Wen, J. Shou-Feng, S. Jin-Gao, Y.
Dong-Sheng and F. Bin, “Electrochemical characteristics
and catalytic activity of polyaniline doped with ferrocene
perchlorate”, Journal of Applied Polymer Science, vol.
102, pp. 5633–5639, 2006.
[7] E. Akbarinezhad, M. Ebrahimia, F. Sharif, M.M. Attar
and H. R. Faridi, “Synthesis and evaluating corrosion
protection effects of emeraldine base Pani/clay
nanocomposite as a barrier pigment in zinc-rich ethyl
silicate primer”, Progress in Organic Coatings, vol. 70,
pp. 39–44, 2011.
[8] A.B. Samui, A.S. Patankar, J. Rangarajan and P.C. Deb,
“Study of polyaniline containing paint for corrosion
prevention”, Progress in Organic Coatings, vol. 47, pp.
1–7, 2003.
[9] M. Ates, “A review study of (bio) sensor systems based
on conducting polymers”, Materials Science and
Engineering C, vol. 33, pp. 1853–1859, 2013.
[10] A. Habibi-Yangjeh, “Prediction dielectric constant of
different ternary liquid mixtures at various temperatures
and compositions using artificial neural networks”,

INTERNATIONAL JOURNAL of ENGINEERING TECHNOLOGIES Onder Eyecioglu et al., Vol.2, No.2, 2016
48
Physics and Chemistry of Liquids, vol.45, pp. 471–478,
2007.
[11] H. Kurt and M. Kayfeci, “Prediction of thermal
conductivity of ethylene glycol–water solutions by
using artificial neural networks”, Applied Energy, vol.
86, pp. 2244–2248, 2009.
[12] K. Levenberg, “A Method for the Solution of Certain
Non-Linear Problems in Least Squares” Quarterly of
Applied Mathematics, vol. 2, pp. 164–168, 1944.
[13] D. Marquardt, “An Algorithm for Least-Squares
Estimation of Nonlinear Parameters”, SIAM Journal on
Applied Mathematics, vol. 11, pp. 431–441, 1963.
[14] A.S. Nowick, A.V. Vaysleyb and I. Kuskovsky,
“Universal dielectric response of variously doped CeO2
ionically conducting ceramics”, Phys Rev B, vol. 58,
pp. 8398–8406, 1998.
[15] V.F. Lvovich, Impedance Spectroscopy Applications to
Electrochemical and Dielectric Phenomena, New
Jersey: Wiley, 2012, ch. 4.
[16] J. Suchanicz, “The low-frequency dielectric relaxation
Na0.5 Bi0.5 TiO3 ceramics” Mater Sci Eng B-Adv, vol.
55, pp. 114–118, 1998.

INTERNATIONAL JOURNAL of ENGINEERING TECHNOLOGIES Mehmet Firat Baran et al., Vol.2, No.2, 2016
49
Determination of Some Physical Properties of
Rapeseed
Mehmet Firat Baran*‡, Mehmet Recai Durgut**, Turkan Aktas**,
Poyraz Ulger**, Birol Kayisoglu**
*University of Adıyaman, Faculty of Technology, Energy Systems Engineering, 02040 Adıyaman, Turkey.
**University of Namık Kemal, Faculty of Agriculture, Biosystems Engineering, 59100 Tekirdağ, Turkey.
([email protected], [email protected], [email protected] , [email protected], [email protected])
‡
Corresponding author: Mehmet Firat Baran, University of Adıyaman, Faculty of Technology, Energy Systems Engineering,
02040 Adıyaman, Turkey, Tel: +90 416 223 38 00, Fax: +90 416 223 17 74, [email protected]
Received: 06.04.2016 Accepted: 12.06.2016
Abstract-Rapeseeds (Brassica napus oleifera L.) were analyzed for some physical properties production in Kırklareli
province. Also some physical properties of rapeseed such as seed moisture content, length, diameter, mass of single seed,
thousand seed mass, geometric mean diameter, sphericity, seed volume, density, accumulation angle and friction coefficient
have been determined. Kernel moisture, thousand kernel mass, plant length, plant stem diameter, yield of the harvested crop
were determined as 8.34 %, 4.74 g, 158.2 cm, 8.10 mm, 3204 kg/ha, respectively. Length, diameter, mass of single kernel,
geometric mean diameter, sphericity, bulk density, accumulation angle and friction coefficient were found as 2.35 mm, 1.93
mm, 0.0047g, 2.07 mm, 0.88, 5.07 mm3, 617 kg/m
3, 29
0, 0.318 (on galvanized sheet), 0.288 (stainless steel), 0.305
(aluminium), respectively.
Keywords: Rapeseed, physical properties, plant properties, seed properties
1. Introduction
As a of source vegetable oil, canola is a valuable oil
crop plant, in fact the second highest produced in the
world, following soya. In 2008, 57.86 million tons of
canola seeds have been produced in the world in a total
area of 30.30 million ha, while out of the approximate 392
million tons of the global vegetable oil production, 57.86
million tonnes have been met from canola [1]. China,
Germany, India, Poland, England, France and Canada, in
particular, are the most prominent canola oil producers and
consumers in the world. In Turkey, canola farming started
after World War II by the Bulgarian and Romanian
immigrants in Thrace Region and over time it spread to
other regions and by 1979 it reached an area of 27
thousand ha. However, after that date use of rapeseed
varieties have been prohibited on the grounds that they
contain high levels of fatty erucic acid and by 1985, it’s
farming was reduced to 100 ha. However, after the
introduction of 00-type rapeseed varieties (canola) not
containing fatty erucic acid and glucosinolate, it has
become to be reproduced, particularly in Cukurova and
Thrace regions [2].
In Turkey, the amount of successfully planted oil crop
plants in winter conditions, such as canola, is highly
limited. Canola farming displays significant similarities
with wheat growing techniques, and they are being planted
and harvested almost within the same time period
(September-July). Therefore, particularly in dry farming
areas with heavy cereal production, it becomes crucial as
an alternative to cereals. When rosette leaves have already
blossomed before winter months, certain aspects of canola,
such as being highly durable against colds, not requiring
any additional irrigation other than natural precipitation,
reaching harvest maturity by July at the latest, being easily
harvestable by a combined harvester and yielding more
products, on average 30.1 kg/ha, than grains in dry farming
conditions [3] makes canola indispensable. Oils containing
high levels of erucic acid are harmful for human health,
and similarly, cossets containing high levels of
glucosinolate are harmful for animal health [4,5].
Therefore, rapeseed varieties which do not contain erucic
acid in their oil, and those not containing glucosinolate in
their cossets have been improved [6,7]. In modern times,
00 type rapeseed varieties containing low levels of (>2%)
erucic acid (C22.1) in oil and low levels of (>30 μmol/g)
glucosinolate in cossets are called canola [7,8].

INTERNATIONAL JOURNAL of ENGINEERING TECHNOLOGIES Mehmet Firat Baran et al., Vol.2, No.2, 2016
50
Canola oil contains 65% oleic, %20 linoleic, 9%
linolenic, 4% palmitic and 2% stearic acids on average
[7,9]. Thus, containing over 60% oleic acid, canola oil
differs from other vegetable oils (such as sunflower, soya,
corn oils) while displaying similarities with olive oil [7].
It is possible to examine the physical characteristics of
agricultural products by taking the single unit of each
product variety or bulk stocking type as a basis. The
important thing here is to correctly define and present the
engineering parameters such as the product’s shape, size,
volume density and surface area. [10].
Physical characteristics are highly important in terms
of sowing equipment, harvesting, handling, stocking and
processing of the canola seed [11]. For the designation of
granaries, silos and agricultural machinery, the friction
coefficients of the agricultural products on various
surfaces are needed. When designing granaries and silos,
friction coefficient is used to calculate the vertical load on
the membranes. In pneumatic transmission, particularly in
high product concentrations, product-membrane friction
creates an important resistance force. Flowing
characteristics of granulated products are related to friction
coefficients. Friction contributes to cutting, meshing and
pressing of agricultural products. The movement of a
granulated product on a rotating disc is affected by
friction.
All these examples indicate that friction is present in
almost all agricultural acts and is not to be ignored [10].
There have been a number of studies performed with
the purpose of determining the productivity and physical
characteristics of canola seed.
Çalışır et al[11]
reported that, 2005, have analysed
certain physical characteristics (size, length, diameter,
geometric average diameter, roundness, mass of single
seed, 1000 seed mass, volume density, final velocity,
surface area and porosity) of canola seeds at three different
moisture content levels (4.7%, 13.14%, 23.96%). The
results have been listed as; 2.07-2.29mm, 1,84-1.99mm,
1.91-2.08 mm, 0,93-0.91, 0,0040-0,0065 g, 5,10-6,36g,
3,96-5,15 mm3, 612,1-585,1 kg/m
3, 3,16-3,74m/s, 3,71-
4,67mm2, 48,2%-60,6% respectively. The study has
concluded that all the dimensions of the canola seed has
increased with an increase in porosity, surface area, 1000
seed mass and final velocity, moisture content; volume
density and roundness has been reduced with an increase
in moisture content; while static and dynamic friction
coefficient characteristics have increased when moisture
content was increased.
İzli et al.[12]
reported that, 2009, have analysed some
physical and mechanic characteristics such as size, length,
diameter, geometric average diameter, sphericity, 1000
seed mass, surface area, volume density, porosity, final
velocity and friction coefficient of three different canola
seeds in two different moisture content levels (8,3%-
25,9%, 7,7%-27,4%, 7,3%-26,4%) for each seed. The
results acquired were as follows; size 2,26-2,54mm,
diameter 1,85-2,08mm, geometric diameter 1,96-2,23 mm,
sphericity 86,1%-89,8%, surface area 12,1-15,7 mm2,
volume value i 4,56-6,60 mm3, accumulation angle 18,22-
26,810, final velocity value 3,44-3,77 m/s and friction
coefficient (0,244-0,358 in galvanized surface, 0,233-
0,331 in stainless steel surface, and 0,237-0,335 in
aluminium surface). In their study, they have determined
that the all the porosity, surface area, 1000 seed mass, final
velocity and friction coefficient values of canola seed as
increased when moisture content was increased, while
volume density and roundness values decreased upon a
decrease in moisture content.
Hazbavi and Minaei[13]
reported that 2009, have used
standard methods to determine certain physical
characteristics such as size, length, diameter, geometric
average diameter, sphericity, surface area, volume values
and porosity of 7 different canola seeds (Option, Orient,
Talaye, Global, Hyola 401, Hyola 308 and Colvert), based
on freshness, in 6 different moisture levels (5,49, 4,55,
5,41, 4,74, 5,53 and 5,32). Conclusion of the study has
revealed; 1,84-2,30mm, 1,76-2,15mm, 1,59-1,90mm, 1,76-
2,09mm, 0,91-0,96, 9,74-13,86 mm2, 2,67-6,44 mm
3,
928,01-1370 kg/m3, 675,61-741,6 kg/m
3, 25,3%-45,9%
respectively. They have noticed that certain physical
characteristics produce significantly different values based
on the canola variety and canola moisture content.
In this study, the object was to determine the
agricultural characteristics (plant size, number of side
branch and number of carob in the plant, number of grain
in carob) of canola plant which has reached harvest
moisture, seed yield, as well as the harvest related physical
characteristics (moisture content, 1000 seed mass size
characteristics, sphericity, mass of single seed, volume
mass, accumulation angle and friction coefficient on 3
different surfaces) of the harvested seed. The
distinguishing aspect of the study is that not only the seed
characteristics of harvest period Elvis variety canola plant
have been determined but also the herbal component
characteristics have been defined.
2. Material and Method
2.1. Material
The plant material in the study was Elvis variety winter
canola of Brassica Napus L. species. Elvis variety is a fast
growing winter canola variety with a strong root and stalk
structure, durable against cold, high levels of fat (40-45%)
high hectolitre weight and 00 erucic acid level.
Trials took place at a farmer’s land in Ürünlü village of
Kırklareli city. The 5*20m trail zone has been divided into
three parcels and samples of canola plant have been taken.
The trial zone has been made ready for planning by
early September. During the seedbed preparations stage,
20 kg/da 20-20-0 composed fertilizer has been broadcasted
to the whole trial zone. Planting norm has been applied at a
rate of 450 gr/da. No herbicide has been applied but weeds
have been removed by the use of a hand hoe. Once the
plants have reached the 6 leaf stage, they have been
thinned at an interval of 10 cm rows. During the month of
March, 26% ammonium nitrate fertilizer has been applied
at a rate of 25 kg/da. No irrigation took place. Pesticide
has been applied twice in May and June against leaf beetle.
Harvesting took place in June.

INTERNATIONAL JOURNAL of ENGINEERING TECHNOLOGIES Mehmet Firat Baran et al., Vol.2, No.2, 2016
51
In addition to the plant material used in the study, a
tape line has been used for plant size measurements, a
calliper for plant stalk thickness measurement, a
micrometre with a precision of 0.01 mm for the
measurement of seed lengths, humectant containers to
measure the product moisture content, precision balance
and microprocessor controlled thermostat and a timer and
dryer (drying oven) with a temperature precision of +5 0C -
250 0C, as well as 3 friction surfaces, galvanized metal,
stainless steel and aluminium, to determine the friction
characteristics of the material on different surfaces.
2.2. Method
2.2.1. Determining the Harvest Related Characteristics of
Canola Plant
Depending on the warm or rainy weather conditions
and early rising of the variety, canola plant reaches harvest
maturity between 40 to 50 days after blossoming. When
canola reaches harvest maturity, the stalks, leaves and
capsules of the plant completely dry up and turn pale, and
a yellow colour occurs. If the seed has turned brown and
seed moisture content drops below 10%, it means that it is
time to harvest the plant. Maturing in canola plants occurs
from bottom to top. Waiting for full maturity in harvesting
may lead to cracks and shedding may occur in lower
capsules [2].
2.2.1.1. Stalk (Trunk) Diameter
25 samples have been taken from the relevant trial
parcel for calculating the plant stalk (trunk) diameter. The
samples have been measured by the use of a calliper to
define the average stalk (trunk) diameter value.
2.2.1.2. Measuring the plant length
25 samples have been taken from the parcels at the trial
zone to measure the plant length. Samples have been cut
by scissors right above the soil, and measured by a tape
line to define the average plant length values.
2.2.1.3. Counting the amount of side branches
25 sample plants have been taken from all parcels to
count the number of side branches and the figures have
been divided to the number of samples to define the
average number of side branches.
2.2.1.4. Counting the number of carob (capsule) in the
plant:
Once the canola flowers are inseminated, the ovarium
develops, and fruits in the shape of capsule or carob with
approximately 10-26 seeds occur inside, the fruits consist
of two sections, divided by a placenta (membrane) [2]. 25
samples have been taken from the parcels at the canola
trial zone and the number of carobs per plant has been
counted before dividing the total figure to the number of
samples to define the average values.
2.2.1.5. Counting the number of grains in the carob
25 samples have been taken from the parcels at the
canola trial zone and the number of grains per carob has
been calculated, before dividing the total figure to the
number of samples to define the average values.
2.2.1.6. Defining the field product yields
In order to define the field yield, samples have been
taken from three different parts of the field within a 1
square meter area before harvesting the measured parcels,
the samples in this section have been manually harvested,
the product has been weighed and average values have
been calculated, which have been related to the yield per
decare [14].
QT = n
qt (1)
In this equation;
QT : Field grain yield (kg/da)
qt : Grain yield total of the samples (gr/m2),
n : Number of samples taken from the fields.
2.2.2. Defining the Harvest Related Characteristics of
Canola Seed
2.2.2.1. Defining the seed moisture content
Harvesting of canola plant takes place when the
moisture of the seed is below 8-10% [15]. In order to
confirm whether the product has reached harvest moisture,
samples have been taken at certain intervals during the
harvest period, and the moisture content of the seed has
been defined in conformity to the standards [16]. Seed
moisture content has been calculated by using the
following equation on the basis of freshness.
ms
syb
WW
WN
(2)
In this equation,
Nyb : Seed moisture content (%),
Ws : Wet weight of product (g),
Wm : Dry weight of product (g).
2.2.2.2. Defining the thousand grain mass
Certain amounts of samples have been taken from the
harvested product to define the thousand grain mass and
divided into groups of 100, and these groups of 100
samples have been weighed 4 times. Scale averages of the
100’s groups have been taken and this average has been
multiplied by 10 to find out the 1000 seed mass of the
product [17].
2.2.2.3. Defining the seed lengths
In order to calculate the seed lengths, 10 sample
groups containing 100 seeds have been randomly selected
and then their related length, width and diameter values
have been measured.
2.2.2.4. Defining the sphericity and geometric average
diameter values:
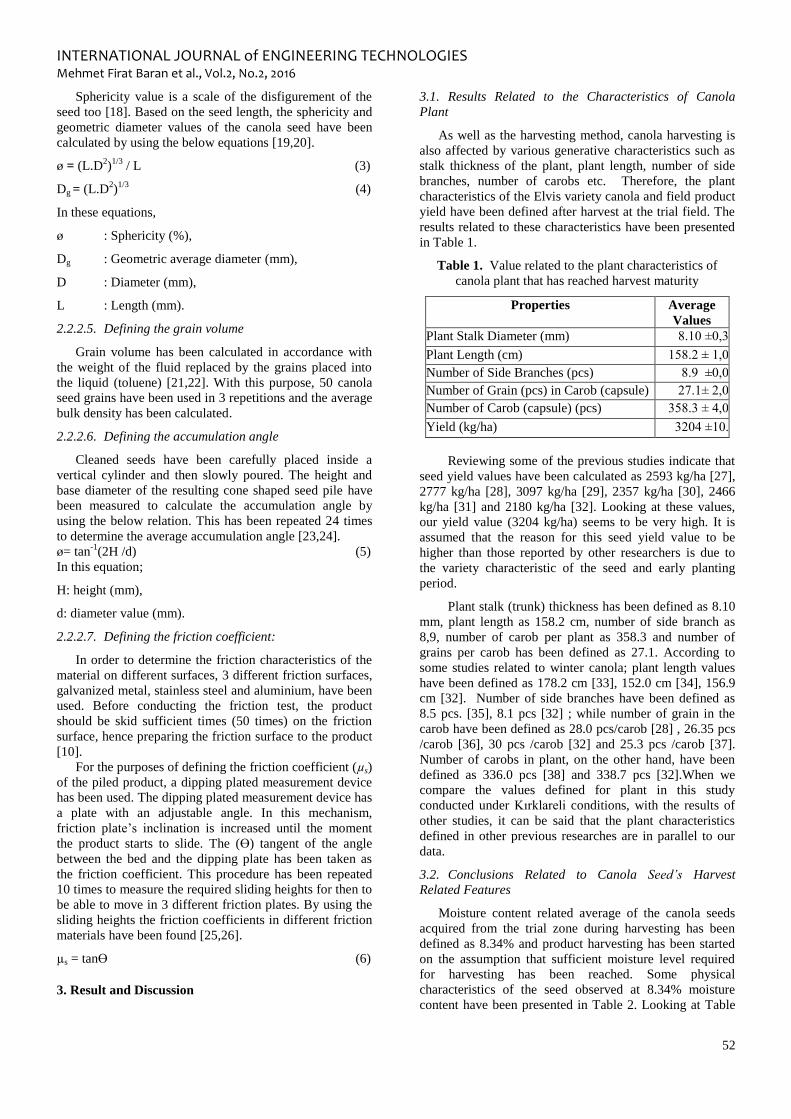
INTERNATIONAL JOURNAL of ENGINEERING TECHNOLOGIES Mehmet Firat Baran et al., Vol.2, No.2, 2016
52
Sphericity value is a scale of the disfigurement of the
seed too [18]. Based on the seed length, the sphericity and
geometric diameter values of the canola seed have been
calculated by using the below equations [19,20].
ø = (L.D2)
1/3 / L (3)
Dg = (L.D2)
1/3 (4)
In these equations,
ø : Sphericity (%),
Dg : Geometric average diameter (mm),
D : Diameter (mm),
L : Length (mm).
2.2.2.5. Defining the grain volume
Grain volume has been calculated in accordance with
the weight of the fluid replaced by the grains placed into
the liquid (toluene) [21,22]. With this purpose, 50 canola
seed grains have been used in 3 repetitions and the average
bulk density has been calculated.
2.2.2.6. Defining the accumulation angle
Cleaned seeds have been carefully placed inside a
vertical cylinder and then slowly poured. The height and
base diameter of the resulting cone shaped seed pile have
been measured to calculate the accumulation angle by
using the below relation. This has been repeated 24 times
to determine the average accumulation angle [23,24].
ø= tan-1
(2H /d) (5)
In this equation;
H: height (mm),
d: diameter value (mm).
2.2.2.7. Defining the friction coefficient:
In order to determine the friction characteristics of the
material on different surfaces, 3 different friction surfaces,
galvanized metal, stainless steel and aluminium, have been
used. Before conducting the friction test, the product
should be skid sufficient times (50 times) on the friction
surface, hence preparing the friction surface to the product
[10].
For the purposes of defining the friction coefficient (µs)
of the piled product, a dipping plated measurement device
has been used. The dipping plated measurement device has
a plate with an adjustable angle. In this mechanism,
friction plate’s inclination is increased until the moment
the product starts to slide. The (ϴ) tangent of the angle
between the bed and the dipping plate has been taken as
the friction coefficient. This procedure has been repeated
10 times to measure the required sliding heights for then to
be able to move in 3 different friction plates. By using the
sliding heights the friction coefficients in different friction
materials have been found [25,26].
µs = tanϴ (6)
3. Result and Discussion
3.1. Results Related to the Characteristics of Canola
Plant
As well as the harvesting method, canola harvesting is
also affected by various generative characteristics such as
stalk thickness of the plant, plant length, number of side
branches, number of carobs etc. Therefore, the plant
characteristics of the Elvis variety canola and field product
yield have been defined after harvest at the trial field. The
results related to these characteristics have been presented
in Table 1.
Table 1. Value related to the plant characteristics of
canola plant that has reached harvest maturity
Properties Average
Values
Plant Stalk Diameter (mm) 8.10 ±0,3
Plant Length (cm) 158.2 ± 1,0
Number of Side Branches (pcs) 8.9 ±0,0
Number of Grain (pcs) in Carob (capsule) 27.1± 2,0
Number of Carob (capsule) (pcs) 358.3 ± 4,0
Yield (kg/ha) 3204 ±10.
Reviewing some of the previous studies indicate that
seed yield values have been calculated as 2593 kg/ha [27],
2777 kg/ha [28], 3097 kg/ha [29], 2357 kg/ha [30], 2466
kg/ha [31] and 2180 kg/ha [32]. Looking at these values,
our yield value (3204 kg/ha) seems to be very high. It is
assumed that the reason for this seed yield value to be
higher than those reported by other researchers is due to
the variety characteristic of the seed and early planting
period.
Plant stalk (trunk) thickness has been defined as 8.10
mm, plant length as 158.2 cm, number of side branch as
8,9, number of carob per plant as 358.3 and number of
grains per carob has been defined as 27.1. According to
some studies related to winter canola; plant length values
have been defined as 178.2 cm [33], 152.0 cm [34], 156.9
cm [32]. Number of side branches have been defined as
8.5 pcs. [35], 8.1 pcs [32] ; while number of grain in the
carob have been defined as 28.0 pcs/carob [28] , 26.35 pcs
/carob [36], 30 pcs /carob [32] and 25.3 pcs /carob [37].
Number of carobs in plant, on the other hand, have been
defined as 336.0 pcs [38] and 338.7 pcs [32].When we
compare the values defined for plant in this study
conducted under Kırklareli conditions, with the results of
other studies, it can be said that the plant characteristics
defined in other previous researches are in parallel to our
data.
3.2. Conclusions Related to Canola Seed’s Harvest
Related Features
Moisture content related average of the canola seeds
acquired from the trial zone during harvesting has been
defined as 8.34% and product harvesting has been started
on the assumption that sufficient moisture level required
for harvesting has been reached. Some physical
characteristics of the seed observed at 8.34% moisture
content have been presented in Table 2. Looking at Table
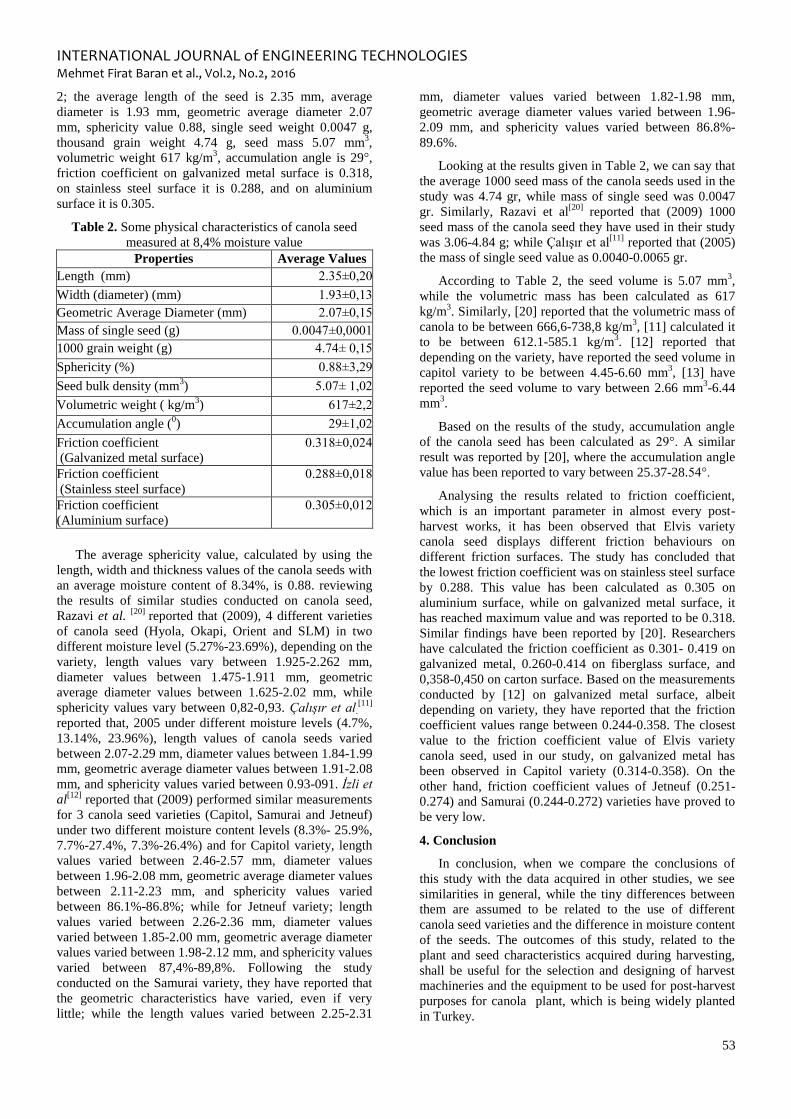
INTERNATIONAL JOURNAL of ENGINEERING TECHNOLOGIES Mehmet Firat Baran et al., Vol.2, No.2, 2016
53
2; the average length of the seed is 2.35 mm, average
diameter is 1.93 mm, geometric average diameter 2.07
mm, sphericity value 0.88, single seed weight 0.0047 g,
thousand grain weight 4.74 g, seed mass 5.07 mm3,
volumetric weight 617 kg/m3, accumulation angle is 29°,
friction coefficient on galvanized metal surface is 0.318,
on stainless steel surface it is 0.288, and on aluminium
surface it is 0.305.
Table 2. Some physical characteristics of canola seed
measured at 8,4% moisture value
Properties Average Values
Length (mm) 2.35±0,20
Width (diameter) (mm) 1.93±0,13
Geometric Average Diameter (mm) 2.07±0,15
Mass of single seed (g) 0.0047±0,0001
1000 grain weight (g) 4.74± 0,15
Sphericity (%) 0.88±3,29
Seed bulk density (mm3) 5.07± 1,02
Volumetric weight ( kg/m3) 617±2,2
Accumulation angle (0) 29±1,02
Friction coefficient
(Galvanized metal surface)
0.318±0,024
Friction coefficient
(Stainless steel surface)
0.288±0,018
Friction coefficient
(Aluminium surface)
0.305±0,012
The average sphericity value, calculated by using the
length, width and thickness values of the canola seeds with
an average moisture content of 8.34%, is 0.88. reviewing
the results of similar studies conducted on canola seed,
Razavi et al. [20]
reported that (2009), 4 different varieties
of canola seed (Hyola, Okapi, Orient and SLM) in two
different moisture level (5.27%-23.69%), depending on the
variety, length values vary between 1.925-2.262 mm,
diameter values between 1.475-1.911 mm, geometric
average diameter values between 1.625-2.02 mm, while
sphericity values vary between 0,82-0,93. Çalışır et al.[11]
reported that, 2005 under different moisture levels (4.7%,
13.14%, 23.96%), length values of canola seeds varied
between 2.07-2.29 mm, diameter values between 1.84-1.99
mm, geometric average diameter values between 1.91-2.08
mm, and sphericity values varied between 0.93-091. İzli et
al[12]
reported that (2009) performed similar measurements
for 3 canola seed varieties (Capitol, Samurai and Jetneuf)
under two different moisture content levels (8.3%- 25.9%,
7.7%-27.4%, 7.3%-26.4%) and for Capitol variety, length
values varied between 2.46-2.57 mm, diameter values
between 1.96-2.08 mm, geometric average diameter values
between 2.11-2.23 mm, and sphericity values varied
between 86.1%-86.8%; while for Jetneuf variety; length
values varied between 2.26-2.36 mm, diameter values
varied between 1.85-2.00 mm, geometric average diameter
values varied between 1.98-2.12 mm, and sphericity values
varied between 87,4%-89,8%. Following the study
conducted on the Samurai variety, they have reported that
the geometric characteristics have varied, even if very
little; while the length values varied between 2.25-2.31
mm, diameter values varied between 1.82-1.98 mm,
geometric average diameter values varied between 1.96-
2.09 mm, and sphericity values varied between 86.8%-
89.6%.
Looking at the results given in Table 2, we can say that
the average 1000 seed mass of the canola seeds used in the
study was 4.74 gr, while mass of single seed was 0.0047
gr. Similarly, Razavi et al[20]
reported that (2009) 1000
seed mass of the canola seed they have used in their study
was 3.06-4.84 g; while Çalışır et al[11]
reported that (2005)
the mass of single seed value as 0.0040-0.0065 gr.
According to Table 2, the seed volume is 5.07 mm3,
while the volumetric mass has been calculated as 617
kg/m3. Similarly, [20] reported that the volumetric mass of
canola to be between 666,6-738,8 kg/m3, [11] calculated it
to be between 612.1-585.1 kg/m3. [12] reported that
depending on the variety, have reported the seed volume in
capitol variety to be between 4.45-6.60 mm3, [13] have
reported the seed volume to vary between 2.66 mm3-6.44
mm3.
Based on the results of the study, accumulation angle
of the canola seed has been calculated as 29°. A similar
result was reported by [20], where the accumulation angle
value has been reported to vary between 25.37-28.54°.
Analysing the results related to friction coefficient,
which is an important parameter in almost every post-
harvest works, it has been observed that Elvis variety
canola seed displays different friction behaviours on
different friction surfaces. The study has concluded that
the lowest friction coefficient was on stainless steel surface
by 0.288. This value has been calculated as 0.305 on
aluminium surface, while on galvanized metal surface, it
has reached maximum value and was reported to be 0.318.
Similar findings have been reported by [20]. Researchers
have calculated the friction coefficient as 0.301- 0.419 on
galvanized metal, 0.260-0.414 on fiberglass surface, and
0,358-0,450 on carton surface. Based on the measurements
conducted by [12] on galvanized metal surface, albeit
depending on variety, they have reported that the friction
coefficient values range between 0.244-0.358. The closest
value to the friction coefficient value of Elvis variety
canola seed, used in our study, on galvanized metal has
been observed in Capitol variety (0.314-0.358). On the
other hand, friction coefficient values of Jetneuf (0.251-
0.274) and Samurai (0.244-0.272) varieties have proved to
be very low.
4. Conclusion
In conclusion, when we compare the conclusions of
this study with the data acquired in other studies, we see
similarities in general, while the tiny differences between
them are assumed to be related to the use of different
canola seed varieties and the difference in moisture content
of the seeds. The outcomes of this study, related to the
plant and seed characteristics acquired during harvesting,
shall be useful for the selection and designing of harvest
machineries and the equipment to be used for post-harvest
purposes for canola plant, which is being widely planted
in Turkey.
INTERNATIONAL JOURNAL of ENGINEERING TECHNOLOGIES Mehmet Firat Baran et al., Vol.2, No.2, 2016
54
References
[1] FAO, 2008. Production, Yield, Harvested Area Values
of Rapeseed. Avaliable from FAOSTAT (April, 2010).
www.fao.org.
[2] Süzer, S., 2008. Kanola Tarımı Kitabı. Hasad
Yayıncılık.
[3] TUİK, 2008. Plant Production Techniques, (April
2010). www.tuik.gov.tr.
[4] Adolphe, D., 1987. Canola: The Universal Oilseed. 7th
International Rapeseed Congress, 11-14 May, Poznan-
Poland.
[5] Mailer, R.J., and Wratten, N., 1987. Glucosinolate
Variability in Rapeseed in Australia. 7th
International
Rapeseed Congress, 11-14 May, Poznan-Poland.
[6] Zukalova, H., Vasak, J., Fabry, A., 1985. Changes in
the Quality Characteristics of Winter Rape Cultivars
Free from Erucic and Glucosinolates. Rostlinna-
Vyroba. 31 :685-692.
[7] Baydar, H.,2005. Yield and Quality Characteristics of
Canola Varieties in Isparta Conditions. S.D.Ü. Fen
Bilimleri Enst. Dergisi,9-3(2005), Isparta.
[8] Röbbelen, G., Downey, R.K. and Ashri, A., 1989.
Oilcrops of the World. McGraw Hill, USA.
[9] Weiss, E.A., 2000. Rapeseed. In: Oilseed Crops.
Blackwell Sci. Ltd., Victoria, Australia.
[10] Kara, Turgut, N. ve M., 1999. Agricultural productsin
Physical characteristic. Atatürk Üniversitesi Ziraat
Fakültesi Ders Notları No: 212, Erzurum.
[11] Çalışır, S., Marakoğlu, T., Öğüt, H., and Öztürk, Ö.,
2005. Physical Properties of Rapeseed. Journal of
Food Engineering. 69:61-66.
[12] İzli, N., Ünal, H., and Sincik, M., 2009. Physical and
Mechanical Properties of Rapeseed at Different
Moisture Content. Institute of Agrophysics, Polish
Academy of Sciences, .23:137-145.
[13] Hazbavi, I. and Minaei, S., 2009. Determination and
Investigation of Some Physical Properties of Seven
Variety Rapeseed. Iranıan Journal of Food Scıence
and Technology Wınter. 5(4):21-28.
[14] Ülger, P., 1982. Buğday Hasat Harmanında
Uygulanan Degişik Mekanizasyon Sistemlerinin
Tane Ürün Kayıplarına Etkileri. Hasat Öncesi ve
Hasat Sonrası Ürün Kayıpları Seminer Bildirileri,
13–17 Aralık p.: 195-243, Ankara
[15] Anonymous, 2009. Swathing, Combining “Harvest
Management” http://www.canola.org/ chapter
11.aspx (26.01.2009)
[16] ASAE, 1997. ASAE S358.2, Moisture Measurement
Unground Grain and Seed. In: ASAE 398 Standards,
ASAE Press, St. Joseph. MI, USA.
[17] Şehirali, S., 1989. Seed Technology. Ders Kitabı,
Ankara
[18] Önal, İ., 1995. Ekim Bakım Gübreleme Makinaları,
E.Ü. Ziraat Fakültesi Yayınları No: 490, Bornova,
İzmir.
[19] Mohsenin, N. N., 1970. Physical Properties of Plant
and Animal Material. New York: Gordon and Breach
Science Publishers.
[20] Razavi, S.M.A., Yeganehzad, S. and Sadeghi A.,
2009. Moisture Dependent Physical Properties of
Canola Seeds. J. Agric. Sci. Technol. 11:3009-322 .
[21] Lewis, M.J., 1996. Physical Properties of Foods and
Food Processing Systems. Woodhead Publishing
Limited, Cambridge, England
[22] Kayişoğlu, B. ve Esen, M., 2007. Ayçiçeği Tanesinin
Nem Absorbsiyon Özelliklerinin Saptanması.
Tekirdağ Ziraat Fakültesi Dergisi. 4 (2).
[23] Irtwange S.V., 2000. The Effect of Accession on
Some Physical and Engineering Properties of African
Yam Bean. Unpublished PhD Thesis, Department of
Agricultural Engineering, University of Ibadan,
Nigeria.
[24] Akaaimo D.I. and Raji A.O., 2006. Some Physical
and Engineering Properties of Prosopis Africana
seed. Bio systems Eng., 95(2):197-205.
[25] Kocabıyık, H., 1997. Ayçiçeğinin Hasada Yönelik
Bazı Fiziksel ve Mekaniksel Özelliklerinin
Saptanması Üzerine Bir Araştırma. Yüksek Lisans
Tezi, T.Ü.Fen Bilimleri Enst. Tarım Makinaları
Anabilim Dalı, 1997,Tekirdağ.
[26] Aktas T.; Celen, I. and Durgut, R., 2006. Some
Physical and Mechanical Properties of Sunflower
Seed (Carthamus tinctorius L.). Journal of
Agronomy, 5 (4):613-616.
[27] Şaman, S., 1983. II. Ürün Tarımı Araştırma Yayım
Projesi Rapeseed Dilimi, 1982-1983 Yılı Gelişme
Raporu. T.C.T.O.K.B. Proje ve Uygulama Genel
Müd., Antalya.
[28] Kolsarıcı, Ö. ve Er, C., 1988. Amasya İlinde
Rapeseed Tarımında En Uygun Ekim Zamanı, Çeşit
ve Bitki Sıklığı Tesbiti Üzerinde Araştırmalar. 2:163-
177.
[29] Başalma, D., 1999. The Effects of Different Planting
Norms on Plant Characteristics and Yield and Quality
of Winter Rapeseed Varieties. 3rd
Field Crops
Congress, Turkey, 5-18 November, 317-322, Adana.
[30] Sağlam, C., Arslanoğlu, F. ve Kaba, S., 1999. Kışlık
Rapeseed Çeşitlerinin Tekirdağ Koşullarına
Adaptasyonu. 3rd
Field Crops Congress, Turkey, 5-18
November, p:344-347, Adana.
[31] Karaaslan, D., 1999. Diyarbakır Koşullarında
Yetiştirilebilecek Rapeseed Çeşitlerinin Saptanması
Üzerine Bir Araştırma. 3rd
Field Crops Congress,
Turkey, 5-18 November, 328-333, Adana.
[32] Öz, M., 2002. Bursa Mustafakemalpaşa Koşullarında
Different Ekim Zamanlarının Kışlık Rapeseed
Çeşitlerinde Verim ve Bazı Verim Unsurları Üzerine
Olan Etkileri. Uludağ Üniv. Zir. Fak. Dergisi. 16: 1-
13.
[33] Kolsarıcı, Ö. ve Başoğlu, F., 1984. Yağ Kalitesi ve
Yağ Oranı Yüksek Kışlık Rapeseed Çeşit ve
Hatlarının Verim Komponentleri Yönünden
Karşılaştırılması. A.Ü. Ziraat Fakültesi Yıllığı, s.66-
76.
[34] Raymer, P.L., Bullock, D.G. and Thomas, D.L., 1990.
Potential of Winter and Spring Rapeseed Cultivars
for Oilseed Production in the Southern United States,
s:223-225, Timber Press.

INTERNATIONAL JOURNAL of ENGINEERING TECHNOLOGIES Mehmet Firat Baran et al., Vol.2, No.2, 2016
55
[35] Karacaoğlu, N., Kaya, Ç. ve Çiçek, N., 1998. Canola
Araştırmaları. T. O. K. B. Ege Agricultural Araştırma
Enstitüsü, İzmir.
[36] Kolsarıcı, Ö. ve Er, C., Tarman, D., 1985. Islah
Edilmiş Kışlık Rapeseed Çeşitlerinde Verim
Komponentlerinin Karşılaştırılması. A.Ü. Ziraat
Fakültesi Yıllığı, 61-74.
[37] Göksoy, A.T. ve Turan, Z.M., 1986. Studies on Yield
and Quality Characteristics of Certain Rapeseed
Varieties. U. Ü. Ziraat Fakültesi Dergisi. 5: 75-83.
[38] İlisulu, K., 1970. Adaptation, Seed Yields and Other
Characteristics of Rapeseed Varieties, Brought from
France and Germany, under Ankara Climate and Soil
Conditions. A.Ü. Z.F. Yıllığı, s.132-157.
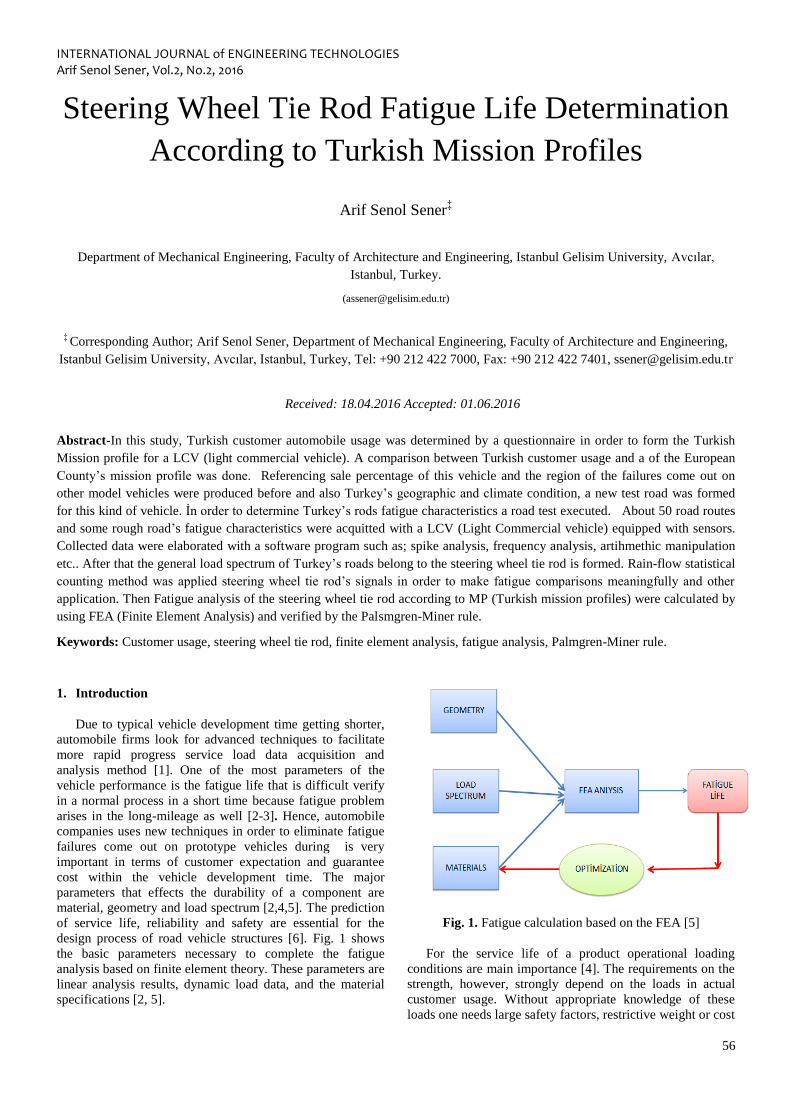
INTERNATIONAL JOURNAL of ENGINEERING TECHNOLOGIES Arif Senol Sener, Vol.2, No.2, 2016
56
Steering Wheel Tie Rod Fatigue Life Determination
According to Turkish Mission Profiles
Arif Senol Sener‡
Department of Mechanical Engineering, Faculty of Architecture and Engineering, Istanbul Gelisim University, Avcılar,
Istanbul, Turkey.
‡ Corresponding Author; Arif Senol Sener, Department of Mechanical Engineering, Faculty of Architecture and Engineering,
Istanbul Gelisim University, Avcılar, Istanbul, Turkey, Tel: +90 212 422 7000, Fax: +90 212 422 7401, [email protected]
Received: 18.04.2016 Accepted: 01.06.2016
Abstract-In this study, Turkish customer automobile usage was determined by a questionnaire in order to form the Turkish
Mission profile for a LCV (light commercial vehicle). A comparison between Turkish customer usage and a of the European
County’s mission profile was done. Referencing sale percentage of this vehicle and the region of the failures come out on
other model vehicles were produced before and also Turkey’s geographic and climate condition, a new test road was formed
for this kind of vehicle. İn order to determine Turkey’s rods fatigue characteristics a road test executed. About 50 road routes
and some rough road’s fatigue characteristics were acquitted with a LCV (Light Commercial vehicle) equipped with sensors.
Collected data were elaborated with a software program such as; spike analysis, frequency analysis, artihmethic manipulation
etc.. After that the general load spectrum of Turkey’s roads belong to the steering wheel tie rod is formed. Rain-flow statistical
counting method was applied steering wheel tie rod’s signals in order to make fatigue comparisons meaningfully and other
application. Then Fatigue analysis of the steering wheel tie rod according to MP (Turkish mission profiles) were calculated by
using FEA (Finite Element Analysis) and verified by the Palsmgren-Miner rule.
Keywords: Customer usage, steering wheel tie rod, finite element analysis, fatigue analysis, Palmgren-Miner rule.
1. Introduction
Due to typical vehicle development time getting shorter,
automobile firms look for advanced techniques to facilitate
more rapid progress service load data acquisition and
analysis method [1]. One of the most parameters of the
vehicle performance is the fatigue life that is difficult verify
in a normal process in a short time because fatigue problem
arises in the long-mileage as well [2-3]. Hence, automobile
companies uses new techniques in order to eliminate fatigue
failures come out on prototype vehicles during is very
important in terms of customer expectation and guarantee
cost within the vehicle development time. The major
parameters that effects the durability of a component are
material, geometry and load spectrum [2,4,5]. The prediction
of service life, reliability and safety are essential for the
design process of road vehicle structures [6]. Fig. 1 shows
the basic parameters necessary to complete the fatigue
analysis based on finite element theory. These parameters are
linear analysis results, dynamic load data, and the material
specifications [2, 5].
Fig. 1. Fatigue calculation based on the FEA [5]
For the service life of a product operational loading
conditions are main importance [4]. The requirements on the
strength, however, strongly depend on the loads in actual
customer usage. Without appropriate knowledge of these
loads one needs large safety factors, restrictive weight or cost
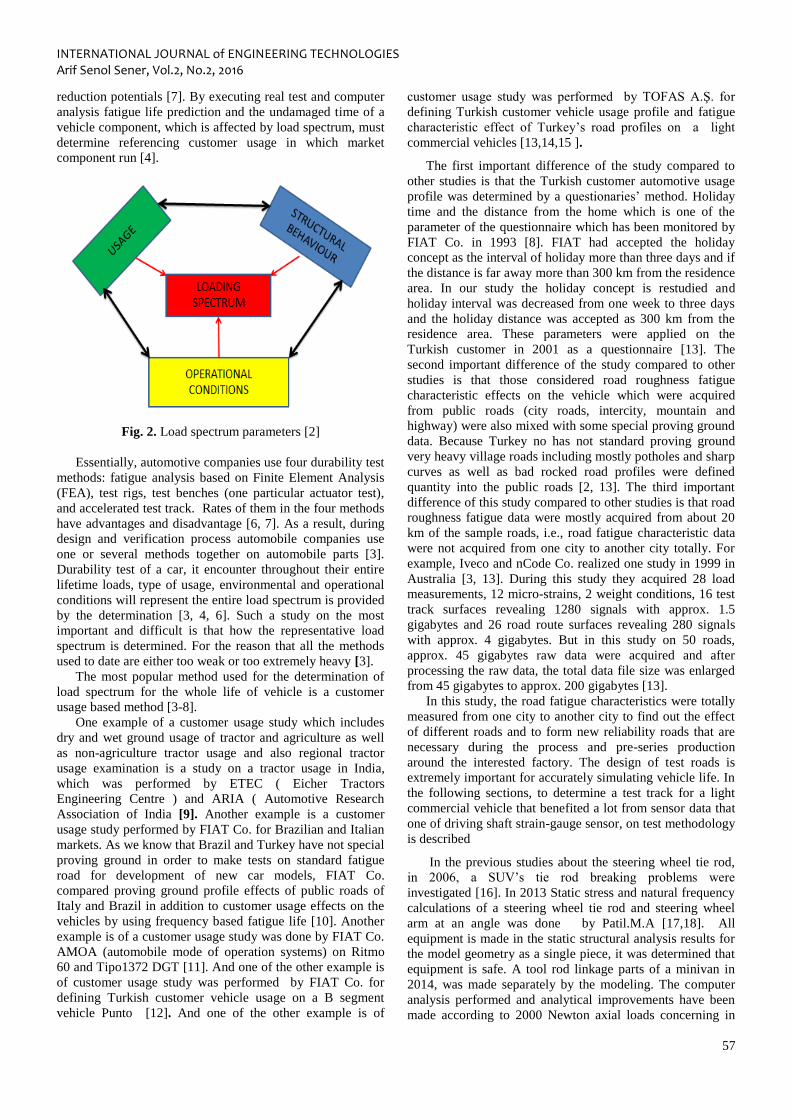
INTERNATIONAL JOURNAL of ENGINEERING TECHNOLOGIES Arif Senol Sener, Vol.2, No.2, 2016
57
reduction potentials [7]. By executing real test and computer
analysis fatigue life prediction and the undamaged time of a
vehicle component, which is affected by load spectrum, must
determine referencing customer usage in which market
component run [4].
Fig. 2. Load spectrum parameters [2]
Essentially, automotive companies use four durability test
methods: fatigue analysis based on Finite Element Analysis
(FEA), test rigs, test benches (one particular actuator test),
and accelerated test track. Rates of them in the four methods
have advantages and disadvantage [6, 7]. As a result, during
design and verification process automobile companies use
one or several methods together on automobile parts [3].
Durability test of a car, it encounter throughout their entire
lifetime loads, type of usage, environmental and operational
conditions will represent the entire load spectrum is provided
by the determination [3, 4, 6]. Such a study on the most
important and difficult is that how the representative load
spectrum is determined. For the reason that all the methods
used to date are either too weak or too extremely heavy [3].
The most popular method used for the determination of
load spectrum for the whole life of vehicle is a customer
usage based method [3-8].
One example of a customer usage study which includes
dry and wet ground usage of tractor and agriculture as well
as non-agriculture tractor usage and also regional tractor
usage examination is a study on a tractor usage in India,
which was performed by ETEC ( Eicher Tractors
Engineering Centre ) and ARIA ( Automotive Research
Association of India [9]. Another example is a customer
usage study performed by FIAT Co. for Brazilian and Italian
markets. As we know that Brazil and Turkey have not special
proving ground in order to make tests on standard fatigue
road for development of new car models, FIAT Co.
compared proving ground profile effects of public roads of
Italy and Brazil in addition to customer usage effects on the
vehicles by using frequency based fatigue life [10]. Another
example is of a customer usage study was done by FIAT Co.
AMOA (automobile mode of operation systems) on Ritmo
60 and Tipo1372 DGT [11]. And one of the other example is
of customer usage study was performed by FIAT Co. for
defining Turkish customer vehicle usage on a B segment
vehicle Punto [12]. And one of the other example is of
customer usage study was performed by TOFAS A.Ş. for
defining Turkish customer vehicle usage profile and fatigue
characteristic effect of Turkey’s road profiles on a light
commercial vehicles [13,14,15 ].
The first important difference of the study compared to
other studies is that the Turkish customer automotive usage
profile was determined by a questionaries’ method. Holiday
time and the distance from the home which is one of the
parameter of the questionnaire which has been monitored by
FIAT Co. in 1993 [8]. FIAT had accepted the holiday
concept as the interval of holiday more than three days and if
the distance is far away more than 300 km from the residence
area. In our study the holiday concept is restudied and
holiday interval was decreased from one week to three days
and the holiday distance was accepted as 300 km from the
residence area. These parameters were applied on the
Turkish customer in 2001 as a questionnaire [13]. The
second important difference of the study compared to other
studies is that those considered road roughness fatigue
characteristic effects on the vehicle which were acquired
from public roads (city roads, intercity, mountain and
highway) were also mixed with some special proving ground
data. Because Turkey no has not standard proving ground
very heavy village roads including mostly potholes and sharp
curves as well as bad rocked road profiles were defined
quantity into the public roads [2, 13]. The third important
difference of this study compared to other studies is that road
roughness fatigue data were mostly acquired from about 20
km of the sample roads, i.e., road fatigue characteristic data
were not acquired from one city to another city totally. For
example, Iveco and nCode Co. realized one study in 1999 in
Australia [3, 13]. During this study they acquired 28 load
measurements, 12 micro-strains, 2 weight conditions, 16 test
track surfaces revealing 1280 signals with approx. 1.5
gigabytes and 26 road route surfaces revealing 280 signals
with approx. 4 gigabytes. But in this study on 50 roads,
approx. 45 gigabytes raw data were acquired and after
processing the raw data, the total data file size was enlarged
from 45 gigabytes to approx. 200 gigabytes [13].
In this study, the road fatigue characteristics were totally
measured from one city to another city to find out the effect
of different roads and to form new reliability roads that are
necessary during the process and pre-series production
around the interested factory. The design of test roads is
extremely important for accurately simulating vehicle life. In
the following sections, to determine a test track for a light
commercial vehicle that benefited a lot from sensor data that
one of driving shaft strain-gauge sensor, on test methodology
is described
In the previous studies about the steering wheel tie rod,
in 2006, a SUV’s tie rod breaking problems were
investigated [16]. In 2013 Static stress and natural frequency
calculations of a steering wheel tie rod and steering wheel
arm at an angle was done by Patil.M.A [17,18]. All
equipment is made in the static structural analysis results for
the model geometry as a single piece, it was determined that
equipment is safe. A tool rod linkage parts of a minivan in
2014, was made separately by the modeling. The computer
analysis performed and analytical improvements have been
made according to 2000 Newton axial loads concerning in

INTERNATIONAL JOURNAL of ENGINEERING TECHNOLOGIES Arif Senol Sener, Vol.2, No.2, 2016
58
the specification of the FIR and the warranty is based on the
application documents [19,20].
In terms of time and cost, although all of them largely by
the superior, as in the test rig, also the CEA in terms of
weather and road conditions, process failures, driver errors,
etc. are not expected to face assimilation a hundred
percentages [14,15].
In this article, the measured steering wheel tie rod raw
data were collected, processed in order to find out MP
(mission profile road characteristic) for a light commercial
vehicle that benefited a lot from sensor data that one of
steering wheel tie rod sensor, on test methodology is
described.
2. Methods and Analysis
This method implements a large telephone survey
designed to acquire information about the distribution of
route types (city, extra urban, mountain, highway) the
distribution of loads (driver without loads, driver and half
load, driver and full load) customer education level, and the
purpose of vehicle usage etc. [3, 13]. After acquiring the
questionnaire results, a road test simulation is performed to
collect data with an equipped vehicle or several equipped
vehicles on public roads and special proving ground, during
various maneuvers (braking, curving, accelerating), during
power generation (engine and transmission components, in
various location, on various type of roads (city, intercity,
mountainous, rural), and by a test driver or multiple test
drivers[6,13].Then the collected row data are elaborated like
spike, filtering, manipulation etc. Then each road signal is
subjected to statistically counting method 3D matrix or 2D
range. So it is possible to make comparison of each road
signal for each sensor. By multiplying the questionnaire with
road type and target km to form the target mission profile
which consists of road excitation signals taking into
account90th
percentile distribution of customer automotive
usage, load, and the target MP is obtained for each sensor [3,
13].
The methodology is based on the following principle, if
the same inputs are reproduced, then same damage will occur
[3]. After forming MP, it is then possible to find mixes of
tracks or rig drivers that match to the inputs for accelerated
test including track or test rig that are corresponding to the
same damage effect of MP. If the same inputs are
maintained, matrix calculation of various forms will provide
a scheme for assessing the mixture of road excitation signals,
and for optimizing the test length or test time.
A [X1] + B[X2] + C[X3] +……………..+Z[ Xn] = [Y]
Where
A, B, C ….Z: Multipliers of test data,
[X1], [X2]……….. [Xn]: matrix of test measurements,
[Y]: matrix of customer target measurements.
This can be interpreted quite easily as: A times track X1,
followed by times track X2, and so on, so that it gives the
same effect as y of the target [3].
3. Implementation
In this study for road test acquisitions, FIAT Doblo
Passenger car is selected as LCV. In Fig. 3 the algorithm of
the study is presented.
Fig. 3. Algorithm of the study
3.1. Definition of the Turkish Profile –Questionnaire
Application.
As the questionnaire method allows a faster data
collection, provides flexibility on data elaboration and
reduces cost compared to the black box method as such, it
was the method of choice in this study. The Turkish
customer usage profile of a LCV that is used for transporting
both goods and passengers was developed based on a
questionnaire administered to Turkish customer with my
support and also with the support of automotive dealers
representing the LCV manufacturer[13].
3.2. Definition of the Turkish Profile-Definition of Road
Map.
The defined test road map represents 90 % of customer
usage in Turkey. Those test roads in the road test map was
designed taking reference of the sale percentages of LCVs
according to region, customer complaints, previous model
experiences, climatic conditions, and geography [3,12,13].
Roads were allocated in four groups: city road usage was
found to be more common around the Istanbul district;
Mountain roads were more common in the Black Sea region.
Intercity roads, which include hot climatic and curved road
condition, were found around the Mediterranean Sea. Roads
in Central Anatolia were characterized by high altitudes, hot
temperatures, and long distances between cities. For the
highway road characteristics Istanbul-Ankara and Adana –
Gaziantep roads were subjected to data acquisitions.
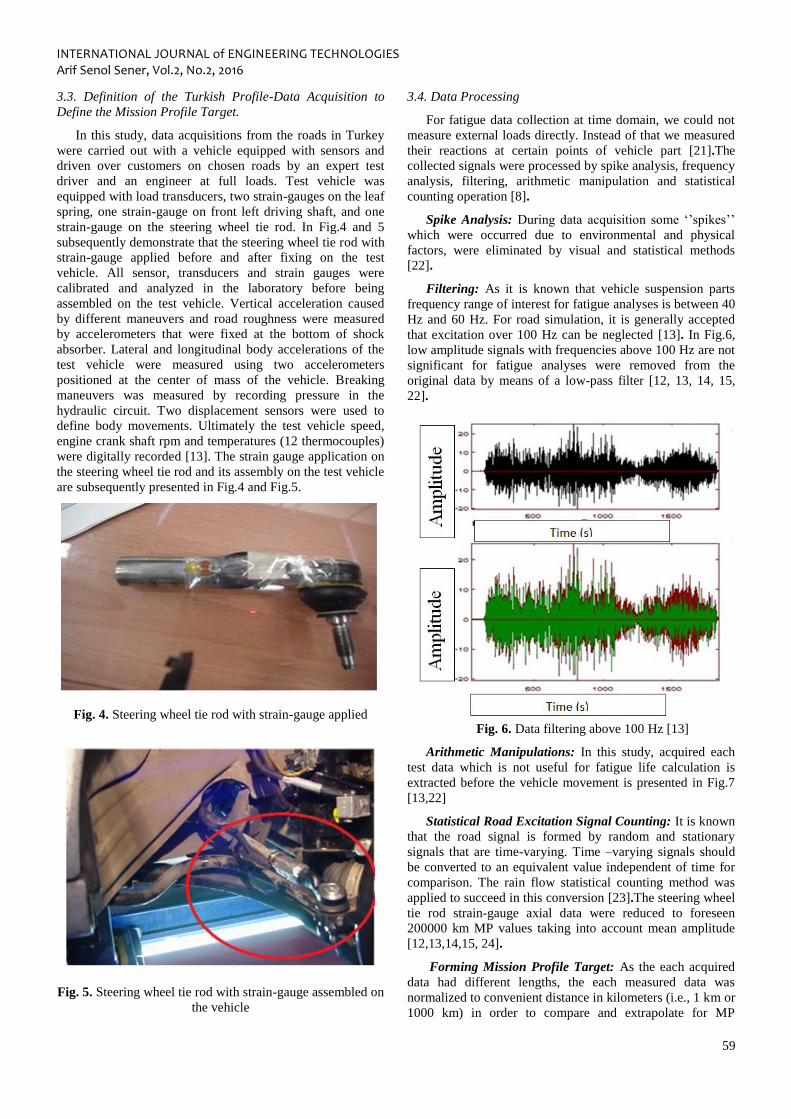
INTERNATIONAL JOURNAL of ENGINEERING TECHNOLOGIES Arif Senol Sener, Vol.2, No.2, 2016
59
3.3. Definition of the Turkish Profile-Data Acquisition to
Define the Mission Profile Target.
In this study, data acquisitions from the roads in Turkey
were carried out with a vehicle equipped with sensors and
driven over customers on chosen roads by an expert test
driver and an engineer at full loads. Test vehicle was
equipped with load transducers, two strain-gauges on the leaf
spring, one strain-gauge on front left driving shaft, and one
strain-gauge on the steering wheel tie rod. In Fig.4 and 5
subsequently demonstrate that the steering wheel tie rod with
strain-gauge applied before and after fixing on the test
vehicle. All sensor, transducers and strain gauges were
calibrated and analyzed in the laboratory before being
assembled on the test vehicle. Vertical acceleration caused
by different maneuvers and road roughness were measured
by accelerometers that were fixed at the bottom of shock
absorber. Lateral and longitudinal body accelerations of the
test vehicle were measured using two accelerometers
positioned at the center of mass of the vehicle. Breaking
maneuvers was measured by recording pressure in the
hydraulic circuit. Two displacement sensors were used to
define body movements. Ultimately the test vehicle speed,
engine crank shaft rpm and temperatures (12 thermocouples)
were digitally recorded [13]. The strain gauge application on
the steering wheel tie rod and its assembly on the test vehicle
are subsequently presented in Fig.4 and Fig.5.
Fig. 4. Steering wheel tie rod with strain-gauge applied
Fig. 5. Steering wheel tie rod with strain-gauge assembled on
the vehicle
3.4. Data Processing
For fatigue data collection at time domain, we could not
measure external loads directly. Instead of that we measured
their reactions at certain points of vehicle part [21].The
collected signals were processed by spike analysis, frequency
analysis, filtering, arithmetic manipulation and statistical
counting operation [8].
Spike Analysis: During data acquisition some ‘’spikes’’
which were occurred due to environmental and physical
factors, were eliminated by visual and statistical methods
[22].
Filtering: As it is known that vehicle suspension parts
frequency range of interest for fatigue analyses is between 40
Hz and 60 Hz. For road simulation, it is generally accepted
that excitation over 100 Hz can be neglected [13]. In Fig.6,
low amplitude signals with frequencies above 100 Hz are not
significant for fatigue analyses were removed from the
original data by means of a low-pass filter [12, 13, 14, 15,
22].
Fig. 6. Data filtering above 100 Hz [13]
Arithmetic Manipulations: In this study, acquired each
test data which is not useful for fatigue life calculation is
extracted before the vehicle movement is presented in Fig.7
[13,22]
Statistical Road Excitation Signal Counting: It is known
that the road signal is formed by random and stationary
signals that are time-varying. Time –varying signals should
be converted to an equivalent value independent of time for
comparison. The rain flow statistical counting method was
applied to succeed in this conversion [23].The steering wheel
tie rod strain-gauge axial data were reduced to foreseen
200000 km MP values taking into account mean amplitude
[12,13,14,15, 24].
Forming Mission Profile Target: As the each acquired
data had different lengths, the each measured data was
normalized to convenient distance in kilometers (i.e., 1 km or
1000 km) in order to compare and extrapolate for MP
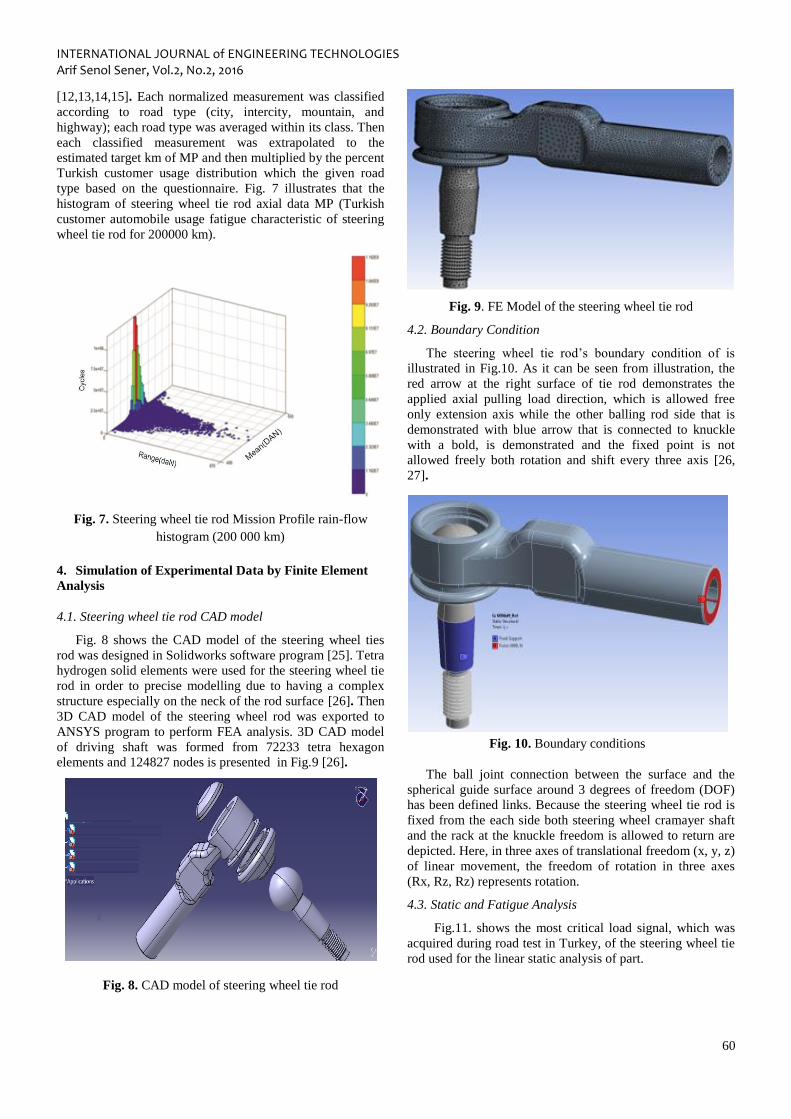
INTERNATIONAL JOURNAL of ENGINEERING TECHNOLOGIES Arif Senol Sener, Vol.2, No.2, 2016
60
[12,13,14,15]. Each normalized measurement was classified
according to road type (city, intercity, mountain, and
highway); each road type was averaged within its class. Then
each classified measurement was extrapolated to the
estimated target km of MP and then multiplied by the percent
Turkish customer usage distribution which the given road
type based on the questionnaire. Fig. 7 illustrates that the
histogram of steering wheel tie rod axial data MP (Turkish
customer automobile usage fatigue characteristic of steering
wheel tie rod for 200000 km).
Fig. 7. Steering wheel tie rod Mission Profile rain-flow
histogram (200 000 km)
4. Simulation of Experimental Data by Finite Element
Analysis
4.1. Steering wheel tie rod CAD model
Fig. 8 shows the CAD model of the steering wheel ties
rod was designed in Solidworks software program [25]. Tetra
hydrogen solid elements were used for the steering wheel tie
rod in order to precise modelling due to having a complex
structure especially on the neck of the rod surface [26]. Then
3D CAD model of the steering wheel rod was exported to
ANSYS program to perform FEA analysis. 3D CAD model
of driving shaft was formed from 72233 tetra hexagon
elements and 124827 nodes is presented in Fig.9 [26].
Fig. 8. CAD model of steering wheel tie rod
Fig. 9. FE Model of the steering wheel tie rod
4.2. Boundary Condition
The steering wheel tie rod’s boundary condition of is
illustrated in Fig.10. As it can be seen from illustration, the
red arrow at the right surface of tie rod demonstrates the
applied axial pulling load direction, which is allowed free
only extension axis while the other balling rod side that is
demonstrated with blue arrow that is connected to knuckle
with a bold, is demonstrated and the fixed point is not
allowed freely both rotation and shift every three axis [26,
27].
Fig. 10. Boundary conditions
The ball joint connection between the surface and the
spherical guide surface around 3 degrees of freedom (DOF)
has been defined links. Because the steering wheel tie rod is
fixed from the each side both steering wheel cramayer shaft
and the rack at the knuckle freedom is allowed to return are
depicted. Here, in three axes of translational freedom (x, y, z)
of linear movement, the freedom of rotation in three axes
(Rx, Rz, Rz) represents rotation.
4.3. Static and Fatigue Analysis
Fig.11. shows the most critical load signal, which was
acquired during road test in Turkey, of the steering wheel tie
rod used for the linear static analysis of part.
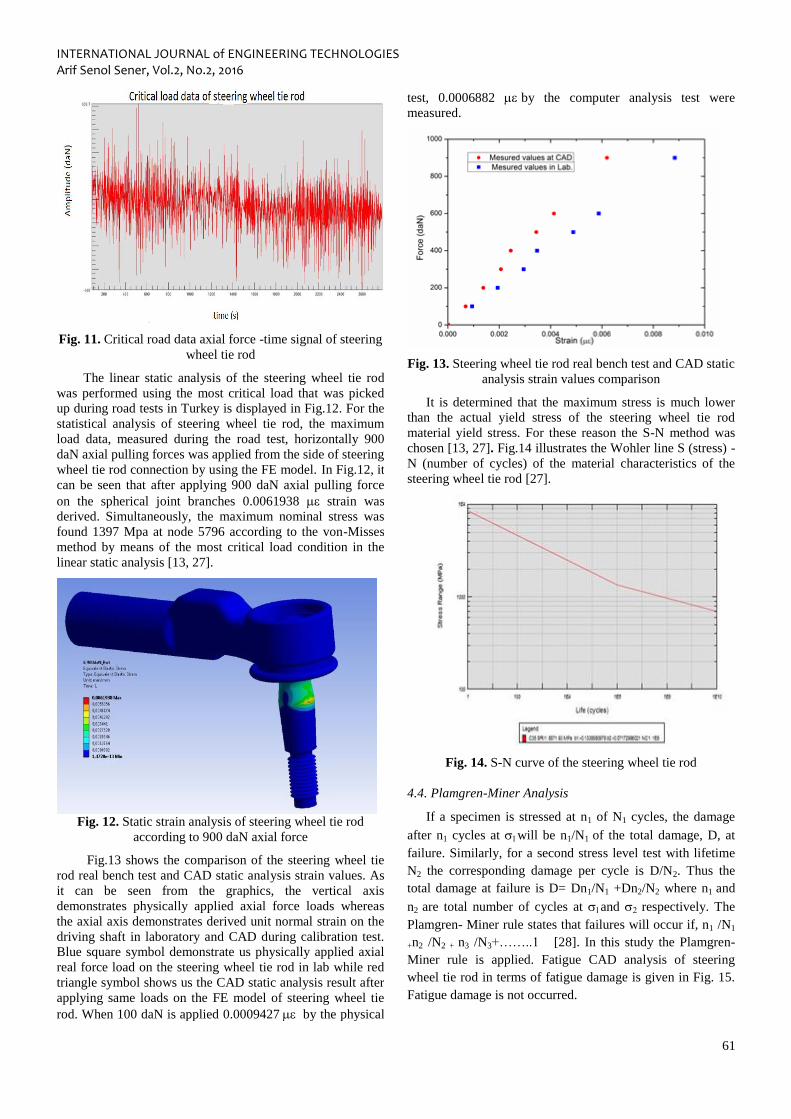
INTERNATIONAL JOURNAL of ENGINEERING TECHNOLOGIES Arif Senol Sener, Vol.2, No.2, 2016
61
Fig. 11. Critical road data axial force -time signal of steering
wheel tie rod
The linear static analysis of the steering wheel tie rod
was performed using the most critical load that was picked
up during road tests in Turkey is displayed in Fig.12. For the
statistical analysis of steering wheel tie rod, the maximum
load data, measured during the road test, horizontally 900
daN axial pulling forces was applied from the side of steering
wheel tie rod connection by using the FE model. In Fig.12, it
can be seen that after applying 900 daN axial pulling force
on the spherical joint branches 0.0061938 strain was
derived. Simultaneously, the maximum nominal stress was
found 1397 Mpa at node 5796 according to the von-Misses
method by means of the most critical load condition in the
linear static analysis [13, 27].
Fig. 12. Static strain analysis of steering wheel tie rod
according to 900 daN axial force
Fig.13 shows the comparison of the steering wheel tie
rod real bench test and CAD static analysis strain values. As
it can be seen from the graphics, the vertical axis
demonstrates physically applied axial force loads whereas
the axial axis demonstrates derived unit normal strain on the
driving shaft in laboratory and CAD during calibration test.
Blue square symbol demonstrate us physically applied axial
real force load on the steering wheel tie rod in lab while red
triangle symbol shows us the CAD static analysis result after
applying same loads on the FE model of steering wheel tie
rod. When 100 daN is applied 0.0009427by the physical
test, 0.0006882 by the computer analysis test were
measured.
Fig. 13. Steering wheel tie rod real bench test and CAD static
analysis strain values comparison
It is determined that the maximum stress is much lower
than the actual yield stress of the steering wheel tie rod
material yield stress. For these reason the S-N method was
chosen [13, 27]. Fig.14 illustrates the Wohler line S (stress) -
N (number of cycles) of the material characteristics of the
steering wheel tie rod [27].
Fig. 14. S-N curve of the steering wheel tie rod
4.4. Plamgren-Miner Analysis
If a specimen is stressed at n1 of N1 cycles, the damage
after n1 cycles at will be n1/N1 of the total damage, D, at
failure. Similarly, for a second stress level test with lifetime
N2 the corresponding damage per cycle is D/N2. Thus the
total damage at failure is D= Dn1/N1 +Dn2/N2 where n1 and
n2 are total number of cycles at and respectively. The
Plamgren- Miner rule states that failures will occur if, n1 /N1
+n2 /N2 + n3 /N3+……..1 [28]. In this study the Plamgren-
Miner rule is applied. Fatigue CAD analysis of steering
wheel tie rod in terms of fatigue damage is given in Fig. 15.
Fatigue damage is not occurred.
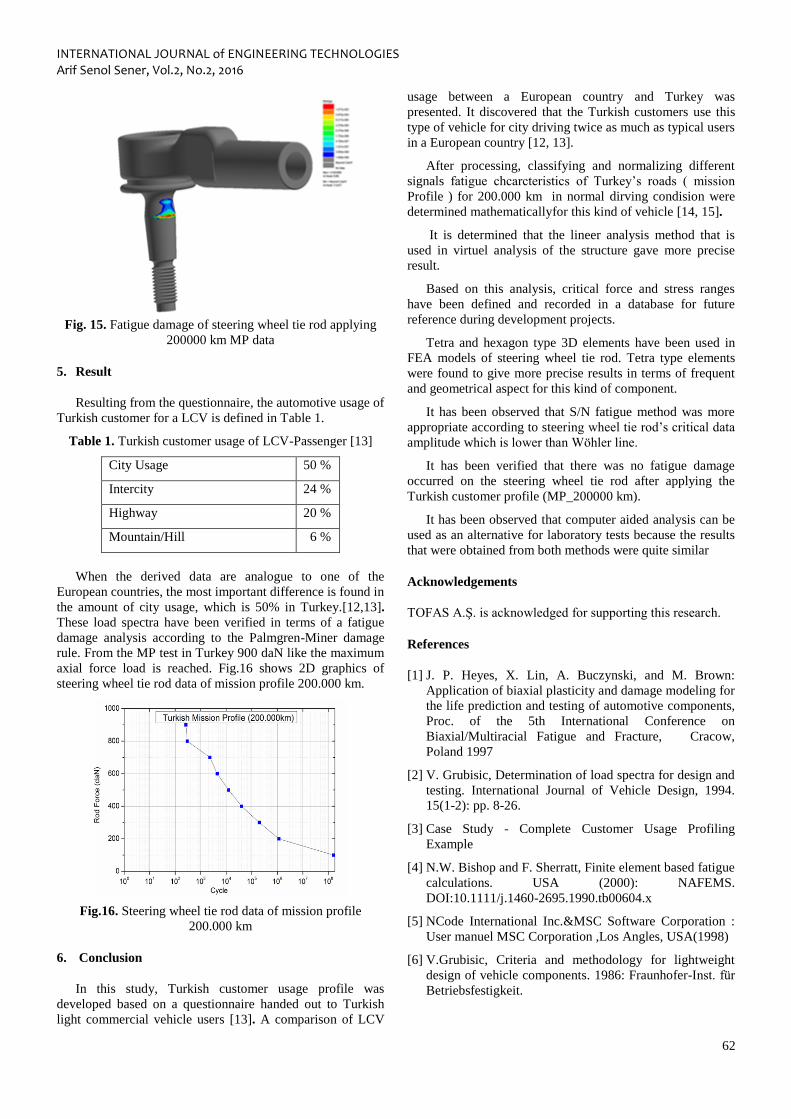
INTERNATIONAL JOURNAL of ENGINEERING TECHNOLOGIES Arif Senol Sener, Vol.2, No.2, 2016
62
Fig. 15. Fatigue damage of steering wheel tie rod applying
200000 km MP data
5. Result
Resulting from the questionnaire, the automotive usage of
Turkish customer for a LCV is defined in Table 1.
Table 1. Turkish customer usage of LCV-Passenger [13]
City Usage 50 %
Intercity 24 %
Highway 20 %
Mountain/Hill 6 %
When the derived data are analogue to one of the
European countries, the most important difference is found in
the amount of city usage, which is 50% in Turkey.[12,13].
These load spectra have been verified in terms of a fatigue
damage analysis according to the Palmgren-Miner damage
rule. From the MP test in Turkey 900 daN like the maximum
axial force load is reached. Fig.16 shows 2D graphics of
steering wheel tie rod data of mission profile 200.000 km.
Fig.16. Steering wheel tie rod data of mission profile
200.000 km
6. Conclusion
In this study, Turkish customer usage profile was
developed based on a questionnaire handed out to Turkish
light commercial vehicle users [13]. A comparison of LCV
usage between a European country and Turkey was
presented. It discovered that the Turkish customers use this
type of vehicle for city driving twice as much as typical users
in a European country [12, 13].
After processing, classifying and normalizing different
signals fatigue chcarcteristics of Turkey’s roads ( mission
Profile ) for 200.000 km in normal dirving condision were
determined mathematicallyfor this kind of vehicle [14, 15].
It is determined that the lineer analysis method that is
used in virtuel analysis of the structure gave more precise
result.
Based on this analysis, critical force and stress ranges
have been defined and recorded in a database for future
reference during development projects.
Tetra and hexagon type 3D elements have been used in
FEA models of steering wheel tie rod. Tetra type elements
were found to give more precise results in terms of frequent
and geometrical aspect for this kind of component.
It has been observed that S/N fatigue method was more
appropriate according to steering wheel tie rod’s critical data
amplitude which is lower than Wöhler line.
It has been verified that there was no fatigue damage
occurred on the steering wheel tie rod after applying the
Turkish customer profile (MP_200000 km).
It has been observed that computer aided analysis can be
used as an alternative for laboratory tests because the results
that were obtained from both methods were quite similar
Acknowledgements
TOFAS A.Ş. is acknowledged for supporting this research.
References
[1] J. P. Heyes, X. Lin, A. Buczynski, and M. Brown:
Application of biaxial plasticity and damage modeling for
the life prediction and testing of automotive components,
Proc. of the 5th International Conference on
Biaxial/Multiracial Fatigue and Fracture, Cracow,
Poland 1997
[2] V. Grubisic, Determination of load spectra for design and
testing. International Journal of Vehicle Design, 1994.
15(1-2): pp. 8-26.
[3] Case Study - Complete Customer Usage Profiling
Example
[4] N.W. Bishop and F. Sherratt, Finite element based fatigue
calculations. USA (2000): NAFEMS.
DOI:10.1111/j.1460-2695.1990.tb00604.x
[5] NCode International Inc.&MSC Software Corporation :
User manuel MSC Corporation ,Los Angles, USA(1998)
[6] V.Grubisic, Criteria and methodology for lightweight
design of vehicle components. 1986: Fraunhofer-Inst. für
Betriebsfestigkeit.
INTERNATIONAL JOURNAL of ENGINEERING TECHNOLOGIES Arif Senol Sener, Vol.2, No.2, 2016
63
[7] K.Ahlin, J. Granlund, and F. Lindstrom, Comparing road
profiles with vehicle perceived roughness. International
Journal of Vehicle Design, 2004. 36(2-3): p. 270-286.
[8] M.Fantacchiotti. and M. Vianello. Gradual improvement
to the vehicle reliability up to the target value. in 4th
International Conference ATA, Firenze. 1994.
[9] P.Paul, et al., Techniques for Accelerated Design
Validation of Tractor Chassis. 2001, SAE Technical
Paper ,01 pp.1-50
[10] F. D’Aprile, et al., Structural characterization of a
vehicle on a rig test versus different road profiles:
analysis of experimental results. ATA-TORINO-, 2001.
54(7/8): p. 251-261
[11] C.Marchesani. F. Parmigiani, and M. Vianello (1979)
Integrated method to define the mission profile of a
passenger car ’FIAT Auto S.p.A., Study Report (in
Italian)
[12] V. Pizzari, Ricerca del profilo di Missione vetture
segment B Turchia,. 1998: Turkish Ciklo Relazione
Prot. No. 1 -1998, D.T.S.V. Affidabilita’ e Terreni
Prova Laboratorio Misure (in Italian), Arese.
[13] A.S.Sener, Fatigue life determination of the leaf spring
on the light commercial vehicle according to Turkish
Mission Profile (in Turkish). 2003, Yildiz Technical
University.
[14] A.S.Sener, Finite Element Based Vehicle Component
Fatigue Life Assessment According to a Customer
Usage Profile. Materials Testing, 2014. 56(3): p. 198-
207.Magnetism, 3rd ed., vol. 2. Oxford: Clarendon
Press, 1892, pp.68-73. (Book)
[15] A.S.Sener, Fatigue life assessment of the driving shaft
of a LCV by FEA using customer correlation data
Materials Testing, 2016. 58(4): p. 325-332,
DOI.10.3139/120.110861H.
[16] A.Falah, M. Alfares, and A. Elkholy, Failure
investigation of a tie rod end of an automobile steering
system. Engineering Failure Analysis, 2007. 14 (5): p.
895-902.
[17] M.A.Patil, D. Chavan, and M.K.U.S. Ghorpade, FEA of
Tie Rod of Steering System of Car. International Journal of
Application or Innovation Engineering and Management,
2013. 2(5): p. 222-227.
[18] J.Kim, J. et al., Structural design of an outer tie rod for a
passenger car. International Journal of Automotive
Technology, 2011. 12(3): p. 375-381.
[19] M.K.Pehlivan and M.Ozsoy, Computer aided structural
analysis of rot head. Bilecik Şeyh Edebali Universitesi Fen
Bilimleri Dergisi, 2014. 1(1): p. 45-51
[20] Regulation on Warranty application basis ( in Turkish )
2003.
[21] M.Gobbi and G. Mastinu, Expected fatigue damage of
road vehicles due to road excitation. Vehicle System
Dynamics, 1998. 29(S1): p. 778-788.
[22] MSC. Software GmbH nSoft volumes 5.2 User Manuel.
1999.
[23] ASTM Standard E 1049-85, Philadelphia, USA. 1997.
[24] N.Bishop et al., ’Analytical Fatigue Life Assessment of
Vibration Induced Fatigue Damage ‘. MSC World Users
Conference, Universal City, CA, 1995.
[25] SolidWorks. 2011.
[26] ANSYS. 2012.
[27] The Ncode Book of Fatigue Theory, Ncode Technical
Reference Book V4.3. Document rel 1.0, MSC Corporation.
2000.
[28] M.A.Miner, Cumulative damage in fatigue. Journal of
applied mechanics, 1945. 12(3): p. 159-164.

INTERNATIONAL JOURNAL of ENGINEERING TECHNOLOGIES Vedat Karaman et al., Vol.2, No.2, 2016
64
Improvement of Density, Viscosity and Cold Flow
Properties of Palm Oil Biodiesel by Alcohol Addition
Erinc Uludamar*, Vedat Karaman**‡, Safak Yildizhan***, Hasan Serin***
*Department of Mechanical Engineering, Cukurova University, 01330, Adana, Turkey.
**Department of Automotive Engineering, Istanbul Gelisim University, 34315, Istanbul, Turkey.
***Department of Automotive Engineering, Cukurova University, 01330, Adana, Turkey.
([email protected], [email protected], [email protected], [email protected])
‡Corresponding Author; Vedat Karaman, Department of Automotive Engineering, Gelisim University, 34315, Istanbul,
Turkey, Tel: +90 212 422 70 00, Fax:+90 212 422 74 01, [email protected]
Received: 29.04.2016 Accepted: 01.06.2016
Abstract-Alternative fuel researches has gained very importance due to depletion threads of fossil fuels, strictly narrowing
emission regulations and high cost of petroleum. Biodiesel one of the most favorite alternative fuels since it is renewable and
cleaner energy source. Many vegetable oils and animal fats are used for biodiesel production as raw material. Palm oil is an
edible vegetable oil derived from the mesocarp (reddish pulp) of the fruit of the oil palms which is produced widely in some
regions and used as raw material for many industrial sectors. Palm oil can be used as feedstock for biodiesel production but it
has some drawbacks such as high viscosity and bad cold flow properties. In this study, some fuel properties of biodiesel
produced from palm oil and its blends with various alcohols such as isopropyl alcohol, ethanol, and methanol were
investigated. The study showed that the inadequate fuel properties of palm oil biodiesel such as viscosity and cold flow
properties can be improved with varıous alcohol addition with the POME-5% methanol (CH3OH).
Keywords: Biodiesel, False Flax Oil, Camelina Sativa, Transesterification, Fuel
1. Introduction
The diesel engines are the dominant tool of the field of
commercial transportation and agricultural engine usage
because of operational simplicity and fuel economy. Diesel
engines have lower fuel consumption compared to petrol
engines and higher torque production of diesel engines
makes more favorable than gasoline engines[1]. Diesel
fuel which is the main fuel of compression ignition
engines are petroleum based fossil fuels. Depletion of
fossil fuels, high cost and environmental concerns are
significant problems and many researchers are studying on
these particular subjects.
Alternative fuel researches are getting attention by
many researchers. The one of the mostly studied
alternative fuels are biodiesels which are produced with
transesterification reaction of oil fats with alcohol in the
presence of a catalyst. Biodiesel fuel can be produced from
vegetable oils and animal fats. The main reason of too
much interest on biodiesel fuel is the advantage of being a
renewable energy source. Furthermore, being a cleaner
energy source due to its extra oxygen content in the
chemical composition which enhances the combustion and
also sulfur-free structure make biodiesel more eco-
friendly. Many researchers investigated various feedstocks
for biodiesel production particularly waste materials and
non-edible vegetable oils or animal fats [2-12]. On the
other hand, biodiesel fuel has some drawbacks such as
higher oxides of nitrogen (NOx), lower calorific value, and
inadequate fuel properties of some feedstocks for direct
usage in diesel engines. Especially, some fuel properties
such as density, viscosity and cold flow properties which
directly affects the performance of engine and fuel
injection system are main problems occur with some
feedstocks. In literature there are many studies which
investigate the various fuel additives to biodiesels for
improving the fuel properties [13-17].

INTERNATIONAL JOURNAL of ENGINEERING TECHNOLOGIES Vedat Karaman et al., Vol.2, No.2, 2016
65
Palm oil is an edible vegetable oil derived from the
mesocarp (reddish pulp) of the fruit of the oil palms,
primarily the African oil palm Elaeis guineensis [18] and
to a lesser extent from the American oil palm Elaeis
oleifera and the maripa palm Attalea maripa. Biodiesel
production from palm oil has been investigated by many
researchers . The main drawback of palm oil is being in
solid phase in the room temperature which causes
inadequate cold flow properties. These important
drawbacks were investigated by many researchers to
improve the fuel properties with some fuel additives [19-
22].
In this study, biodiesel produced from palm oil were
mixed with various alcohols in order to improve density,
viscosity and cold flow properties.
2. Experimental
The experimental study was conducted in Petroleum
Research and Automotive Engineering Laboratories of the
Department of Automotive Engineering at Çukurova
University. Palm oil was used as raw material for biodiesel
production. The samples of palm oil were supplied from a
local oil company, Adana, Turkey.
Palm oil is a edible vegetable oil derived from the
mesocarp and common cooking ingredient in the tropical
belt of Africa, Southeast Asia and parts of Brazil. It is used
in the commercial food industry in some regions due to its
low cost [23].
Palm oil methyl ester (POME) was produced by using
the transesterification method. In this reaction, methyl
alcohol and was used as reactant and catalyst in the
reaction was sodium hydroxide (NaOH). The chemicals
(methanol and sodium hydroxide) which were used during
the experiments were purchased from Merck and methanol
was purified prior to use. Before transesterification
reaction the palm oil which is in the solid phase was
heated and liquefied. In order to obtain best production
condition, transesterification reaction was carried out in a
spherical glass reactor equipped with reflux condenser,
stirrer and thermometer. In the reaction, molar ratio of
alcohol to oil was 6:1. The reaction were performed with ,
methanol 20 wt %, sodium hydroxide 0.5 wt %,
temperature 65 oC, time 90 minutes. Methanol and sodium
hydroxide were mixed in order to obtain sodium
methoxide. Then, sodium methoxide and palm oil were
mixed in the reactor. The mixture was heated up to 65 oC
and kept at this temperature for 90 minutes by stirring.
After the reaction period, the crude methyl ester was
waited at separating funnel for 8 hours. And then, crude
glycerin was separated from methyl ester. Finally, the
crude methyl ester was washed by warm water until the
washed water became clear and dried at 105 oC for 1 hour.
Finally washed and dried methyl ester was passed through
a filter. At the end of the transesterification reaction 98%
conversion of oil was obtained.
In the study, 3 different alcohols were blended with
palm oil biodiesel in order to improve some important fuel
properties. Alcohols used in the experiments were
isopropyl alcohol (2-propanol, C3H8O), ethanol (C2H5OH)
and methanol (CH3OH). Each alcohol was blended with
palm oil 3% and 5% by volume of blend. The blends and
the name of test samples were given in Table 1. Some fuel
properties alcohols used in this study such as purity,
density, melting point, dynamic viscosity, molar mass, and
water content were given in Table 2. Table 3 shows the
instruments used in this study for fuel property
measurements.
Table 1. Experimental fuels
Fuel Name Composition Test Fuel
Number
Palm oil methyl ester
(POME) 100% POME 1
POME + Isopropyl
Alcohol (C3H8O)
97% POME +
3% C3H8O 2
POME + Isopropyl
Alcohol (C3H8O)
95% POME +
5% C3H8O 3
POME + Ethanol
(C2H5OH)
97% POME +
3% C2H5OH 4
POME + Ethanol
(C2H5OH)
95% POME +
5% C2H5OH 5
POME + Methanol
(CH3OH)
97% POME +
3% CH3OH 6
POME + Methanol
(CH3OH)
95% POME +
5% CH3OH 7
Table 2. Fuel properties of alcohols
Specificati
on Unit
Isopropyl
Alcohol
(C3H8O)
Ethanol
(C2H5OH)
Methanol
(CH3OH)
Purity
(GC) % >=99,5 >=99.0 >=99,8
Density
(20 oC)
gr/cm3 0,785-0,790 0,791-0,793 0,791-0,793
Melting
Point oC -89 -116 -97,6
Viscosity
Dynamical
(20 oC)
m.Pa.s 2,20 1,2 0,545
Molar Mass gr/mol 60,1 32,04 32,04
Water (K.F.) <=0,5 <=0,5 <=0,1
Table 3. Fuel properties and measurement devices
Property Device Accuracy
Density
Kyoto
Electronics DA-
130
±0.001 g/cm3
Viscosity
TANAKA
AKV-202 Auto
Kinematic
Viscosity
-
Pour/Cloud
Point
Tanaka MPC-
102L
Pour/Cloud
Point Tester
-
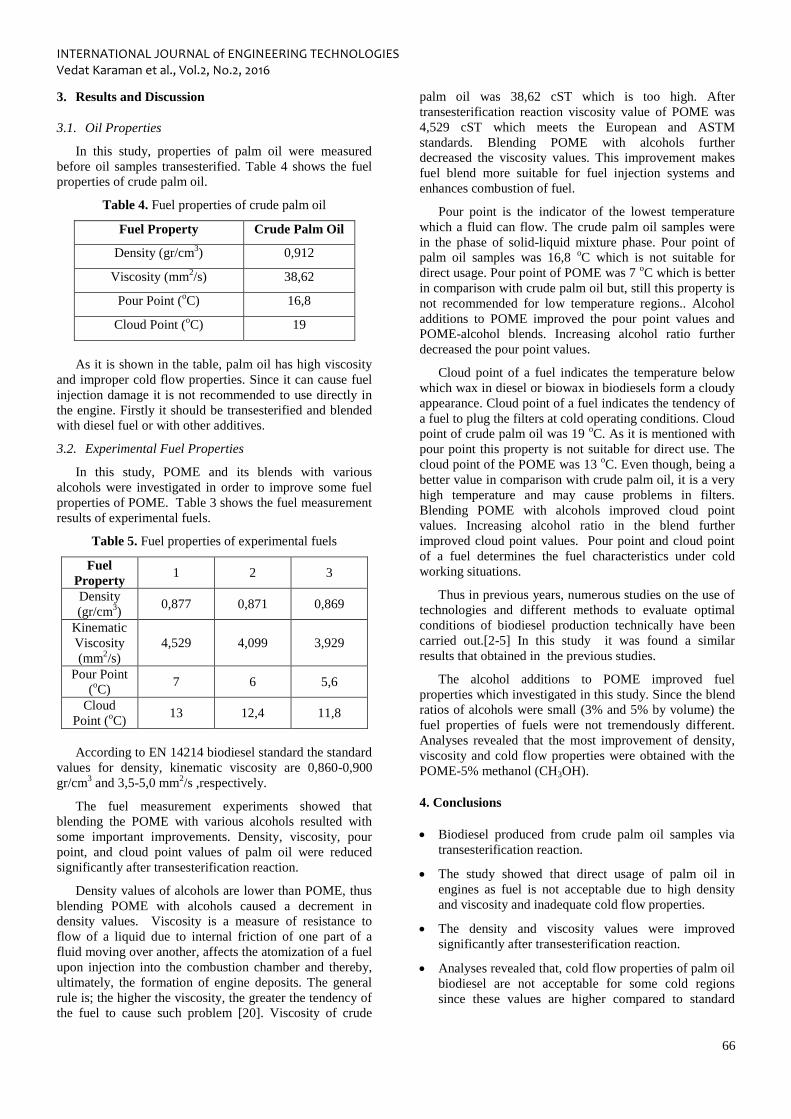
INTERNATIONAL JOURNAL of ENGINEERING TECHNOLOGIES Vedat Karaman et al., Vol.2, No.2, 2016
66
3. Results and Discussion
3.1. Oil Properties
In this study, properties of palm oil were measured
before oil samples transesterified. Table 4 shows the fuel
properties of crude palm oil.
Table 4. Fuel properties of crude palm oil
Fuel Property Crude Palm Oil
Density (gr/cm3) 0,912
Viscosity (mm2/s) 38,62
Pour Point (oC) 16,8
Cloud Point (oC) 19
As it is shown in the table, palm oil has high viscosity
and improper cold flow properties. Since it can cause fuel
injection damage it is not recommended to use directly in
the engine. Firstly it should be transesterified and blended
with diesel fuel or with other additives.
3.2. Experimental Fuel Properties
In this study, POME and its blends with various
alcohols were investigated in order to improve some fuel
properties of POME. Table 3 shows the fuel measurement
results of experimental fuels.
Table 5. Fuel properties of experimental fuels
Fuel
Property 1 2 3
Density
(gr/cm3)
0,877 0,871 0,869
Kinematic
Viscosity
(mm2/s)
4,529 4,099 3,929
Pour Point
(oC)
7 6 5,6
Cloud
Point (oC)
13 12,4 11,8
According to EN 14214 biodiesel standard the standard
values for density, kinematic viscosity are 0,860-0,900
gr/cm3 and 3,5-5,0 mm
2/s ,respectively.
The fuel measurement experiments showed that
blending the POME with various alcohols resulted with
some important improvements. Density, viscosity, pour
point, and cloud point values of palm oil were reduced
significantly after transesterification reaction.
Density values of alcohols are lower than POME, thus
blending POME with alcohols caused a decrement in
density values. Viscosity is a measure of resistance to
flow of a liquid due to internal friction of one part of a
fluid moving over another, affects the atomization of a fuel
upon injection into the combustion chamber and thereby,
ultimately, the formation of engine deposits. The general
rule is; the higher the viscosity, the greater the tendency of
the fuel to cause such problem [20]. Viscosity of crude
palm oil was 38,62 cST which is too high. After
transesterification reaction viscosity value of POME was
4,529 cST which meets the European and ASTM
standards. Blending POME with alcohols further
decreased the viscosity values. This improvement makes
fuel blend more suitable for fuel injection systems and
enhances combustion of fuel.
Pour point is the indicator of the lowest temperature
which a fluid can flow. The crude palm oil samples were
in the phase of solid-liquid mixture phase. Pour point of
palm oil samples was 16,8 oC which is not suitable for
direct usage. Pour point of POME was 7 oC which is better
in comparison with crude palm oil but, still this property is
not recommended for low temperature regions.. Alcohol
additions to POME improved the pour point values and
POME-alcohol blends. Increasing alcohol ratio further
decreased the pour point values.
Cloud point of a fuel indicates the temperature below
which wax in diesel or biowax in biodiesels form a cloudy
appearance. Cloud point of a fuel indicates the tendency of
a fuel to plug the filters at cold operating conditions. Cloud
point of crude palm oil was 19 oC. As it is mentioned with
pour point this property is not suitable for direct use. The
cloud point of the POME was 13 oC. Even though, being a
better value in comparison with crude palm oil, it is a very
high temperature and may cause problems in filters.
Blending POME with alcohols improved cloud point
values. Increasing alcohol ratio in the blend further
improved cloud point values. Pour point and cloud point
of a fuel determines the fuel characteristics under cold
working situations.
Thus in previous years, numerous studies on the use of
technologies and different methods to evaluate optimal
conditions of biodiesel production technically have been
carried out.[2-5] In this study it was found a similar
results that obtained in the previous studies.
The alcohol additions to POME improved fuel
properties which investigated in this study. Since the blend
ratios of alcohols were small (3% and 5% by volume) the
fuel properties of fuels were not tremendously different.
Analyses revealed that the most improvement of density,
viscosity and cold flow properties were obtained with the
POME-5% methanol (CH3OH).
4. Conclusions
Biodiesel produced from crude palm oil samples via
transesterification reaction.
The study showed that direct usage of palm oil in
engines as fuel is not acceptable due to high density
and viscosity and inadequate cold flow properties.
The density and viscosity values were improved
significantly after transesterification reaction.
Analyses revealed that, cold flow properties of palm oil
biodiesel are not acceptable for some cold regions
since these values are higher compared to standard

INTERNATIONAL JOURNAL of ENGINEERING TECHNOLOGIES Vedat Karaman et al., Vol.2, No.2, 2016
67
fuels used in market and contingency of causing fuel
injection system failures.
Blending POME with alcohols improved cold flow
properties of test fuels. Increasing alcohol ratio in the
blend further improved these values.
According to study, it not recommended to use crude
palm oil or palm oil methyl ester directly in the engine.
Direct usage may cause fuel injection system failures.
Palm oil properties were improved by adding alcohol
and it make a more utilizable.
References
[1] Ramadhas A.S., Muraleedharan C. and Jayaraj S.,
“Performance and Emission Evaluation of a Diesel Engine
Fueled with Methyl Esters of Rubber Seed Oil”,
Renewable Energy, vol. 30, pp. 1789-1800, 2005.
[2] Ozcanli M., Serin H., Aydin K. and Serin S., “Ricinus
Communis (Castor Oil) methyl ester as a natural additive
for biodiesel fuel”, Energy Education Science and
Technology Part A: Energy Science and Research vol.
27(2), pp. 331-336, 2011.
[3] Serin H., M. Ozcanli, M.K. Gokce., G. Tuccar.
Biodiesel Production From Tea Seed (Camellia Sinensis)
Oil and its Blends With Diesel Fuel” International Journal
of Green Energy, vol.10:4,pp. 370-377,2013.
[4] Juan C., Acevedoa C., Hernándeza J.A., Valdés C.F.
and Kumar S., “Analysis of operating costs for producing
biodiesel from palm oil at pilot-scale in Colombia”,
Bioresource Technology, vol.188, pp.117–123, 2015.
[5] Anwar F., Rashid U., Ashraf M. and Nadeem M.,
“Okra (Hibiscus esculentus) seed oil for biodiesel
production”, Applied Energy, vol.87, pp.779-785, 2010.
[6] Balusamy T. and Marappan R., “Effect of injection
time and injection pressure on ci engine fuelled with
methyl ester of thevetia peruviana seed oil”, International
Journal of Green Energy, vol.7, pp.397-409, 2010.
[7] Saribiyik O.Y., Ozcanli M., Serin H., Serin S. and
Aydin K., “Biodiesel production from ricinus communis
oil and its blends with soybean biodiesel. Strojniški
vestnik”, Journal of Mechanical Engineering, vol. 56,
pp.811-816, 2010.
[8] Altun S.. “Fuel properties of biodiesels produced from
different feed stocks”, Energy Educ. Sci. Technol. Part A
vol.26, pp.165-174, 2011.
[9] Caynak S., Gürü M., Biçer A., Keskin A. and Içingür
Y., “Biodiesel production from pomace oil and
improvement of its properties with synthetic manganese
additive”, Fuel vol.88, pp.534-538, 2009.
[10] Canakci M. and Van Gerpen J.H., “Compression of
engine performance and emission for petroleum diesel
fuel, yellow grease biodiesel, and soybean oil biodiesel”,
Trans. ASAE, vol.46, pp.937–44, 2003.
[11] Usta N., “Use of tobacco seed oil methyl ester in a
turbocharged indirect injection diesel engine”, Biomass
and Bioenergy, vol.28, pp.77-86, 2005.
[12] Hamamci C., Saydut A., Tonbul Y., Kaya C. and
Kafadar A.B., “Biodiesel production via transesterification
from safflower (Carthamus tinctorius L.) seed oil”, Energy
Sources, Part A, vol.33, pp.512–520, 2011.
[13] Jianxin L.L., Zhi W. and Jianhua X., “Combustion
and emission characteristics of diesel engine fueled with
diesel/biodiesel/pentanol fuel blends”, Fuel, vol.15 pp.
211-218, 2015.
[14] Karabektas M. and Hosoz M., “Performance and
emission characteristics of a diesel engine using
isobutanol–diesel fuel blends”, Renewable Energy, vol.34,
pp.1554-1559, 2009.
[15] Yilmaz N. and Vigil F.M., “Potential use of a blend
of diesel, biodiesel, alcohols and vegetable oil in
compression ignition engines”, Fuel, vol. 124, pp. 168–
172, 2014.
[16] Yasin M.H.M., Yusaf T., Mamat R. and Yusop A.F.,
“Characterization of a diesel engine operating with a small
proportion of methanol as a fuel additive in biodiesel
blend”, Applied Energy, vol.114, pp. 865–873, 2014.
[17] Yasin M.H.M., Mamat R., Yusop A.F., Rahim R.,
Aziz A. and Shah L.A.,” Fuel Physical Characteristics of
Biodiesel Blend Fuels with Alcohol as Additives,
Procedia”, Engineering, vol.53, pp.701-706, 2013.
[18] Reeves J.B. and Weihrauch J.L., “Consumer and
Food Economics Institute (1979). Composition of foods:
fats and oils”, Agriculture Handbook 8-4. Washington,
D.C.: U.S. Dept. of Agriculture, Science and Education
Administration. p. 4. OCLC 5301713.
[19] Poon, L.Y., Hashim, H., Mat, R., and Mustaffa,
A.A.,” Flash point prediction of tailor-made green diesel
blends containing B5 palm oil biodiesel and alcohol” Fuel,
vol.175, pp.287-293 2016.
[20] Puneet V., Sharma M.P. and Gaurav D., “Impact of
alcohol on biodiesel production and properties”,
Renewable and Sustainable Energy Reviews, vol.56, pp.
319–333, 2016.
[21] Lv P., Cheng Y., Yang L., Yuan Z., Li. H. and Luo
W., “Improving the low temperature flow properties of
palm oil biodiesel: Addition of cold flow improver”, Fuel
Processing Technology, vol.110 pp. 61-64, 2013.
[22] “Palm Oil Continues to Dominate Global
Consumption in 2006/07” (PDF) (Press release). United
States Department of Agriculture. June 2006. Retrieved 22
September 2009.
[23] Gerpen J.V., Shanks R.P., Clements D. and Knothe
G., “Biodiesel Analytic Methods, National Renewable
Energy Laboratory”, Colorado, 2004.

INTERNATIONAL JOURNAL of ENGINEERING TECHNOLOGIES Sener Karabulut, Vol.2, No.2, 2016
68
Study on Machining Parameters for Thrust Force
and Torque in Milling AA7039 Composites
Reinforced with Al2O3/B4C/SiC Particles
Sener Karabulut‡
Department of Mechanical Program, Hacettepe University, 06935 Ankara, Turkey.
‡ Corresponding Author; Department of Mechanical Program, Hacettepe University, 06935 Ankara, Turkey, Tel: +90 312 267
30 20, Fax: +90 312 267 33 38, [email protected]
Received: 20.05.2016 Accepted: 06.06.2016
Abstract-Metal matrix composites are used in many industrial fields such as automobile, military and aerospace applications
due to their superior mechanical properties. In the present study, three aluminum 7039 metal matrix composite (MMCs)
samples reinforced with 10 wt.% particulates of aluminum oxide (Al2O3), 10 wt.% boron carbide (B4C), and 10 wt.% silicon
carbide (SiC) were successfully fabricated using a powder metallurgy and hot extrusion method. The influences of cutting
parameters on the thrust cutting force and torque during milling of the three MMCs were investigated under dry machining
conditions. The milling tests were performed based on the Taguchi orthogonal -array design of experiments, for
different machining parameters such as cutting speed, feed and depth of cut. The effect of reinforcement contents on cutting
force and torque were specified by utilizing analysis of variance (ANOVA). Mathematical models have been generated for the
thrust force and torque through regression method. The results indicated that the minimal thrust force and torque were obtained
in the machining of the Al2O3 reinforced specimen. The cutting force was directly influenced by the cutting feed and the axial
cutting depth was the most effective machining parameter affecting milling torque in the machining of three composite
specimens. The experimental results were modeled using regression analysis and artificial neural networks (ANN) to predict
the thrust force and torque. The thrust force and torque were predicted with a mean squared error equal to 5.85% and 5.12%
respectively using ANN models.
Keywords: AA7039, Al2O3/B4C/SiC, thrust force, torque, milling.
1. Introduction In recent years, Aluminum based MMCs are being
attractive materials in a variety of engineering applications
such as automobile products, aerospace parts and armor
because of their excellent mechanical and thermal properties.
The different types of reinforcement ceramic particles are
used to improve the mechanical properties of the aluminum
alloys. Many researchers are preferred the Al2O3, B4C and
SiC particles as reinforcement element for their superior
mechanical properties. On the other hand, the
implementations of MMCs are restricted in a very specific
industry due to high fabrication cost and their poor
machinability [1-3]. Milling is one of the most common
machining process for the desired form and size by removing
material in industry. Milling operations are carried out to
produce 3 dimensional complex shapes products for
aerospace, automotive parts, mold and die at high quality
using advanced high speed machining technologies. Despite
the improving machining technologies, machining software,
CNC, CAD/CAM and cutting tool performances, the milling
operations are still limited due to the high cutting forces and
machining stabilities [4]. The determination of optimum
machining parameters, proper cutting tool material and
geometry for ideal cutting forces must be considered to meet
the increasing productivity demands and reliable machining.
Determination of the amplitude and frequency of the cutting
force and torque are the most important key parameter in
machining process in order to design of mechanical structure
of machine tool, machine tool components, bearings, jigs,
spindle and feed drive mechanisms, power consumption, tool
life and productivity based on physical constraints [5]. Many
researchers have been studied on metal cutting with different
points of view for over hundred years and developed a
several theories for cutting forces. One of the most popular
theory was established by Merchant based on the minimum
power consumption. The relationships among the forces
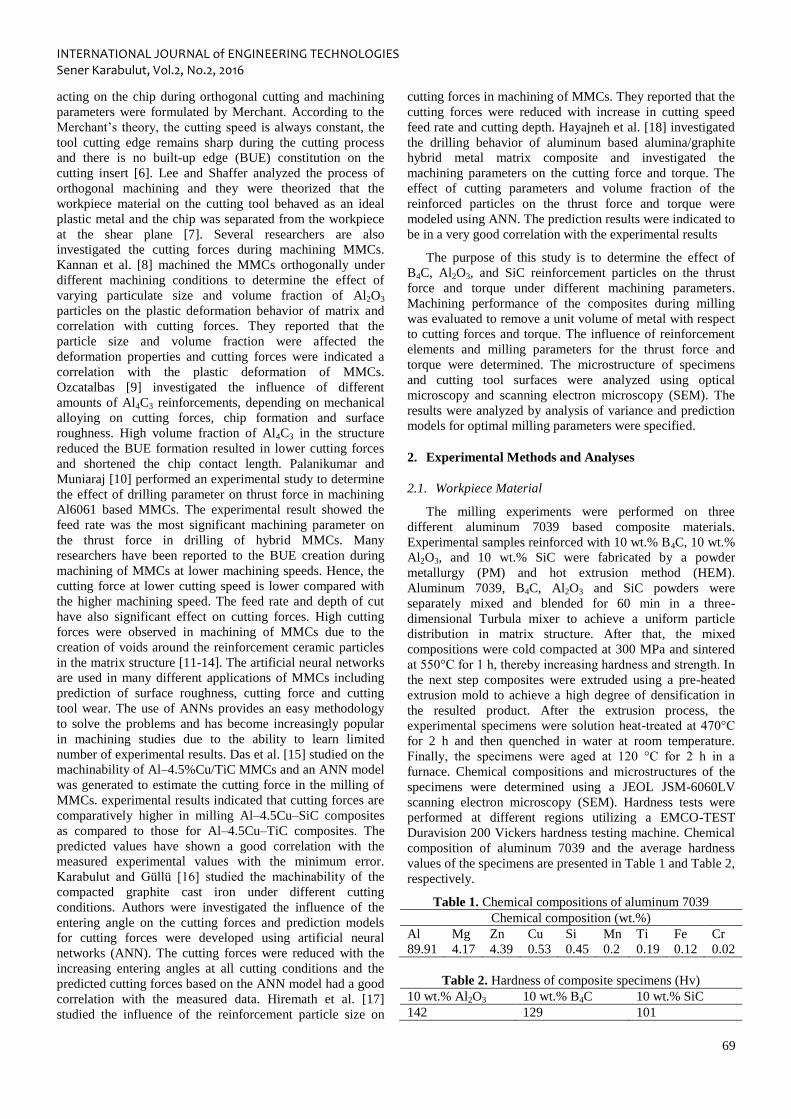
INTERNATIONAL JOURNAL of ENGINEERING TECHNOLOGIES Sener Karabulut, Vol.2, No.2, 2016
69
acting on the chip during orthogonal cutting and machining
parameters were formulated by Merchant. According to the
Merchant’s theory, the cutting speed is always constant, the
tool cutting edge remains sharp during the cutting process
and there is no built-up edge (BUE) constitution on the
cutting insert [6]. Lee and Shaffer analyzed the process of
orthogonal machining and they were theorized that the
workpiece material on the cutting tool behaved as an ideal
plastic metal and the chip was separated from the workpiece
at the shear plane [7]. Several researchers are also
investigated the cutting forces during machining MMCs.
Kannan et al. [8] machined the MMCs orthogonally under
different machining conditions to determine the effect of
varying particulate size and volume fraction of Al2O3
particles on the plastic deformation behavior of matrix and
correlation with cutting forces. They reported that the
particle size and volume fraction were affected the
deformation properties and cutting forces were indicated a
correlation with the plastic deformation of MMCs.
Ozcatalbas [9] investigated the influence of different
amounts of Al4C3 reinforcements, depending on mechanical
alloying on cutting forces, chip formation and surface
roughness. High volume fraction of Al4C3 in the structure
reduced the BUE formation resulted in lower cutting forces
and shortened the chip contact length. Palanikumar and
Muniaraj [10] performed an experimental study to determine
the effect of drilling parameter on thrust force in machining
Al6061 based MMCs. The experimental result showed the
feed rate was the most significant machining parameter on
the thrust force in drilling of hybrid MMCs. Many
researchers have been reported to the BUE creation during
machining of MMCs at lower machining speeds. Hence, the
cutting force at lower cutting speed is lower compared with
the higher machining speed. The feed rate and depth of cut
have also significant effect on cutting forces. High cutting
forces were observed in machining of MMCs due to the
creation of voids around the reinforcement ceramic particles
in the matrix structure [11-14]. The artificial neural networks
are used in many different applications of MMCs including
prediction of surface roughness, cutting force and cutting
tool wear. The use of ANNs provides an easy methodology
to solve the problems and has become increasingly popular
in machining studies due to the ability to learn limited
number of experimental results. Das et al. [15] studied on the
machinability of Al–4.5%Cu/TiC MMCs and an ANN model
was generated to estimate the cutting force in the milling of
MMCs. experimental results indicated that cutting forces are
comparatively higher in milling Al–4.5Cu–SiC composites
as compared to those for Al–4.5Cu–TiC composites. The
predicted values have shown a good correlation with the
measured experimental values with the minimum error.
Karabulut and Güllü [16] studied the machinability of the
compacted graphite cast iron under different cutting
conditions. Authors were investigated the influence of the
entering angle on the cutting forces and prediction models
for cutting forces were developed using artificial neural
networks (ANN). The cutting forces were reduced with the
increasing entering angles at all cutting conditions and the
predicted cutting forces based on the ANN model had a good
correlation with the measured data. Hiremath et al. [17]
studied the influence of the reinforcement particle size on
cutting forces in machining of MMCs. They reported that the
cutting forces were reduced with increase in cutting speed
feed rate and cutting depth. Hayajneh et al. [18] investigated
the drilling behavior of aluminum based alumina/graphite
hybrid metal matrix composite and investigated the
machining parameters on the cutting force and torque. The
effect of cutting parameters and volume fraction of the
reinforced particles on the thrust force and torque were
modeled using ANN. The prediction results were indicated to
be in a very good correlation with the experimental results
The purpose of this study is to determine the effect of
B4C, Al2O3, and SiC reinforcement particles on the thrust
force and torque under different machining parameters.
Machining performance of the composites during milling
was evaluated to remove a unit volume of metal with respect
to cutting forces and torque. The influence of reinforcement
elements and milling parameters for the thrust force and
torque were determined. The microstructure of specimens
and cutting tool surfaces were analyzed using optical
microscopy and scanning electron microscopy (SEM). The
results were analyzed by analysis of variance and prediction
models for optimal milling parameters were specified.
2. Experimental Methods and Analyses
2.1. Workpiece Material
The milling experiments were performed on three
different aluminum 7039 based composite materials.
Experimental samples reinforced with 10 wt.% B4C, 10 wt.%
Al2O3, and 10 wt.% SiC were fabricated by a powder
metallurgy (PM) and hot extrusion method (HEM).
Aluminum 7039, B4C, Al2O3 and SiC powders were
separately mixed and blended for 60 min in a three-
dimensional Turbula mixer to achieve a uniform particle
distribution in matrix structure. After that, the mixed
compositions were cold compacted at 300 MPa and sintered
at 550°C for 1 h, thereby increasing hardness and strength. In
the next step composites were extruded using a pre-heated
extrusion mold to achieve a high degree of densification in
the resulted product. After the extrusion process, the
experimental specimens were solution heat-treated at 470°C
for 2 h and then quenched in water at room temperature.
Finally, the specimens were aged at 120 °C for 2 h in a
furnace. Chemical compositions and microstructures of the
specimens were determined using a JEOL JSM-6060LV
scanning electron microscopy (SEM). Hardness tests were
performed at different regions utilizing a EMCO-TEST
Duravision 200 Vickers hardness testing machine. Chemical
composition of aluminum 7039 and the average hardness
values of the specimens are presented in Table 1 and Table 2,
respectively.
Table 1. Chemical compositions of aluminum 7039
Chemical composition (wt.%)
Al Mg Zn Cu Si Mn Ti Fe Cr
89.91 4.17 4.39 0.53 0.45 0.2 0.19 0.12 0.02
Table 2. Hardness of composite specimens (Hv)
10 wt.% Al2O3 10 wt.% B4C 10 wt.% SiC
142 129 101
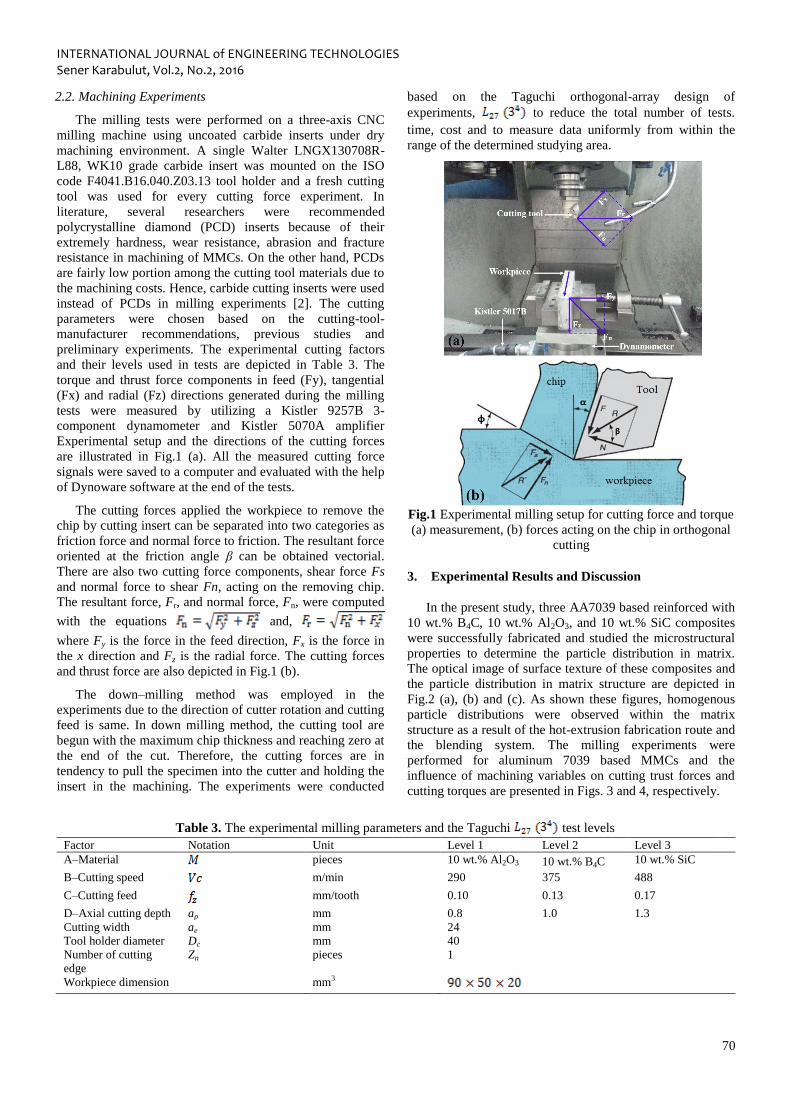
INTERNATIONAL JOURNAL of ENGINEERING TECHNOLOGIES Sener Karabulut, Vol.2, No.2, 2016
70
2.2. Machining Experiments
The milling tests were performed on a three-axis CNC
milling machine using uncoated carbide inserts under dry
machining environment. A single Walter LNGX130708R-
L88, WK10 grade carbide insert was mounted on the ISO
code F4041.B16.040.Z03.13 tool holder and a fresh cutting
tool was used for every cutting force experiment. In
literature, several researchers were recommended
polycrystalline diamond (PCD) inserts because of their
extremely hardness, wear resistance, abrasion and fracture
resistance in machining of MMCs. On the other hand, PCDs
are fairly low portion among the cutting tool materials due to
the machining costs. Hence, carbide cutting inserts were used
instead of PCDs in milling experiments [2]. The cutting
parameters were chosen based on the cutting-tool-
manufacturer recommendations, previous studies and
preliminary experiments. The experimental cutting factors
and their levels used in tests are depicted in Table 3. The
torque and thrust force components in feed (Fy), tangential
(Fx) and radial (Fz) directions generated during the milling
tests were measured by utilizing a Kistler 9257B 3-
component dynamometer and Kistler 5070A amplifier
Experimental setup and the directions of the cutting forces
are illustrated in Fig.1 (a). All the measured cutting force
signals were saved to a computer and evaluated with the help
of Dynoware software at the end of the tests.
The cutting forces applied the workpiece to remove the
chip by cutting insert can be separated into two categories as
friction force and normal force to friction. The resultant force
oriented at the friction angle β can be obtained vectorial.
There are also two cutting force components, shear force Fs
and normal force to shear Fn, acting on the removing chip.
The resultant force, Fr, and normal force, Fn, were computed
with the equations and,
where Fy is the force in the feed direction, Fx is the force in
the x direction and Fz is the radial force. The cutting forces
and thrust force are also depicted in Fig.1 (b).
The down–milling method was employed in the
experiments due to the direction of cutter rotation and cutting
feed is same. In down milling method, the cutting tool are
begun with the maximum chip thickness and reaching zero at
the end of the cut. Therefore, the cutting forces are in
tendency to pull the specimen into the cutter and holding the
insert in the machining. The experiments were conducted
based on the Taguchi orthogonal-array design of
experiments, to reduce the total number of tests.
time, cost and to measure data uniformly from within the
range of the determined studying area.
Fig.1 Experimental milling setup for cutting force and torque
(a) measurement, (b) forces acting on the chip in orthogonal
cutting
3. Experimental Results and Discussion
In the present study, three AA7039 based reinforced with
10 wt.% B4C, 10 wt.% Al2O3, and 10 wt.% SiC composites
were successfully fabricated and studied the microstructural
properties to determine the particle distribution in matrix.
The optical image of surface texture of these composites and
the particle distribution in matrix structure are depicted in
Fig.2 (a), (b) and (c). As shown these figures, homogenous
particle distributions were observed within the matrix
structure as a result of the hot-extrusion fabrication route and
the blending system. The milling experiments were
performed for aluminum 7039 based MMCs and the
influence of machining variables on cutting trust forces and
cutting torques are presented in Figs. 3 and 4, respectively.
Table 3. The experimental milling parameters and the Taguchi test levels
Factor Notation Unit Level 1 Level 2 Level 3
A–Material
pieces 10 wt.% Al2O3 10 wt.% B4C 10 wt.% SiC
B–Cutting speed
m/min 290 375 488
C–Cutting feed
mm/tooth 0.10 0.13 0.17
D–Axial cutting depth ap mm 0.8 1.0 1.3
Cutting width ae mm 24
Tool holder diameter Dc mm 40
Number of cutting
edge
Zn pieces 1
Workpiece dimension mm3

INTERNATIONAL JOURNAL of ENGINEERING TECHNOLOGIES Sener Karabulut, Vol.2, No.2, 2016
71
Fig. 2 Microstructures of (a) AA7039/Al2O3, (b) AA7039/
B4C (b), and (c) AA7039/SiC.
As shown in three dimensional response surface graphs,
increasing the feed rate and cutting depth results an increase
in thrust force in the machining of all specimens. The thrust
force was greatly affected with an increase in cutting feed
due to the more chip was removed. The rise in axial depth of
cut was also caused an increase in thrust force because the
axial depth of cut was affected the width of the contact area
in the table feed direction. This led to an increase in the load
at high cutting depth influencing the cutting insert. Fig. 3
shows the influence of machining parameters on the thrust
force. From the figures, it can be concluded that the thrust
force is higher at lower cutting speed and decreased with the
increase of cutting speed. The lower values of the thrust
force are due to the reducing interface friction between
cutting insert and workpiece in high cutting speeds. The
machining speed effects the strength of the workpiece in the
plastic deformation area through increasing cutting
temperatures and strain rate at a higher cutting speeds. As a
result, this causes plastic deformation of workpiece and
required cutting force for machining are decreased. Fig.4
depicts the influence of cutting variables on the torque during
machining of AA7039 based MMCs. The power and torque
requirements in milling process are also a significant
criterion for a stable machining performance. The spindle
speeds for milling of metal matrix composites containing
harder ceramic particles such as Al2O3, B4C, and SiC have a
great importance on the availability of adequate power and
torque. That is why the effect of milling parameters on the
torque was investigated in the milling of composite
specimens. From the Fig.4 and mean effect graph in Fig.6,
the torques were increased with the increasing axial cutting
depth while cutting speed was observed to have insignificant
effect on the result of torques in the milling of all composite
specimens. The torque values are increased with the amount
of removed metal due to the friction force at the cutting edge
and chip interface regardless of the workpiece materials. In
this study, the torque increased for a cutting feed of 0.17
mm/tooth while remaining almost constant for cutting feed
of 0.1 mm/tooth and 0.13 mm/tooth in the milling of
composite specimens. The results depicted that the torque
was not affected effectively by increasing feed rate. The
cutting feed showed a less negative effect on the torque value
due to reducing in contact time between the cutting tool and
workpiece.
The minimal mean cutting force and torque values are
achieved in the milling of AA7309 reinforced with 10 wt.%
Al2O3 composites among the studied composites. However,
the highest cutting force and torque results are measured in
the milling of AA7309 reinforced with 10 wt.% SiC
composites. Increasing thrust force and torque can be
attributed to the particle distribution in the matrix structure
and BUE creation on the insert. A uniform particle
distribution was obtained in Al2O3 reinforced composites
with 7.1 μm particle size. Although the mixing time was the
same, the particle distribution of B4C with 3.1 μm particle
size and SiC with 4.8 μm particle size was not sufficiently
homogenous. Small B4C and SiC particles caused to more
agglomeration of the particles and hence, some agglomerated
particles are observed in the matrix structure [1]. BUE
creation was also seen at all machining parameters in the
milling of AA7039/B4C and AA7039/SiC composites
(Fig.5). These agglomerated particles and BUE formation are
negatively affected the cutting tool performance, thrust force
and torque.
Fig. 3. The effect of the milling parameters on thrust forces in the milling of AA7039 based MMCs
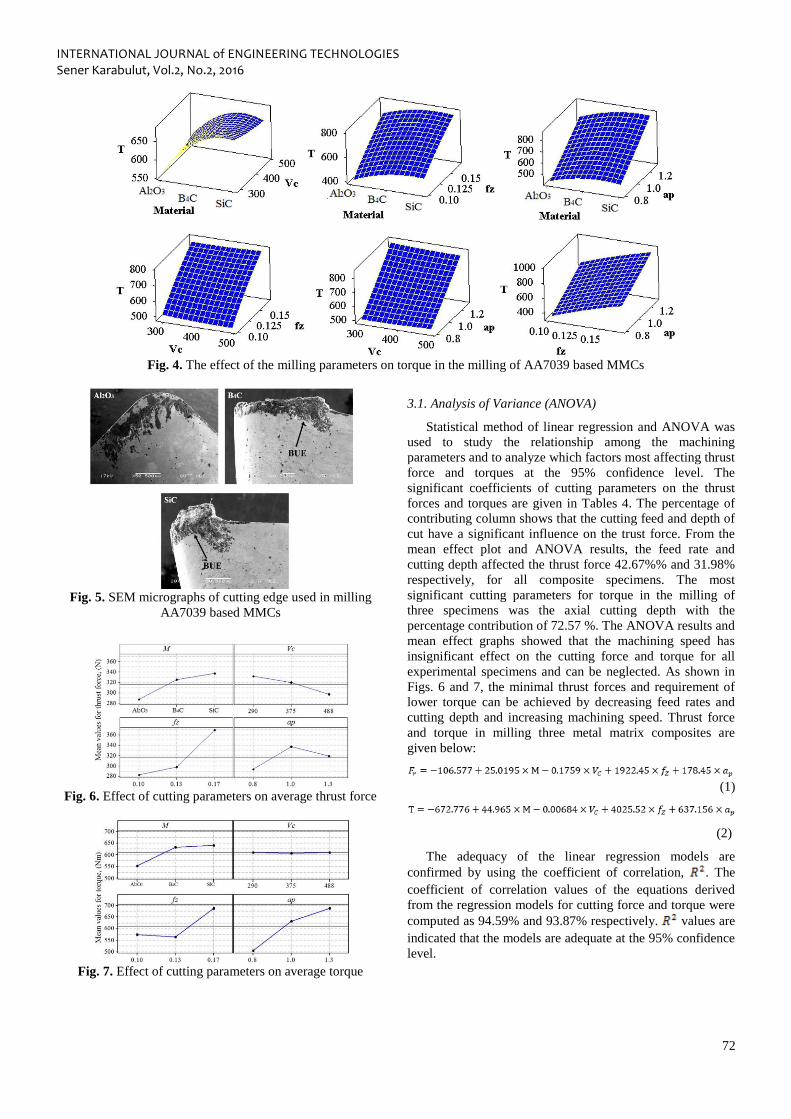
INTERNATIONAL JOURNAL of ENGINEERING TECHNOLOGIES Sener Karabulut, Vol.2, No.2, 2016
72
Fig. 4. The effect of the milling parameters on torque in the milling of AA7039 based MMCs
Fig. 5. SEM micrographs of cutting edge used in milling
AA7039 based MMCs
Fig. 6. Effect of cutting parameters on average thrust force
Fig. 7. Effect of cutting parameters on average torque
3.1. Analysis of Variance (ANOVA)
Statistical method of linear regression and ANOVA was
used to study the relationship among the machining
parameters and to analyze which factors most affecting thrust
force and torques at the 95% confidence level. The
significant coefficients of cutting parameters on the thrust
forces and torques are given in Tables 4. The percentage of
contributing column shows that the cutting feed and depth of
cut have a significant influence on the trust force. From the
mean effect plot and ANOVA results, the feed rate and
cutting depth affected the thrust force 42.67%% and 31.98%
respectively, for all composite specimens. The most
significant cutting parameters for torque in the milling of
three specimens was the axial cutting depth with the
percentage contribution of 72.57 %. The ANOVA results and
mean effect graphs showed that the machining speed has
insignificant effect on the cutting force and torque for all
experimental specimens and can be neglected. As shown in
Figs. 6 and 7, the minimal thrust forces and requirement of
lower torque can be achieved by decreasing feed rates and
cutting depth and increasing machining speed. Thrust force
and torque in milling three metal matrix composites are
given below:
(1)
(2)
The adequacy of the linear regression models are
confirmed by using the coefficient of correlation, . The
coefficient of correlation values of the equations derived
from the regression models for cutting force and torque were
computed as 94.59% and 93.87% respectively. values are
indicated that the models are adequate at the 95% confidence
level.

INTERNATIONAL JOURNAL of ENGINEERING TECHNOLOGIES Sener Karabulut, Vol.2, No.2, 2016
73
Table 4. Analysis of Variance for thrust forces
Source DF SS SS F P Rate
(%)
Thrust
force
M 1 11267.6 11267.6 54.537 0.0000002 13.40% Vc 1 5497.8 5497.8 26.610 0.0000359 6.54%
fz 1 35882.2 60776.6 294.169 0.0000000 42.67%
ap 1 26891.6 26891.6 130.160 0.0000000 31.98% Error 22 4545.3 206.6 5.41%
Total 26 84084.5
Torque M 1 36395 36395 27.638 0.000028 7.70%
Vc 1 8 8 0.006 0.937448 0.00%
fz 1 64216 266484 202.367 0.000000 13.59% ap 1 342823 342823 260.338 0.000000 72.57%
Error 22 28970 1317 6.13%
Total 26 472412
3.2. Artificial Neural Networks for Thrust Force and Torque.
The experimental results were modelled to predict the
cutting force and torque value during milling of AA7039
based MMCs using a multilayer ANN model with feed
forward back propagation algorithm. Based on Fig.8, the
multilayer feedforward training network with the input,
output and hidden layers was applied. The designed neural
network expects all input and output values to be between 0
to 1 or 1 to 1. Hence, in the first step of the network
training, the input and output parameters were normalized in
(1,1) using the following equation (3).
(3)
where
is the input/output data, is the minimum possible
value of the input parameters
is the maximum possible value of the input parameters
data.
This calculation is done automatically in Pythia software.
The type of composite specimens, machining speed, cutting
feed and depth of cut were defined as input neurons and the
output neurons are thrust force and torque. The network was
trained with 21 test data and subsequently confirmed with the
7 experimental data. Three different metal matrix composites
specimen were machined in the present experimental study to
specify the influence of reinforcement particles on the cutting
force and torque. Therefore, the samples are coded minimum
1 and maximum 3 for the artificial network training. The
minimum and maximum input parameters used in the
experiments for normalization are presented in Table 5. The
Pythia software uses the Fermi function as the transfer
function using equation (4).
(4)
Table 5. Limiting values of the ANN software
Inputs Minimum Maximum
Material M 1 3
Cutting speed Vc 290 488
Feed rate fz 0.1 0.17
Axial depth of cut ap 0.8 1.3
The network parameters are processed to optimize the
network output values in order to predict fit data. After the
training and reproduction phase, the ANN structure was
determined with three layers and twelve neurons as show in
Fig. 8.
Fig.8 ANN in the Levenberg–Marquardt algorithm structure
for the thrust force and torque
Each network input data is connected to every neuron in
the first level and the output of each neuron is connected to
every neuron in the next level. The calculated weights are
presented in Table 6.
The activities of the N1− N5 are calculated as;
(5)
Where,
is the activities of the neurons,
i is the number of inputs,
is the neurons weights
The outputs of N1-N5 are calculated as
(6)
(7)
Table 6. Weight values used in Equation 6 i weights for thrust force
w1i w2i w3i w4i
1.1 −0.641615 0.964341 −0.674801 −0.710380
1.2 0.453339 1.064664 −0.923088 −0.975535 1.3 −0.018847 0.724369 0.595416 −2.019125
1.4 0.565030 0.720068 0.131456 −0.125667
1.5 0.347206 0.898850 0.569796 −1.219484
i weights for torque
w1i w2i w3i w4i
1.1 −0.613107 0.798307 −0.587410 −1.104612
1.2 0.738065 1.316772 −1.965709 −1.741744 1.3 0.486763 −0.146797 −0.236760 −1.546769
1.4 0.542935 0.484263 0.424082 −0.118507
1.5 0.448045 0.245691 0.602117 −1.659422
Similarly, the activities of the N6 to N10 are computed
using equation (8). The computed weights are presented in
Table 7. The network is processed from left to right and the
outputs of N1−N5 are the inputs for the computation of N6 to
N10.
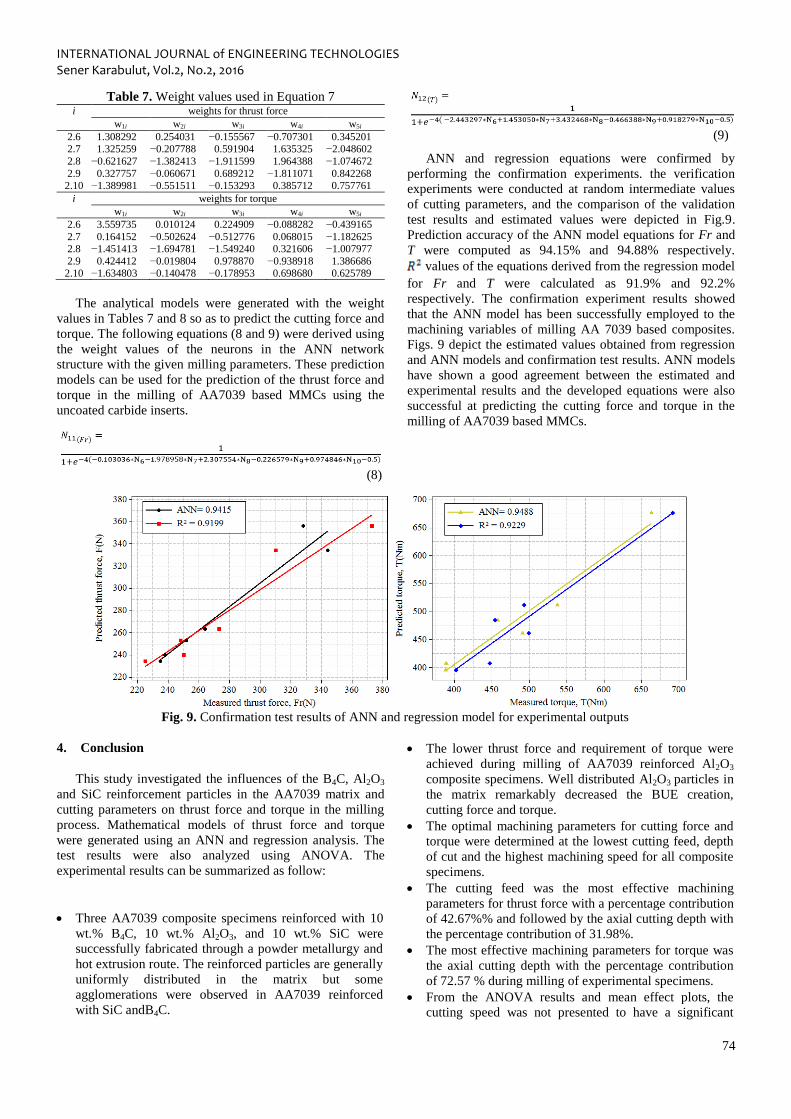
INTERNATIONAL JOURNAL of ENGINEERING TECHNOLOGIES Sener Karabulut, Vol.2, No.2, 2016
74
Table 7. Weight values used in Equation 7 i weights for thrust force
w1i w2i w3i w4i w5i
2.6 1.308292 0.254031 −0.155567 −0.707301 0.345201 2.7 1.325259 −0.207788 0.591904 1.635325 −2.048602
2.8 −0.621627 −1.382413 −1.911599 1.964388 −1.074672
2.9 0.327757 −0.060671 0.689212 −1.811071 0.842268 2.10 −1.389981 −0.551511 −0.153293 0.385712 0.757761
i weights for torque
w1i w2i w3i w4i w5i
2.6 3.559735 0.010124 0.224909 −0.088282 −0.439165
2.7 0.164152 −0.502624 −0.512776 0.068015 −1.182625 2.8 −1.451413 −1.694781 −1.549240 0.321606 −1.007977
2.9 0.424412 −0.019804 0.978870 −0.938918 1.386686 2.10 −1.634803 −0.140478 −0.178953 0.698680 0.625789
The analytical models were generated with the weight
values in Tables 7 and 8 so as to predict the cutting force and
torque. The following equations (8 and 9) were derived using
the weight values of the neurons in the ANN network
structure with the given milling parameters. These prediction
models can be used for the prediction of the thrust force and
torque in the milling of AA7039 based MMCs using the
uncoated carbide inserts.
(8)
(9)
ANN and regression equations were confirmed by
performing the confirmation experiments. the verification
experiments were conducted at random intermediate values
of cutting parameters, and the comparison of the validation
test results and estimated values were depicted in Fig.9.
Prediction accuracy of the ANN model equations for Fr and
T were computed as 94.15% and 94.88% respectively.
values of the equations derived from the regression model
for Fr and T were calculated as 91.9% and 92.2%
respectively. The confirmation experiment results showed
that the ANN model has been successfully employed to the
machining variables of milling AA 7039 based composites.
Figs. 9 depict the estimated values obtained from regression
and ANN models and confirmation test results. ANN models
have shown a good agreement between the estimated and
experimental results and the developed equations were also
successful at predicting the cutting force and torque in the
milling of AA7039 based MMCs.
Fig. 9. Confirmation test results of ANN and regression model for experimental outputs
4. Conclusion
This study investigated the influences of the B4C, Al2O3
and SiC reinforcement particles in the AA7039 matrix and
cutting parameters on thrust force and torque in the milling
process. Mathematical models of thrust force and torque
were generated using an ANN and regression analysis. The
test results were also analyzed using ANOVA. The
experimental results can be summarized as follow:
Three AA7039 composite specimens reinforced with 10
wt.% B4C, 10 wt.% Al2O3, and 10 wt.% SiC were
successfully fabricated through a powder metallurgy and
hot extrusion route. The reinforced particles are generally
uniformly distributed in the matrix but some
agglomerations were observed in AA7039 reinforced
with SiC andB4C.
The lower thrust force and requirement of torque were
achieved during milling of AA7039 reinforced Al2O3
composite specimens. Well distributed Al2O3 particles in
the matrix remarkably decreased the BUE creation,
cutting force and torque.
The optimal machining parameters for cutting force and
torque were determined at the lowest cutting feed, depth
of cut and the highest machining speed for all composite
specimens.
The cutting feed was the most effective machining
parameters for thrust force with a percentage contribution
of 42.67%% and followed by the axial cutting depth with
the percentage contribution of 31.98%.
The most effective machining parameters for torque was
the axial cutting depth with the percentage contribution
of 72.57 % during milling of experimental specimens.
From the ANOVA results and mean effect plots, the
cutting speed was not presented to have a significant
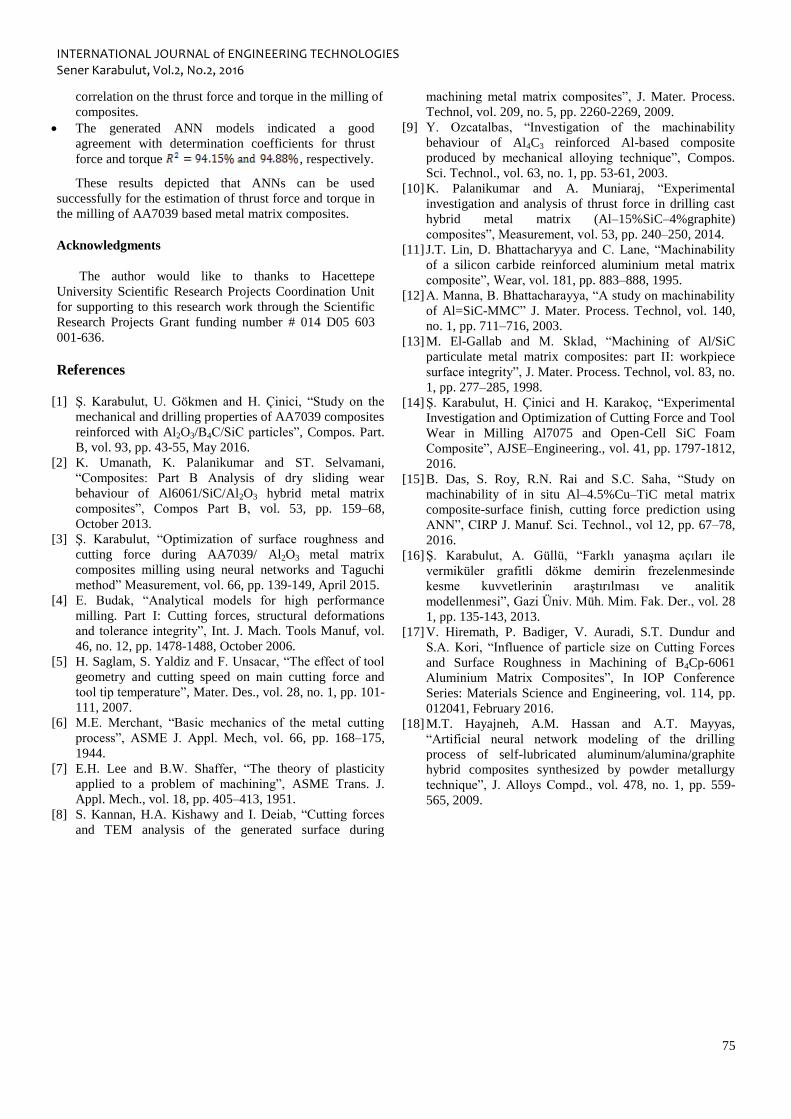
INTERNATIONAL JOURNAL of ENGINEERING TECHNOLOGIES Sener Karabulut, Vol.2, No.2, 2016
75
correlation on the thrust force and torque in the milling of
composites.
The generated ANN models indicated a good
agreement with determination coefficients for thrust
force and torque , respectively.
These results depicted that ANNs can be used
successfully for the estimation of thrust force and torque in
the milling of AA7039 based metal matrix composites.
Acknowledgments
The author would like to thanks to Hacettepe
University Scientific Research Projects Coordination Unit
for supporting to this research work through the Scientific
Research Projects Grant funding number # 014 D05 603
001-636.
References
[1] Ş. Karabulut, U. Gökmen and H. Çinici, “Study on the
mechanical and drilling properties of AA7039 composites
reinforced with Al2O3/B4C/SiC particles”, Compos. Part.
B, vol. 93, pp. 43-55, May 2016.
[2] K. Umanath, K. Palanikumar and ST. Selvamani,
“Composites: Part B Analysis of dry sliding wear
behaviour of Al6061/SiC/Al2O3 hybrid metal matrix
composites”, Compos Part B, vol. 53, pp. 159–68,
October 2013.
[3] Ş. Karabulut, “Optimization of surface roughness and
cutting force during AA7039/ Al2O3 metal matrix
composites milling using neural networks and Taguchi
method” Measurement, vol. 66, pp. 139-149, April 2015.
[4] E. Budak, “Analytical models for high performance
milling. Part I: Cutting forces, structural deformations
and tolerance integrity”, Int. J. Mach. Tools Manuf, vol.
46, no. 12, pp. 1478-1488, October 2006.
[5] H. Saglam, S. Yaldiz and F. Unsacar, “The effect of tool
geometry and cutting speed on main cutting force and
tool tip temperature”, Mater. Des., vol. 28, no. 1, pp. 101-
111, 2007.
[6] M.E. Merchant, “Basic mechanics of the metal cutting
process”, ASME J. Appl. Mech, vol. 66, pp. 168–175,
1944.
[7] E.H. Lee and B.W. Shaffer, “The theory of plasticity
applied to a problem of machining”, ASME Trans. J.
Appl. Mech., vol. 18, pp. 405–413, 1951.
[8] S. Kannan, H.A. Kishawy and I. Deiab, “Cutting forces
and TEM analysis of the generated surface during
machining metal matrix composites”, J. Mater. Process.
Technol, vol. 209, no. 5, pp. 2260-2269, 2009.
[9] Y. Ozcatalbas, “Investigation of the machinability
behaviour of Al4C3 reinforced Al-based composite
produced by mechanical alloying technique”, Compos.
Sci. Technol., vol. 63, no. 1, pp. 53-61, 2003.
[10] K. Palanikumar and A. Muniaraj, “Experimental
investigation and analysis of thrust force in drilling cast
hybrid metal matrix (Al–15%SiC–4%graphite)
composites”, Measurement, vol. 53, pp. 240–250, 2014.
[11] J.T. Lin, D. Bhattacharyya and C. Lane, “Machinability
of a silicon carbide reinforced aluminium metal matrix
composite”, Wear, vol. 181, pp. 883–888, 1995.
[12] A. Manna, B. Bhattacharayya, “A study on machinability
of Al=SiC-MMC” J. Mater. Process. Technol, vol. 140,
no. 1, pp. 711–716, 2003.
[13] M. El-Gallab and M. Sklad, “Machining of Al/SiC
particulate metal matrix composites: part II: workpiece
surface integrity”, J. Mater. Process. Technol, vol. 83, no.
1, pp. 277–285, 1998.
[14] Ş. Karabulut, H. Çinici and H. Karakoç, “Experimental
Investigation and Optimization of Cutting Force and Tool
Wear in Milling Al7075 and Open-Cell SiC Foam
Composite”, AJSE–Engineering., vol. 41, pp. 1797-1812,
2016.
[15] B. Das, S. Roy, R.N. Rai and S.C. Saha, “Study on
machinability of in situ Al–4.5%Cu–TiC metal matrix
composite-surface finish, cutting force prediction using
ANN”, CIRP J. Manuf. Sci. Technol., vol 12, pp. 67–78,
2016.
[16] Ş. Karabulut, A. Güllü, “Farklı yanaşma açıları ile
vermiküler grafitli dökme demirin frezelenmesinde
kesme kuvvetlerinin araştırılması ve analitik
modellenmesi”, Gazi Üniv. Müh. Mim. Fak. Der., vol. 28
1, pp. 135-143, 2013.
[17] V. Hiremath, P. Badiger, V. Auradi, S.T. Dundur and
S.A. Kori, “Influence of particle size on Cutting Forces
and Surface Roughness in Machining of B4Cp-6061
Aluminium Matrix Composites”, In IOP Conference
Series: Materials Science and Engineering, vol. 114, pp.
012041, February 2016.
[18] M.T. Hayajneh, A.M. Hassan and A.T. Mayyas,
“Artificial neural network modeling of the drilling
process of self-lubricated aluminum/alumina/graphite
hybrid composites synthesized by powder metallurgy
technique”, J. Alloys Compd., vol. 478, no. 1, pp. 559-
565, 2009.

INTERNATIONAL JOURNAL of ENGINEERING TECHNOLOGIES Neslihan Yanikomer et al., Vol.2, No.2, 2016
76
New Solidification Materials in Nuclear Waste
Management
Neslihan Yanikomer*‡, Sinan Asal**, Sevilay Haciyakupoglu**, Sema Akyil Erenturk**
*Department of Mechanical Engineering, Faculty of Engineering and Architecture, Istanbul Gelisim University, 34315
Avcilar, Istanbul, Turkey.
**Energy Institute, Istanbul Technical University, 34469 Maslak, Istanbul, Turkey.
([email protected], [email protected], [email protected], [email protected])
‡ Corresponding Author; Neslihan Yanikomer, Department of Mechanical Engineering, Faculty of Engineering and
Architecture, Istanbul Gelisim University, 34315 Avcilar, Istanbul, Turkey, Tel: +90 5445989846, [email protected]
Received: 27.05.2016 Accepted: 25.06.2016
Abstract-One of the major worldwide environmental issue is the long-term storage or disposal of nuclear waste. Research in
solidification materials for long-term storage of high-level nuclear wastes in nuclear industry has started as an imperative need.
During the last decade, new solidification materials have been developed for immobilization of actinides and fission products
for geological disposal. The materials used for immobilization generally have relatively complex compositions. The structure
of these materials investigates using diffraction and spectroscopic methods. Most of the interest has focused on their chemical
durabilities and capacity of waste loading. Their physical and chemical properties should not be degraded by -decay event
irradiation from the incorporated actinides. The development of new materials either for storage or for disposal for a long time
is still required. In this article, recent developments in the use of solidification materials for the immobilization of high level of
nuclear wastes have been reviewed. The comparison of properties of solidification materials is summarized with several
applications in connection with experience and technological needs in literature.
Keywords: Nuclear energy, nuclear waste, solidification materials, immobilization, long-term storage.
1. Introduction
The environmental impact of energy generation can be
evaluated on several ways that includes evaluation of type
and amount of contaminant produced per unit energy
generated by the source, contaminant distribution in
atmosphere and environment, effects on occupants and
public’s health, amount and toxicity of waste and long term
effects on environment and ecological systems [1, 2].
Nuclear energy has been used since 1950s in the world.
Progress in energy has increased the demand of nuclear
power plants and also made it a current issue against global
warming in the world. Nuclear industry uses the highest
technologies of the world and develops rapidly as a high-tech
sector. Even a very good pollution controls, nuclear power
plants still generates waste materials. Nuclear industry is
accepted one of the rare industries considering its special
attention to waste management. Nuclear industry prepares
regulations in accordance with laws and monitors the
implementation by independent organizations [1, 2].
Ionizing radiations from radioactive materials are utilized
for diagnose and treatment in medical sector. Radioisotopes
are producing in nuclear plants continuously to supply the
needs of research, industry and medical sectors. Radioactive
sources or materials are managed as radioactive waste;
therefore, they are isolated carefully for every usage.
After one-year operation of a 1000 MW light water
reactor, the obtained spent fuel without reprocessing is
approximately 30 tonnes consisting of 95.6% uranium, 1%
plutonium, 0.1% transuranium isotopes (plutonium,
neptunium etc.) and 3.3% fission products (cesium,
strontium, iodine etc.). After separating uranium and
plutonium for reuse, the percentage of fission products in
reprocessed spent fuel (proximately 1 ton) is 93.3%. Fission
products loss 98% of their radioactivities within 200 years.
For this reason, storage of fission products in radioactive
waste by solidification is very important. There are many
radionuclides as fission products in the waste. Cesium and
strontium are the most important radionuclides in fission
products. Despite 137
Cs has 30.2 and 134
Cs 2.1 years of
physical half-life, their biological and whole body half-life

INTERNATIONAL JOURNAL of ENGINEERING TECHNOLOGIES Neslihan Yanikomer et al., Vol.2, No.2, 2016
77
are almost 40 days. Thereby, it seems that in terms of
radiological point of view, 137
Cs is the most important
radionuclide produced in a nuclear process. 90
Sr radionuclide
has long physical (t1/2: 28.60 years) and biological half-life
and dispersion of 90
Sr to the environment causes damages to
human body by incorporation into bones and teeth due to its
high energetic beta particles (Eβ: 546 keV) [3-8].
Immobilization of high level radioactive waste by a way
that will not harm to human and environment is an important
subject. Despite scientific authorities do not accept as a
problem to nuclear wastes requiring a new immobilization
technology, public perception for nuclear wastes is seriously
problem to threat life and environment comparison with
other industrial wastes [1, 3, 9].
The development of nuclear power industry brings back
the responsibility to address the issue of nuclear wastes in
stable solid forms for interim storage or disposition in
geologic repositories. The solidification of nuclear wastes
has been an active and booming research area for over 50
years. The aim of this review is to contribute literature by
providing an overview including important developments
and methods about immobilization of high-level radioactive
waste with the help of researches executed so far and to
make some interpretations and recommendations for the
optimization and selection of solidification materials for the
applications.
2. Storage by Solidification of Nuclear Wastes
High level nuclear waste have buried to deep
underground repositories in specifically chosen geological
formations. Further studies on nuclear waste storage are
continuing in the world. Geological and environmental
factors like groundwater movement, structure of rock,
erosion, flood, earthquake, volcanic activities, natural
resources and population etc. are important factors regarding
disposal site selection [10-14].
Considering that the only mechanism to leak radioactivity
from underground repositories to biosphere is groundwater
movement, repositories constructed in geological formations
have to select far from groundwater. It is clarified that
geological formations like granite, basalt, salt and tuff have
proper specifications for a waste repository. Considering
fossil fuel-fired power plants, nuclear power plants produce
less waste and own better protection procedures for the
wastes. The nuclear wastes are stored in heavy concrete
containers that are placed in deep boreholes or caverns
excavated deep underground and monitored continuously. Some waste packages are shown in Figure 1. The containers
have ability to retain radionuclides over ~100000 years in
fact the nuclear wastes become safe in 300-500 years [10-
14].
Immobilisation of radioactive wastes in relatively inert
solid matrices before storage is advantageous for safety and
economic reasons. Practically the most common method is
pouring concrete around waste in containers. Liquid wastes
are occasionally used as part of concrete mixture but the
durability of final product is relatively weak. The long-term
trend of radionuclides moves upward to the surface of the
solid material. Cementation and vitrification techniques are
the most preferable methods for solidification of nuclear
wastes [10-13].
Fig. 1. Waste packages in use: a) drum, b) metal box, c)
concrete cylinder d) concrete container [13]
Depending on the classification of nuclear waste,
different solidification material uses for immobilization of
radioactive waste. Figure 2 shows immobilization techniques
related to radioactivity levels in waste [13].
Fig. 2. Typical materials used for nuclear waste conditioning
(reproduced from [13])
Selection of a solidification form depends on the physical
and chemical nature of the radioactive waste and the
acceptance criteria for the storage and disposal facilities. The
key considerations on selecting an immobilising material are
[12]:
Chemical durability is one of the most important
properties in waste forms. Chemical durability of waste
forms can be determined with several methods. The leach
rate in g m-2
d-1
is given by;
0
iAL
A S t
(1)
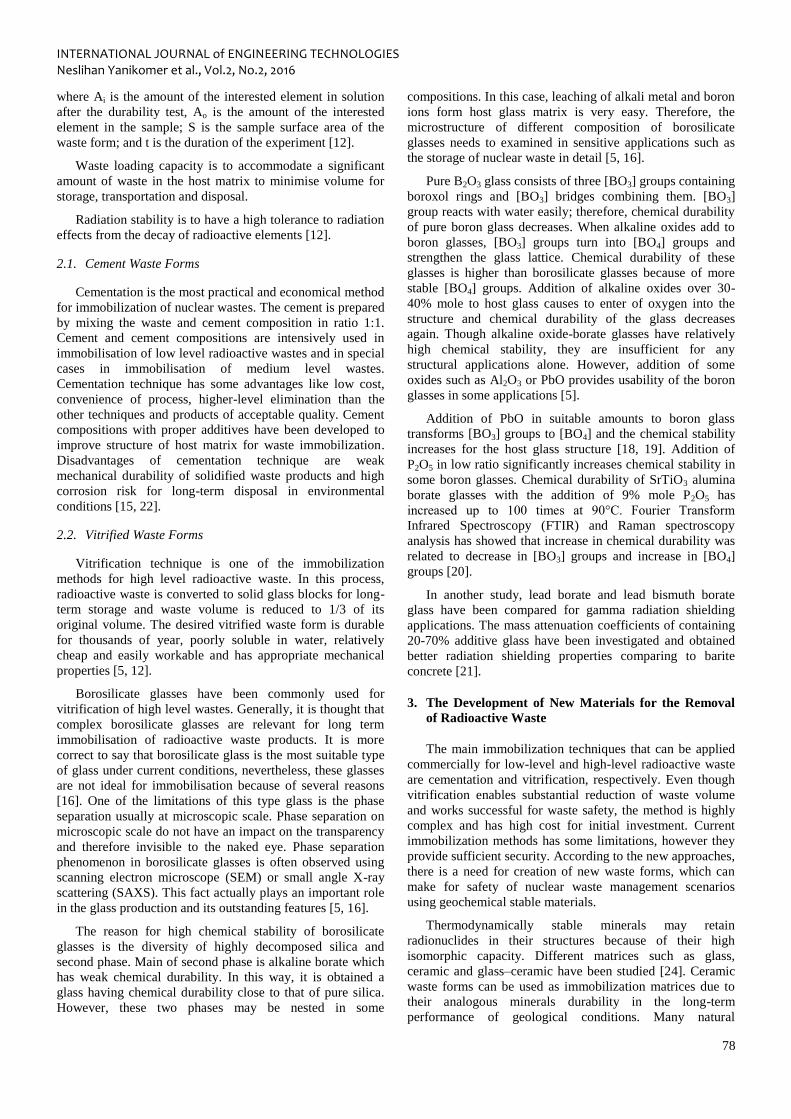
INTERNATIONAL JOURNAL of ENGINEERING TECHNOLOGIES Neslihan Yanikomer et al., Vol.2, No.2, 2016
78
where Ai is the amount of the interested element in solution
after the durability test, Ao is the amount of the interested
element in the sample; S is the sample surface area of the
waste form; and t is the duration of the experiment [12].
Waste loading capacity is to accommodate a significant
amount of waste in the host matrix to minimise volume for
storage, transportation and disposal.
Radiation stability is to have a high tolerance to radiation
effects from the decay of radioactive elements [12].
2.1. Cement Waste Forms
Cementation is the most practical and economical method
for immobilization of nuclear wastes. The cement is prepared
by mixing the waste and cement composition in ratio 1:1.
Cement and cement compositions are intensively used in
immobilisation of low level radioactive wastes and in special
cases in immobilisation of medium level wastes.
Cementation technique has some advantages like low cost,
convenience of process, higher-level elimination than the
other techniques and products of acceptable quality. Cement
compositions with proper additives have been developed to
improve structure of host matrix for waste immobilization.
Disadvantages of cementation technique are weak
mechanical durability of solidified waste products and high
corrosion risk for long-term disposal in environmental
conditions [15, 22].
2.2. Vitrified Waste Forms
Vitrification technique is one of the immobilization
methods for high level radioactive waste. In this process,
radioactive waste is converted to solid glass blocks for long-
term storage and waste volume is reduced to 1/3 of its
original volume. The desired vitrified waste form is durable
for thousands of year, poorly soluble in water, relatively
cheap and easily workable and has appropriate mechanical
properties [5, 12].
Borosilicate glasses have been commonly used for
vitrification of high level wastes. Generally, it is thought that
complex borosilicate glasses are relevant for long term
immobilisation of radioactive waste products. It is more
correct to say that borosilicate glass is the most suitable type
of glass under current conditions, nevertheless, these glasses
are not ideal for immobilisation because of several reasons
[16]. One of the limitations of this type glass is the phase
separation usually at microscopic scale. Phase separation on
microscopic scale do not have an impact on the transparency
and therefore invisible to the naked eye. Phase separation
phenomenon in borosilicate glasses is often observed using
scanning electron microscope (SEM) or small angle X-ray
scattering (SAXS). This fact actually plays an important role
in the glass production and its outstanding features [5, 16].
The reason for high chemical stability of borosilicate
glasses is the diversity of highly decomposed silica and
second phase. Main of second phase is alkaline borate which
has weak chemical durability. In this way, it is obtained a
glass having chemical durability close to that of pure silica.
However, these two phases may be nested in some
compositions. In this case, leaching of alkali metal and boron
ions form host glass matrix is very easy. Therefore, the
microstructure of different composition of borosilicate
glasses needs to examined in sensitive applications such as
the storage of nuclear waste in detail [5, 16].
Pure B2O3 glass consists of three [BO3] groups containing
boroxol rings and [BO3] bridges combining them. [BO3]
group reacts with water easily; therefore, chemical durability
of pure boron glass decreases. When alkaline oxides add to
boron glasses, [BO3] groups turn into [BO4] groups and
strengthen the glass lattice. Chemical durability of these
glasses is higher than borosilicate glasses because of more
stable [BO4] groups. Addition of alkaline oxides over 30-
40% mole to host glass causes to enter of oxygen into the
structure and chemical durability of the glass decreases
again. Though alkaline oxide-borate glasses have relatively
high chemical stability, they are insufficient for any
structural applications alone. However, addition of some
oxides such as Al2O3 or PbO provides usability of the boron
glasses in some applications [5].
Addition of PbO in suitable amounts to boron glass
transforms [BO3] groups to [BO4] and the chemical stability
increases for the host glass structure [18, 19]. Addition of
P2O5 in low ratio significantly increases chemical stability in
some boron glasses. Chemical durability of SrTiO3 alumina
borate glasses with the addition of 9% mole P2O5 has
increased up to 100 times at 90°C. Fourier Transform
Infrared Spectroscopy (FTIR) and Raman spectroscopy
analysis has showed that increase in chemical durability was
related to decrease in [BO3] groups and increase in [BO4]
groups [20].
In another study, lead borate and lead bismuth borate
glass have been compared for gamma radiation shielding
applications. The mass attenuation coefficients of containing
20-70% additive glass have been investigated and obtained
better radiation shielding properties comparing to barite
concrete [21].
3. The Development of New Materials for the Removal
of Radioactive Waste
The main immobilization techniques that can be applied
commercially for low-level and high-level radioactive waste
are cementation and vitrification, respectively. Even though
vitrification enables substantial reduction of waste volume
and works successful for waste safety, the method is highly
complex and has high cost for initial investment. Current
immobilization methods has some limitations, however they
provide sufficient security. According to the new approaches,
there is a need for creation of new waste forms, which can
make for safety of nuclear waste management scenarios
using geochemical stable materials.
Thermodynamically stable minerals may retain
radionuclides in their structures because of their high
isomorphic capacity. Different matrices such as glass,
ceramic and glass–ceramic have been studied [24]. Ceramic
waste forms can be used as immobilization matrices due to
their analogous minerals durability in the long-term
performance of geological conditions. Many natural
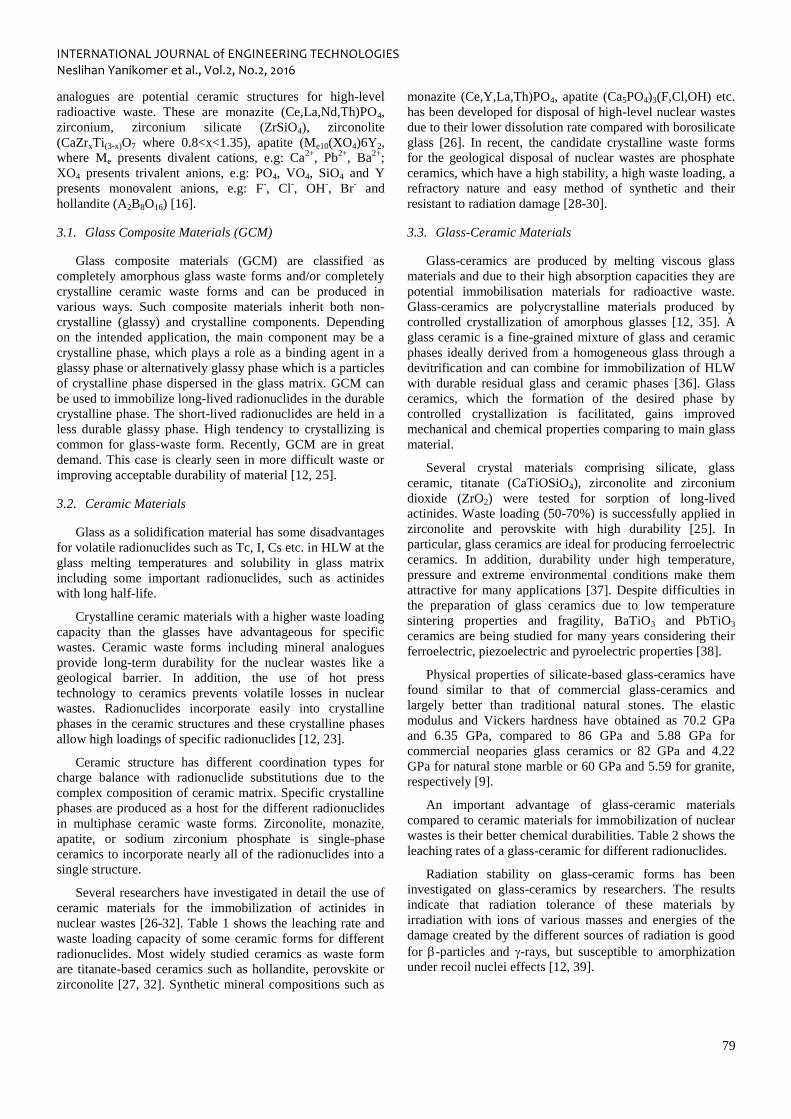
INTERNATIONAL JOURNAL of ENGINEERING TECHNOLOGIES Neslihan Yanikomer et al., Vol.2, No.2, 2016
79
analogues are potential ceramic structures for high-level
radioactive waste. These are monazite (Ce,La,Nd,Th)PO4,
zirconium, zirconium silicate (ZrSiO4), zirconolite
(CaZrxTi(3-x)O7 where 0.8<x<1.35), apatite (Me10(XO4)6Y2,
where Me presents divalent cations, e.g: Ca2+
, Pb2+
, Ba2+
;
XO4 presents trivalent anions, e.g: PO4, VO4, SiO4 and Y
presents monovalent anions, e.g: F-, Cl
-, OH
-, Br
- and
hollandite (A2B8O16) [16].
3.1. Glass Composite Materials (GCM)
Glass composite materials (GCM) are classified as
completely amorphous glass waste forms and/or completely
crystalline ceramic waste forms and can be produced in
various ways. Such composite materials inherit both non-
crystalline (glassy) and crystalline components. Depending
on the intended application, the main component may be a
crystalline phase, which plays a role as a binding agent in a
glassy phase or alternatively glassy phase which is a particles
of crystalline phase dispersed in the glass matrix. GCM can
be used to immobilize long-lived radionuclides in the durable
crystalline phase. The short-lived radionuclides are held in a
less durable glassy phase. High tendency to crystallizing is
common for glass-waste form. Recently, GCM are in great
demand. This case is clearly seen in more difficult waste or
improving acceptable durability of material [12, 25].
3.2. Ceramic Materials
Glass as a solidification material has some disadvantages
for volatile radionuclides such as Tc, I, Cs etc. in HLW at the
glass melting temperatures and solubility in glass matrix
including some important radionuclides, such as actinides
with long half-life.
Crystalline ceramic materials with a higher waste loading
capacity than the glasses have advantageous for specific
wastes. Ceramic waste forms including mineral analogues
provide long-term durability for the nuclear wastes like a
geological barrier. In addition, the use of hot press
technology to ceramics prevents volatile losses in nuclear
wastes. Radionuclides incorporate easily into crystalline
phases in the ceramic structures and these crystalline phases
allow high loadings of specific radionuclides [12, 23].
Ceramic structure has different coordination types for
charge balance with radionuclide substitutions due to the
complex composition of ceramic matrix. Specific crystalline
phases are produced as a host for the different radionuclides
in multiphase ceramic waste forms. Zirconolite, monazite,
apatite, or sodium zirconium phosphate is single-phase
ceramics to incorporate nearly all of the radionuclides into a
single structure.
Several researchers have investigated in detail the use of
ceramic materials for the immobilization of actinides in
nuclear wastes [26-32]. Table 1 shows the leaching rate and
waste loading capacity of some ceramic forms for different
radionuclides. Most widely studied ceramics as waste form
are titanate-based ceramics such as hollandite, perovskite or
zirconolite [27, 32]. Synthetic mineral compositions such as
monazite (Ce,Y,La,Th)PO4, apatite (Ca5PO4)3(F,Cl,OH) etc.
has been developed for disposal of high-level nuclear wastes
due to their lower dissolution rate compared with borosilicate
glass [26]. In recent, the candidate crystalline waste forms
for the geological disposal of nuclear wastes are phosphate
ceramics, which have a high stability, a high waste loading, a
refractory nature and easy method of synthetic and their
resistant to radiation damage [28-30].
3.3. Glass-Ceramic Materials
Glass-ceramics are produced by melting viscous glass
materials and due to their high absorption capacities they are
potential immobilisation materials for radioactive waste.
Glass-ceramics are polycrystalline materials produced by
controlled crystallization of amorphous glasses [12, 35]. A
glass ceramic is a fine-grained mixture of glass and ceramic
phases ideally derived from a homogeneous glass through a
devitrification and can combine for immobilization of HLW
with durable residual glass and ceramic phases [36]. Glass
ceramics, which the formation of the desired phase by
controlled crystallization is facilitated, gains improved
mechanical and chemical properties comparing to main glass
material.
Several crystal materials comprising silicate, glass
ceramic, titanate (CaTiOSiO4), zirconolite and zirconium
dioxide (ZrO2) were tested for sorption of long-lived
actinides. Waste loading (50-70%) is successfully applied in
zirconolite and perovskite with high durability [25]. In
particular, glass ceramics are ideal for producing ferroelectric
ceramics. In addition, durability under high temperature,
pressure and extreme environmental conditions make them
attractive for many applications [37]. Despite difficulties in
the preparation of glass ceramics due to low temperature
sintering properties and fragility, BaTiO3 and PbTiO3
ceramics are being studied for many years considering their
ferroelectric, piezoelectric and pyroelectric properties [38].
Physical properties of silicate-based glass-ceramics have
found similar to that of commercial glass-ceramics and
largely better than traditional natural stones. The elastic
modulus and Vickers hardness have obtained as 70.2 GPa
and 6.35 GPa, compared to 86 GPa and 5.88 GPa for
commercial neoparies glass ceramics or 82 GPa and 4.22
GPa for natural stone marble or 60 GPa and 5.59 for granite,
respectively [9].
An important advantage of glass-ceramic materials
compared to ceramic materials for immobilization of nuclear
wastes is their better chemical durabilities. Table 2 shows the
leaching rates of a glass-ceramic for different radionuclides.
Radiation stability on glass-ceramic forms has been
investigated on glass-ceramics by researchers. The results
indicate that radiation tolerance of these materials by
irradiation with ions of various masses and energies of the
damage created by the different sources of radiation is good
for -particles and -rays, but susceptible to amorphization
under recoil nuclei effects [12, 39].
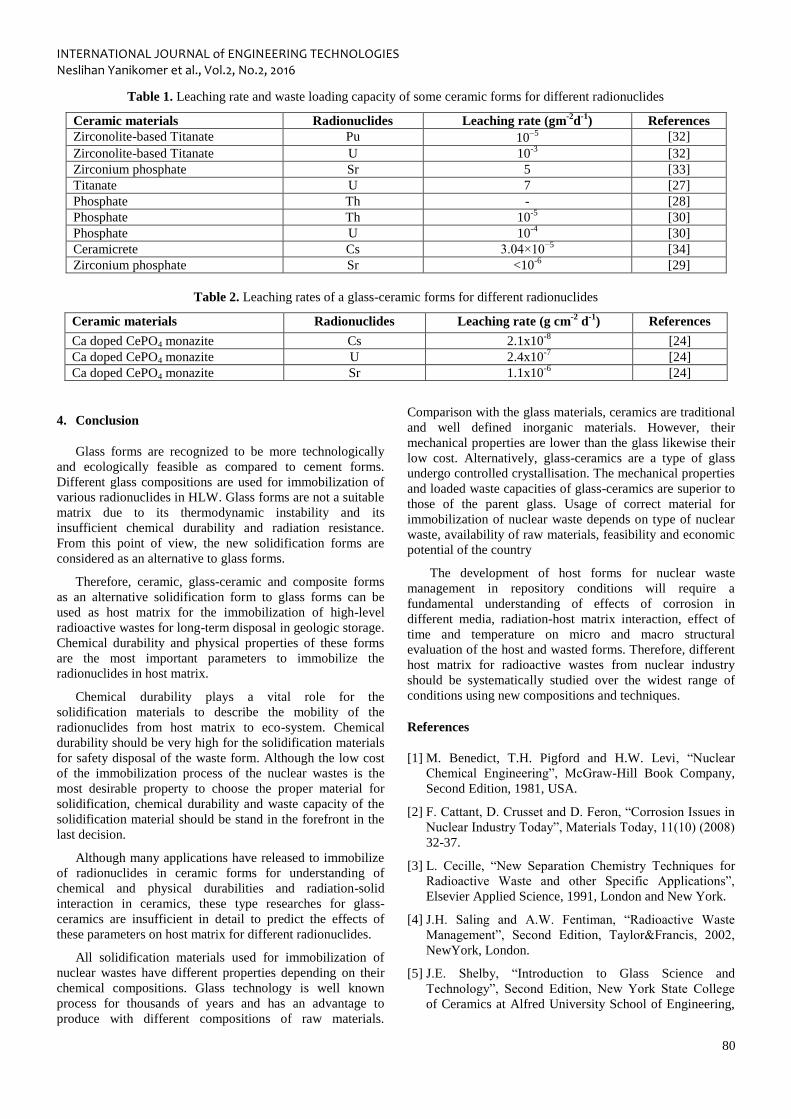
INTERNATIONAL JOURNAL of ENGINEERING TECHNOLOGIES Neslihan Yanikomer et al., Vol.2, No.2, 2016
80
Table 1. Leaching rate and waste loading capacity of some ceramic forms for different radionuclides
Ceramic materials Radionuclides Leaching rate (gm-2
d-1
) References
Zirconolite-based Titanate Pu 105
[32]
Zirconolite-based Titanate U 10-3
[32]
Zirconium phosphate Sr 5 [33]
Titanate U 7 [27]
Phosphate Th - [28]
Phosphate Th 10-5
[30]
Phosphate U 10-4
[30]
Ceramicrete Cs 3.04×10⁻⁵
[34]
Zirconium phosphate Sr <10-6
[29]
Table 2. Leaching rates of a glass-ceramic forms for different radionuclides
Ceramic materials Radionuclides Leaching rate (g cm-2
d-1
) References
Ca doped CePO4 monazite Cs 2.1x10⁻⁸
[24]
Ca doped CePO4 monazite U 2.4x10⁻⁷
[24]
Ca doped CePO4 monazite Sr 1.1x10⁻⁶
[24]
4. Conclusion
Glass forms are recognized to be more technologically
and ecologically feasible as compared to cement forms.
Different glass compositions are used for immobilization of
various radionuclides in HLW. Glass forms are not a suitable
matrix due to its thermodynamic instability and its
insufficient chemical durability and radiation resistance.
From this point of view, the new solidification forms are
considered as an alternative to glass forms.
Therefore, ceramic, glass-ceramic and composite forms
as an alternative solidification form to glass forms can be
used as host matrix for the immobilization of high-level
radioactive wastes for long-term disposal in geologic storage.
Chemical durability and physical properties of these forms
are the most important parameters to immobilize the
radionuclides in host matrix.
Chemical durability plays a vital role for the
solidification materials to describe the mobility of the
radionuclides from host matrix to eco-system. Chemical
durability should be very high for the solidification materials
for safety disposal of the waste form. Although the low cost
of the immobilization process of the nuclear wastes is the
most desirable property to choose the proper material for
solidification, chemical durability and waste capacity of the
solidification material should be stand in the forefront in the
last decision.
Although many applications have released to immobilize
of radionuclides in ceramic forms for understanding of
chemical and physical durabilities and radiation-solid
interaction in ceramics, these type researches for glass-
ceramics are insufficient in detail to predict the effects of
these parameters on host matrix for different radionuclides.
All solidification materials used for immobilization of
nuclear wastes have different properties depending on their
chemical compositions. Glass technology is well known
process for thousands of years and has an advantage to
produce with different compositions of raw materials.
Comparison with the glass materials, ceramics are traditional
and well defined inorganic materials. However, their
mechanical properties are lower than the glass likewise their
low cost. Alternatively, glass-ceramics are a type of glass
undergo controlled crystallisation. The mechanical properties
and loaded waste capacities of glass-ceramics are superior to
those of the parent glass. Usage of correct material for
immobilization of nuclear waste depends on type of nuclear
waste, availability of raw materials, feasibility and economic
potential of the country
The development of host forms for nuclear waste
management in repository conditions will require a
fundamental understanding of effects of corrosion in
different media, radiation-host matrix interaction, effect of
time and temperature on micro and macro structural
evaluation of the host and wasted forms. Therefore, different
host matrix for radioactive wastes from nuclear industry
should be systematically studied over the widest range of
conditions using new compositions and techniques.
References
[1] M. Benedict, T.H. Pigford and H.W. Levi, “Nuclear
Chemical Engineering”, McGraw-Hill Book Company,
Second Edition, 1981, USA.
[2] F. Cattant, D. Crusset and D. Feron, “Corrosion Issues in
Nuclear Industry Today”, Materials Today, 11(10) (2008)
32-37.
[3] L. Cecille, “New Separation Chemistry Techniques for
Radioactive Waste and other Specific Applications”,
Elsevier Applied Science, 1991, London and New York.
[4] J.H. Saling and A.W. Fentiman, “Radioactive Waste
Management”, Second Edition, Taylor&Francis, 2002,
NewYork, London.
[5] J.E. Shelby, “Introduction to Glass Science and
Technology”, Second Edition, New York State College
of Ceramics at Alfred University School of Engineering,
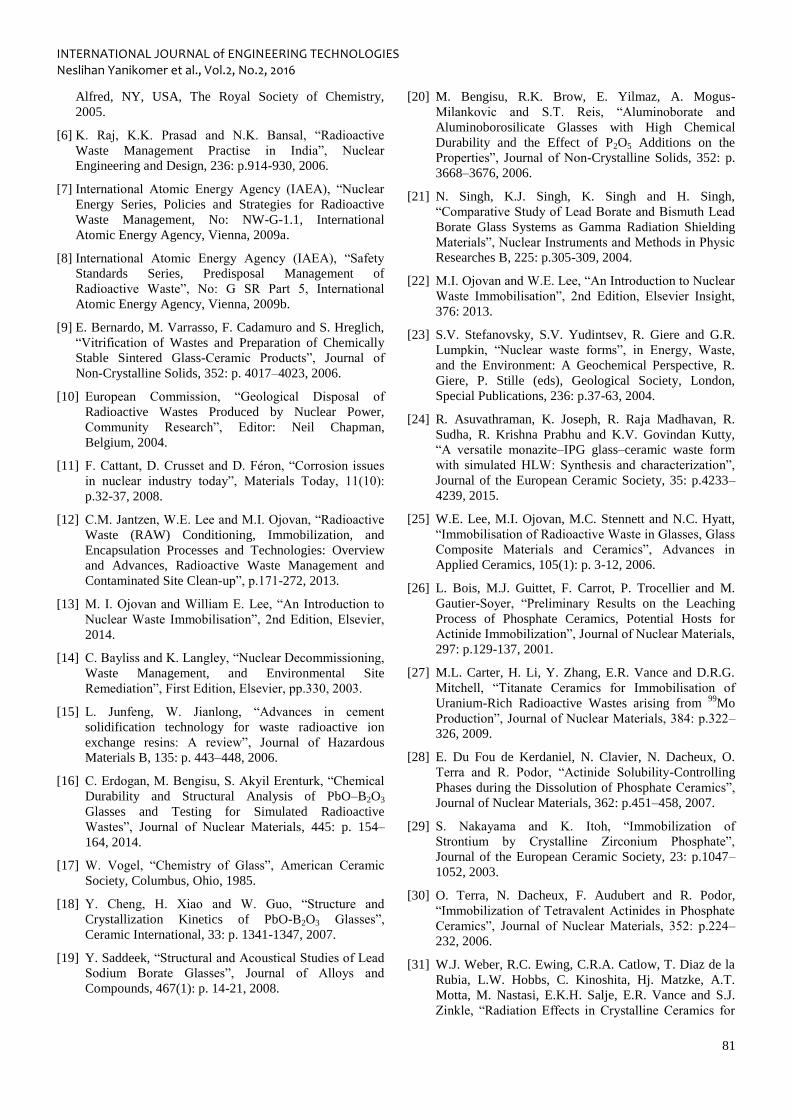
INTERNATIONAL JOURNAL of ENGINEERING TECHNOLOGIES Neslihan Yanikomer et al., Vol.2, No.2, 2016
81
Alfred, NY, USA, The Royal Society of Chemistry,
2005.
[6] K. Raj, K.K. Prasad and N.K. Bansal, “Radioactive
Waste Management Practise in India”, Nuclear
Engineering and Design, 236: p.914-930, 2006.
[7] International Atomic Energy Agency (IAEA), “Nuclear
Energy Series, Policies and Strategies for Radioactive
Waste Management, No: NW-G-1.1, International
Atomic Energy Agency, Vienna, 2009a.
[8] International Atomic Energy Agency (IAEA), “Safety
Standards Series, Predisposal Management of
Radioactive Waste”, No: G SR Part 5, International
Atomic Energy Agency, Vienna, 2009b.
[9] E. Bernardo, M. Varrasso, F. Cadamuro and S. Hreglich,
“Vitrification of Wastes and Preparation of Chemically
Stable Sintered Glass-Ceramic Products”, Journal of
Non-Crystalline Solids, 352: p. 4017–4023, 2006.
[10] European Commission, “Geological Disposal of
Radioactive Wastes Produced by Nuclear Power,
Community Research”, Editor: Neil Chapman,
Belgium, 2004.
[11] F. Cattant, D. Crusset and D. Féron, “Corrosion issues
in nuclear industry today”, Materials Today, 11(10):
p.32-37, 2008.
[12] C.M. Jantzen, W.E. Lee and M.I. Ojovan, “Radioactive
Waste (RAW) Conditioning, Immobilization, and
Encapsulation Processes and Technologies: Overview
and Advances, Radioactive Waste Management and
Contaminated Site Clean-up”, p.171-272, 2013.
[13] M. I. Ojovan and William E. Lee, “An Introduction to
Nuclear Waste Immobilisation”, 2nd Edition, Elsevier,
2014.
[14] C. Bayliss and K. Langley, “Nuclear Decommissioning,
Waste Management, and Environmental Site
Remediation”, First Edition, Elsevier, pp.330, 2003.
[15] L. Junfeng, W. Jianlong, “Advances in cement
solidification technology for waste radioactive ion
exchange resins: A review”, Journal of Hazardous
Materials B, 135: p. 443–448, 2006.
[16] C. Erdogan, M. Bengisu, S. Akyil Erenturk, “Chemical
Durability and Structural Analysis of PbO–B2O3
Glasses and Testing for Simulated Radioactive
Wastes”, Journal of Nuclear Materials, 445: p. 154–
164, 2014.
[17] W. Vogel, “Chemistry of Glass”, American Ceramic
Society, Columbus, Ohio, 1985.
[18] Y. Cheng, H. Xiao and W. Guo, “Structure and
Crystallization Kinetics of PbO-B2O3 Glasses”,
Ceramic International, 33: p. 1341-1347, 2007.
[19] Y. Saddeek, “Structural and Acoustical Studies of Lead
Sodium Borate Glasses”, Journal of Alloys and
Compounds, 467(1): p. 14-21, 2008.
[20] M. Bengisu, R.K. Brow, E. Yilmaz, A. Mogus-
Milankovic and S.T. Reis, “Aluminoborate and
Aluminoborosilicate Glasses with High Chemical
Durability and the Effect of P2O5 Additions on the
Properties”, Journal of Non-Crystalline Solids, 352: p.
3668–3676, 2006.
[21] N. Singh, K.J. Singh, K. Singh and H. Singh,
“Comparative Study of Lead Borate and Bismuth Lead
Borate Glass Systems as Gamma Radiation Shielding
Materials”, Nuclear Instruments and Methods in Physic
Researches B, 225: p.305-309, 2004.
[22] M.I. Ojovan and W.E. Lee, “An Introduction to Nuclear
Waste Immobilisation”, 2nd Edition, Elsevier Insight,
376: 2013.
[23] S.V. Stefanovsky, S.V. Yudintsev, R. Giere and G.R.
Lumpkin, “Nuclear waste forms”, in Energy, Waste,
and the Environment: A Geochemical Perspective, R.
Giere, P. Stille (eds), Geological Society, London,
Special Publications, 236: p.37-63, 2004.
[24] R. Asuvathraman, K. Joseph, R. Raja Madhavan, R.
Sudha, R. Krishna Prabhu and K.V. Govindan Kutty,
“A versatile monazite–IPG glass–ceramic waste form
with simulated HLW: Synthesis and characterization”,
Journal of the European Ceramic Society, 35: p.4233–
4239, 2015.
[25] W.E. Lee, M.I. Ojovan, M.C. Stennett and N.C. Hyatt,
“Immobilisation of Radioactive Waste in Glasses, Glass
Composite Materials and Ceramics”, Advances in
Applied Ceramics, 105(1): p. 3-12, 2006.
[26] L. Bois, M.J. Guittet, F. Carrot, P. Trocellier and M.
Gautier-Soyer, “Preliminary Results on the Leaching
Process of Phosphate Ceramics, Potential Hosts for
Actinide Immobilization”, Journal of Nuclear Materials,
297: p.129-137, 2001.
[27] M.L. Carter, H. Li, Y. Zhang, E.R. Vance and D.R.G.
Mitchell, “Titanate Ceramics for Immobilisation of
Uranium-Rich Radioactive Wastes arising from 99
Mo
Production”, Journal of Nuclear Materials, 384: p.322–
326, 2009.
[28] E. Du Fou de Kerdaniel, N. Clavier, N. Dacheux, O.
Terra and R. Podor, “Actinide Solubility-Controlling
Phases during the Dissolution of Phosphate Ceramics”,
Journal of Nuclear Materials, 362: p.451–458, 2007.
[29] S. Nakayama and K. Itoh, “Immobilization of
Strontium by Crystalline Zirconium Phosphate”,
Journal of the European Ceramic Society, 23: p.1047–
1052, 2003.
[30] O. Terra, N. Dacheux, F. Audubert and R. Podor,
“Immobilization of Tetravalent Actinides in Phosphate
Ceramics”, Journal of Nuclear Materials, 352: p.224–
232, 2006.
[31] W.J. Weber, R.C. Ewing, C.R.A. Catlow, T. Diaz de la
Rubia, L.W. Hobbs, C. Kinoshita, Hj. Matzke, A.T.
Motta, M. Nastasi, E.K.H. Salje, E.R. Vance and S.J.
Zinkle, “Radiation Effects in Crystalline Ceramics for
INTERNATIONAL JOURNAL of ENGINEERING TECHNOLOGIES Neslihan Yanikomer et al., Vol.2, No.2, 2016
82
the Immobilization of High-Level Nuclear Waste and
Plutonium”, Journal of Materials Research, 13(6):
p.1434-1484, 1998.
[32] Y. Zhang, M.W.A. Stewart, H. Li, M.L. Carter, E.R.
Vance and S. Moricca, “Zirconolite-rich Titanate
Ceramics for Immobilisation of Actinides–Waste
Form/HIP can Interactions and Chemical Durability”,
Journal of Nuclear Materials, 395: p. 69–74, 2009.
[33] V. Pet'kov, E. Asabina, V. Loshkarev and M.
Sukhanov, “Systematic investigation of the strontium
zirconium phosphate ceramic form for nuclear waste
immobilization”, Journal of Nuclear Materials, 471:
p.122-128, 2016.
[34] A.S. Wagh, S.Y. Sayenko, V.A. Shkuropatenko, R.V.
Tarasov, M.P. Dykiy, Y.O. Svitlychniy, V.D. Virych
and E.A. Ulybkin, “Experimental Study on Cesium
Immobilization in Struvite Structures”, Journal of
Hazardous Materials, 302: p.241–249, 2016.
[35] M. Kim and J. Heo, “Calcium-Borosilicate Glass-
Ceramics Wasteforms to Immobilize Rare-Earth Oxide
Wastes from Pyro-Processing”, Journal of Nuclear
Materials, 467: p. 224-228, 2015.
[36] W.J. Weber, A. Navrotsky, S. Stefanovsky, E.R. Vance
and E. Vernaz, “Materials Science of High-Level
Nuclear Waste Immobilization”, MRS Bulletin,
Volume 34: p.46-53, 2009.
[37] S. Jakkula and V. Deshpande, “Effect of MgO
Addition on the Properties of PbO–TiO2–B2O3 Glass
and Glass–Ceramics”, Ceramics International, 39:
p.15–18, 2013.
[38] S. Golezardi, V.K. Marghussian, A. Beitollahi and
S.M. Mirkazemi, “Crystallization Behavior,
Microstructure and Dielectric Properties of Lead
Titanate Glass Ceramics in the Presence of Bi2O3 as a
Nucleating Agent”, Journal of the European Ceramic
Society, 30: p.1453–1460, 2010.
[39] M. Tang, A. Kossoy, G. Jarvinen, J. Crum, L. Turo, B.
Riley, K. Brinkman, K. Fox, J. Amoroso, and J. Marra,
“Radiation Stability Test on Multiphase Glass Ceramic
and Crystalline Ceramic Waste Forms”, Nuclear
Instruments and Methods in Physics Research B, 326:
p.293–297, 2014.

INTERNATIONAL JOURNAL OF ENGINEERING TECHNOLOGIES-IJET
Guide for Authors
The International Journal of Engineering Technologies (IJET) seeks to promote and disseminate knowledge of the various topics of engineering technologies. The journal aims to present to the international community important results of work in the fields of engineering such as imagining, researching, planning, creating, testing, improving, implementing, using and asking. The journal also aims to help researchers, scientists, manufacturers, institutions, world agencies, societies, etc. to keep up with new developments in theory and applications and to provide alternative engineering solutions to current.
The International Journal of Engineering Technologies is a quarterly published journal and operates an online submission and peer review system allowing authors to submit articles online and track their progress via its web interface. The journal aims for a publication speed of 60 days from submission until final publication.
The coverage of IJET includes the following engineering areas, but not limited to:
All filed of engineering such as;
Chemical engineering
Biomolecular engineering
Materials engineering
Molecular engineering
Process engineering
Civil engineering
Environmental engineering
Geotechnical engineering
Structural engineering
Transport engineering
Water resources engineering
Electrical engineering
Computer engineering
Electronic engineering
Optical engineering
Power engineering
Mechanical engineering
Acoustical engineering

Manufacturing engineering
Thermal engineering
Vehicle engineering
Systems (interdisciplinary) engineering
Aerospace engineering
Agricultural engineering
Applied engineering
Biological engineering
Building services engineering
Energy engineering
Railway engineering
Industrial engineering
Mechatronics
Military engineering
Nano engineering
Nuclear engineering
Petroleum engineering
Types of Articles submitted should be original research papers, not previously published, in one of the following categories,
– Applicational and design studies.
– Technology development,
– Comparative case studies.
– Reviews of special topics.
– Reviews of work in progress and facilities development.
– Survey articles.
– Guest editorials for special issues.

Editorial Board
Editor-in-Chief:
Professor ILHAMI COLAK
Associate Editors:
Dr. Selin ÖZCIRA
Dr. Mehmet YESILBUDAK
Ethic Responsibilities
The publication of an article in peer-reviewed “International Journal of Engineering Technologies” is an essential building block in the development of a coherent and respected network of knowledge. It is a direct reflection of the quality of the work. Peer-reviewed articles support and embody the scientific method. It is therefore important to agree upon standards of expected ethical behavior for all parties involved in the act of publishing: the author, the journal editor, the peer reviewer, the publisher and the society of society-owned or sponsored journals.
All authors are requested to disclose any actual or potential conflict of interest including any financial, personal or other relationships with other people or organizations within three years of beginning the submitted work that could inappropriately influence, or be perceived to influence, their work.
Submission of an article implies that the work described has not been published previously that it is not under consideration for publication elsewhere. The submission should be approved by all authors and tacitly or explicitly by the responsible authorities where the work was carried out, and that, if accepted, it will not be published elsewhere in the same form, in English or in any other language, including electronically without the written consent of the copyright-holder.
Upon acceptance of an article, authors will be asked to complete a “Copyright Form”. Acceptance of the agreement will ensure the widest possible dissemination of information. An e-mail will be sent to the corresponding author confirming receipt of the manuscript together with a “Copyright Form” form or a link to the online version of this agreement.
Author Rights
As a journal author, you retain rights for a large number of author uses, including use by your employing institute or company. These rights are retained and permitted without the need to obtain specific permission from IJET. These include:
The right to make copies (print or electronic) of the journal article for your own personal use, including for your own classroom teaching use;
The right to make copies and distribute copies (including via e-mail) of the journal article to research colleagues, for personal use by such colleagues for scholarly purposes;
The right to post a pre-print version of the journal article on internet web sites including electronic pre-print servers, and to retain indefinitely such version on such servers or sites for scholarly purposes

the right to post a revised personal version of the text of the final journal article on your personal or institutional web site or server for scholarly purposes
The right to use the journal article or any part thereof in a printed compilation of your works, such as collected writings or lecture notes.
Article Style
Authors must strictly follow the guide for authors, or their articles may be rejected without review. Editors reserve the right to adjust the style to certain standards of uniformity. Follow Title, Authors, Affiliations, Abstract, Keywords, Introduction, Materials and Methods, Theory/Calculation, Conclusions, Acknowledgements, References order when typing articles. The corresponding author should be identified with an asterisk and footnote. Collate acknowledgements in a separate section at the end of the article and do not include them on the title page, as a footnote to the title or otherwise.
Abstract and Keywords:
Enter an abstract of up to 250 words for all articles. This is a concise summary of the whole paper, not just the conclusions, and is understandable without reference to the rest of the paper. It should contain no citation to other published work. Include up to six keywords that describe your paper for indexing purposes.
Abbreviations and Acronyms:
Define abbreviations and acronyms the first time they are used in the text, even if they have been defined in the abstract. Abbreviations such as IEEE, SI, MKS, CGS, sc, dc, and rms do not have to be defined. Do not use abbreviations in the title unless they are unavoidable.
Text Layout for Peer Review:
Use single column layout, double spacing and wide (3 cm) margins on white paper at the peer review stage. Ensure that each new paragraph is clearly indicated. Present tables and figure legends in the text where they are related and cited. Number all pages consecutively; use 12 pt font size and standard fonts; Times New Roman, Helvetica, or Courier is preferred.
Research Papers should not exceed 12 printed pages in two-column publishing format, including figures and tables.
Technical Notes and Letters should not exceed 2,000 words.
Reviews should not exceed 20 printed pages in two-column publishing format, including figures and tables.
Equations:
Number equations consecutively with equation numbers in parentheses flush with the right margin, as in (1). To make equations more compact, you may use the solidus ( / ), the exp function, or appropriate exponents. Italicize Roman symbols for quantities and variables, but not Greek symbols. Use an dash (–) rather than a hyphen for a minus sign. Use parentheses to avoid ambiguities in denominators. Punctuate equations with commas or periods when they are part of a sentence, as in
C = a + b (1)

Symbols in your equation should be defined before the equation appears or immediately following. Use “Eq. (1)” or “equation (1),” while citing.
Figures and Tables:
All illustrations must be supplied at the correct resolution:
* Black and white and colour photos - 300 dpi
* Graphs, drawings, etc - 800 dpi preferred; 600 dpi minimum
* Combinations of photos and drawings (black and white and color) - 500 dpi
In addition to using figures in the text, upload each figure as a separate file in either .tiff or .eps format during submission, with the figure number.
Table captions should be written in the same format as figure captions; for example, “Table 1. Appearance styles.”. Tables should be referenced in the text unabbreviated as “Table 1.”
References:
Please ensure that every reference cited in the text is also present in the reference list (and viceversa). Any references cited in the abstract must be given in full. Unpublished results and personal communications are not recommended in the reference list, but may be mentioned in the text. Citation of a reference as “in press” implies that the item has been accepted for publication. Number citations consecutively in square brackets [1]. Punctuation follows the bracket [2]. Refer simply to the reference number, as in [3]. Use “Ref. [3]” or Reference [3]” at the beginning of a sentence: “Reference [3] was …”. Give all authors’ names; use “et al.” if there are six authors or more. For papers published in translated journals, first give the English citation, then the original foreign-language citation.
Books
[1] J. Clerk Maxwell, A Treatise on Electricity and Magnetism, 3rd ed., vol. 2. Oxford:Clarendon Press, 1892, pp.68-73.
Journals
[2] Y. Yorozu, M. Hirano, K. Oka, and Y. Tagawa, “Electron spectroscopy studies on magneto-optical media and plastic substrate interface”, IEEE Transl. J. Magn. Japan, vol. 2, pp. 740-741, August 1987.
Conferences
[3] Çolak I., Kabalci E., Bayindir R., and Sagiroglu S, “The design and analysis of a 5-level cascaded voltage source inverter with low THD”, 2nd PowerEng Conference, Lisbon, pp. 575-580, 18-20 March 2009.
Reports
[4] IEEE Standard 519-1992, Recommended practices and requirements for harmonic control in electrical power systems, The Institute of Electrical and Electronics Engineers, 1993.

Text Layout for Accepted Papers:
A4 page margins should be margins: top = 24 mm, bottom = 24 mm, side = 15 mm. Main text should be given in two column. The column width is 87mm (3.425 in). The space between the two columns is 6 mm (0.236 in). Paragraph indentation is 3.5 mm (0.137 in). Follow the type sizes specified in Table. Position figures and tables at the tops and bottoms of columns. Avoid placing them in the middle of columns. Large figures and tables may span across both columns. Figure captions should be centred below the figures; table captions should be centred above. Avoid placing figures and tables before their first mention in the text. Use the abbreviation “Fig. 1,” even at the beginning of a sentence.
Type size (pts.)
Appearance
Regular Bold Italic
10 Authors’ affiliations, Section titles,
references, tables, table names, first letters in table captions,figure captions, footnotes, text subscripts, and superscripts
Abstract
12 Main text, equations, Authors’ names, a Subheading (1.1.)
24 Paper title
Submission checklist:
It is hoped that this list will be useful during the final checking of an article prior to sending it to the journal's Editor for review. Please consult this Guide for Authors for further details of any item. Ensure that the following items are present:
One Author designated as corresponding Author:
• E-mail address
• Full postal address
• Telephone and fax numbers
All necessary files have been uploaded
• Keywords: a minimum of 4
• All figure captions (supplied in a separate document)
• All tables (including title, description, footnotes, supplied in a separate document)
Further considerations
• Manuscript has been "spellchecked" and "grammar-checked"
• References are in the correct format for this journal
• All references mentioned in the Reference list are cited in the text, and vice versa

• Permission has been obtained for use of copyrighted material from other sources (including the Web)
• Color figures are clearly marked as being intended for color reproduction on the Web (free of charge) and in print or to be reproduced in color on the Web (free of charge) and in black-and-white in print.
Article Template Containing Author Guidelines for Peer-Review
First Author*, Second Author**‡, Third Author***
*Department of First Author, Faculty of First Author, Affiliation of First Author, Postal address
**Department of Second Author, Faculty of First Author, Affiliation of First Author, Postal address
***Department of Third Author, Faculty of First Author, Affiliation of First Author, Postal address
(First Author Mail Address, Second Author Mail Address, Third Author Mail Address)
‡ Corresponding Author; Second Author, Postal address, Tel: +90 312 123 4567, Fax: +90 312 123 4567,[email protected]
Received: xx.xx.xxxx Accepted:xx.xx.xxxx
Abstract- Enter an abstract of up to 250 words for all articles. This is a concise summary of the whole
paper, not just the conclusions, and is understandable without reference to the rest of the paper. It should
contain no citation to other published work. Include up to six keywords that describe your paper for
indexing purposes. Define abbreviations and acronyms the first time they are used in the text, even if they
have been defined in the abstract. Abbreviations such as IEEE, SI, MKS, CGS, sc, dc, and rms do not
have to be defined. Do not use abbreviations in the title unless they are unavoidable.
Keywords- Keyword1; keyword2; keyword3; keyword4; keyword5.
2. Introduction
Authors should any word processing software that is capable to make corrections on misspelled words
and grammar structure according to American or Native English. Authors may get help by from word

processor by making appeared the paragraph marks and other hidden formatting symbols. This sample
article is prepared to assist authors preparing their articles to IJET.
Indent level of paragraphs should be 0.63 cm (0.24 in) in the text of article. Use single column layout,
double-spacing and wide (3 cm) margins on white paper at the peer review stage. Ensure that each new
paragraph is clearly indicated. Present tables and figure legends in the text where they are related and
cited. Number all pages consecutively; use 12 pt font size and standard fonts; Times New Roman,
Helvetica, or Courier is preferred. Indicate references by number(s) in square brackets in line with the
text. The actual authors can be referred to, but the reference number(s) must always be given. Example:
"..... as demonstrated [3, 6]. Barnaby and Jones [8] obtained a different result ...."
IJET accepts submissions in three styles that are defined as Research Papers, Technical Notes and
Letter, and Review paper. The requirements of paper are as listed below:
Research Papers should not exceed 12 printed pages in two-column publishing format, including
figures and tables.
Technical Notes and Letters should not exceed 2,000 words.
Reviews should not exceed 20 printed pages in two-column publishing format, including figures
and tables.
Authors are requested write equations using either any mathematical equation object inserted to word
processor or using independent equation software. Symbols in your equation should be defined before the
equation appears or immediately following. Use “Eq. (1)” or “equation (1),” while citing. Number
equations consecutively with equation numbers in parentheses flush with the right margin, as in Eq. (1).
To make equations more compact, you may use the solidus ( / ), the exp function, or appropriate
exponents. Italicize Roman symbols for quantities and variables, but not Greek symbols. Use an dash (–)
rather than a hyphen for a minus sign. Use parentheses to avoid ambiguities in denominators. Punctuate
equations with commas or periods when they are part of a sentence, as in
C = a + b (1)
Section titles should be written in bold style while sub section titles are italic.
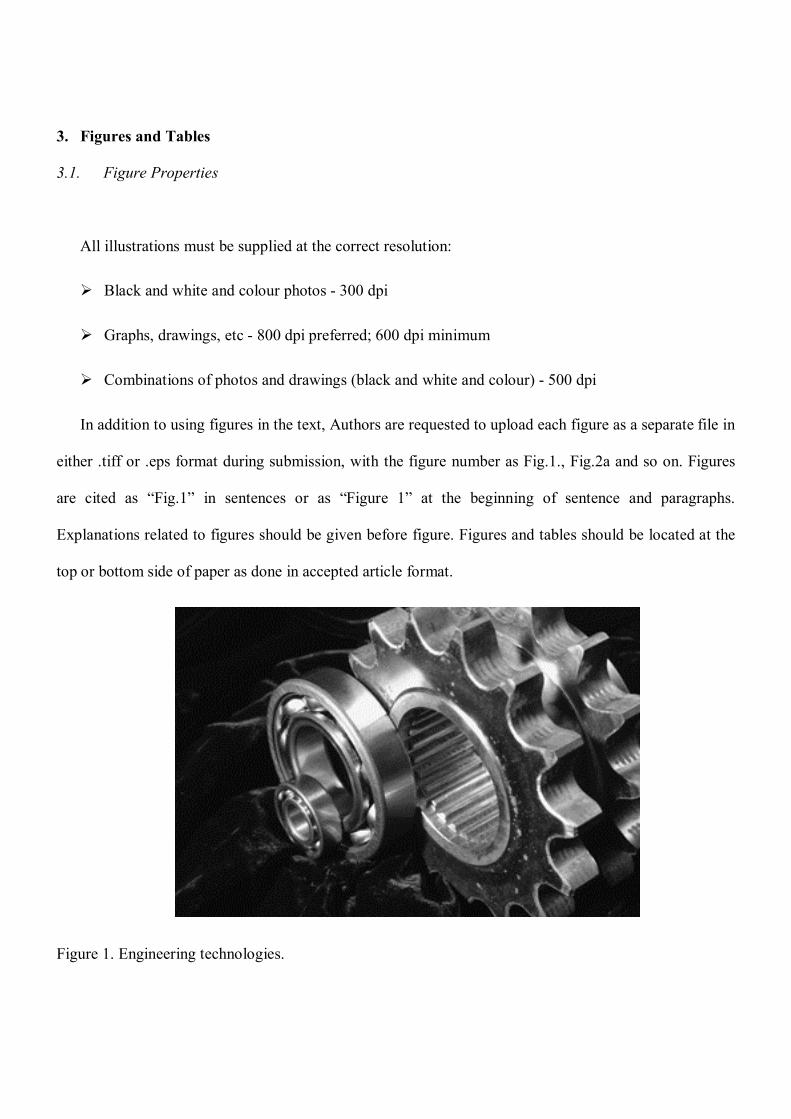
3. Figures and Tables
3.1. Figure Properties
All illustrations must be supplied at the correct resolution:
Black and white and colour photos - 300 dpi
Graphs, drawings, etc - 800 dpi preferred; 600 dpi minimum
Combinations of photos and drawings (black and white and colour) - 500 dpi
In addition to using figures in the text, Authors are requested to upload each figure as a separate file in
either .tiff or .eps format during submission, with the figure number as Fig.1., Fig.2a and so on. Figures
are cited as “Fig.1” in sentences or as “Figure 1” at the beginning of sentence and paragraphs.
Explanations related to figures should be given before figure. Figures and tables should be located at the
top or bottom side of paper as done in accepted article format.
Figure 1. Engineering technologies.

Table captions should be written in the same format as figure captions; for example, “Table 1.
Appearance styles.”. Tables should be referenced in the text unabbreviated as “Table 1.”
Table 1. Appearance properties of accepted manuscripts
Type size (pts.)
Appearance
Regular Bold Italic 10 Authors’ affiliations, Abstract, keywords,
references, tables, table names, figure captions, footnotes, text subscripts, and superscripts
Abstract
12 Main text, equations, Authors’ names, Section titles
Subheading (1.1.)
24 Paper title
4. Submission Process
The International Journal of Engineering Technologies operates an online submission and peer
review system that allows authors to submit articles online and track their progress via a web interface.
Articles that are prepared referring to this template should be controlled according to submission checklist
given in “Guide f Authors”. Editor handles submitted articles to IJET primarily in order to control in
terms of compatibility to aims and scope of Journal.
Articles passed this control are checked for grammatical and template structures. If article passes this
control too, then reviewers are assigned to article and Editor gives a reference number to paper. Authors
registered to online submission system can track all these phases.
Editor also informs authors about processes of submitted article by e-mail. Each author may also
apply to Editor via online submission system to review papers related to their study areas. Peer review is
a critical element of publication, and one of the major cornerstones of the scientific process. Peer Review
serves two key functions:
Acts as a filter: Ensures research is properly verified before being published
Improves the quality of the research

5. Conclusion
The conclusion section should emphasize the main contribution of the article to literature. Authors
may also explain why the work is important, what are the novelties or possible applications and
extensions. Do not replicate the abstract or sentences given in main text as the conclusion.
Acknowledgements
Authors may acknowledge to any person, institution or department that supported to any part of study.
References
[1] J. Clerk Maxwell, A Treatise on Electricity and Magnetism, 3rd ed., vol. 2. Oxford:Clarendon Press, 1892, pp.68-73.
(Book)
[2] H. Poor, An Introduction to Signal Detection and Estimation, New York: Springer-Verlag, 1985, ch. 4. (Book Chapter)
[3] Y. Yorozu, M. Hirano, K. Oka, and Y. Tagawa, “Electron spectroscopy studies on magneto-optical media and plastic
substrate interface”, IEEE Transl. J. Magn. Japan, vol. 2, pp. 740-741, August 1987. (Article)
[4] E. Kabalcı, E. Irmak, I. Çolak, “Design of an AC-DC-AC converter for wind turbines”, International Journal of Energy
Research, Wiley Interscience, DOI: 10.1002/er.1770, Vol. 36, No. 2, pp. 169-175. (Article)
[5] I. Çolak, E. Kabalci, R. Bayindir R., and S. Sagiroglu, “The design and analysis of a 5-level cascaded voltage source
inverter with low THD”, 2nd PowerEng Conference, Lisbon, pp. 575-580, 18-20 March 2009. (Conference Paper)
[6] IEEE Standard 519-1992, Recommended practices and requirements for harmonic control in electrical power systems,
The Institute of Electrical and Electronics Engineers, 1993. (Standards and Reports)

Article Template Containing Author Guidelines for Accepted Papers
First Author*, Second Author**‡, Third Author***
*Department of First Author, Faculty of First Author, Affiliation of First Author, Postal address
**Department of Second Author, Faculty of First Author, Affiliation of First Author, Postal address
***Department of Third Author, Faculty of First Author, Affiliation of First Author, Postal address
(First Author Mail Address, Second Author Mail Address, Third Author Mail Address)
‡ Corresponding Author; Second Author, Postal address, Tel: +90 312 123 4567,
Fax: +90 312 123 4567,[email protected]
Received: xx.xx.xxxx Accepted:xx.xx.xxxx
Abstract- Enter an abstract of up to 250 words for all articles. This is a concise summary of the whole paper, not just the conclusions, and is understandable without reference to the rest of the paper. It should contain no citation to other published work. Include up to six keywords that describe your paper for indexing purposes. Define abbreviations and acronyms the first time they are used in the text, even if they have been defined in the abstract. Abbreviations such as IEEE, SI, MKS, CGS, sc, dc, and rms do not have to be defined. Do not use abbreviations in the title unless they are unavoidable.
Keywords Keyword1, keyword2, keyword3, keyword4, keyword5.
1. Introduction
Authors should any word processing software that is capable to make corrections on misspelled words and grammar structure according to American or Native English. Authors may get help by from word processor by making appeared the paragraph marks and other hidden formatting symbols. This sample article is prepared to assist authors preparing their articles to IJET.
Indent level of paragraphs should be 0.63 cm (0.24 in) in the text of article. Use single column layout, double-spacing and wide (3 cm) margins on white paper at the peer review stage. Ensure that each new paragraph is clearly indicated. Present tables and figure legends in the text where they are related and cited. Number all pages consecutively; use 12 pt font size and standard fonts; Times New Roman, Helvetica, or Courier is preferred. Indicate references by number(s) in square brackets in line with the text. The actual authors can be referred to, but the reference number(s) must always be given. Example: "..... as demonstrated [3,6]. Barnaby and Jones [8] obtained a different result ...."
IJET accepts submissions in three styles that are defined as Research Papers, Technical Notes and Letter, and Review paper. The requirements of paper are as listed below:
Research Papers should not exceed 12 printed pages in two-column publishing format, including figures and tables.
Technical Notes and Letters should not exceed 2,000 words.
Reviews should not exceed 20 printed pages in two-column publishing format, including figures and tables.
Authors are requested write equations using either any mathematical equation object inserted to word processor or using independent equation software. Symbols in your equation should be defined before the equation appears or immediately following. Use “Eq. (1)” or “equation (1),” while citing. Number equations consecutively with equation numbers in parentheses flush with the right margin, as in Eq. (1). To make equations more compact, you may use the solidus ( / ), the exp function, or appropriate exponents. Italicize Roman symbols for quantities and variables, but not Greek symbols. Use an dash (-) rather than a hyphen for a minus sign. Use parentheses to avoid ambiguities in denominators. Punctuate equations with commas or periods when they are part of a sentence, as in
C = a + b (1)
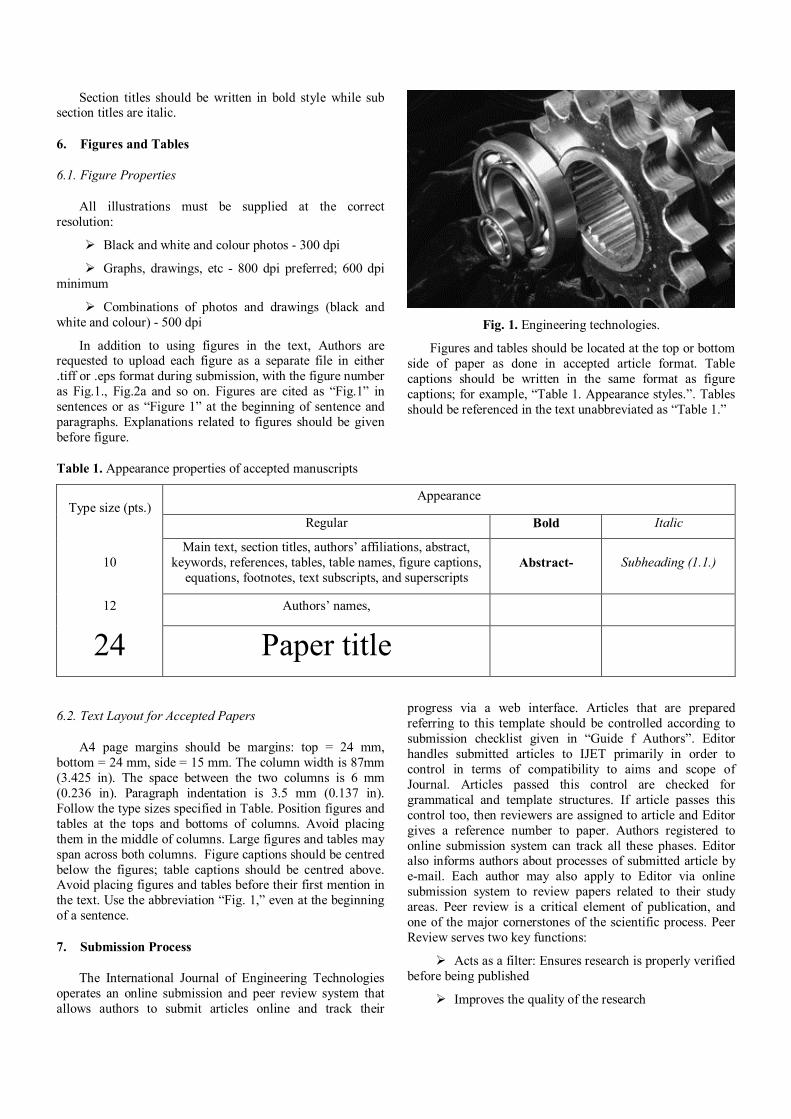
Section titles should be written in bold style while sub section titles are italic.
6. Figures and Tables
6.1. Figure Properties
All illustrations must be supplied at the correct resolution:
Black and white and colour photos - 300 dpi
Graphs, drawings, etc - 800 dpi preferred; 600 dpi minimum
Combinations of photos and drawings (black and white and colour) - 500 dpi
In addition to using figures in the text, Authors are requested to upload each figure as a separate file in either .tiff or .eps format during submission, with the figure number as Fig.1., Fig.2a and so on. Figures are cited as “Fig.1” in sentences or as “Figure 1” at the beginning of sentence and paragraphs. Explanations related to figures should be given before figure.
Fig. 1. Engineering technologies.
Figures and tables should be located at the top or bottom side of paper as done in accepted article format. Table captions should be written in the same format as figure captions; for example, “Table 1. Appearance styles.”. Tables should be referenced in the text unabbreviated as “Table 1.”
Table 1. Appearance properties of accepted manuscripts
Type size (pts.) Appearance
Regular Bold Italic
10 Main text, section titles, authors’ affiliations, abstract,
keywords, references, tables, table names, figure captions, equations, footnotes, text subscripts, and superscripts
Abstract- Subheading (1.1.)
12 Authors’ names,
24 Paper title
6.2. Text Layout for Accepted Papers
A4 page margins should be margins: top = 24 mm, bottom = 24 mm, side = 15 mm. The column width is 87mm (3.425 in). The space between the two columns is 6 mm (0.236 in). Paragraph indentation is 3.5 mm (0.137 in). Follow the type sizes specified in Table. Position figures and tables at the tops and bottoms of columns. Avoid placing them in the middle of columns. Large figures and tables may span across both columns. Figure captions should be centred below the figures; table captions should be centred above. Avoid placing figures and tables before their first mention in the text. Use the abbreviation “Fig. 1,” even at the beginning of a sentence.
7. Submission Process
The International Journal of Engineering Technologies operates an online submission and peer review system that allows authors to submit articles online and track their
progress via a web interface. Articles that are prepared referring to this template should be controlled according to submission checklist given in “Guide f Authors”. Editor handles submitted articles to IJET primarily in order to control in terms of compatibility to aims and scope of Journal. Articles passed this control are checked for grammatical and template structures. If article passes this control too, then reviewers are assigned to article and Editor gives a reference number to paper. Authors registered to online submission system can track all these phases. Editor also informs authors about processes of submitted article by e-mail. Each author may also apply to Editor via online submission system to review papers related to their study areas. Peer review is a critical element of publication, and one of the major cornerstones of the scientific process. Peer Review serves two key functions:
Acts as a filter: Ensures research is properly verified before being published
Improves the quality of the research

8. Conclusion
The conclusion section should emphasize the main contribution of the article to literature. Authors may also explain why the work is important, what are the novelties or possible applications and extensions. Do not replicate the abstract or sentences given in main text as the conclusion.
Acknowledgements
Authors may acknowledge to any person, institution or department that supported to any part of study.
References
[7] J. Clerk Maxwell, A Treatise on Electricity and Magnetism, 3rd ed., vol. 2. Oxford:Clarendon Press, 1892, pp.68-73. (Book)
[8] H. Poor, An Introduction to Signal Detection and Estimation, New York: Springer-Verlag, 1985, ch. 4. (Book Chapter)
[9] Y. Yorozu, M. Hirano, K. Oka, and Y. Tagawa, “Electron spectroscopy studies on magneto-optical media and plastic substrate interface”, IEEE Transl. J. Magn. Japan, vol. 2, pp. 740-741, August 1987. (Article)
[10] E. Kabalcı, E. Irmak, I. Çolak, “Design of an AC-DC-AC converter for wind turbines”, International Journal of Energy Research, Wiley Interscience, DOI: 10.1002/er.1770, Vol. 36, No. 2, pp. 169-175. (Article)
[11] I. Çolak, E. Kabalci, R. Bayindir R., and S. Sagiroglu, “The design and analysis of a 5-level cascaded voltage source inverter with low THD”, 2nd PowerEng Conference, Lisbon, pp. 575-580, 18-20 March 2009. (Conference Paper)
[12] IEEE Standard 519-1992, Recommended practices and requirements for harmonic control in electrical power systems, The Institute of Electrical and Electronics Engineers, 1993. (Standards and Reports)

INTERNATIONAL JOURNAL OF ENGINEERING TECHNOLOGIES (IJET) COPYRIGHT AND CONSENT FORM
This form is used for article accepted to be published by the IJET. Please read the form carefully and keep a copy for your files. TITLE OF ARTICLE (hereinafter, "The Article"):
………..…………………………………………………....................…………………………………………………………
………..…………………………………………………....................……………………………………………………………
…………..………………………………………………………………………..……………………………………………
LIST OF AUTHORS:
………..……………………………………………………………...…..………………………………………………………
………..…………………………………………………....................……………………………………………………………
……………………………………………………………………..……………………………………………..……………
CORRESPONDING AUTHOR’S (“The Author”) NAME, ADDRESS, INSTITUTE AND EMAIL: ………………………………………………………………………..…………………………………………………………
………..…………………………………………………....................……………………………………………………………
…………..………………………………………………………………………..…………………………………….……
COPYRIGHT TRANSFER
The undersigned hereby transfers the copyright of the submitted article to International Journal of Engineering Technologies (the "IJET"). The Author declares that the contribution and work is original, and he/she is authorized by all authors and/or grant-funding agency to sign the copyright form. Author hereby assigns all including but not limited to the rights to publish, distribute, reprints, translates, electronic and published derivates in various arrangements or any other versions in full or abridged forms to IJET. IJET holds the copyright of Article in its own name. Author(s) retain all rights to use author copy in his/her educational activities, own websites, institutional and/or funder’s web sites by providing full citation to final version published in IJET. The full citation is provided including Authors list, title of the article, volume and issue number, and page number or using a link to the article in IJET web site. Author(s) have the right to transmit, print and share the first submitted copies with colleagues. Author(s) can use the final published article for his/her own professional positions, career or qualifications by citing to the IJET publication. Once the copyright form is signed, any changes about the author names or order of the authors listed above are not accepted by IJET.
Authorized/Corresponding Author
Date/ Signature