international journal of enterprise and innovation ... · tqm/ hrm practices and hpws should...
TRANSCRIPT
International Journal of Enterprise andInnovation Management Studies (IJEIMS)
July - December 2009 Volume. 1 No. 1
ISSN : 0976-2698
SINGAPORE INDIA USA70, Park Road #23, Gnanajothi Nagar, 1402 S St NW#05-47 TeleTech Park Chidambaram – 608 001. Washington, DC 20009Singapore Science Park II Tamilnadu, INDIA. (202)387-2114Singapore. Ph: +91 00 99427 99084 [email protected]. : +6584250248 [email protected]@yahoo.com.sg
International Journal of Enterprise and Innovation Management StuidesJuly – December 2009 Vol 1. No 1
CONTENT1. Business Excellence Through Integration of TQM and HRM
Ms. Ankur Jain 1-92. Employer Branding For Sustainable Growth Of Organisations
Dr. V.T.R Vijayakumar and Mrs. S. Asha Parvin 10-143. Dividend Announcement Impact on Indian Bourses
S. Saravanakumar and Dr. A. Mahadevan 15-254. Brand Equity- The Ruler
Dr. S. Ramachandran 26-275. ERP Application in India: An Overview
N. Venkateswaran and Dr. V. Mahalakshmi 28-336. Stress Management with Special Reference to Public Sector Bank Employees in Chennai
Rajendran Jayashree 34-397. Evaluation of the Perception, Attitude and Practice of
Self Medication among Business Students in 3 Select Cities, South India
S. Kayalvizhi and Dr. R. Senapathi 40-448. Gen X And Y Go Mobile – Exploring the Factors affecting their Adoption and Usage
S. Mahalakshmi and Dr. K. Jawahar Rani 45-529. Multi-Dimensions of Unit Linked Insurance Plan among Various Investment Avenues
S. Saravanakumar and Dr. A. Mahadevan 53-6010. Impact of Transformational Leadership of Engineers Working
in Automobile Sector in India on their Own Creativity
Pankaj Sharma and Prof S C Pathak 61-6711. Determination of Lot Size in the Construction of Six Sigma Based Sampling Plans
R. Radhakrishnan and P. Vasanthamani 68-7312. Buyer Behaviour Towards Electronic Goods
Mrs. K. Rajaselvi 74-8013. Cotton Cultivation and Marketing – A Study on Prospects and Problems in Tirupur District
S.V. Ramesh 81-8814. Impact of Microfinance - An Empirical Study on The Attitude
of SHG Leaders in Kanyakumari District – Tamilnadu
Dr. N. Thalavai Pillai and Dr. S. Nadarajan 89-9515. Financial Performance analysis of Selected Software Companies in India
Dr. S. Usha 96-10816. “Role of Behavioural Finance – A Study”
K. Veeraraghavan 109-11217. Strategies for Strengthening Consumer Awareness
Dr. J. Venkatesh and Ms. I.S. Prabha 113-11618. Opinion of Customers about Dealers’ Service in Indane Gas
– A Study with Special Reference to Sivakasi Town
J. Vimal Priyan and V. Karthihaiselvi 117-12219. Kindness is the Great Investment of Business
D. Ezhilarasan and Dr. S.K. Nagarajan 123-12520. Customer Relationship Management In Banking Sector
(An Empirical Study with Reference to Banks in Thiruvannamalai District, Tamil Nadu)
M. Murugan and Dr. S.A. Senthil Kumar 126-13021. Impact of Indian overseas Bank Finance to Small Scale IndustryS.N. Dhanalakshmi
131-135

BUSINESS EXCELLENCE THROUGH INTEGRATION OF TQM ANDHRM
Ms. ANKUR JAINResearch scholar, Birla Institute of Technology, Mesra, Ranchi
E mail: [email protected]
ABSTRACT
Purpose – This paper seeks to examine employees’ perceptions of business excellence or High PerformanceWork System (HPWS) and its relationship with TQM/HRM practices within software industry in India. Despiteextensive research on TQM/HRM practices and HPWS, none examines this scope of investigative study.Therefore, the proposed model was developed with the intention of examining this relationship.
Design/methodology/approach – Original research using self-completed questionnaires, distributed to employeesof software industry, is thoroughly reported. The study sample consisted of 324 employees, resulting in a responserate of 81 percent. A questionnaire was developed and administered to ascertain the level of influence byTQM/HRM practices on HPWS. Data were analyzed by employing correlation.
Findings – The results revealed that HRM, organization culture, quality of work life, empowerment are highinvolvement TQM/HRM practices which are positively associated with employees perceptual outcomes andprocess quality management, benchmarking and others are low involvement TQM/HRM practices which arerequired for the cost efficiencies and operative outcomes of HPWS. Further, the result of the analysis supportsthe proposed model based on the empirically validated TQM/HRM instruments, which are reliable and valid.
Originality/value – The findings make a significant contribution by using software industry that proves to beuseful as an example of a methodology that might be used to track the extent of TQM/HRM effects on HPWS. Anorganization could use this instrument to do a pre-test baseline measurement, and then periodically re-administerit to identify changes associated with TQM/HRM efforts.
Keywords-Total quality management, Human Resource Management, High Performance Work System, softwareindustry.
I.INTRODUCTION
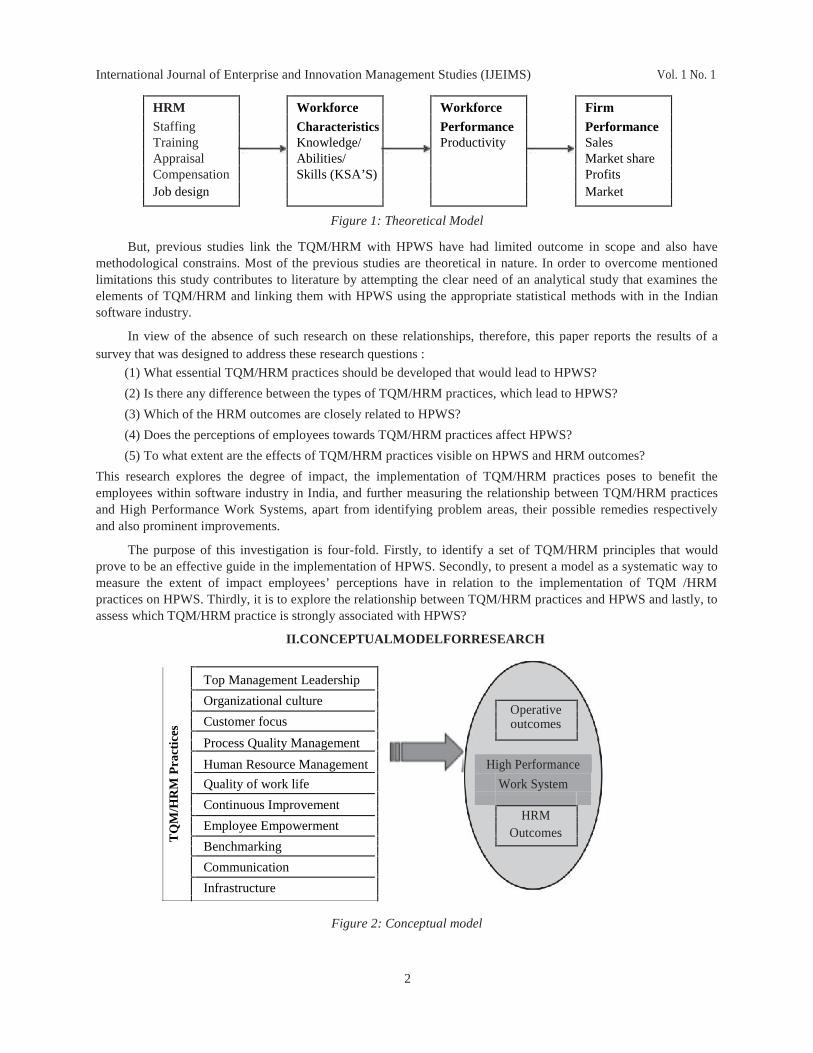
The relationship between TQM and HRM in relation with business excellence or performance of the organization isthe concerned area for many researchers. There are many theories and researches, which explain this relationship andprovide the practices, which are relevant for high performance work systems or business excellence. In the TQM literaturethere are some common practices described by many authors that contribute and leads to the business excellence. Dale(1999) explains that following TQM practices leads to the organizational excellence: leadership, training, involvement andparticipation of employees, co-operation and customer focus. These practices can also be described as HRM practices oractivities. A part from that various researchers explicitly described the best practices for High Performance Work Systemsor business excellence. Pfeffer (1994) describes 16 ‘high performance practices for high performance work systems.‘Information’, ‘high wages’, job security, motivated and flexible work force are amongst them. While Arther (1994)stresses on other practices like decentralization, participative leadership and excellent wages. Dalery and shaw (2002)states that a proper mixing and application of best practices as staffing, appraisal, compensation and job design will leadsto high performance work systems (see figure 1). The high performance work system models described in relation tointernational quality standards (like ISO, CMM, Six sigma etc.) developed best practices from TQM point of view(Blackburn and Rosen, 1993; Puay et al, 1998). Thus it is clear that TQM and HRM both are very much required forbusiness excellence or high performance work systems.
1
International Journal of Enterprise and Innovation Management Studies (IJEIMS) Vol. 1 No. 1
HRM Workforce Workforce FirmStaffing Characteristics Performance PerformanceTraining Knowledge/ Productivity SalesAppraisal Abilities/ Market shareCompensation Skills (KSA’S) ProfitsJob design Market
Figure 1: Theoretical Model
But, previous studies link the TQM/HRM with HPWS have had limited outcome in scope and also havemethodological constrains. Most of the previous studies are theoretical in nature. In order to overcome mentionedlimitations this study contributes to literature by attempting the clear need of an analytical study that examines theelements of TQM/HRM and linking them with HPWS using the appropriate statistical methods with in the Indiansoftware industry.
In view of the absence of such research on these relationships, therefore, this paper reports the results of asurvey that was designed to address these research questions :
(1) What essential TQM/HRM practices should be developed that would lead to HPWS?
(2) Is there any difference between the types of TQM/HRM practices, which lead to HPWS?
(3) Which of the HRM outcomes are closely related to HPWS?
(4) Does the perceptions of employees towards TQM/HRM practices affect HPWS?
(5) To what extent are the effects of TQM/HRM practices visible on HPWS and HRM outcomes?
This research explores the degree of impact, the implementation of TQM/HRM practices poses to benefit theemployees within software industry in India, and further measuring the relationship between TQM/HRM practicesand High Performance Work Systems, apart from identifying problem areas, their possible remedies respectivelyand also prominent improvements.
The purpose of this investigation is four-fold. Firstly, to identify a set of TQM/HRM principles that wouldprove to be an effective guide in the implementation of HPWS. Secondly, to present a model as a systematic way tomeasure the extent of impact employees’ perceptions have in relation to the implementation of TQM /HRMpractices on HPWS. Thirdly, it is to explore the relationship between TQM/HRM practices and HPWS and lastly, toassess which TQM/HRM practice is strongly associated with HPWS?
TQ
M/H
RM
Pra
ctic
es
II.CONCEPTUALMODELFORRESEARCH
Top Management Leadership
Organizational cultureOperative
Customer focus outcomes
Process Quality Management
Human Resource Management High Performance
Quality of work life Work System
Continuous ImprovementHRM
Employee Empowerment OutcomesBenchmarking
Communication
Infrastructure
Figure 2: Conceptual model
2

International Journal of Enterprise and Innovation Management Studies (IJEIMS) Vol. 1 No. 1
The conceptual schema of this study focuses on the development of a theoretical HPWS model as a systematicway in implementing TQM/HRM practices within software industry in India. Examining the relationship betweenTQM/ HRM practices and HPWS should contribute to our knowledge of the complexity of the relationship that existbetween them.
The link between TQM/HRM practices and HPWS is illustrated in Figure 2. In this theoretical framework,TQM/ HRM practices are independent variables and HRM outcomes and operative outcomes are dependentvariables, which are the part of HPWS. The present study thus attempts to bridge the gap by providing a basis for athorough and insightful discernment of TQM/HRM practices and HPWS.
III.HYPOTHESIS
Based on the extensive study of previous research, it would therefore suggest that TQM/HRM practices improve
HRM outcomes and operative outcomes. As such, the following hypothesis are proposed:
H1. TQM/HRM practices are positively associated with operative outcomes within software industry.
H2. TQM/HRM practices are positively associated with HRM outcomes within software industry.
IV.METHDOLOGY
Sample and procedures
An initial list of constructs was prepared through literature survey and it was sent to the software engineersand academicians to verify it. They evaluate the list and also assess the relevance, understandability, clarity, andunambiguity of the questions. This ensures the validity of the questionnaire.
Data were collected from employees of various software organizations in India. The Companies were selectedfrom the member list of NASSCOM.
The questionnaire survey was done for data collection. The questionnaires were sent to software developersand their managers who have more than 2 years of experience to 100 development centers of different softwarefirms. They were sent through email or distributed through HR manager. Out of the 400 questionnaires sent, 324questionnaires were returned, yielding a response rate of 81 percent, which is considered acceptable.
Variable measurementsIndependent variables:
TQM/HRM practices. A total of 45 questions captured the 11 TQM/HRM variables under investigation. Thequestionnaires on TQMHRM dimensions were grouped into 11 elements; namely, Top management leadership,Organizational culture, Customer focus, Process Quality Management, Quality of work life, ContinuousImprovement, Human resource management, Employee Empowerment, Benchmarking, Communication. Theimportance of the 11 constructs of TQM/HRM practices are described below:
(1) Top-Management Leadership (TML): The leadership of top management is very important and in central to theimplementation of a TQM/HRM practices in any organization. Many researchers states that the qualityimprovement efforts in any organization should start from the top and flows down to the lower level.
(2) Organizational Culture (OC): Quality cannot be achieved without the cooperation and coordination ofeveryone in the organization. A proper atmosphere should be created in the organization to imbibe andcultivate an organizational culture, which builds up the commitment of everyone to quality (Tenner 1991).
(3) Customer Focus (CF): Many studies agree on what quality means, satisfaction of customer requirements.Customer focus leads to improved quality irrespective of anything. So, understanding of the client’srequirements and maximizing his satisfaction are critical in the software industry also. The requirements of thecustomers (internal and/or external) should be satisfied at each stage of software development.
(4) Process Quality Management (PQM): Quality performance depends on process management, measurement andanalysis of data, and leadership. So, the quality of processes needs to be improved continuously for improvingthe quality of the product. “Process” is a key factor in software development. Improvement of processes helpsto reduce the effort, development time, and defects in software (Jalote 2000).
(5) Human Resource Management (HRM): Based on an empirical study, Paul and Anantharaman (2002) said that there
is a positive relationship between human resources practices and organizational performance. The authors further
3

International Journal of Enterprise and Innovation Management Studies (IJEIMS) Vol. 1 No. 1
states that there is a significant difference in human resources practices across multinational and Indiansoftware companies. Thus, it is evident that human resources practices are critical in software firms.(a) Reward and recognition: This can be defined as monetary and nonmonetary benefits, such as increasedsalary, bonuses and promotion resulting from the review of performance, which is gave publicacknowledgement of superior performance.(b) Recruitment, selection, and retention: Recruitment, selection, and retention of employees with requiredskills are very important for any organization. The ability of the employee to develop as a member of the teamas well as the organization is another important factor in the case of software industry. Employee turnover is amajor issue faced by software companies that should be minimized.(c) Training and development: Training brings about changes in knowledge, skills, attitudes, and social behavior ofemployees for doing a particular job, and it is a vital in continuous improvement. Training also helps to improveemployee participation and involvement in quality programs by providing required knowledge and skills to them.
(d) Teamwork: Teamwork is an important tool associated with quality management. Most of the software projectsinvolve the combined efforts of a number of people across various departments in the organization. Therefore, thesuccess of a project depends on interdependence and coordination among the team members in a software firm.
(6) Quality of Work life (QWL): An essential factor that decides the effectiveness of software employees is “conducivework environment.” Quality of work life is the general atmosphere and human relations at the workplace.
(7) Employee Empowerment (EE): Empowerment means the assigning of responsibility with authority to theemployees. High performance and high commitment require high levels of employee empowerment can besuccessfully used to transform organizations. Freedom for all team members to make suggestions duringsoftware development or project execution is a good practice for improving the software quality.
(8) Continuous Improvement (CI): According to the TQM philosophy, the key to quality is satisfying the needsand expectations of the customer through a system wide continuous improvement strategy (Goyal and Islam2001; Ahmed 2001). Therefore, superior quality demands the propagation of a culture of continuousimprovement, driven by measurement and improvement (Lewis 1999).
(9) Benchmarking (BM): Benchmarking is a term used to describe activities that are aimed to make comparisonsagainst the best practices. Benchmarking is a common element of TQM implementation, irrespective of thenature of the organization (Zinovy et al. 1996). In the IT industry, the common benchmark themes areexpenditures, operations, helpdesk activities, programming effectiveness, and efficiency (Cortada 1995).
(10) Infrastructure and Facilities (IF): Infrastructure becomes very critical in the case of software companies, wheretechnological advancement is rapid and its adaptation is compulsory for survival. The term “facilities” also includessufficient conference rooms; training areas; physical resources such as furniture, computers, and applicationsoftware; and communication technologies such as telephone, fax, and e-mail (Bahrami and Evans 1997).
(11) Communication (COM): Communication helps to provide better control of processes, which in turn helps toimprove quality. Communication helps to provide clarity of roles and responsibilities of each employee.Communication helps to improve quality through customer satisfaction by providing better service and quickerresponse to queries (Cortada 1995) opportunities. The internal consistency reliability coefficient for the scaleis 0.79.Prepare
Dependent variables:
High Performance Work Systems (HPWS). HPWS include two elements, namely HRM outcomes andoperative outcomes.
(1) HRM outcomes: This includes the HR performance of the system. This can be divided in two:
(a) Perception HRM outcomes; e.g. employee satisfaction, employee motivation, employee trust, employeecommitment, and employee loyalty.(b) Objective HRM outcomes; e.g. employee turnover rate and absenteeism rate.
(2) Operative Outcomes: This includes the productivity of the system. This includes:
(a) Product Attributes (PA): The quality of software is estimated by many of its attributes such as reliability,integrity, maintainability, enhanceability (extensibility), usability, portability, and reusability. They affect thecustomer satisfaction so these can be treated as the indicator of quality product.
4

International Journal of Enterprise and Innovation Management Studies (IJEIMS) Vol. 1 No. 1
(b) Return on Quality (ROQ): The returns (benefits) of quality implementation are measured by performanceindicators such as the reduction of errors, better process management, decrease in production costs, decrease inrejects and wastage, reduction in rework, and decrease in customer complaints (Radovilsky and Gotcher 1996).
Measure Items Factor loading KMO Eigenvalue Variance explained (%) Reliability
Independent variables
Top-Management Leadership 3 0.598-0.718 0.85 2.69 53.77 0.74
Employee Empowerment 4 0.531-0.955 0.70
Organizational culture 7 0.516-0.803 0.72
Communication 4 0.701-0.795 0.83
Customer Focus 4 0.510-0.755 0.80
Process Quality Management 4 0.588-0.728 0.83
Human Resource Management 8 0.541-0.955 0.76
Quality of Work life 4 0.516-0.813 0.76
Infrastructure and Facilities 3 0.703-0.796 0.81
Benchmarking 3 0.520-0.755 0.73
Continuous Improvement (CI) 3 0.599-0.718 0.74
Dependent variable
HRM outcomes 5 0.653-0.797 0.84 2.34 46.47 0.79
Operative outcomes 5 0.721-0.794 0.82
V.ANALYSISOFDATA
The statistical computer program used for the questionnaires data analysis was SPSS 11.0. Correlation studies wereused to determine the relationship between the dependent and independent variables. TQM/HRM practices were regressedagainst HPWS. The multiple regression analyses confirmed the significance of the independent and dependent variables.
A. Result of Surveys
Factor analysis and scale reliabilities:
Table I. Factor analysis and scale reliabilities – independent variables
Note: n =324
A principal component factor analysis with varimax rotation was conducted to validate the TQM /HRMpractices (Table I). In interpretation, only a loading of 0.5 or greater on the factor and 0.35 or lower on the otherfactors is considered. Varimax rotated analysis showed the existence of 11 significant factors with eigenvalues (i.e.2.69) greater than one that explained 53.79 percent of the variance. The KMO sampling adequacy test has 0.85 valuefor each item with sufficient intercorrelations with the Bartlett’s test of spehericity was also found significant (Chi-square = 472:06, p , 0.001). Thus, the factors are considered adequate because they are less than 60 percent of thevariance recommended in social sciences (Hair et al., 1998). The results of the factor analysis represented in Table I.
Similarly, another factor analysis was done to check the dimensionality of the dependent variables. The two factor analysis
with eigenvalue of 2.34 showing 46.45 percent of variance in the data. The KMO measure of sampling adequacy was 0.84
indicating sufficient intercorrelations, while the Bartlett’s test of sphericity was significant (Chi-square = 339:92, p, 0:01).
The reliability of the questionnaire was tested by Cronbach alpha. The reliability coefficient (alpha) of each elementof TQM/HRM practices was as follows: top management leadership (74 percent), employee empowerment (70 percent),organization culture (72 percent), communication (83 percent), process quality management (83 percent), human resourcemanagement (76 percent), quality of work life (76 percent), infrastructure and facilities (81 percent), benchmarking (73percent), and for continuous improvement (74 percent). The reliability for dependent variables i.e. HRM outcomes is (79percent) and for operative outcome is (82 percent). The reliability coefficients of all the five elements of TQM were above0.70, which concurs with the suggestion made by Nunnally (1978).
5

International Journal of Enterprise and Innovation Management Studies (IJEIMS) Vol. 1 No. 1
B. Descriptive Statistical Analysis
Mean SD 1 2 3 4 5 6 7 8 9 10 11
TML 3.76 0.55
EE 3.92 0.61 0.53*
OC 3.93 0.58 0.49 * 0.56 *
Com 3.89 0.62 0.54 * 0.61 * 0.67*
CF 3.74 0.57 0.42* 0.36 * 0.53* 0.62*
PQM 3.70 0.58 0.41* 0.46 * 0.47 * 0.57* 0.57 *
HRM 3.95 0.52 0.53* 0.65* 0.66* 0.57* 0.65* 0.63*
QWL 3.90 0.55 0.49 * 0.56 * 0.54* 0.49* 0.57* 0.59* 0.60*
I&F 3.69 0.56 0.54 * 0.61 * 0.67* 0.57* 0.56* 0.54* 0.54* 0.58*
BM 3.67 0.61 0.42* 0.36 * 0.53* 0.62* 0.62* 0.59* 0.56* 0.60* 0.58*
CI 3.74 0.59 0.41* 0.46 * 0.47 * 0.57* 0.57 * 0.56* 0.60* 0.61* 0.58* 0.55*
HRMO 3.90 0.55 0.52* 0.70* 0.72* 0.68* 0.54* 0.46* 0.76* 0.60* 0.42* 0.44* 0.55*
OO 3.76 0.52 0.46* 0.66* 0.65* 0.57* 0.60* 0.67* 0.70* 0.57* 0.50* 0.60* 0.58*
Notes: n = 324; *Correlation is significant at p, 0.01 level (2-tailed)
Table II. Correlations of TQM/HRM practices and HPWS
The correlation matrix in Table II further indicates that TQM/HRM practices were positively, moderately and lowcorrelated with HPWS. There was a significant positive relationship between HRM and HRM outcomes (r = 0.76, n = 324, p,0:01), organization culture and HRM outcomes(r = 0.72, n = 324, p, 0:01), employee empowerment and HRM outcomes(r
= 0.70, n = 324, p, 0:01), communication and HRM outcomes (r = 0.68, n = 324, p, 0:01) and quality of work life andHRM outcomes (r = 0.60, n = 324, p, 0:01). The positively moderate correlation was for continuous improvement andHRM outcome (r = 0.55, n = 324, p, 0:01), customer focus and HRM outcome (r = 0.54, n = 324, p, 0:01) and between topmanagement leadership and HRM outcome (r = 0.52, n = 324, p, 0:01). The weakest correlation was for process qualityimprovement and HRM outcome (r = 0.46, n = 324, p, 0:01), benchmarking and HRM outcome (r = 0.44, n = 324, p, 0:01)and between infrastructure and facilities and HRM outcomes (r = 0.42, n = 324, p, 0:01).
While when we consider the correlations between TQM/HRM practices and operative outcomes (indicated intable 2) we find that there is a significant positive relationship between process quality improvement and operativeoutcome (r = 0.67, n = 324, p, 0:01), benchmarking and operative outcome (r = 0.60, n = 324, p, 0:01), continuousimprovement and operative outcome (r = 0.58, n = 324, p, 0:01) and customer focus and operative outcome (r =0.60, n = 324, p, 0:01) also along with the HRM and operative outcome (r = 0.70, n = 324, p, 0:01)organizationculture and operative outcomes(r = 0.66, n = 324, p, 0:01), employee empowerment and operative outcomes(r =0.65, n = 324, p, 0:01), communication and operative outcomes (r = 0.57, n = 324, p, 0:01). The positively moderaterelationship was found between top management leadership and operative outcome (r = 0.46, n = 324, p, 0:01), andbetween infrastructure and facilities and operative outcomes (r = 0.50, n = 324, p, 0:01).
The correlation coefficients between the independent variables (i.e. TQM/HRM practices) and the dependent variable (i.e.HRM outcomes and operative outcomes) were less than 0.9, indicating that the data was not affected by a collinearity problem(Hair et al., 1998). These correlations are also further evidence of validity and reliability of measurement scales used in thisresearch (Barclay et al., 1995; Hair et al., 1998). The results indicate that the most important TQM/ HRM practice affecting HRMoutcomes were HRM and employee empowerment (i.e. with the highest scores of correlation), which proves that HRM andempowerment were perceived as a dominant TQM/HRM practices, which improves HRM outcomes. But when we consideroperative outcomes other practices, as process quality improvement is also very important.
VI.DISCUSSION
The overall objective of this study was to investigate the relationship between TQM/HRM practices andHPWS within software industry. The results of this study revealed that the TQM/HRM practices could becategorized into three categories:
6

International Journal of Enterprise and Innovation Management Studies (IJEIMS) Vol. 1 No. 1
1. High Involvement TQM/HRM practices: e.g. HRM, empowerment, quality of work life, communicationand organization culture with highest mean and correlation coefficient.
2. Moderate involvement TQM/HRM practices: e.g. continuous improvement, customer focus and topmanagement leadership with moderate mean and correlation coefficient.
3. Low involvement TQM/HRM practices: e.g. benchmarking, infrastructure and facilities and process qualitymanagement with weakest mean and correlation coefficient.
In the contemporary HRM-business performance literature, high involvement work practices are typicallymeasured by indexes that incorporate, or assign points to the extent of team-based work and/or other employeeparticipation arrangements, employee training and development, formal performance management systems, variablepay, business information sharing with employees, targeted or selective recruitment and hiring, and certain otherpractices. Those entities –companies, service work groups -with high index scores can be said to practice what mightbe called “high high involvement” HRM; those entities with midlevel index scores can be said to practice whatmight be called “average high involvement” HRM; and those entities with low index scores can be said to practicewhat might be called “low high involvement” HRM. (lewin 2004).
The results show that there is a strong relationship between high involvement TQM/HRM practices and HRMoutcomes. This provides the evidence to lewin and other researchers who states that high involvement practices arerequired for HPWS and leads to business excellence.
In contrast, there was a weak relationship between low involvement practices and HRM outcomes. Lowinvolvement practices were found to have insignificant contributions towards HRM outcomes.
But, there is a significant and strong relationship is found between low involvement practices and operative outcomes. The
result supports the findings from lewin (2004), in which he found there is a significant relationship between the low involvement
practices and business performance which is the called as ‘dual theory of business performance’. (lewin 2004).
The dual theory of business performance states that “high involvement” type HRM (HIHRM) practices has significantpositive effects on such business performance measures as market value, rate of return on capital employed, revenue growth,
revenue per employee, productivity, product/service quality, and even organizational survival (see Lewin, 2004). That HIHRM
practices “leverage” business performance appears to be well known to human resource (HR) executives.
HIHRM practices, however, constitute only one way of managing human resources to leverage business performance.
Another way to achieve more business performance is by managing human resources by expense control. Consequently, certain
“low involvement” HRM (LIHRM) practices may best fit some organizations and employees. Taken together, HIHRM and
LIHRM practices form the building blocks for a dual theory of HRM and business performance (lewin 2004).
VII.PROPOSEDMODEL
On the basis of the findings from the study and lewin’s dual theory we propose a model for HPWS.
TQM/HRM PracticesHigh
Motivational HRM outcomes
1. Ttop management leadership path Job satisfactionInvolvement2. Organization culture work Commitment3. Customer focus processes Trust4. Process Quality Management
C o g n i t i v e p a t h
Loyalty5. Human Resource Management Attitude & morale6. Quality of work life7. Continuous Improvement
Operative outcomes8. Employee Empowerment9. Benchmarking Low Cost effectiveness10. Communication Involvement Return on quality11. Risk management work
CognitiveProduct quality
12. Infrastructure and facilities processes Turnoverpath
Figure 3. High Performance Work System
7

International Journal of Enterprise and Innovation Management Studies (IJEIMS) Vol. 1 No. 1
Figure 3 linked TQM/HRM practices to involvement processes and thence to worker psychological states, whichleads to HR outcomes and measures of organisational effectiveness i.e. operative outcome. It proposes two paths: acognitive path in which high-involvement processes take ‘greater advantage of the skills and abilities’ employees possessand a motivational path in which involvement processes increase HR outcomes (satisfaction, commitment etc.). Thisparallels Batt’s (2002) identification of a ‘direct’ path (enhancing employee skill levels and firm-specific knowledge)(Boxall and Macky 2009) and an ‘indirect’ path (enhancing employee motivation and satisfaction, and lowering quitrates). The direct path, which includes low involvement processes, is important for enabling workers (individually andcollectively) to solve work problems more effectively, and that leads to better operative outcome of the companies, and theindirect path is important to ensuring they want to do so and continue to take responsibility for doing so...
In other words, high-involvement work processes empower workers and positively affect job satisfaction,trust, commitment and employee loyalty. It also reduces the employee turnover and absenteeism. While lowinvolvement work practices are related to motivational path only and give the cost advantages and enhanceknowledge and employee abilities, motivations and opportunities to contribute. Improvements in knowledgeenhance ability, while empowerment and information enhance the opportunity to contribute.
The kind of framework shown in Figure 3 takes us in a simple but important way beyond the counting of HRpractices. It means that we are not restricted to understanding TQM only through certain specific practices. Itmeasures each process dimension in relation to the HRM framework. Such a procedure measures the systemicimpact of these processes on employee attitudes and organisational effectiveness. It is found that high-involvementprocesses do act positively through both (indirect) motivational and (direct) cognitive paths. Company performanceis higher (measured by higher ROE and lower employee turnover), as is employee morale. It ensures that processesas experienced by employees are measured in the space between management.
A sustainable high involvement work practices also benefit firms or economically rational managers will shutdown operations or relocate operations. Because, the value to firms is best demonstrated by the benefits and costs atthe point of production (i.e. operational outcomes of an actual production process) and the proposed model measuresthe cost involved, ROE and other operative outcomes. So, the proposed model also measure that processes, whichare beneficial, form the employer side.
VIII.CONCLUSIONS,IMPLICATIONSANDRESEARCHLIMITATIONS
Like others, we found the difficulties in specifying the independent variable in HPWSs. The term itself givesno clue about the pathway of the desired goal. The linkage of HPWS and high involvement employment practices(lewin 2004), are both more descriptive, more useful in identifying the main thrusts in a particular HR system.However, they are not equivalent. While higher involvement typically implies higher skill and is more rationallymanaged with high-involvement practices, but, the reverse is not always true.
The study of HIWSs has logical focus because it creates smarter working, to gain competitive advantage globalisedsoftware industries, are of vital interest to practitioners and policy makers in the developed economies. As the studies ofMacDuffie (1995) and Appelbaum et al. (2000) states that the competitive response requires change to work systems. Thisstudy provides a theoretical rationale for particular practices by accompanying quality framework.
Focusing our independent variable on high-involvement work and linking it with TQM/HRM improve ourtheoretical modeling and practical measurements and will help to progress the evaluation in this area. The HIWSs impliesthat there are possibilities for win–win outcomes in certain contexts but not without careful management of both types ofpractices. On the employee’s side, the high involvement practices provides motivation to them and leads to high HRoutcomes in the form of better job satisfaction and high moral and less turnover. But on the other side low involvementpractices required for the cost efficiency and better operative outcomes. However, the interaction between involvementand intensification is very critical. On the company’s side, the caution should be taken with overgeneralised claims ofeconomic benefits. This study will help us to know that when and how a high involvement system might perform, thushelping us with the contextual and causal questions that is the central to this line of research.
REFERENCES1. Ahmed, N. U. 2001. Incorporating environmental concerns into TQM. Production and Inventory Management
Journal 1: 25-29.2 Appelbaum, E., Bailey, T., Berg, P. and Kalleberg, A. (2000). Manufacturing Advantage: Why High-Performance
Work Systems Pay Off, Ithaca: ILR Press.
8

International Journal of Enterprise and Innovation Management Studies (IJEIMS) Vol. 1 No. 1
3. Arthur J.B. (1994) ‘Effects of Human Resource Systems on Manufacturing Performance and Turnover’,Academy of Management Journal, 3(37): 670-87.
4. Bahrami, H., and S. Evans. 1997. Human resource leadership in knowledge based entities: Shaping the context of
work. Human Resource Management 36: 23-28.5. Barclay, D., Higgins, C. and Thompson, R. (1995), “The partial least square (PLS) approach to causal modeling:
personal computer adoption and use as an illustration”, Technology Studies, Vol. 2 No. 2, pp. 285-309.
6. Batt, R. (2002). ‘Managing customer services: human resource practices, quit rates, and sales growth’. Academy of
Management Journal, 45: 587–597.7. Blackburn R. and Rosen B. (1993) ‘Total Quality and Human Resources Management: Lessons learned from Baldrige
Award winning companies’, Academy of Management Executive, 3(7): 43-65.
8. Boselie & Wiele, High Performance Work Systems: “Research on Research” and the Stability of Factors overTime, ERS-2002-44-ORG
9. Boxall and Macky (2009). Research and theory on high-performance work systems: progressing the highinvolvement stream, Human Resource Management Journal, Vol 19. no 1, pages 3-23
10. Boxall, P., Macky, K. and Rasmussen, E. (2003). ‘Labour turnover and retention in New Zealand: the causes andconsequences of leaving and staying with employers’. Asia Pacific Journal of Human Resources, 41: 195–214.
11. Cortada, J. W. 1995. TQM for information system management: Quality practices for continuous improvement.New York: McGraw-Hill.
12. Dale B.G. (1999) Managing Quality, 3rd edition, Blackwell Publishers, Oxford.
13. Delery, J.E. and Shaw, J.D. (forthcoming in 2002) ‘The Strategic Management of People in Work Organizations: review,synthesis, and extension’, Vol. 20, Research in Personnel and Human Resource Management, edited by Ferris.
14. Goyal, S. K., and M. Islam. 2001. Total quality management through activity-based costing and culturalsetting—A versatile tool. Industrial Engineering 30: 9-12.
15. Hair, J.F., Anderson, R.E., Tatham, R.L. and Black, W.C. (1998), Multivariate Data Analysis, Prentice-Hall, Englewood Cliffs, NJ.
16. Issac, Rajendran, and Anantharaman, Significance of Quality Certification: The Case of the Software Industryin India, QMJ VOL. 11, NO. 1, 2004, ASQ
17. Jalote, P. 2000. CMM in practice. Reading, Mass.: Addison- Wesley.
18. Lewin, D. (2004). HRM and Business Performance Research: Empiricism in Search of Theory. Paper presentedto the 62nd Annual Meeting of the Academy of Management, Denver, CO, 2002, revised.
19. Lewin, D. (2004). The Dual Theory of Human Resource Management and Business Performance: Lessons For HRExecutives, Prepared for Inclusion in The Future of HR: 50 Thought Leaders Call for Change, Edited by M. Losey,D. Ulrich, S. Meisinger and R. Narramore, New York: Wiley and SHRM, 2005
20. MacDuffie, J.P. (1995). ‘Human resource bundles and manufacturing performance: organizational logic and flexibleproduction systems in the world auto industry’. Industrial and Labor Relations Review, 48: 2, 197–221.
21. Nunnally, J.C. (1978), Psychometric Theory, 2nd ed., McGraw-Hill, New York, NY.
22. Ooi, and et.al., Does TQM influence employees’ job satisfaction? An empirical case analysis, InternationalJournal of Quality & Reliability Management, Vol. 24 No. 1, 2007, pp. 62-77
23. Paul, A. K., and R. N. Anantharaman. 2002. Business strategy, HRM practices and organizational performance: A
study of the Indian software industry. Journal of Transactional Management Development 7: 27-51.
24. Pfeffer J. (1994) Competitive Advantage Through People. Boston: Harvard Business School Press.
25. Puay S.H., Tan K.C., Xie M. and Goh T.N. (1998) ‘A comparative study of nine national quality awards’, TheTQM Magazine, 1(10): 30-9.
26. Radovilsky, Z. D., and J. W. Gotcher. 1996. Implementing total quality management: Statistical analysis of survey
results. International Journal of Quality and Reliability Management 12: 10-22.
27. Tenner, A. R. 1991. Quality management beyond manufacturing. Research Technology Management 34: 27-32.
28. Zinovy, D., J. Radovisky, W. Gotcher, and S. Slattsveen. 1996. Implementing total quality management-statistical analysis of survey results. International Journal of Quality and Reliability Management 13: 10-22.
9

International Journal of Enterprise and Innovation Management Studies (IJEIMS) Vol. 1 No. 1
EMPLOYER BRANDING FOR SUSTAINABLE GROWTH OFORGANISATIONS
1Dr. V.T.R VIJAYAKUMAR and 2Mrs. S. ASHA PARVIN1Professor and Head, Department of Management Studies, St.Xaviers College of Engineering & Technology
Chunkankadai, Nagercoil, KanyaKumari Dist.E-mail id: [email protected]
2Research Scholar, Mother Teresa Women’s University, Lecturer, MBA Department Sun College of Engineeringand Technology, Erachakulam (p.o) -629902, Nagercoil, KanyaKumari Dist. E-mail id: [email protected]
I.INTRODUCTION
The concept of branding for products and services is well known. Employer branding may be the least known typeof branding yet is becoming more important to organizations. The reason is changes in workforce demographics. Thebaby-boomers are retiring and the pool of new recruits is not sufficient to fill the gap. According to an Accenture survey,60% of CEOs are very concerned about attracting and retaining people. The concept of Employer Brand has gainedimportance since 1990"s or it is a result of Global manic competition but above all it has become a magnetic force, acatalyst , an accelerator and a prime factor which determines an organization success and future . Employer brand hasovershadowed and synchronized all other factors which had their individual importance like customers, relationship, PR,networking, 2- way communication etc and is now the sole prima factor or the turnkey of success.
In the present job markets, where companies compete for attracting the best of the talent, employer brand,sometimes, becomes more relevant when compared to various critical factors like job profile and the compensationpackage. Employer brand is the image of an organization as a great place to work in the minds of its currentemployees and key stakeholders. It is the development of such an organizational culture which fosters a sense ofbelongingness with the company and encourages the employees to share organization’s goals for success. In short, itis the value of the company in external marketplace. The goal of employer branding is to create loyal customers; thecustomers here being the employees.
From an HR point of view branding is very important. If your organization has a good brand image in the market, itwill help you in getting right workforce at right time and at the same time you will have a control over the employee cost.An organization with no brand name has to shell out lots of money to attract and retain the right candidate.
This paper begins by defining the concept of Employer Branding practices carried out by the organisations toattract talents which help them to move towards their vision in a successful style. Types of Employer Branding,Branding Strategy and the benefits received by the organisation by adoption of the concept of Employer Branding inIndian context are then discussed.
II.CONCEPTUALANALYSISOFEMPLOYERBRANDING
Brett Minchington (The Employer Brand Institute), defines employer branding as “the image of theorganization as a ‘great place to work’ in the minds of current employees and key stakeholders in the externalmarket (active and passive candidates, clients, customers and other key stakeholders).”1It is the ‘sum of a company’sefforts to communicate to existing and prospective staff that it is a desirable place to work’ (Lloyd 2002) 2.Increasingly, it is likely to also be used to create what has in the popular business press recently been referred to as‘employment brands’ building and sustaining employment propositions that are compelling and different. Themoniker ‘employer brand’ appears to have first been coined by Ambler and Barrow (1996)3, who defined it as ‘thepackage of functional, economic and psychological benefits provided by employment, and identified with theemploying company’. The authors go on to suggest that, just like a traditional brand, an employer brand has bothpersonality and positioning. Employment branding is therefore concerned with building an image in the minds of thepotential labour market that the company, above all others, is a ‘great place to work’ .According to human resourcesconsultants Hewitt Associates, there are four steps to developing a strong employer brand:
(i) understand your organisation,
(ii) create a ‘compelling brand promise’ for employees that mirrors the brand promise for customers,
10

International Journal of Enterprise and Innovation Management Studies (IJEIMS) Vol. 1 No. 1
(iii) develop standards to measure the fulfilment of the brand promise,
(iv) ‘ruthlessly align’ all people practices to support and reinforce the brand promise,
Moreover, it is posited that companies with strong employer brands can potentially reduce the cost ofemployee acquisition, improve employee relations, increase employee retention and even offer lower salaries forcomparable staff to firms with weaker employer brands (Ritson 2002)4. Collins (1995)5, confirming prior research,suggest that early recruitment activities are indirectly related to intentions and decisions through two dimensions ofemployer brand image: general attitudes towards the company and perceived job attributes. Examples of employerbrands, and indeed employer advertising, are becoming increasingly common.
Employer branding is the development and communication of an organization’s culture as an employer in themarketplace. It conveys organisations “value proposition” - the totality of organisations culture, systems, attitudes,and employee relationship along with encouraging organization’s people to embrace and share goals for success,productivity, and satisfaction both on personal and professional levels.
Employer branding is the essence of the employment experience, providing points that commence with initialemployer brand awareness, and continuing throughout the tenure of employment, even extending into retirement.Employer branding is a distinguishing and relevant opportunity for a company to differentiate itself from thecompetition creating its branded factors as its USP for employee satisfaction and happiness resulting in retention,productivity and efficiency6.
III.RISING IMPLICATIONOFEMPLOYERBRANDING
It is said that an unsatisfied customer tells ten people about his experience while an unsatisfied employee tells ahundred. Employer branding reflects the work culture in an organization. It has become more critical in today’s times, asmost professionals are looking at a stable career and establishing a long-term relationship with the company. Researchshows that employees of industrial brands feel a much greater sense of pride, attachment and trust towards their employer.They are also significantly more likely to recommend their company to others and claim it treats employees well. Throughright branding, the company can recruit the best talent and reinforce its positioning amongst its employees. It helps buildtrust and reliability. A good employer brand makes it easy to attract good talent and curb attrition. The strength of anorganization’s brand has a significant impact on the performance of its employees. Working with one of the largest ormost innovative companies in a specific industry acts as a motivator too.
But as one moves higher in his career, brand name becomes of little significance as job role takes over. Brandname is the most important factor but at entry level only. When one is a fresher and embarks on one’s career, thebrand of a company matters. It helps in reflecting a stronger resume. With career growth, one places importance onthings that are more meaningful to one’s sense of purpose. It is also being argued that in most cases, companies treatemployer branding as a mere short-cut for attracting the talent. Instead of self-analysis, the HR departments tie upwith ad agencies to conjure up an image that may be attractive to their target market, even if not their own. Whilesome argue that organizations like Google with strong employer brand hardly spend money in building the brand;instead they focus on living the brand. Sasken, for example, has a stated ‘People First’ policy to emphasize thatemployees are the focus. Fedex has a core philosophy of ‘people - service - profit’ to indicate what comes first. BillMarriott of Marriott Hotels does not tire of repeating the founder’s belief “Take care of the associates, and they’lltake good care of the guests, and the guests will come back.” These organizations reveal a high degree of trust in themanagement of the organization. Managements must understand that the core value offering of the organization is toengage employees towards being productive and responsive to customers. In the end, it is believed that if thecompany takes care of people, people will take care of the company. 7
IV.SURVEYRESULTS
An exclusive survey of 1,889 Personnel Today readers with responsibility for recruitment reveals that 95% ofrespondents believe employer branding is ‘important’ (Fig. A)8.
11

International Journal of Enterprise and Innovation Management Studies (IJEIMS) Vol. 1 No. 1
Fig.
V.BRANDING STRATEGY
A) Nature of BusinessBranding should be based on the nature of business. Like if an IT company goes for a fashion show, it may not
yield the same results as it would have got by going to IT Fair or something similar. A real estate company may gofor some road show on property market.
B) Nature of MarketIt is always recommended to gauge the market before going for any project which involves market risk. Like
if targeting to explore a financial market or banking and at the same time it is marred by some other factors likeInflation, you need to design your strategy which could help you in overcoming the negative trend.
C) Reception TargetIt’s always good to define the reception target or the audiences. The audiences under employer branding are
the internal customers of the organisation. The attempt of employer branding boosts up the morale of the employeesand thereby keep the employees feel satisfied.
D) Long Term Mission of OrganizationAlso the long term as well as short term goals of the organization should be kept in mind. If the organization
does not have any long term goals in the target market or location, it’s always recommendable not to go for brandingor it is very much required go for a small, low budgeted branding event.
E) Organizational StructureOrganizational structure is also very vital part for deciding any strategy. Organizational structure is the
strength of any organization and any event or branding can be done based on that. Like if the organization does nothave lots of hierarchy steps, it can boast of Flatness and claim of equal behavior. And if it has different layers, it canmarket the clear definition of roles etc.
VI.EXTERNALBRANDING
External branding refers to branding which is done by using external sources and which may (or may not)require some investment in monetary or other forms. The different means of doing external branding are;(a) Use of Job Sites – As HR the first thing which comes to the mind is recruitment, so Job sites also offer good
branding opportunities through different means like Pop ups, pop ins etc. It’s always better to go for pop ins asmost of web browsers come with pop-up blockers.
12

International Journal of Enterprise and Innovation Management Studies (IJEIMS) Vol. 1 No. 1
(b) Banners – Banners are also a good mean for branding. Banners can be of both types’ means Online Banner andStreet banners. By Online banner, your organization name will be flashed on different web pages as per yourchoice and price. Street banners are good for bigger requirements.
(c) Road Shows – Road shows are also an important mean for creating brand awareness. Corporate can organizetalks, presentations, seminars etc. for attracting people towards your organization.
(d) Corporate Social Responsibility – Corporate social responsibility refers to corporate getting associated withsociety for some noble cause. The association can be in any mode either getting associated with a CharitableTrust or a NGO or some other public venture. Corporate can align and attach with any of these and share thestage. Always keep in mind that choose as per organization status meaning if its a small firm, do associate witha medium sized organization and if medium it can align with either of these- large or medium. Idea should beget a nice coverage in the popularity cake.
(e) Public Events – Public events are one of the major ways of creating a brand image. An organization can participate
in any of the public event and assuring that it does not get disappeared in the crowd of many brands or big names.
(f) Newspapers – Branding can be done through newspapers as well. If you target the local public, you can go foradvertisements considering the individual day circulation, target readers, rapport of newspaper, type ofnewspaper etc. If you target only to employ people for your workforce requirement, you can place job Adswhich may seem expensive at the first glance but in terms of attracting the correct workforce, it can do magic.
(g) Email – For mail ids related to job portals, you can create an auto reply which can contain brief description ofthe key aspects of candidate’s and public interest and at the same time introducing your company to the public.It should be informative as well as crispy so that the audience reads it and just doesn’t do Shift Delete.
(h) Tagline – Create a nice, attractive tagline or a punch line for your brand and give it a significant visibility in allyour branding efforts. The tag line should be in accordance with the organization values, goals, work etc. so thatit reflects an overall image of the brand everywhere.
(i) Align with celebrity – Aligning with a celebrity is also a good way of creating a brand image. But this maycost big bucks and ultimately increasing your cost dramatically. This is an expensive method of branding.
VII.INTERNALBRANDING
Internal Branding is comparatively a cheaper way of branding. Organisation can use its internal organizationalstaff for this purpose.(a) Front Office – Always pay attention to your front office because first impression is last impression. It should be kept
neat and clean with a pleasant receptionist who always maintains freshness and welcomes the guests with courtesy.
(b) Stays Interview - HR can always conduct stay interviews in which they can interact with the employee and askthem regarding their career prospects, there alignment with the company, there feedback regarding theirconcerned departments, etc. These feedbacks can be analyzed and used for different purposes by which you cancreate an internal brand image of the country.
(c) Exit Interview – An exit always carries a fair chance of initiating the chain reaction among the employees soalways be very careful in analyzing the exiting reasons so that you can overcome the justified ones in the future.
(d) Employee Satisfaction – Employee satisfaction is always very important for any organization to grow. Asatisfied employee is a productive employee. If your employee is satisfied, you can relax because they willcreate a good and positive rapport for the company in the market outside.
(e) Policy Information – Always design your policies very strategically. A policy should be designed in such away that it holds good even after a long period of time. A frequent internal policy change sends a message to theouter world that the company is not consistent and knowledgeable and reliable.
(f) Customer Orientation – Customers are always the most important factors. Always keep your workforcemotivated towards delivery of customer oriented services. Customers can be of either type, internal or external.
(g) Employee Participation –Ensure the maximum participation from the employee side, either in terms ofinternal events participation or external events.
(h) Trained Employees – Always ensure proper training of employees before they are engaged in work. Thetraining should be in all the aspects like policies, vision, mission, organization. This will project a good pictureof organization on the new employee 9.
13

International Journal of Enterprise and Innovation Management Studies (IJEIMS) Vol. 1 No. 1
VIII.EMPLOYERBRANDINGININDIA
“The Employer Branding—A Strategic Tool to Attract, Recruit and Retain Talent” highlights that HR uses the employerbrand for three main reasons: 1) organizational culture and employee fit; 2) positive outcomes for recruiting; and 3) retainingtalent with corporate values and a team-based culture. At its most effective, the employer brand is a long-term strategy with atransparent message that promotes the organization as an employer of choice. The increasing focus on competitive advantage isleading many firms to rethink their employer brand10. “India, Inc.”—a common term used in India to refer to India’s corporatesector—aims to positively build on opportunities as the world economy strengthens, and the employer brand is a prime exampleof a progressive HR practice in India. The fit between employer and employee is important for hiring compatibility. Yet, researchshows that Indian companies do not always intentionally develop employer branding interventions. “Infosys, Wipro and TCS didnot intentionally build their brands; rather, they focused on building a productive workplace, resulting in happy employees, andtheir brands were the result of that foundation,” “For other organizations in India, such as RMSI and Google, which already havestrong employer brands, their goal is to ‘live’ the brand.” As Indian firms focus on strategies of turnaround, diversification,expansion and internationalization, human resources and human capital performance in India have become increasinglyimportant. Consequently, HR’s role in effectively using the employer brand has tremendously expanded and grown inimportance.Employer branding becomes a tokenism when it doesn’t fit in the DNA of the company. And, there needs to be a lotof self-sustained and conscious effort needed to create such a fit; to ‘become oneself’. The Tatas would never like to become likeReliance, or vice-versa. The brand as an employer must provide a long-term advantage. And this advantage comes only when theprofile of the candidate fits well with the profile of the company. Also, one must also appreciate that employer branding worksmainly at the entry-level since the middle level workforce and upwards look at other things, such as job profile, careerenhancement et al11.
IX.OUTCOMEOFEFFECTIVEEMPLOYERBRANDING
Employer branding gives an organization a competitive advantage. Employer branding is a tool to attract, hire, andretain the “right fit it also has an impact on shareholder value, creating positive human capital practices, contribute tobottom-line. Strong employer brands have employer value propositions (EVP’s) which are communicated in companyactions and behaviors and evoke both emotive (e.g. I feel good about working here) and tangible benefits (thisorganization cares about my career development) for current and prospective employees. These organizations segment andcommunicate EVP’s which reflect the image that the organizations want to portray to its target audience. Employer ValueProposition (EVP) is a set of associations and offerings provided by an organisation in return for the skills, capabilities andexperiences an employee brings to the organisation. A company’s employer brand is reflected in the actions and behaviorsof leaders and is affected by company policies, procedures, and practices and the same when well planned andimplemented results in profitability of organizations. Thus to retain talents inside the organisation not only during the blissof the organisation but also in its tough times employer branding strategy plays a vital role.
X.CONCLUSION
Thus it can be concluded that not only there is a need of creating a satisfaction in minds of employees (Internalcustomers) but there is an urgent need of creating this positivism in the minds of external customers andstakeholders. The created image has to be monitored and sustain in such a way so that it will help in increasingprofits as well as would create belongingness, pride, self actualization and true commitment in true words and spirit.
REFERENCES1. Minchington.B (2010) “Employer Brand Leadership- a Global Perspective, Collective Learning Australia.
2. Lloyd. S, (2002) ,”Branding from the inside out’, Business Review weekly,Vol 24 No 10, pp 64-66
3. Ambler T and Barrows (1996), “The Employer Brand– Attract, Engage , Retain, Collective Learning Australia
4. Ritson (2002), “ Employer Branding and Retention” ,www.mbs.edu5. Collins, J 1995), Built to Last, Random House, UK
6. Vijit Chaturvedi, “Employer Branding: A Ripple effect for organizational effectiveness”, www. indianmba.com7. www.naukrihub.com
8. www.personneltoday.com
9. Rohit Minton, “ Employer Branding – A New HR Arena”, www.contentwriter.in10. Minchington.B(2006), Your Employer Brand – Attract, Engage, Retain, collective Learning Australia
11. Madhukar Shukla, Employer Branding is tokenism in India, www.economictimes/indiatimes.com
14

International Journal of Enterprise and Innovation Management Studies (IJEIMS) Vol. 1 No. 1
DIVIDEND ANNOUNCEMENT IMPACT ON INDIAN BOURSES
1S. SARAVANAKUMAR and 2Dr. A. MAHADEVAN1Research Scholar & Assistant Professor, Department of Management Studies, JKK Nataraja College of Engineeringand Technology, Komarapalayam, Namakkal-638183, Tamilnadu, India. E-Mail : [email protected]
2Assistant Professor & Head, Department of Management studies,Excel Business School, Komarapalayam, Namakkal-637303, Tamilnadu, India.
ABSRACT
Investors have experienced superior gains from stock markets all around the world during the past one decade.Investors have two ways to make profits with stocks: capital appreciation and annual income in the form ofdividend. Capital appreciation is possible in bullish trend. But in bearish market, the capital appreciation is notpossible; the other way to gain profit is dividend. Investors assumed to consider dividend is more importantsource when there is no capital appreciation in stocks. Using an event study methodology we find that despite ofinvestors do not gain significant value in the period preceding as well as on the dividend announcement day, yetthey can gain value in the post announcement period. Investors do shift their security positions at the time ofdividend announcement, which indicate that in post announcement period there is a possibility of informationcontent in dividend announcement in NSE. The dividend announcement conveys information to market traders;one would expect the impact of event on the market’s valuation of the company’s share. It depends on themagnitude of the unexpected component of the dividends. The present study attempts to contribute positively tothe understanding of the behavior of Indian stock prices in relations to dividend announcement
Keywords : Dividend, Investors, Market, NSE
1.INTRODUCTION
Investors have experienced superior gains from stock markets all around the world during the past one decade.Investors have two ways to make profits with stocks: capital appreciation and annual income in the form of dividend.Capital appreciation is possible in bullish trend. But in bearish market, the capital appreciation is not possible; the otherway to gain profit is dividend. Investors assumed to consider dividend is more important source when there is no capitalappreciation in stocks. The present study attempts to contribute positively to the understanding of the behavior of Indianshare prices in relation to the dividend announcements. This study analyzes the impact of dividend announcement in theIndian stock market. The dividend is the cost of equity capital to equity shareholders/investors in the market place. Theannouncement has an impact on the market price of the shares; the market will react positively, if the dividend is upto theexpectation level of the equity investors. At the same time if the dividend announcement is not the expectation level of theshareholders, the market reaction will in bear trend for that particular scrip.
2.STATEMENTOFTHEPROBLEM
This study investigates the stock market reaction to cash dividend announcements for the period from January-2009to December-2009. In particular, this paper examines the stock price response to company announcements about dividendto shareholders. As a matter of fact dividend announcements usually are considered as the positive signal to theshareholders and its positive impact on the share prices is also expected. Using an event study methodology we find thatdespite of investors do not gain significant value in the period preceding as well as on the dividend announcement day, yetthey can gain value in the post announcement period. Investors do shift their security positions at the time of dividendannouncement, which indicate that in post announcement period there is a possibility of information content in dividendannouncement in NSE. In a country like India where the economy is emerging, the issue is still unresolved and there is adiverse substantiation over the matter which has encouraged us to examine the impact of dividend announcement overshare price, which may carry valuable information to the investors, researchers and policy makers.
3.NEEDFORTHESTUDY
Perhaps no other area of finance has been subject to so much empirical investigation during the last four decades asthe behavior of stock prices. Interestingly enough, the early empirical work was used to develop a theory, to be specific,the Efficient Market Hypothesis – rather than the normal procedure of first developing a theory and then its empiricaltesting. The empirical work on market efficiency is dividend into three categories: (1) Weak-form tests – test forpredictability of future returns on the basis of past returns, (2) Semi-strong form tests – test for stock price adjustment
15

International Journal of Enterprise and Innovation Management Studies (IJEIMS) Vol. 1 No. 1
to publicly available information, and (3) Strong form tests – test for the extent to which stock prices reflectunpublished information. Though a large part of the international finance journals during the past several years hasbeen devoted to examining the behavior of stock prices in relation to all the conceivable publicly available price-sensitive information, no noteworthy research has been undertaken for the Indian Capital Market.
The price of a share may be said to depend upon the future earnings and dividend stream of a company. Theinformation concerning a specific company may affect only that particular company’s share. The dividendannouncement conveys information to market traders; one would expect the impact of event on the market’svaluation of the company’s share. It depends on the magnitude of the unexpected component of the dividends. Thepresent study attempts to contribute positively to the understanding of the behavior of Indian stock prices in relationsto dividend announcement and market movement.
4.OBJECTIVESOFTHESTUDY
The main purpose of the study is
* To examine the behavior of stock prices around and on the date of dividend announcement.
* To investigate if any strategies found in dividend announcement could be used to outperform the market.
* To find the correct path of future trends based on the announcement effect.
In this context, the behavior of stock prices has been examined in the prior and post announcement periods inrelations to the unexpected dividend announcement.
5.RESEARCHMETHODOLOGY
5.1.SAMPLEANDDATAThe present study covers a period of one calendar year from January 2009 to December 2009 and the results
are based on a sample of Nifty stocks, listed in the National Stock Exchange. The data set contains daily data fromthe different sectors of 10 dividend paying stocks over the 10 window period i.e. -4 day to +4 day relative to thedividend announcement, which is listed on the National Stock Exchange for the period of January 2009 to December2009. Three basic time series data have been employed in this study. These are, dividend announcement dates forthe whole sample period, daily closing stock prices for the period [-4, to +4] around each dividend announcementday of every stock, prices of the NSE Nifty Index in the [-4, to +4] time window for each dividend announcementday of every stock and number of shares traded each day for each company in the sample period.
5.2.SELECTIONOFSAMPLEThe selection of sample has primarily been guided by two factors, availability of dividend announcement for
the sample period, and the time to time revision and replacement of stock in the NSE Nifty. Often some existingstocks were replaced by new stocks in the Nifty index. This is also considered in the present study.
5.3.TOOLSANDTESTINGPROCEDUREThe most widely event study methodology is used in order to determine the stock price behavior of the
company as a result of announcement of dividend. The event study methodology has been adopted to analyze themass data. The supporting statistical tools can be used for simplification and application of the data analysis. Eventstudy is followed for testing the market efficiency. At the outset it is useful to discuss the structure of an event study.The initial task of conducting an event study is to define the event of interest and identify the period over which thesecurity prices of the firms involved in this event will be examined – the event window. For example, if one islooking at the information content of dividend with daily data, the event will be the dividend announcement and theevent window will include one day of the announcement. It is customary to define the event window to be largerthan the specific period of interest. This permits examination of periods surrounding the event. Hence for this study,return on four days prior to the event day and four days return after the event day are considered for analysis. Here,the abnormal returns can be used to draw conclusion during the study period. Abnormal return means the excess ofsecurity return over the index return on a particular date. The abnormal returns will be calculated for the entireperiod. In addition to that to test the market efficiency the time series analysis and necessary statistical tools applied.
Event studies examine the behavior of firm’s stock price around corporate or economic events such as dividendannouncements. The event study has many applications. In accounting and finance research, event studies have been
16
International Journal of Enterprise and Innovation Management Studies (IJEIMS) Vol. 1 No. 1
applied to a variety of firm specific and economy wide events. Some examples include mergers and acquisitions, earnings
announcements, issues of new debt, or equity and announcements of dividends which is the case in this paper.
5.4.METHODOLOGYOFEVENTSTUDIESThe methodology of event studies is fairly standard and proceeds as follows:
1. Collect a sample of firms that had a surprise announcement (the event)What causes prices to change in an announcement that is a surprise to investors? For many studies, such as an
announcement of a merger, announcement of bonus shares or dividends, any announcement can be treated as asurprise. For other studies, such as the impact of dividend announcements, it is more complicated. For those studies,it is necessary to define a surprise. This is normally done by comparing announcements to what was expected asreflected in the average estimate of professional analysts. A number of services provide these data. To form asample or surprises one first separates out a group of firms where the announcement is significantly different fromwhat is being forecast. Since positive and negative surprises would affect price differently, this group is furtherseparated into two groups, one for positive and one for negative earnings surprises.
2. Determine the precise day of the announcement and designate this day as zeroMost current studies use daily day, but in early days monthly data adopted. The use of monthly data made
measurement much more difficult because there are many surprises in a month besides the announcement effectbeing studied. Thus, for measuring market efficiency, it is important to measure the impact of the announcementusing the smallest feasible intervals. A number of recent studies have used intraday data.
3. Define the period to be studiedThe present study, we studied 9 days around the event, the we would designate -4, -3,…., -1 as the 4 days prior to
the event, 0 as the event day, and +1, +2,…., +4 as the 4 days after the event.
4. Computation of the return on each of the days being studied for all stockIn this study 9 days (4 days before the event plus the event day, plus 4 days after the event) returns are
calculated from 10 days prices along with the benchmark index values are also collected.
5. Computation of abnormal return for each of the days being studiedAbnormal return is actual return less the expected return/ market return. Different authors use different models
for expected return. In this study we used the return on the benchmark index as the expected return.
6. Examination and discussion of the resultsHaving performed the analysis the abnormal returns are examined and conclusions drawn.
5.5.EVENTSTUDIESINSEMI-STRONGFORMAccording to the semi-strong form of the market, the security prices reflect all publicly available information within
the purview of the efficient market hypothesis. In this state, the market reflects even those forms of information whichmay be concerning with the announcement of a firm’s most recent dividend forecast and adjustments which will havetaken place in the prices of security. The investors in the semi-strong form of the market will find it to earn return on theportfolios which is based on the publicly available information in excess of the return which may be said to becommensurate with the risk. Many empirical studies have been made to test the semi-strong form of the Efficient MarketHypothesis. In the semi-strong form market, any new announcement would bring reaction immediately to the company.This reaction could be even prior to the announcement in the market. This reaction prior to or immediately after theannouncement would be caused by the additional information which is not anticipated by the stock exchange participants.This information also would not be disclosed to the market participants. But the semi-strong form of the efficient markethypothesis would immediately indicate a change in the price of the securities but the price would be adjusted immediatelyby the market participants and in this way, the participants remove any possibility for abnormal returns in the future.
6.LITERATUREREVIEW
Semi-strong form of EMH was empirically tested in 1969, by Fama, Fiscer, Jensen and Roll. “They considered thebehavior of abnormal security returns at the announcement of stock split”. In a stock market a stock splits generallyindicates increased dividends payouts. Stock split announcement contain economic information. The average cumulativeabnormal security return for thirty months upto the month of announcement was in excess of 30%. This shown that the
17

International Journal of Enterprise and Innovation Management Studies (IJEIMS) Vol. 1 No. 1
return was far above the normal rate of return which was achieved by the method of buying and holding a portfoliofor a long-term investment of similar risky securities. The behavior of the security prices in the market after the splitannouncement should exactly the predictions of the EMH. After the public announcement the investors couldachieve in abnormal returns n the basis of the information of stock split. The average cumulative abnormal returnwhich was going higher and increasing just before the announcement stopped increasing or decreasing in anysignificant manner in the following period after the split announcement was made.
In 1972, Scholes conducted a study to observe, “The reaction of security prices to the offer of secondary stockissues”. The research study showed that the price of security decreases when the issuer belongs to a company whichindicated to the market that such an offer contained some bad news. But secondary, offering by investor, banks andinsurance companies were not viewed in a negative manner and the security prices did not significantly fall. Pricechange which was associated with the secondary offering occurred usually within six days of issue and showed thatthese changes were more or less permanent. The price behavior of secondary issues lent support with the market justto a new price of information in an unbiased manner and almost immediately.
Kraus and Stoll also conducted a research study in the same year as Scholes to examine, “the effect of large blocktraders on the behavior of security prices”. According to them, the study showed that there was a temporary effect, onshare prices which were associated with the block trade. The traders which were known to effect large transactions wereshown by a decrease in price but the price rose almost immediately and was totally reactionary by the end of the day. Butthe price did not return to the previous position because the market had received information which was negative to theimage of the security. There was also no price behavior which could be predicted after the day on which the block tradeoccurred. This was constant with the semi-strong form of the EMH. Pettit and Watts examined the market reaction whenan announcement was made about changes in dividends. They found that there was no evidence that the firms dividendannouncement. Wauds further made an examination relating to the size and the direction of changes in the Federal Reservediscount rate. The price change on the date of announcement was significant and the manner in which it could bepredicted. But after the event three days there was no indication of price change.
Another study conducted by Beaver which looked into the information with the announcements of annualearnings and the speed of changes in security prices. He examined the levels of the trading volume and the size ofprice changes. According to him, the absolute values of price changes and levels of trading were significantly higherduring the announcement week. In the week of following the announcement week, it returned to pre-announcementlevels. The market announcement effect was also studied by Patz and Boatsman. Both of them examined thereaction of market counting principles and they boldly release of a memorandum which was concerned with the costcentre used by some oil companies for accumulating certain material cost. They found that there was no significantreaction in the market to announcement and it was consistent with the efficient market hypothesis that the marketsaw the changes in keeping with temporary announcement leaving no great economic impact. This was furthertested by Foster. He tested the preliminary estimates made by company officials and the market’s reaction to it. Healso found that the volume of trading increased in the week of announcement but went back to the pre-announcement level in the next week. All the above results indicate that price changes accompany with theannouncement but abnormal returns cannot be made after following the announcement.
7. CALCULATING AND ANALYSING OF ABNORMAL RETURNS
Using capital market data, an event study measures the impact of a specific event on the market. The usefulness ofsuch a study comes from the fact that given rationality in the market place, the effect of an event will be reflectedimmediately in security prices. Thus a measure of the event’s impact can constructed using security prices observed over arelatively short period. In this study, the problem of calculating and analyzing abnormal return is considered. Theabnormal return is calculated using actual return of a stock less the market return on the same day. This facilitates the useof abnormal returns around the event day in the analysis. The fashion of abnormal return for both positive growth andnegative growth firms are similar trend. The abnormal return occurs in the pre as well as in post-announcement period.That is, stock price reaction to the firm’s dividend is not instantaneous, which contradicts the efficient market hypothesis.
For analysis purpose, the companies are categorized into two type’s i.e. positive growth and negative growthcompanies. This can be concluded with previous year dividend or current year interim dividend. If the current yeardividend is higher than the previous dividend announcement is designated as positive growth and if lower than theprevious announcement is called as negative growth.
18

International Journal of Enterprise and Innovation Management Studies (IJEIMS) Vol. 1 No. 1
Source: www.nse-india.com
Almost Infosys return does not differ from the market return. The return behavior of this company prior to theevent day and after the event day is consistent with the market index. The price path on the event day also followedwith the market movement. The dividend announcement of the company doesn’t seem to have any influence in theprice. By this news, one can earn little amount of return but it doesn’t fulfill the transaction cost.
ABB
Source: www.nse-india.com
ABB return curve movement is almost same with the market movement, but at the same time it involved withheavy loss than that of the market index. There is no positive abnormal return found pre as well as postannouncement period. The above chart proves the scrip movement is parallel with the market movement.
19

International Journal of Enterprise and Innovation Management Studies (IJEIMS) Vol. 1 No. 1
BHEL
Source: www.nse-india.com
A little abnormal return is found in pre-announcement period but from the event day onwards scrip movementcorrelated with the market. There is no opportunity exists to earn superior return from the market. Thisannouncement cannot yield handsome returns to the market participants.
HEROHONDA
Source: www.nse-india.com
Almost the scrip movement is correlated with the market performance. A little abnormal return is foundduring the first four days after the announcement of dividend results. Thereafter market return is decreasedconsiderably along with scrip return. On the event day, market and the company share price is also ended with red.
20

International Journal of Enterprise and Innovation Management Studies (IJEIMS) Vol. 1 No. 1
ICICI
Source: www.nse-india.com
It is clear from the above chart, scrip and market movement were almost same prior to the announcement ofdividends. After the result announcement, scrip generated a little return to the market traders. But at the same timethere was no return found during the day of dividend announcement. It is hard to believe that abnormal return foundbecause of announcement or any other surprise news of the company.
GA Cement
Source: www.nse-india.com
It is evident from the above chart; the scrip started giving abnormal return prior one day to the dividendannouncement to two days after the announcement. Based on this dividend announcement, one could not earnsuperior returns from the market. Almost all the curve movements are same pattern.
21

International Journal of Enterprise and Innovation Management Studies (IJEIMS) Vol. 1 No. 1
ONGG
Source: www.nse-india.com
The return behavior of this company is correlated with the index return in pre-event period and also in the postevent period. There is no chance to earn abnormal return, by taking this announcement. Hence the announcement ofdividends doesn’t have any impact on the price of the script.
SBI
Source: www.nse-india.com
This company’s return does not differ from that of the market return. The return behavior of the company,prior to the event day and after the event day is consistent with the market return. The big dividend announcement ofthe company does not have any influence on the price of the share.
22

International Journal of Enterprise and Innovation Management Studies (IJEIMS) Vol. 1 No. 1
TATAPOWER
Source: www.nse-india.com
The above chart reveals, there is no correlation between the scrip movement and index movement. But duringthe event day market and scrip movement coincides diminutive. Based on this news drift, it is difficult to earnabnormal return, which is also clear from the above chart.
WIPRO
Source: www.nse-india.com
From the above chart, prior to the event day company return is correlated with the market return. The sametrend continued even after the event day. Opportunity exists in both the periods to earn abnormal return. Hence theannouncement of result does not have any impact in the market.
8.SUMMARYANDCONCLUSION
The findings of the present study basically highlight as to how the market evaluates equity returns. It is simply nottrue, that dividend announcement data can provide a profitable guide to investment timing or improve a portfolio’s rate ofreturn. Information is reflected in stock prices so rapidly that published data tells the investor virtually nothing about thefuture change in stock prices. Not only do stock returns reflect the firm’s dividend data when published but they also
23
International Journal of Enterprise and Innovation Management Studies (IJEIMS) Vol. 1 No. 1
anticipate future dividend growth to some extent. The growth factor is taken in terms of percentage which increaseprofit over the previous year performance, was supposed to be an important performance indicator that is likely toaffect the stock returns.
The study was undertaken to find out whether the announcement of dividend result is having any influence onthe stock return. There are variety of factors that influence the movement of share price and hence the return. Theperformance of the company as disclosed by the dividend result is one among them. In this study it was testedwhether the announcement of result is having any influence in the company return. Normally a higher dividend thanthe previous year dividend should be welcomed by the market. This should be associated with greater return afterthe result is announced. All higher return after the announcement cannot say to be due to the dividend results. Tofind out the impact of results on returns, the impact of other factors in returns is to be segregated. The impact ofother factors in return is taken from the index which is nothing but the market return. The announcement of dividendis unique and specific to a company. To study its impact on the market place, the impact of other factors is removed,that is why the period is limited to 10 days and the return is calculated for 9 days.
From the stock return behavior of 10 companies studied, the return behavior of only one company does notmove with the market return. At the same time, the chance to earn abnormal return is found only in 3 companies.The announcement of results is said to have an impact only when there is an abnormal return after the announcementof dividend results. Then only an investor can formulate a trading strategy to outperform the market. In the absenceof abnormal return caused by the dividend announcement, no trading strategy will help an investor to outperform themarket.
Hence it can be concluded that the announcement of corporate dividend result does not have any impact on thestock return behavior of companies. By taking this announcement of dividend results, no one can outperform andthere is no strategy exists in the market. Also it is clear from the above analysis; it seems very difficult to find futurepath based on the announcement effects.
9.REFERENCES
1. Ball, R, “The Earnings and Dividends - Price Anomaly, Journal of Accounting and Economics”, 15, 1992, 319-345.
2. Ball, R. and E. Bartov, “How Naive is the Stock Market’s Use of Dividend Information?” Journal ofAccounting and Economics, 21, 1996, 319-337.
3. Ball, R. and P. Brown, “An Empirical Evaluation of Accounting Income Numbers”, Journal of AccountingResearch, 6(2),1968,159-178.
4. Bernard, V.L. and J.K. Thomas, “Post Earnings and Dividend Announcement Drift: Delayed Price Responseor Risk Premium?”, Journal of Accounting Research, 27, 1989, 1-48.
5. Brown, S.J. and J.B. Warner, “Measuring Security Price Performance”, Journal of Financial Economics, 8 (3),1980, 205-258.
6. Brown, S.J. and J.B. Warner, “Using Daily Stock Returns: The Case of Event Studies”, Journal of FinancialEconomics, 14,1985,3-31.
7. Chaturvedi, H.Om, “Empirical Anomalies Based on Unexpected Earnings: The Indian Experience”, ICFAIJournal of Applied Finance, 6 (1), 2000, 52-64.
8. Fama, E.F., L. Fisher, M.C. Jensen and R. Roll, “The Adjustment of Stock Prices to New Information”,International Economic Review, 10 (1), 1969, 1-21.
9. Fama, E.F, “Efficient Capital Markets II, Journal of Finance, 46 (5), 1991, 1575- 1617.
10. Foster, G., C. Olsen and T. Shevlin, “Earnings Releases, Anomalies, and the Behaviour of Security Returns”,Accounting Review, 59 (4), 1984, 574-603.
11. Fuller, R .J. and J.L. Farrell, Jr., Modern Investments and Security Analysis, 1987, McGraw Hill Book Co., Singapore.
12. Iqbal, “Efficiency of Indian Stock Market: A Study of Stock Price Responses to Earnings Announcements ofSelected Companies Listed on Bombay Stock Exchange”, Unpublished PhD Thesis Submitted to MangaloreUniversity, 2005.
24
International Journal of Enterprise and Innovation Management Studies (IJEIMS) Vol. 1 No. 1
13. Lo, A. W., and MacKinlay, A. C. (1988): “Stock market prices do not follow random walks: Evidence from asimple specification test”. Review of Financial Studies, vol. 1, no. 1, 41-66.
14. Lukose, J. and S.N. Rao, “Market Reaction to Stock Splits – An Empirical Study”, ICFAI Journal of AppliedFinance, 8 (2), 2002, 26-40.
15. Mallikarjunappa, T. and Iqbal, “Stock Price Reactions to Earnings Announcement”, Journal of IAMD andIUCBER, 26 (1), 2003, 53 – 60.
16. Manickaraj, N, “Information Content of Quarterly Earnings and Efficiency of Indian Capital Markets”,Proceedings of the International Conference, 2004 on Business and Finance, 2, 2004, 36-54.
17. Mohanty, P, “Who Gains in Share Buy Back?” ICFAI Journal of Applied Finance, 8 (6), 2002, 19-30.
18. Obaidullah, M, “Stock Price Adjustment to Half-Yearly Earnings Announcements – A Test of MarketEfficiency”, Chartered Accountant, 38, 1990, 922-924
19. Patell, J.M. and M.A Wolfson, “The Intra day Speed of Adjustment of Stock Prices to Earnings and DividendAnnouncements”, Journal of Financial Economics, 13, 1984, 223-252.
20. Rao, K.C., and M. Manickaraj, “Information Content of Financial Statements and Equity Stock Prices inIndia”, Finance India, 7 (2), 1993, 333-343.
21. Sharpe, W.F, “A Simplified Model for Portfolio Analysis”, Management Science, 9 (2), 1963, 277-293.
22. Srinivasan, R, “Security Prices Behaviour Associated with Rights Issue-Related Events”, ICFAI Journal ofApplied Finance, 3 (1), 1997, 50-62.
23. Watts, R.L, “Systematic Abnormal Returns After Quarterly Earnings Announcements”, Journal of FinancialEconomics, 6, 1978, 127-150.
25

International Journal of Enterprise and Innovation Management Studies (IJEIMS) Vol. 1 No. 1
BRAND EQUITY- THE RULER
Dr. S. RAMACHANDRANDirector –Management studies, Sri Sankara Arts & Science College, Enathur, Kancheepuram, TN, India. Email:
[email protected]/ [email protected]
ABSTRACT
Globally, the brand equity is given more significance by corporate. The article highlights the importance of brandequity and analyses the reasons behind the importance of brand equity in firms.
Keywords - Brand, Brand equity, Management and Corporate
Brand equity refers to the marketing outcome that accrue to a product with its brand name compared withthose that would accrue if the same product did not have the brand name. In other words, consumers’ knowledgeabout a brand makes manufacturers/advertisers respond differently or adopt appropriately adept measures for themarketing of the brand. The study of brand equity is gaining importance globally as some researchers haveconcluded that brands are one of the most valuable assets of the company. Brand equity is one of the main factorswhich can increase the financial value of a brand to the brand owner. Elements that can be included in the valuationof brand equity also includes: changing market share, profit margins, consumer recognition of logos and otherelements, brand associations made by consumers, consumers’ perceptions of quality and other relevant brand values.
There are many ways to measure a brand. The levels are listed below
; Firm Level
Firm level approaches measure the brand as a financial asset. In short, a calculation is made regarding howmuch the brand is worth as an intangible asset. For instance, if you were to take the value of the firm, as derived byits market capitalization - and then subtract tangible assets and “measurable” intangible assets- the residual would bethe brand equity.
Product Level
The classic product level brand measurement example is to compare the price of a unbranded or private labelproduct to an “equivalent” branded product. The difference in price, assuming all things equal, is due to the brand.More recently a revenue premium approach has been advocated.
Consumer Level
This approach seeks to map the mind of the consumer to find out what associations with the brand theconsumer has. This approach seeks to measure the brand awareness and brand image. Brands with high levels ofawareness and strong, favorable and unique associations are high equity brands.
A brand equity is the positive effect of the brand on the difference between the prices that the consumeraccepts to pay when the brand known compared to the value of the benefit received.
There are two schools of thought regarding the existence of negative brand equity. One school of thoughtstates brand equity cannot be negative, hypothesizing only positive brand equity is created by marketing activitiessuch as advertising, PR, and sales promotion. A second perspective is that negative equity can exist, due tocatastrophic events to the brand, such as a wide product recall or continued negative press attention. The term“negative brand equity” may be used to describe a product or service where a brand has a negligible effect on aproduct level when compared to a no-name or private label product. The brand-related negative intangible assets arecalled “brand liability”, compared with “brand equity”.
The brand management and product management divisions of a company actively seeks strong brand equity inthe marketplace. One common method of gaining equity is through advertising campaigns that promote the brand.Messages that are delivered through advertising are created by the company, with the assistance of facilitatingagencies unlike other factors which are beyond corporate control.
26

International Journal of Enterprise and Innovation Management Studies (IJEIMS) Vol. 1 No. 1
Publicity and consumer reviews of a brand are aspects of brand equity not managed by the company.Depending on the source, the effects of these factors may affect the brand perception positively or negatively. Whilecompanies actively pursue positive reviews and articles, they can be damaged by negative press or media coverages.Companies or products with the strongest equity tend to be those with the highest market share and profits.
Brand equity influences customer loyalty. The recent research findings clearly showed, according to thePearson correlation conducted between the consumer perception of the product equity and the consumer loyalty, apositive significant relationship on an intermediate-high level. In other words, the higher the consumer evaluates thebrand equity, the greater his loyalty becomes. Namely, as a product has higher perceived importance in theconsumer’s opinion, he searches for additional added value beyond his brand perception.
In addition, positive significant relationships were found between all the indices of the variable of brandequity and all the indices of the variable of customer loyalty. The level of relationships was intermediate high. Thestrongest positive relationship, relatively, is between real assets and repeat purchase, while the weakest relationship,relatively, was found between the non-real assets and recommendation to the friends.
Additional findings reinforce the importance in the creation of brand equity. It is also found that the brandequity contributes significantly to the prediction of the consumer loyalty.
To conclude, in light of the scientific literature and the research findings, that there is a positive relationshipbetween brand equity and consumer loyalty. This relationship is stronger as the level of involvement is lower. Inother words, the more the brand is familiar and established and perceived by the consumer as stronger, the more theconsumer will develop loyalty to it and there is a greater chance of the repeat purchase of the product.
REFERENCES1. Aaker, David A. (1991), Managing Brand Equity. New York: The Free Press
2. Keller, Kevin Lane (2003). “Brand Synthesis: The Multidimensionality of Brand Knowledge,” Journal ofConsumer Research, 29 (4), 595-600
3. Leuthesser, L., C.S. Kohli and K.R. Harich (1995). “Brand Equity: The Halo Effect Measure,” EuropeanJournal of Marketing, 29 (4), 57-66.
4. Ailawadi, Kusum L., Donald R. Lehmann, and Scott A Neslin (2003). “Revenue Premium as an OutcomeMeasure of Brand Equity,” Journal of Marketing, 67 (October), 1-17
5. Keller, Kevin Lane (1993). “Conceptualizing, Measuring, and Managing Customer-Based Brand Equity,”Journal of Marketing, 57 (January) 1-22
6. Lassar, W., B. Mittal and A. Sharma (1995). “Measuring Customer-Based Brand Equity,” Journal ofConsumer Marketing, 12 (4), 11-19
7. Neumeier, Marty (2006). The Brand Gap: How to Bridge the Distance Between Business Strategy and Design,Berkekley, CA : New Riders Publishing.
8. Grannell, Chris (2009).”Untangling Brand Equity, Value and Health”, Brandchannel, Fall 2008
9. Chu, Singfat and Hean Tat Keh (2006). “Brand Value Creation: Analysis of the Interbrand-Business WeekBrand Value Rankings,” Marketing Letters, 17, 323-331
10. Aaker, David A. (1996), “Measuring Brand Equity Across Products and Markets,” California ManagementReview, 38 (Spring), 102-120.
11. Aaker, David A. (1991), Managing Brand Equity. New York: The Free Press
27

International Journal of Enterprise and Innovation Management Studies (IJEIMS) Vol. 1 No. 1
ERP APPLICATION IN INDIA: AN OVERVIEW
1N. VENKATESWARAN and 2Dr. V. MAHALAKSHMI1Research Scholar, Sathyabama University, Chennai 600 119.
E-mail: [email protected] and Dean, Panimalar Engineering College, Chennai - 600 123.
ABSTRACT
Enterprise resource planning (ERP) systems are among the most important enablers for business intelligence andplanning functionality in supply chains. This paper provides an overview of ERP research and its development andimplementation in India. The paper describes the current market, challenges and future trends for ERP software inIndia. Cases are provided where ERP implementations have been used to enhance supply chain management of majorcompanies. One of the (not unexpected) findings is that not only analytical data concepts play an important role insuccessful ERP implementations in India but also cultural and language aspects.
Keywords - Enterprise Resource Planning, Information Systems, MRP, Supply Chain Management
I.INTRODUCTION
An enterprise resource planning (ERP) system is a highly integrated enterprise information system to manageall aspects of the business operations of an enterprise (especially regarding transactional data) including production,purchasing, engineering design, manufacturing, sales, marketing, distribution, accounting and customer service, etc.Once ERP systems are successfully implemented, significant benefits such as improved customer service, betterproduction scheduling, and reduced manufacturing costs can be gained. However, the successful implementationrate can be accounted for as still quite low and many firms that have gained some benefits from ERP systems haveyet to exploit the full potential benefits in their organizations.
Comprehensive studies related to the economical evaluation of information systems in general and those ofERP systems in particular still seem to be in their infancy to date. More specifically, if one cares about specificcultural and language barriers (including not even language differences but also considerations regarding charactersets different from those used in most of the countries as they can be found related studies need to investigateadditional aspects not yet included in general ERP adoption and innovation diffusion models.
One of the major concerns in today’s globalization is the transformation of countries like India or China.‘More than any other country, India is being transformed by its application of IT, from a poor and isolated society toa major force in the global economy.’ What makes India a somewhat special case is the great variety of ownershipstructures including state-owned, foreign invested and privately-held companies? That is, the role of ownership canbe studied in relatively greater depth there than elsewhere.
In this paper we focus on ERP system applications in India. While some studies exist in this respect, theyseem to be completely isolated and even expressing contradictory results at places. Therefore, we provide anexpository survey on existing literatures and studies related to ERP applications in India. That is, specific studieswith India focus related to various systems including MRP based and ERP systems from the literature are put intoperspective. Moreover, this is moderately interleaved with some reasoning based on an empirical analysis conductedby the researcher based on an online survey investigating some 25 enterprises which are currently or wereimplementing ERP systems in India. The outcomes of this paper may provide a more comprehensive picture ofcurrent ERP implementations in India especially regarding the provided references and facilitate organizations torespective literatures and to avoid obstacles for future adoption.
II.ERP SYSTEM ADOPTIONS:GENERAL ISSUES
ERP systems are rated among the most important information systems towards achieving competitive advantageespecially for manufacturing firms. As IT and supply chain management continue to improve and modeling applicationsexpand, it is expected that more and more companies implement various systems including those that interest us here. ERPsystems may be regarded as those information systems enabling to manage a company’s transactional data on acontinuous, real-time basis, i.e., standardizing data and information systems for order entry, financial accounting,
28

International Journal of Enterprise and Innovation Management Studies (IJEIMS) Vol. 1 No. 1
purchasing, and many other functions, not only within a single location of a firm but also across multiple facilitiesand business units.
The most prominent basics of ERP utilize ideas from materials requirements planning (MRP) and itssuccessor, manufacturing resource planning (MRP II). Here net requirements of raw materials and intermediateproducts to be manufactured or ordered from vendors to meet demand for finished products are calculated (MRP).Moreover, capacity considerations are taken into account (MRP II). Supply chain management (SCM) became amajor management issue in recent decades. The ability to instantaneously exchange information together withincreased computational power has enabled the use of sophisticated optimization software, although one has toadmit that appropriate planning functionality has not yet come to its full extent despite the mouthwateringadvertisements of most SCM software vendors. Nevertheless, ERP systems and the availability of transactional dataare at the core of enabling SCM while supply chain planning and integration remain a critical issue
Introducing information systems and especially ERP systems is closely related to organizational change.Taking the view of a company, say, a manufacturing firm, introducing an ERP system refers to innovation, change(management) and reshaping through the use of IT. That is, an interesting topic related to innovation management isthe question how to justify ERP system adoption and related investments.
Besides some general discussion, specific surveys and case studies are provided in many references includingthose mentioned and beyond. For instance, the importance of proper project management is based on a study ofabout 70 ERP system implementations. Most importantly, one may conclude that critical success factors (CSF) forimplementing ERP systems are somewhat in line with those of other types of information systems.
A special interest in ERP system adoption accounts for certain cultural backgrounds, language specifics, andalike, especially when it comes to supply chain integration. That is, especially language barriers and certainhistorical paths in shaping companies may greatly influence the way of ERP system adoption.
Firstly this paved way for more prospects in ERP market. The demand and supply gradually transformed fromgeneral to enterprise resource market. Once this got stabilized there was no looking back. It was well evident thatERP market could boom and give the necessary impetus to stakeholders. However this did not mean that mediocrecould survive in the market. There was demand only for top notch services and professionals.
This naturally led to improvement in the quality of services offered. Such an improvement increased thecompetition among various players. The end user was getting assured that he would be receiving the best servicesfor the money invested. Case ERP in India got more and more competitive. The ERP implementation in Indiademanded more than the custom ERP India module.
III. CURRENT STUDIES WITH INDIA FOCUS
Most empirical studies in the literature conduct a survey on a limited sample with a specific focus, e.g., acertain industry or a specific region/country. As mentioned above, India takes a somewhat special role as differentownership structures can be found side-by-side. This includes state-owned enterprises (SOE), foreign-investedenterprises, and privately-held companies. Moreover, larger companies as well as major internationally operatingcompanies may be distinguished from small and medium sized companies (SME). That is, the role of size andownership can be studied in relatively greater depth there than elsewhere. Another topic which makes India aninteresting source is the rapid change also with respect to modern forms of corporate governance
ERP Implementation and Development in IndiaERP system application can be followed back for more than two decades with many national programs in
India supporting IT developments. Earlier research and development programs like, e.g., more than 750 Program oncomputer integrated manufacturing (CIM) systems, was launched in March 1995. It strongly supported research,development and application of MRP/MRP II based systems, ERP and other systems for many years, and allowed toaccumulate comprehensive practical experiences. On a high level one may classify the development of ERPimplementations into three phases.
¾ Phase I : MRP adoption (with limited effects of application)
¾ Phase II: Developing MRP II/ERP
¾ Phase III: Maturity of the ERP market
29

International Journal of Enterprise and Innovation Management Studies (IJEIMS) Vol. 1 No. 1
From the late 1990s, MRP II, ERP and SCM became more and more popular; many industrial enterprises haveupgraded their ERP solutions or have directly applied new ERP systems of that time, such as SAP/R3, Oracle, andBAAN IV/V. Meanwhile, Chinese ERP software companies were active in extending their MRP II softwareproducts to ERP systems, the functionality of their ERP software became more and more powerful, and they startedto replace some of the foreign dominators of the market.
Government also continues to support the ERP system’s development. Since 2001, the policy of using ITtechnologies to speed up industrialization has been widely implemented in India. At the same time, several large scalenational projects on IT applications in industrial enterprises also have been launched. Up to 2003, more than 3000industrial enterprises, have applied ERP systems. Moreover, SME as emerging market entities rise quickly, and requestnew ERP solutions to meet their demands. All of these demonstrate the maturity of the ERP market in India.
Table 1 provides a snapshot of the as yet not stabilized percent market share of new license revenues for ERPsoftware in India for the years 2008 and 2009. (100% in these cases refer to 74.7 and 95.4 millions of dollars for2008 and 2009, respectively.) Earlier numbers can be found.
Vendor 2008 (%) 2009 (%)
SAP 18.0 22.5
Oracle 4.5 8.0
PeopleSoft 25.1 22.5
JD Edwards 2.0 1.8
BaaN 14.8 12.7
QAD 3.2 2.0
SSA 4.3 3.7
Ramco 4.1 4.7
Others 24.0 22.1
Table 1: Market share of ERP software in India
While common understanding is that mathematics and respective models are universal, many other things likeculture or language are not. A thought provoking question for software vendors refers to the markets and thepossible use of ERP systems. As supply chains become global we continue to encounter boundaries that are literallybeyond planning in our sense, i.e., a more quantitative one. Interesting entries into some literature, e.g., consideringquestions of the use of MRP, MRP II, and ERP systems in this respect in, say, India.
Before 2003, about 90% of the ERP implementations were late or over budget and the ERP implementationsuccess rate was only about 33%. While these numbers may hold in general, the success rate of the implementationof ERP systems in India was just 10%, much lower than that in Western countries.
The main reasons, among others, include the following challenges faced by Indian enterprises:
¾ Data maintenance and integration problems
¾ Involvement of consultants in respective projects
¾ Vendor selection
¾ Little implementation experience
¾ Weak IT infrastructure
¾ Access knowledge and human resource etc.
30

International Journal of Enterprise and Innovation Management Studies (IJEIMS) Vol. 1 No. 1
Specific StudiesAn explanatory study of R/3 users in India had been conducted in Winter 2008. A very comprehensive
questionnaire had been distributed among the users of R/3 using the customer list of SAP Indian clients culminatingin some 80 usable questionnaires, corresponding with a response rate of about 74%. The researcher identifies crucialimplementation process and context variables related to general issues of IT-enabled organizational change. It wasfound that project governance, specifically the role and decision making style of the steering committee, can beassociated with a broad set of outcome variables after controlling for ownership and other important context factors.While it turns out that ownership is strongly associated with implementation process characteristics, the associationof ownership structures with implementation results is much less pronounced.
In a broader context the study reveals that an overall motive for ERP adoption is to improve managementcontrol and to standardize business processes. This may help management to obtain basic transactional data oncompany operations. ERP implementations are often used to reduce the degree of managerial discretion and processvariability. One may argue whether in the era of SCM the underlying rationale of an ERP system is to enable moredecentralized or more centralized decision making.
Only the most advanced companies are beginning to build inter-organizational systems on the back ofsuccessful ERP implementations. In this study and its conclusions are extended into devising business orientedelectronic commerce development strategies.
In 2009, the researcher conducted a survey on a group of executives from 150 enterprises over 20 provinces inIndia. The researcher received some 79 usable returns. Ten were from large SOE while the remaining were fromSME. The major findings are related to CSF, ERP benefits and ERP obstacles. The major ERP benefits are related toSCM issues and constitute related benefits as cost reduction, business strategies’ support and alike. Among the CSFhe concludes that executive support is the key success factor for ERP, followed by SCM as an important componentand BPR as another CSF. Moreover ERP is more of a concept than software. ERP obstacles are found aroundcommon challenges such as ‘ERP is too expensive’ or ‘ERP is too complicated’ as well as some firm specificchallenges. In that respect main obstacles seem to be IT infrastructure in India, lack of well-trained workers, lack ofincentives at SOE, and differing corporate culture.
Additional studies with independent results can be found as follows. For instance reports about a questionnairewhich was published in an ERP professional website and mailed to the listed companies in the Bombay stockexchange. Depending on the questions between 90 and 118 responses were accounted for as useful, i.e., according tothe source 90 enterprises have completely finished or partly finished their ERP implementation project.
Among those companies about 81% used external consultants during the ERP adoption. Among the possibleconsultants the vendor’s consultants were mostly selected and they were involved in at least 50% of the work.Among the purpose for involving consultants we mostly found (multiple answers possible) as reasons to obtainsupport regarding project design and advice as well as the provision of knowledge transfer and appropriate training.Arguing in favor of the consultant selection we mainly found as reasons the expertise with the product to beimplemented, a strong experience in higher education and the availability of specific personnel. While we do notassume to be comprehensive with respect to our study, we still like to emphasize the aspect of higher education. Itmay deserve further investigation as it seems to be a factor which is not yet fully studied.
IV.IMPLEMENTATIONIMPLICATIONSININDIA
So far, we have provided a brief overview of the history of ERP implementations in India, and analyzed some of thecurrently available main references. As can easily be deduced, ERP system success still depends on the knowledge,personnel, infrastructure, etc. At the same time we accumulated some useful pointers for successful ERP implementations,such as paying attention to top management involvement, teamwork, customization, communication etc.
Based on the observations in the previous subsections the study deduces a number of CSF for domesticvendors of ERP software on the Indian market as follows:
¾ Low price : An SAP application easily costs more than more than 10 lakhs, while some domestic systemscost as little as several thousands. Even with their ‘high quality’ image in India, SAP vendors havedifficulties to customize the product especially in the emerging SME Indian market.
31
International Journal of Enterprise and Innovation Management Studies (IJEIMS) Vol. 1 No. 1
¾ Customer service: Domestic vendors can reflect the market quite quickly while foreign vendors may findit difficult to provide adequate and comprehensive customer support on time due to the shortage of on-time communication and technical personnel.
¾ Reporting format and content: India’s accounting standards are different from international accountingstandards. This requires foreign vendors to modify their financial accounting modules to generate thecorrect formats to meet local requirements. Many foreign vendors might encounter difficulties to do thisappropriately while their Indian competitors took this advantage.
V.PRESSURESMOUNTONTHEINDIANINDUSTRY
As discussed earlier ERP was initially restricted to back office functions and later spread its wings to all theoperations in the enterprise. This naturally meant that the ERP manufacturers and vendors had to increase thefunctionalities and scope of the application. There are practical difficulties when it comes to this issue.
The ERP experts will definitely be able to restructure the ERP systems with the help of resources and expertise available
with them. However doing it all on sudden is a difficult task. They must have been working with different requirements till then.
Compelling them to suddenly change will land things in a mess because there will be lot of confusions for the vendors,
manufacturers and end-users. The unrealistic deadlines and time pressures further add agony to this menace.
FinanceThis is another important determinant of ERP market in India. Some bigger companies still hesitate to invest
in ERP due to the exorbitant costs. It is indeed encouraging to find that a vast majority of them have realized itsbenefits and have determined to go for it. However some of them are keeping quiet due to the risks involved besidesthe unforeseen expenses and losses.
Technical factorsThirdly ERP in the nation calls for a restructuring in the technical aspects. This is definitely appreciable. The
fate of the businesses that have already implemented and deployed ERP remains a big question mark. No doubtchange is inevitable and an element for growth. However it would be next only to impossible to change even beforethe current change has stabilized in the market.
VI.FUTURETRENDS
Future developments in ERP software need to be analyzed in the light of two contexts.
The first relates to the enhancement of technical and functional capabilities of the ERP software. ERP packages nowprovide Web-enabled functionalities and e-business suites for use in B2B and B2C transactions. In this context, SAP haslaunched mySap.com, Baan has a product called iBaan, and Oracle has incorporated e-business functionalities into theirnew ERP software called Oracle Moreover, many ERP vendors have positioned themselves as one-stop vendors fordifferent integration requirements, and are adding CRM and SCM functionalities into their software. This is in response tointegration problems that organizations have had when they have tried to interface different best of breed solutions.Therefore, basic ERP packages are expected to serve as the back-end transaction-processing database, to which e-businessmodules incorporating functions relating to e-procurement, CRM and SCM would be added.
Future research efforts would therefore need to be directed at analyzing ERP adoption as part of an overallframework for adoption of e-business, along with the implementation of other packaged software such as CRM andSCM. The study of ERP adoption by SMEs and the accompanying specific problems and issues is another area ofpotential investigation
Future research is still in dire need for more comprehensive empirical data. For instance, one might add a few issuesthat have not been widely addressed, especially when comparing the ERP application in different countries. It would beuseful to investigate the significance of the interaction between firm size and financial health for ERP adopters comparedto non-adopters with respect to measures such as return on investment, return on assets and return on sales.
VII.CONCLUSION
Over the last few years, many organizations in India have benefited from improved processes and betterinformation availability as a consequence of the implementation of ERP solutions. For many others, the adoption of ERPhas resulted in a very painful transition and adaptation period, while the benefits have not been immediate or tangible.
32

International Journal of Enterprise and Innovation Management Studies (IJEIMS) Vol. 1 No. 1
This model presents a general conceptual framework and serves as a useful starting point from where the ERPexperience of Indian companies can be analyzed. It also presents some practical implications for managers formanaging and controlling relevant aspects of different stages of the implementation process. The generality of theframework has been further enhanced because of the number of industries covered in the study. The framework canbe used for organizations in other developing societies, as well as in SMEs.
During implementation most companies are looking for consulting assistance with ERP system vendors themselvesbecoming the most popular consultants during the implementation. Nevertheless, some consulting companies with specialexperience have a considerable growth share. For the selection of appropriate consulting companies, price seems not themain influencing factor, but reputation and practical experience. Despite all the advances, there is still a considerable wayto go for India regarding ERP implementation, and for improving their operational as well as their management level.
VIII.RESEARCHHIGHLIGHTS
The main objective of this paper focuses on ERP system applications in India. While some studies exist in thisrespect, they seem to be completely isolated and even expressing contradictory results at places. Therefore, weprovide an expository survey on existing literatures and studies related to ERP applications in India. That is, specificstudies with India focus related to various systems including MRP based and ERP systems from the literature are putinto perspective. Moreover, this is moderately interleaved with some reasoning based on an empirical analysisconducted by the researcher based on an online survey investigating some 25 enterprises which are currently or wereimplementing ERP systems in India. The outcomes of this paper may provide a more comprehensive picture ofcurrent ERP implementations in India especially regarding the provided references and facilitate organizations torespective literatures and to avoid obstacles for future adoption.
The major research highlights of this paper focus on:
General adoption issues before considering the specific case of India
ERP implementation Implications in Indian Market
Future trends of ERP adoption.
REFERENCES1. Oliver D., Romm C., 2002, Justifying enterprise resource planning adoption, Journal of Information
Technology, 17, 199-213.
2. Kumar V., Maheshwari B., Kumar U., 2002, Enterprise resource planning systems adoption process: a surveyof Canadian organizations, International Journal of Production Research, 40, 509-523.
3. Rao R., 2004, Can more effective communication improve the success of ERP implementation: Evidence fromenterprise implemented ERP in China, The Eighth Pacific Asia Conference on Information Systems, PACIS,Shanghai, 1875-1881.
4. Kostopoulos, K.C., Brachos D.A., Prastacos G.P., 2004, Determining factors of ERP adoption: An indicative study
in the Greek market, Proceedings of the International Engineering Management Conference, IEEE, 287-291.
5. Zhang L, Li Y.C., 2006, Theory and practice of systems methodology in ERP implementation, SystemsResearch and Behavioral Science, 23, 219-235.
6. Hunton J.E., Lippincott B., Reck J.L., 2003, Enterprise resource planning systems: Comparing firm performance of
adopters and non-adopters, International Journal of Accounting Information Systems, 4, 165-184.
33

International Journal of Enterprise and Innovation Management Studies (IJEIMS) Vol. 1 No. 1
STRESS MANAGEMENT WITH SPECIALREFERENCE TO PUBLIC SECTOR BANK
EMPLOYEES IN CHENNAI
RAJENDRAN JAYASHREESenior Lecturer, Prathyusha Institute of Technology & Management Aranvoyalkuppam, Thriuvallur, Chennai-
602025. E-mail : [email protected]
Key Words - Public Sector ,Bank Employee, occupational stress, causes of stress, attributes , initatives
I.INTRODUCTION
Today workplace stress is becoming a major issue and a matter of concern for the employees and theorganizations. It has become a part of life for the employees, as life today has become so complex at home as well asoutside that it is impossible to avoid stress. Selye [1936] defines stress as “a dynamic activity wherein an individualis confronted with an opportunity, constraint or demand”. Organisational stress arises due to lack of person-environment fit. When organizational stress is mismanaged, it affects the human potential in the organization. Itfurther leads to reduced quality, productivity, health as well as wellbeing and morale.
Thus, Stress is inevitable in our society. Researchers on stress make it clear that, to enter in to the complex area ofstress, especially in to the area of occupational stress, is very difficult. Stress is an unavoidable consequence of modernliving. With the growth of industries, pressure in the urban areas, quantitative growth in population and various problemsin day to day life are some of the reasons for increase in stress. Stress is a condition of strain that has a direct bearing onemotions, thought process and physical conditions of a person. Steers [1981] indicate that, “Occupational stress hasbecome an important topic for study of organisational behaviour for several reasons.” 1. Stress has harmful psychologicaland physiological effects on employees, 2. Stress is a major cause of employee turn over and absenteeism,3. Stress experienced by one employee can affect the safety of other employees, 4. By controlling dysfunctionalstress, individual and organisation can be managed more effectively.
During the past decade, the banking sector had under gone rapid and striking changes like policy changes due toglobalisation and liberalisation, increased competition due to the entrance of more private (corporate) sector banks,downsizing, introduction of new technologies, etc. Due to these changes, the employees in the banking sector areexperiencing a high level of stress. The advent of technological revolution in all walks of life coupled with globalisation,privatisation policies has drastically changed conventional patterns in all sectors. The banking sector is of no exemption.The 1990s saw radical policy changes with regarding to fiscal deficit and structural changes in India so as to prepare her tocope with the new economic world order. Globalisation and privatisation led policies compelled the banking sector toreform and adjust to have a competitive edge to cope with multinationals led environment. The implications of the abovesaid transformations have affected the social, economical and psychological domains of the bank employees and theirrelations. Evidence from existing literature states that more than 60% of the bank employees have one or other problemdirectly or indirectly related to these drastic changes. All the factors discussed above are prospective attributes to causeoccupational stress and related disorders among the employees. Although a lot of studies have been conducted on thepsychosocial side of the new policy regime in many sectors, there are only few studies, as far as the banking sector isconcerned, while the same sector has been drastically influenced by the new policies.
In this juncture, the present study is undertaken to address specific problems of bank employees related tooccupational stress. This throw light in to the pathogenesis of various problems related to occupational stress amongbank employees.
II.REVIEWOFLITERATURE
According to Douglas [1980], stress is defined as any action or situation that places special physical orpsychological demand upon a person.
Van Fleet [1988], stress is caused when a person is subjected to unusual situations, demands, extremeexpectations or pressures that are difficult to handle.
34

International Journal of Enterprise and Innovation Management Studies (IJEIMS) Vol. 1 No. 1
Cobb (1975) has the opinion that, “The responsibility load creates severe stress among workers andmanagers.” If the individual manager cannot cope with the increased responsibilities it may lead to several physicaland psychological disorders among them. Brook (1973) reported that qualitative changes in the job createadjustmental problem among employees. The interpersonal relationships within the department and between thedepartments create qualitative difficulties within the organisation to a great extent.
Miles and Perreault (1976) identify four different types of role conflict: 1. Intra-sender role conflict 2. Intersender role conflict. 3. Person- role conflict; 4. Role over load. The use of role concepts suggests that job relatedstress is associated with individual, interpersonal, and structural variables (Katz and Kahn, 1978; Whetten, 1978).The presence of supportive peer groups and supportive relationships with super visors are negatively correlated withR.C. (Caplan et al., 1964).
There is evidence that role incumbents with high levels of role ambiguity also respond to their situation withanxiety, depression, physical symptoms, a sense of futility or lower self esteem, lower levels of job involvement andorganisational commitment, and perceptions of lower performance on the part of the organisation, of supervisors,and of themselves (Brief and Aldag, 1976; Greene, 1972).
Ivancevich and Matteson (1950) indicate, “Lack of group cohesiveness may explain various physiological andbehavioural outcomes in an employ desiring such sticks together.” Workplace interpersonal conflicts and negativeinterpersonal relations are prevalent sources of stress and are existed with negative mood depression, and symptomsof ill health.
Occupational stress is an increasingly important occupational health problem and a significant cause ofeconomic loss. Occupational stress may produce both overt psychological and physiologic disabilities. However itmay also cause subtle manifestation of morbidity that can affect personal well-being and productivity (Quick,Murphy, Hurrel and Orman, 1992). A job stressed individual is likely to have greater job dissatisfaction, increasedabsenteeism, increased frequency of drinking and smoking, increase in negative psychological symptoms andreduced aspirations and self esteem (Jick and Payne, 1980). The use of role concepts suggests that occupationalstress is associated with individual, interpersonal and structural variables (Kutz and Kahn, 1978; Whetten, 1978).
Studies on burnout found that, it is related to exhaustion and work over load factors in various organisations(Green and Walkey, 1988; Chermiss, 1980; Freudenberger, 1977, 1980). Stress on the job is costly for employers,reflected in lower productivity, reduced motivation and job skills, and increased and accidents.
The purpose present study is an attempt to investigate and to compare the level of stress experienced by theemployees of the Nationalised banks in Chennai. The study aims to ascertain the level of stress and to analyse thevarious attributes which influence organizational stress on bank employees.
III.SCOPEOFTHESTUDY
United States National Institute of Occupational Safety and Health has defined workplace stress as “The harmfulphysical and emotional responses that occur when the requirements of the job do not match the capabilities, resources, orneeds of the worker. Job stress can lead to poor health and even injury.” Workers who are stressed are also more likely tobe unhealthy, poorly motivated, less productive and less safe at work. Their organizations are less likely to be successfulin a competitive market. Stress can be brought about by pressures at home and at work. Employers cannot usually protectworkers from stress arising outside of work, but they can protect them from stress that arises through work. Stress at workcan be a real problem to the organization as well as for its workers. Good management and good work organization are thebest forms of stress prevention. This study is helpful in assessing the extent of stress experienced by the employees.
IV.OBJECTIVEOFTHESTUDY
¾ The primary aim for the study is to analysis the job stress among the public sector bank employees in Chennai
V.SECONDARYOBJECTIVE
¾ To examine what is the effect of stress on work factors (e.g., morale, job satisfaction, task effort,organizational commitment, etc) when people are under high stress.
¾ To assess the extent of experienced distress and consequent quality of life among the employees
¾ To identify different methods and techniques to reduce job-related stress.
35

International Journal of Enterprise and Innovation Management Studies (IJEIMS) Vol. 1 No. 1
VI.METHODOLOGYOFTHESTUDY
A]POPULATIONThe population selected for this particular study is employees from public sector units in Chennai. Public
sector comprise of Union Bank of India, Vijaya Bank and the State Bank of India. Questionnaire were distributedand collected personally by the researcher.
B]RESEARCHDESIGNThe study is explorative as well as descriptive in nature.
C]SAMPLEDESIGNThe particulars of sample design,
1. TYPEOFUNIVERSE : Finite.
2. SAMPLINGUNIT : Chennai
3. SOURCELIST : Public Sector Employees
4. SIZEOFSAMPLE: 100
5. PARAMETER OF INTEREST: In estimating the number of persons being stressed in their jobs.
D]TOOLOFDATACOLLECTIONA pilot testing was conducted initially by administering the questionnaire on around 10 numbers of
respondents. The information was collected from the bank employees at all the levels. Interviews were conductedwith the employees for gathering information on their perception about their organization and the problems whichthey face both directly and indirectly in the discharge of their responsibilities. The respondents were questioned onthe issues affecting the stress levels of the employees, impact of family pressures on their work, expectations fromtheir roles, up to what extent they are satisfied and possible suggestions for overcoming the adversities of stress byevaluating the individual initiatives and organizational initiatives.
E]SOURCESOFDATAThe study will consist of both primary and secondary data. The primary data was collected by direct interview
through questionnaire. The secondary data was collected from research publications, standard journal andperiodicals including the government organizations and from respective records about the job related occurrence.
F]RESEARCHINSTRUMENT-QUESTIONNAIREMETHODThe instrument will be administered in the workplaces of each group. Data will be collected from the
employees. Data will be collected using a structured questionnaire, which will be distributed in the workplace toemployees and in Chennai city.
G]ANALYSISOFDATAThe data will be analyzed to determine any differences between the stress levels of employees and their impact
on reducing stress.
VII.RESULTSANDDISCUSSIONS
This paper also includes an analysis of data collected by respresenting it in tabular form along with interpretations.
The information collected were analysed for arriving at proper conclusion on the topic.
TABLE NO : 1
PERCENTAGEOFRESPONDENTSWHOFELTTHATTHEYWERESTRESSED
Category % of Respondents
Stressed 97
Not Stressed 03
36
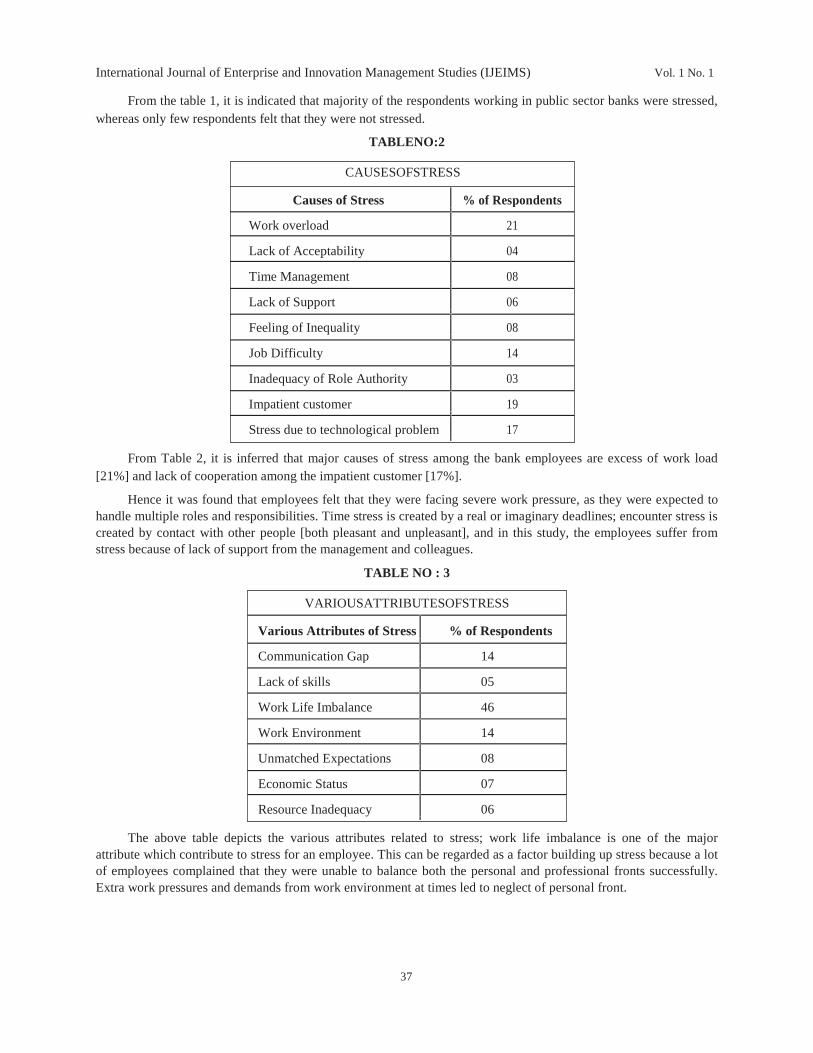
International Journal of Enterprise and Innovation Management Studies (IJEIMS) Vol. 1 No. 1
From the table 1, it is indicated that majority of the respondents working in public sector banks were stressed,whereas only few respondents felt that they were not stressed.
TABLENO:2
CAUSESOFSTRESS
Causes of Stress % of Respondents
Work overload 21
Lack of Acceptability 04
Time Management 08
Lack of Support 06
Feeling of Inequality 08
Job Difficulty 14
Inadequacy of Role Authority 03
Impatient customer 19
Stress due to technological problem 17
From Table 2, it is inferred that major causes of stress among the bank employees are excess of work load[21%] and lack of cooperation among the impatient customer [17%].
Hence it was found that employees felt that they were facing severe work pressure, as they were expected tohandle multiple roles and responsibilities. Time stress is created by a real or imaginary deadlines; encounter stress iscreated by contact with other people [both pleasant and unpleasant], and in this study, the employees suffer fromstress because of lack of support from the management and colleagues.
TABLE NO : 3
VARIOUSATTRIBUTESOFSTRESS
Various Attributes of Stress % of Respondents
Communication Gap 14
Lack of skills 05
Work Life Imbalance 46
Work Environment 14
Unmatched Expectations 08
Economic Status 07
Resource Inadequacy 06
The above table depicts the various attributes related to stress; work life imbalance is one of the majorattribute which contribute to stress for an employee. This can be regarded as a factor building up stress because a lotof employees complained that they were unable to balance both the personal and professional fronts successfully.Extra work pressures and demands from work environment at times led to neglect of personal front.
37
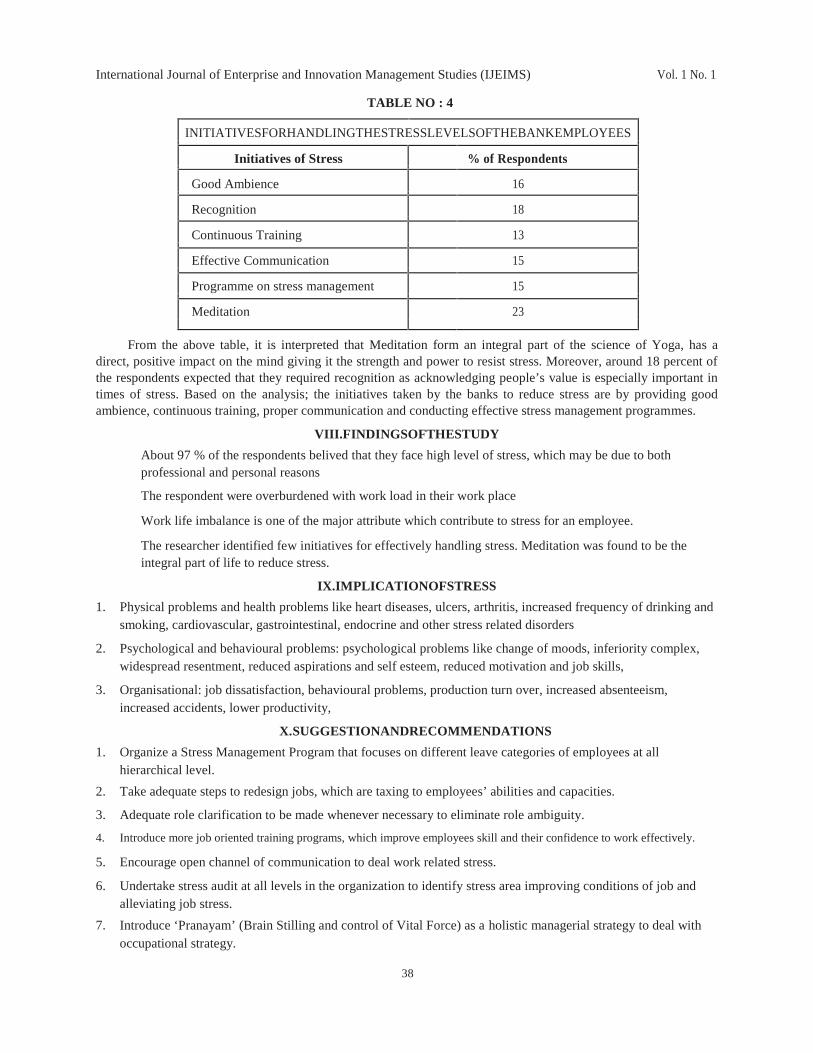
International Journal of Enterprise and Innovation Management Studies (IJEIMS) Vol. 1 No. 1
TABLE NO : 4
INITIATIVESFORHANDLINGTHESTRESSLEVELSOFTHEBANKEMPLOYEES
Initiatives of Stress % of Respondents
Good Ambience 16
Recognition 18
Continuous Training 13
Effective Communication 15
Programme on stress management 15
Meditation 23
From the above table, it is interpreted that Meditation form an integral part of the science of Yoga, has adirect, positive impact on the mind giving it the strength and power to resist stress. Moreover, around 18 percent ofthe respondents expected that they required recognition as acknowledging people’s value is especially important intimes of stress. Based on the analysis; the initiatives taken by the banks to reduce stress are by providing goodambience, continuous training, proper communication and conducting effective stress management programmes.
VIII.FINDINGSOFTHESTUDY
About 97 % of the respondents belived that they face high level of stress, which may be due to bothprofessional and personal reasons
The respondent were overburdened with work load in their work place
Work life imbalance is one of the major attribute which contribute to stress for an employee.
The researcher identified few initiatives for effectively handling stress. Meditation was found to be theintegral part of life to reduce stress.
IX.IMPLICATIONOFSTRESS
1. Physical problems and health problems like heart diseases, ulcers, arthritis, increased frequency of drinking andsmoking, cardiovascular, gastrointestinal, endocrine and other stress related disorders
2. Psychological and behavioural problems: psychological problems like change of moods, inferiority complex,widespread resentment, reduced aspirations and self esteem, reduced motivation and job skills,
3. Organisational: job dissatisfaction, behavioural problems, production turn over, increased absenteeism,increased accidents, lower productivity,
X.SUGGESTIONANDRECOMMENDATIONS
1. Organize a Stress Management Program that focuses on different leave categories of employees at allhierarchical level.
2. Take adequate steps to redesign jobs, which are taxing to employees’ abilities and capacities.
3. Adequate role clarification to be made whenever necessary to eliminate role ambiguity.
4. Introduce more job oriented training programs, which improve employees skill and their confidence to work effectively.
5. Encourage open channel of communication to deal work related stress.
6. Undertake stress audit at all levels in the organization to identify stress area improving conditions of job andalleviating job stress.
7. Introduce ‘Pranayam’ (Brain Stilling and control of Vital Force) as a holistic managerial strategy to deal withoccupational strategy.
38

International Journal of Enterprise and Innovation Management Studies (IJEIMS) Vol. 1 No. 1
8. Provide counseling on work related and personnel problems and support from a team of welfare health andcounseling staff.
9. Attractive system of reward and recognition of good work.
XI.CONCLUSION
The problem of stress is inevitable and unavoidable in the banking sector. A majority of the employees facesevere stress- related aliments and a lot of psychological problems. Hence, the management must take severalinitiatives in helping their employees to overcome its disastrous effect.
Since stress in banking sector is mostly due to excess of work pressure and work life imbalance theorganization should support and encourage to take up roles that help them to balance work and family.
Theproductivity of the work force is the most decisive factor as far as the success of an organisation isconcerned. The productivity in turn is dependant on the psychosocial well being of the employees. In an age ofhighly dynamic and competitive world, man is exposed to all kinds of stressors that can affect him on all realms oflife. The growing importance of interventional strategies is felt more at organisational level. This particular researchwas intended to study the impact of occupational stress on Nationalized Bank employees. Although certainlimitations were met with the study, every effort has been made to make it much comprehensive.
REFERENCES1. Albrecht K [1979], Stress and the Manager, Englewood Cliffs; Prentice Hall, Nj.
2. Jyothi Budhraja , “ Causes of stress among insurance employees: An empirical study; The ICFAI journal ofMarketing research, Vol.VII, No.10, 2008 pp7-14.
3. Gender Difference in stress among bank officers of Private and Public Sector; The ICFAI journal of Marketingresearch, Vol.VIII, No.2, 2009 ,pp63-69.
4. Selye, H. (1974). “Stress without Distress.” Harper and Row Publications, U.S.A.
5. Bajpai, B.L. (1992). “Stress management.” Financial Express, Bombay, June.
6. Vijayashree. L. & Dr. Katyayani .J, Gender perspective towards stress factors: Retail employees, Bangalore;Sona Journal of Marketing Research, Vol 1 , Issue 1, January 2009, pp 57-65.
39

International Journal of Enterprise and Innovation Management Studies (IJEIMS) Vol. 1 No. 1
EVALUATION OF THE PERCEPTION, ATTITUDE AND PRACTICE OFSELF MEDICATION AMONG BUSINESS STUDENTS IN 3 SELECT
CITIES, SOUTH INDIA
S. KAYALVIZHI and Dr. R. SENAPATHI1Research Scholar, Manonmaniam Sundaranar University, Thirunelveli, Tamil Nadu.
E-mail : [email protected], MBA Department, Adhiparasakthi Engg College, Melmaruvathur, Tamil Nadu.
E-mail : [email protected]
ABSTRACT
Objective : This study was undertaken to determine the knowledge, attitude and practice of self-medication among first-year under graduate business students of 3 universities in South India. Subjects and Methods: Out of the 1017respondents, 605 (59.48 %) were male and 412 (40.52%) were female respondents. This was an anonymous,questionnaire-based, descriptive study. Questionnaire, containing open-ended and close-ended questions, wasadministered to the subjects. Data were analyzed and the results expressed as counts and percentages. Results: Of the1017 respondents, 815 (80.13%) practiced self medication. The respondents’ knowledge about appropriate self-medication was poor, but knowledge of the benefits of self-medication was adequate. The respondents found self-medication to be time-saving, economical, convenient and providing quick relief in common illnesses. The majority(85%) of the respondents had a positive attitude favoring self-medication. The most common indications for selfmedication were headache (35%), fever (36%), and cough, cold and sore throat (20%). Conclusion: Knowledge aboutappropriate self-medication was poor, attitude towards self-medication was positive and the practice of self-medicationwas quite high and often inappropriate. Educating students in particular and the public at large, about the dangers ofindiscriminate use of drugs; the physicians being more judicious in prescribing and also insisting on drugs beingsupplied by the chemist only on a valid prescription; implementation of a proper statutory drug control rationallyrestricting the availability of drugs to the public are the three measures suggested by the study.
Key Words - Self-medication . Business Students . Self-care . Health
policy *This study is part of the Research Thesis of the Scholar.
I.INTRODUCTION
Every day people throughout the world act on their own for their health; they practice self-care. In some instances,they do so through self-medication, which is now increasingly being considered as a component of self-care (Hughes CM,2001). Self medication is defined as the use of medication by a Patient on his own initiative or on the advice of aPharmacist or a lay person instead of consulting a medical practitioner (WHO guidelines, 2000). Studies done on self-medication reveal that it is a fairly common practice, especially in economically deprived communities. It is a growingtrend of ‘self-care’ which has its positive and negative aspects (Geissler PW et al., 2000) Unfortunately, especially indeveloping countries, professional health care is relatively expensive and in some cases not readily available therebymaking self medication an obvious choice of healthcare service (Chang, 2003) Furthermore, it has been noted thatpurchase of drugs and many drugs that can only be purchased with prescription in developed countries are OTC indeveloping countries. Also, lax medical regulation has resulted in the proliferation of counter free drugs that are in highdemand for the treatment of highly prevalent diseases (Shakoor, 1997)
Some governments are increasingly encouraging self-care of minor illnesses, including self-medication. Whileresponsible self medication, which is limited to over the counter (OTC) drugs, may generate substantial net benefit flowsto economies through saving in travel and consultation time and the direct financial cost of treatment (Porteous, 2005).Major problems related to self medication is wastage of resources, increased resistance of Pathogens, and generally entailsserious health hazards such as adverse reaction and prolonged suffering. Antimicrobial resistance is a current problemworld wide particularly in developing countries where antibiotics are often available without a prescription (Pagane,2007). Self-medication is an area where governments and health authorities need to ensure that it is done in a responsiblemanner, ensuring that safe drugs are made available over the counter and the consumer is given adequate informationabout the use of drugs and when to consult a doctor (World Health Organization,1995)
40

International Journal of Enterprise and Innovation Management Studies (IJEIMS) Vol. 1 No. 1
The reasons for self medication mentioned in the literature are mild illness, previous experience of treatingsimilar illness, economic considerations and a lack of availability of healthcare personnel. The most commonmedications used for self medication are analgesics and antimicrobials (Hughes, 2001 & Shankar et al., 2002).Another study on self medication shows that it is influenced by many factors such as education, family, society, law,availability of drugs and exposure to advertisements (Monastruc JL, 1997 & Habeed, 1993). A high level ofeducation and professional status has been mentioned as predictive factor for self medication (Martins, 2002).
II.SUBJECTSANDMETHODS
This study was an anonymous, questionnaire-based survey, undertaken between September to November 2010.A self-developed, pre-validated questionnaire consisting of both open-ended and close-ended items was used. The studypopulation comprised of first-year Under Graduate Business students of University of Madras, Chennai, ThiruvalluvarUniversity, Vellore and Bharathiar Univeristy, Coimbatore. Students pursuing B.Com., and B.B.A., in 10 collegesaffiliated to each of the 3 universities were the respondents of the study. These were young men and women who hadrecently joined the Arts & Science College. All first-year business students who were willing to participate in the studywere enrolled. A briefing was given about the nature of the study, and the procedure of completing the questionnaire wasexplained. Consenting participants anonymously completed the questionnaire in the classroom.
For the purpose of the study, certain operational terms were defined. Self-medication was defined as the useof over-the-counter or non prescription drugs, whether modern or traditional, for self-treatment, without priorconsultation with a doctor. A doctor was defined as any person who is medically qualified to prescribe medications.It included practitioners of modern scientific medicine as well as practitioners of other healthcare systems.Medication was defined as any substance used for treatment or prevention of disease. It included modern scientificmedications as well as medications from other healthcare systems.
Samples of 1189 students were selected randomly from the colleges affiliated to the three institutions of SouthIndia. The inclusion criteria for the selection of students was 17 years and above. Out of all, 172 students wereexcluded in accordance with the exclusion criteria like incomplete information. The questionnaire consisted ofquestions on reason for self medication, indications of self medication, source of drug information etc. The resultsare based upon the data obtained from 1017 (85.5%) students. The prevalence of self medication was reported aspercentages. The survey was descriptive and data was summarized as counts and percentages, some of the questionshad multiple options to choose from.
III.RESULTS
(A) Baseline characteristics of participantsAll the students (n=1189) responded to the questionnaire, of whom 172 were excluded in accordance with the
exclusion criteria like incomplete information. Remaining 1017 (85.5%) students’ questionnaire were considered forevaluation.
PerceptionThe respondents perceived several advantages of self-medication (Table 1). The most important advantages
were saving time (56.63%), being economical (17.69%) and providing quick relief (12.58%).
Table 1Reason for self-medication
Reasons stated by the respondents Respondents, %
Time-saving 56.63
No need to visit doctor for minor illness 3.44
Economical 17.69
Quick relief 12.58
Ease and convenience 8.09
Crowd avoidance 1.57
41

International Journal of Enterprise and Innovation Management Studies (IJEIMS) Vol. 1 No. 1
AttitudeThe majority (85%) of the respondents had a positive attitude towards self-medication and favored self-
medication saying that it was acceptable, while 15% felt it was unacceptable. When asked about the influence ofpharmacists on their attitude towards self-medication, 64.2% felt that the pharmacists played a major role in the selfmedication of the non-prescribed medicines purchased over the counters.
Practice
Of the 1017 respondents, 815 (80.13%) practiced self medication, which included 45.1% of females and44.2% of males. The remaining 202 respondents preferred consulting a doctor by going to a private clinic (20.2%), aprimary healthcare center (31.3%), a referral hospital (48.5%). The most important reasons quoted for not consultinga doctor were previous experience (45.5%), mild illness (40.3%) and shortage of time (32.1%); rarely, it was advicefrom a friend (5.2%) and non availability of a doctor (4.5%). There were several indications for self-medication(Table 2): the most common indications were headache, fever, and cough, cold and sore throat.
Table 2
Indications for self medication
INDICATIONS RESPONDENTS,%
Headache 35
Cough, cold, sore throat 20
Stomach ache 3
Fever 36
Vomiting 1
Skin symptoms 0.27
Eye symptoms 0.73
Ear symptoms 2
Diarrhea 2
Drug information
80.82% students learned self medication from doctors’ prescriptions provided during their prior illness.Friends, pharmacist, advertisements and books comprised 36.98%, 31.2%, 13.11% and 7.0% respectively, whichprovided/guided students for self medication (Table 3)
Table 3Drug information
Sources of Drug information RESPONDENTS,%
Doctors’ prescriptions providedduring prior illness 80.82
Friends 31.2
Pharmacist 36.98
Advertisements 7
Books 13.11
42

International Journal of Enterprise and Innovation Management Studies (IJEIMS) Vol. 1 No. 1
IV.DISCUSSION
PerceptionThe respondents had a fairly good knowledge of the advantages and disadvantages of self-medication. Many of
them correctly perceived self-medication as time-saving and economical, doing away with the need to go to a doctor forminor illness and providing quick, easy and convenient relief. These perceptions are similar to those reported by the WHOthat self-medication provides a cheaper and convenient alternative for treating common minor illnesses [WHO Report,1995 & Kafle, 1993). These are important factors favoring self-medication and have been reported in other studies[Hughes, 2001 & Shankar, 2002]. However, this could also mean that health services need to be improved so thattreatment becomes more accessible and the patient’s waiting time is minimized. Length of waiting time for medicalconsultation has been identified as one of the predictive factors for self-medication [Martins, 2002]. The most importantdeterrents for self-medication were fear of adverse drug reactions, risk of making a wrong diagnosis and risk of using awrong drug (fear of the unknown), similar to an earlier study [Hughes, 2001] .
Attitude
The majority of the respondents had a positive attitude towards self-medication, saying that it was acceptable.Unlike other aspects of self-care, self-medication involves the use of drugs, and drugs have the potential to do goodas well as cause harm. In this context, the pharmacist has an important role (Hughes CM &WHO Report, 1998)
PracticeIn this study, more than 80% of the respondents practiced self-medication. Those with a previous experience and
with mild illness were more likely to practice self-medication. This has implications, because many diseases have similarsymptoms, and a person using previous experience may be exposed to the dangers of misdiagnosis and consequentlywrong treatment. The commonest illnesses that led to self-medication in this study were usually self-limiting ‘minorillnesses’ that have been widely reported in studies on self-medication as the most common indications (Shankar, 2002).
It is acknowledged by the researcher that this type of study, using a self administered questionnaire, is largelydependent upon information given by respondents. Although students were encouraged to complete thequestionnaire independently, mutual influence between pupils could not be entirely ruled out. However, given thehigh level of response, the results should closely approximate the behavior of the adolescent students in South India.Few students consulted pharmacists for information on drugs. The pharmacist’s role is mainly seen as that of a drugsalesman rather than that of a healthcare provider. Patient education and awareness campaigns are necessary topromote the role of the pharmacist in India. Students with a previous experience and with mild illness were morelikely to practice self medication. This has implications, because many diseases have similar symptoms and a personusing previous experience may be exposed to the dangers of misdiagnosis and consequently wrong treatment.
Major reasons of self medication at student level were time saving, perception that there was no need tovisit/get advice from the prescriber for minor illness, self medication found to be economical and fear about thecrowd at clinic. Most of the respondents had positive attitude in self medication for minor illness. However, minorillness symptoms may cause major illness if not diagnosed properly as most of the fatal diseases have symptoms likefever, body ache, and headache.
V.CONCLUSION
This descriptive survey shows that the majority of the students had poor knowledge about appropriate self-medication while the knowledge of the benefits and risks was not adequate. Thus, to avoid or minimize the dangersof self medication, the students should be educated about the dangers of indiscriminate use of drugs. Secondly, thephysicians should be more judicious in prescribing and must insist on drugs being supplied by the chemist only on avalid prescription. Thirdly, a proper statutory drug control must be implemented, rationally restricting theavailability of drugs to the public. These three measures would definitely reduce the incidence of drug-relatedmishaps and help in maintaining good health of the individual and society.
REFERENCE1. Hughes CM, McElnay JC, Fleming GF: Benefits and risks of self medication. Drug Safety. 2001; 24: 1027–1037.
2. WHO guidelines for the regulatory assessment of medicinal products for use in self medication, 2000. Availablefrom www.who.int/medicines/library/qsm/whoedm-qsm-2000- 1/who-edm-qsm-00_1.htm.
43

International Journal of Enterprise and Innovation Management Studies (IJEIMS) Vol. 1 No. 1
3. Porteous T, Bond C, Hannaford P, Sinclair H: How and why are non-prescription analgesics used in Scotland? Fam
Pract 2005; 22: 78–85.
4. Geissler PW, Nokes K, Prince RJ, Achieng RO, Aagaard-Hansen J, Ouma JH: Children and medicines: self-treatmentof common illnesses among Luo school children in western Kenya. Social Science Medicine 2000; 50: 1771–1783.
5. Pagane JA, Ross S, Yaw J, Polsky D. Self medication and health insurance coverage in Mexico. Health Policy2007; 75:170-177.
6. World Health Organization: Report of the WHO Expert Committee on National Drug Policies 1995.http://www.who.int/ medicines/library/dap/who-dap-95-9/who-dap-95.9.shtml.
7. Chang F, Trivedi PK, Economics of self medication: theory and evidence. Health Economics 2003; 12: 721-739.
8. Shakoor, O, Taylor RB, Behraus RH. Assessment of the incidence of substandard drugs in developingcountries. Tropical medicine and International health 1997; 2: 839-845.
9. Shankar PR, Partha P, Shenoy N. Self medication and nondoctor prescription practices in Pokhara Valley,Western Nepal: a questionnaire-based study. BMC Family Practice 2002; 3:17.
10. Monastruc JL, Bagheri H, Gerard T, Lapeyre MM. Pharmacovigilance of self medication. Therapie 1997; 52: 105 -110.
11. Habeed GE, Gearhart JG. Common patient symptoms: pattern of self treatment and preventions. J Miss state Med
Assoc 1993; 34: 179-181.
12. Martins AP, Miranda AC, Mendes Z, Soares MA, Ferreira P, Nogueria A. Self medication in a Portugueseurban population: a prevalence study. Pharmacoepidemial Drug Safety 2002; 11: 409-414.
13. Kafl e KK, Gartulla RP: Self-medication and its impact on essential drugs schemes in Nepal: a socioculturalresearch project 1993. http://www.who.int/medicines/library/dap/whodap-93-10/who-dap-93-10.shtml
44

International Journal of Enterprise and Innovation Management Studies (IJEIMS) Vol. 1 No. 1
GEN X AND Y GO MOBILE – EXPLORING THE FACTORS AFFECTINGTHEIR ADOPTION AND USAGE
1S. MAHALAKSHMI and 2Dr. K. JAWAHAR RANI1Research Scholar, Research Supervisor, Bharathiyar University Department of Management Studies, T. J. Institute
of Technology, Chennai – 600096. [email protected]. Joseph College of Engineering, Jeppiaar Nagar, Chennai – 600 119.
ABSTRACT
It is a Meta analysis study, which is to investigate the adoption and usage of mobile phones among Generation X and Ycustomers. The recent growth of mobile phone usage is an observable fact that crosses all age and gender boundaries.Generation X and Y have taken different purchase decision, especially the product mobile. Meta analysis study helps toanalyze review and identify the overall trends in adoption and usage of mobile phones among generation X and Y. Thereviews are collected from the past eight years data (2000 - 2009) since it is only during these years the mobile phone usershave spread widely. [The mobile phone users were 0.5 billion in 2000 and are expected to increase to 1.5 billion in 2010]. Thisstudy aims to provide a framework for understanding how Social, Demographic, cultural and technological factors changeoverall trends in adoption and usage of mobile phones among generation X and Y customer segment.
Keywords : Meta Analysis, Mobile, Customer Segment
1.INTRODUCTION
The mobile phone has become part of our lives and part of our identity. The device itself, the ring tone, thescreen images and the assortment of accessories all help define who we are to the outside world. Mobile phonesnowadays are not luxury items anymore but necessities because of the various benefits and advantages the mobilephones offer, they became a very important part of society. Mobile phones have become a part of everyday life formany individuals and some could not even manage to last an hour without them. This is also the fashion trendnowadays. Mobile phones have even become the timepieces as people are more likely to check the time in theirhandsets. This device calculates, wakes people up, and reminds them of all occasions and appointments.
The rapid adoption and usage of mobile phones around the world has changed the way people communicate, interactand socialize with one another. Overall, consumers are choosing mobile phones over landlines. In fact, more than four outof five U.S. adults (85 percent) own a mobile phone (i.e., cell phone and/or smart phone), compared to only about seven inten (71 percent) who have a landline or home phone. (SAN FRANCISCO, June 26 /PRNewswire/— Ingenio, Inc., Copyright PR Newswire Association LLC Jun 26, 2007)
2.OBJECTIVE
The focus is to ascertain the influencing attributes that will affect the behavior of the consumers in the long run,highlight the differences due to market evolution and observe the specific socio-economic, personal, cultural andtechnological variables among mobile phone customers in Chennai city. From the above discussion it is clear that thereshould be great interest in researching the consumer behaviour in connection with mobile phone adoption and usage on thepart of Generation X and Y customers in the city of Chennai. These two generations needs to be sufficiently researched soas to increase the understanding of the attitudes and behaviour of the people towards mobile phones. This is necessary inorder to devise an effective way to market to this group. It is important to investigate this group because Generation X andY, as opposed to the general population of Chennai, exhibits different attitudes and behaviours towards, and an acceptanceof the mobile phone. To summarise the problem statement is to determine the behaviour patterns of Generation X and Yconsumers as they are a growth market, and not enough is known about their consumer behaviour patterns regarding theadoption and usage of mobile phones in Chennai.
63 percent of mobile phone users agree that their phones are very personal to them and 44 percent believe thattheir phones have strengthened their personal relationships. (SAN FRANCISCO, June 26 /PRNewswire/ — Ingenio, Inc.,Copyright PR Newswire Association LLC Jun 26, 2007). Younger mobile phone owners are especially likely to feel that their
phones have strengthened their personal relationships (60 percent of those ages 18-34 vs. 37 percent of those
45

International Journal of Enterprise and Innovation Management Studies (IJEIMS) Vol. 1 No. 1
ages 35+).( SAN FRANCISCO, June 26 /PRNewswire/ — Ingenio, Inc., Copyright PR Newswire Association LLCJun 26, 2007). While nearly one-half of mobile phone owners (49 percent) currently use their phones for more thanjust making and receiving phone calls, the study finds that, in the next three years, 57 percent of mobile phoneowners anticipate using their phones for more than just making and receiving phone calls.
(Source: Wireless Mobile Telephony – Dr. Arian Durresi, 1998)
(SAN FRANCISCO, June 26 /PRNewswire/ — Ingenio, Inc., Copyright PR Newswire Association LLC Jun
26, 20072010: A Mobile Odyssey.)
2.1. Generation X StatisticsIn India the term, Generation X (born between 1961 to 1981) is used for the younger generation of people who
present a hip image. They are westernized, upwardly mobile and against the old Indian traditions of their parents. They arecareer minded and value money. They are not involved in social issues and have no ideals, except that of getting ahead.
During the past three months, 69 per cent of Generation Xers have shopped online and 65 per cent usedonline banking—more than any other group
21% of Gen X are now reading a blog once per month compared to 15% last year
61% of mobile subscribers text compared to 49% in 2007
(TMCnet Editor - Forrester Report Details IT Use Among Gen X, Y Members – By Michael Dinan July 21, 2008)
2.2. Generation Y StatisticsGeneration Y (born between 1980 to 1994) is not a homogeneous group, rather made up of three distinct
groups: Generation Y kids, teens and adults. It comprises of two specific groups: Generation Y kids and teens as onegroup and Generation Y adults comprise the second group. The rapid adoption and usage of mobile phones aroundthe world has changed the way people communicate, interact and socialize with one another. It helps to identify theneed to market to both of these groups in their own distinct manner.
90% of Gen Y own a computer and 82% own a mobile phone
72% of Generation Y mobile phone users send or receive SMS messages
They spend more time online than they do watching television, with 42% watching online video at leastonce per month
(TMCnet Editor - Forrester Report Details IT Use Among Gen X, Y Members – By Michael Dinan July 21, 2008)
46
International Journal of Enterprise and Innovation Management Studies (IJEIMS) Vol. 1 No. 1
Hulme and Peters (2001:2) find that “the mobile acts on many levels, as a fashion statement, as a communicator, asa badge of identity and as a decoder.” Furthermore according to Leps (2003) the “mobile me” ethos has become soestablished amongst youngsters that regularly updating their mobile phone profiles has become second nature; from thelook and feel of the handset (bright colours and funky patterns) to how the mobile phone sounds, the graphics it displaysand how it helps users organise their lives on the move are just a few of the profiles used by the youth.
Economists have slashed Indian economic growth forecasts for this year and the stock market is in thedoldrums. There is no sign of a slowdown yet: figures to be released later are expected to show that newsubscriptions in January 2009 reached a record 11 million. (Eric Bellman Feb 9, 2009)
“Gen Y is the audience that most companies are struggling to understand right now because it’s key to theirfuture revenue growth,” (Charles Golvin July 22, 2008)
“One of the questions that is been asked most frequently is the difference between Gen Y and Gen X, and thisyear’s data clearly shows the distinction. Gen Xers use technology when it supports a lifestyle need, when itintersects with a personal need or fulfills a desire. While technology is so deeply embedded into everything GenYers do that they are truly the first native online population.” (Jennifer Netherby July 24, 2008)
3.THE ORITICAL BACKGROUND
Various factors that influence mobile phone usage have been identified over time [Davis, 1989; Venkateshet al., 2003; Rogers, 2003]. The following determinants of mobile phone adoption and usage have been identified;
3.1. Social factorsA customer’s buying behaviour is also influenced by social factors, where People use technology to satisfy
social needs. Social interactions are the focus of human existence and therefore, in order to be successful,technology must eventually support socialization [Ark and Selker, 1999]. Cell phone has brought some socialchanges and be able to stay in touch with family and friend is one of the foremost social advantages the cell phone isproviding. As [Schofield and Sithole, 2006] say, “it has become quicker to communicate with friends and relatives.”
In the context of social factors, Campbell and Russo [Campbell and Russo, 2003] distinguish between technological
determination and social constructivism as two perspectives in viewing technology, and describe them as follows:
Technological determinism maintains that macro-level changes in the social order are primarily caused bynew technologies, which then exert micro-level influences on how people perceive and use technology.
Social constructivism maintains that humans shape technology and not the other way round.
Campbell and Russo reject technological determinism in the favour of social constructivism but acknowledgea reciprocal relationship between people and technology by saying: “just as new technologies influence the wayspeople live their lives, the ways people live their lives influence how they think about and use technologies.”
Mobile phones are often seen as fashion items [Green et al., 2001] where fashion is a form of communicationas well as an indicator of status and power [Katz and Sugiyama, 2005]. Some user groups even create their ownlanguage as a playful, creative expression of personal style [Page, 2005]. The location-free nature and huge growthof mobile phone usage have established a new social order that can be described as a shift from place-to-placecommunication to person-to-person communication [Khalil and Connelly, 2005a]. [Geser, 2004] states that mobilephones do not cause worldwide convergences and homogenization in social behaviour, as stating that “by supportingrather traditional and particularistic social settings, mobile phones are more likely to accentuate differences ratherthan communalities between various population segments, social institutions or ethnic culture”.
3.2. Demographic FactorsThis section deals briefly with some of the demographic factors that have been found to influence mobile
phone usage. Age has been the most widely applied demographic variable characterising differences in the adoptionof mobile end-user services [Kwon and Chidambaram, 2000; Pedersen, 2003; Kleijnen et al., 2004]. The needs ofpeople vary according to their age group [Coen et al., 2002]. Teenagers use mobile phones for accessibility, displayand entertainment [Ling, 2001; Gilbert and Kendall, 2003], and socialisaion [Ling, 2001]. Parents use mobilephones to coordinate family activities and to check on their children’s safety [Campbell and Russo, 2003], whileolder people use them for safety and security purposes [Ling and Haddon, 2001; Coen et al., 2002].
47

International Journal of Enterprise and Innovation Management Studies (IJEIMS) Vol. 1 No. 1
[Wilska, 2003] also found gender-related differences in mobile phone use. For example, ‘addictive’ use of thephone with heavy spending and a trendy, are connected to the female gender, while technology enthusiasm andtrend-consciousness is linked to ‘hard’ values, a ‘trendy’ consumption style and the male gender. Gender differenceis also supported by a study by [Wei et al., 2006] who found that women rely on mobile phones to show affection totheir families while men tend to use them predominantly for information-seeking purposes. The findings of the studyby Nickerson and Isaac [Nickerson and Isaac, 2006], concerning the influence of gender on mobile phone use wasinconclusive and therefore it seems as though the issue of gender influence has not been resolved. It has also beenfound that young people are increasingly using and adapting mobile phones not only to interact with their ownwords, but to create and structure their worlds [Spero and Stone, 2004:154].
Mobile phone usage is also influenced by education and income levels [Ho and Kwok, 2003; Bina andGiaglas, 2005], and national culture has been identified as a moderating factor that may influence mobile phone use[Nickerson and Isaac, 2006]. Better-educated people were found to use mobile phones more frequently and have amore positive attitude towards using a mobile phone [Bina Giaglis, 2005; Adomi, 2006].
[Kleijnen, Wetzels et al., 2004] investigated the effect of computer skills, mobile technology readiness, andsocial influence on technology adoption and found them all to be relevant in mobile phone usage. [Cheskin, 2001:9]notes that “Technology has become a great facilitator of teen and young adults’ social needs, building on their peerfixation and enhancing their ability to communicate with one another.”
3.3. Cultural FactorsCulture is the most fundamental determinant of a person’s want and behaviour. Cultural factors have a significant
impact on customer behaviour. The context of mobile user includes user culture and the influence of culture on mobilephone use [Urbaczewski et al., 2002; Teo and Pok, 2003a; Jones and Marsden, 2005a]. This necessitates a review ofculture as an essential part of understanding users and the factors that influence mobile phone usage.
[Ford, 2005] defines culture in the context of Human-computer interaction (HCI) as ‘the patterns of thinking,feeling, and acting that influence the way in which people communicate among themselves and with computers’.This definition is also applicable to mobile interaction and he consequently adapted it for the purpose of this study toconsider culture as ‘the patterns of thinking, feeling, and acting that influence the way in which people communicateamong themselves and use mobile devices’. [Judy van Biljon and Paula Kotzé, 2008] supports the fact that cultureinfluence mobile phone adoption and usage.
The mobile device market has widened to a global scale and consequently mobile devices are distributed throughoutthe world [Kim and Lee, 2005]. As the use of mobile phones pervades the world, the globalization of mobile device userinterface is becoming more crucial to business success and building a loyal customer base. Communication technologiesare entirely dependent on a social network for adoption and use, and therefore the diffusion of these technologies within aculture should be studied [Urbaczewski, et al., 2002]. According to [Palen et al., 2000] deployment of mobile telephonyvaries dramatically internationally and even among western countries. In general, usability studies aim to make technologymore useful. Cultural usability goes further and aims to make technology fit in with the user’s lifestyle [Sun, 2004]. Inorder to be effective, designers therefore have to understand and be aware of the cultural priorities and the value system ofusers, i.e. they must identify factors that are relevant and sensitive to cultural differences.
Hofstede proposed a model with international variables to show subjective culture affects human mentalprogramming [Hofstede 1995]. Hofstede further encompassed this model within the pyramid metamodel thatcomprises of three levels [Hoft 1996; Hofstede 2001]
Human nature is common to all human beings, it is inherited and not learned.
Culture is specific to a group of people and is learned, not inherited.
Personality is attributed to an individual and this attribute is both learned and inherited
3.4. Technological Factors
Technology adoption involves the user, the technology and the context [Humphreys, 2005].Various models forunderstanding technology adoption have been proposed. [Pedersen, 2003] list Roger’s innovation diffusion model,the domestication model and the technology acceptance model (TAM) as the three most commonly applied.
48

International Journal of Enterprise and Innovation Management Studies (IJEIMS) Vol. 1 No. 1
Roger’s innovation diffusion model is founded in sociology but also has been applied to the world ofmarketing where users are seen as economic entities, the world provides an approach to understandinghow a particular population adopts innovations [Rogers, 2003].
[Silverstone and Haddon, 1996] proposed the domestication model where users are seen as social entitiesand the model aims to provide a framework for understanding how technology innovations change and arechanged by their social contexts.
The technology acceptance model was developed by [Davis, 1989] to explain the determinants ofcomputer acceptance and usage behaviour.
While Rogers’ innovation diffusion model focuses on marketing and sales processes, the domesticationapproach deals with a more global analysis of adoptions ex post facto and the TAM focuses on technology adoptionin organisations [Ling, 2001].
TAM postulates several conceptually independent determinants of a person’s attitude toward using newtechnology (Davis, 1989; Davis, Bagozzi, & Warshaw, 1992). The determinants are as follows:
Usefulness: Usefulness was defined as the extent to which an individual perceives that using a mobilephone is beneficial to their lives [Davis, 1989].
Ease of use: Ease of use was defined as the extent to which a person believes that using the system will befree of effort [Davis, 1989].
Pleasure of use: Pleasure of use was defined as the extent to which users believe that using a mobile phoneis pleasurable in its own right [Davis et al., 1992]. This construct includes hedonic qualities of mobilephones such as attractiveness, aesthetics, and entertainment.
Association with satisfaction: Traditionally, HCI research and other disciplines adopted “satisfaction” as asubjective measure of the product quality, defined as an affective state that is the emotional reaction to aproduct or service experience [Oliver, 1980; Spreng, MacKenzie, & Olshavsky, 1996]. User satisfactionhas been recognized as a key measure of system success in the information systems area [Bailey &Pearson, 1983; Baroudi, Olson, & Ives, 1986]. Therefore, user satisfaction can be used as a surrogatemeasure for overall mobile phone quality.
[Balaji et al., 2005] itemize four components of a successful mobile product: Business model that fits the servise’snatural usage pattern; mobile phone that deliver new features aimed at customer needs; device-level applications thatleverage the new features; and the mobile content designed for utilization within mobile usage scenarios. According to[Ali-Vehmas and Luukkainen, 2005], the most influential factors determining service adoption include: complexity of theproduct and the service (including usability and configurability), compatibility with other relevant services and relativeadvantage of the new service compared to the original ways of doing the similar tasks.
4. DISCUSSION
The findings of the study support the fact that influencing factors [Social, Demographic, Culture, andTechnology], affects the behavior of the Generation X and Y in adoption and usage of mobile phones.
First, this study put forward the fact that Generation X are influenced in a great degree by social factors sincemobile phone satisfies their social needs, as social interactions are the main focus of human existence and mobilephones allow them to keep in touch with their family and friends. Then the other major factor that influence thisgeneration is the demographic factor where Generation X , which is composed of 29- to 42-year old people usemobile for safety and security purpose of their children’s and themselves. Generation X are also influenced bytechnological factor, where these generations choose to adopt a technology only when it fits in with their personalneed or desires. Some of the determinants that affect Generation X’s attitude towards using new technology are‘usefulness’ (the extent to which an individual perceives that using a mobile phone is beneficial to their lives) and‘ease of use’ (the extent to which a person believes that using the system will be free of effort).
Second, the study confirms that Generation Y the other major group of this study are influenced to a greater extentby social factors taking into considerations the fact that these generations see Mobile phones as fashion items whichindicates their status and power. Next, age has been the most widely applied demographic variable where the needs ofpeople vary according to their age group. Generation Y is a generation of 18- to 28-year olds, which mainly consist of
49

International Journal of Enterprise and Innovation Management Studies (IJEIMS) Vol. 1 No. 1
teenagers and young adults who mainly use mobile phones for accessibility, display and entertainment. The nextimportant factor that plays a crucial role in influencing Generation Y is technology as this generation sets the pacefor technology adoption. While technology matures, ring tones, cameras, GPS features, music, and multiple otherfeatures will be added to the hardware, the software on phones will progress to include easier web access,advertisements, news downloads, and easier chat and email features which makes the mobile phone a mini-computer. The other determinant of the technological factor that influence this generation is ‘pleasure of use’ whereGeneration Y feels, using a mobile phone is pleasurable in its own right.
In general, both Generation X and Y are commonly influenced by certain determinants, such as social factors inusage of mobile phones as it enables social interactions, which is a main focus of human existence. Since almost both thegenerations are literates mobile phone adoption is also influenced by education and income levels which is one of the maindimensions of the demographic factors that have been found to influence mobile phone adoption and usage. Culturalfactors have a significant impact on these generations as cultural usability aims to make technology fit in with the user’slifestyle. Since mobile phones do not cause worldwide convergences and homogenization in social behaviour, it is morelikely to emphasize differences rather than communalities between various population segments and ethnic culture, whichmakes culture as an essential part of understanding users and the factors that influence mobile phone usage. The othermain dimension of technological factor, which affect generation X and Y in common, is ‘association with satisfaction’where user satisfaction has been recognized as a key measure of system success in the information systems area andtherefore, user satisfaction is used as a surrogate measure for overall mobile phone quality.
5.CONCLUSION
Based on the findings of the study it is clear that, Generation X and Y consumers will most probably exhibitdifferent mobile phone usage patterns. This is in view with the fact that they are influenced by different factors butthey are similar to one another because of globalization. Generation X and Y are the most important demographicsshaping the landscape of consumer behaviour. The findings will indicate that this research will be a viable model forthe study of consumer behavior as it relates to mobile phones.
This study on knowing the factors that affects the adoption and usage of mobile phones between Generation X andY will enable marketers and advertising agencies to have a good rapport with these segments of population in apersonalized way to yield enormous results and more business opportunities. Understanding the way in which GenerationX and Y consumers have incorporated the mobile phone into their everyday lives will be of relevance for all futureapplications. Mobile Phone companies will ultimately succeed if they custom design their products and services in order toserve these unique segments of the market and if they tailor their companies around the Generation X and Y consumers.The growing number of studies finds cross-cultural similarities in mobile phone use by these generations
REFERENCES[1] Adomi, E. E. (2006). Mobile phone usage patterns. Electronic journal of Academic and special librarianship, Vol. 7:
1-11
[2] Ali-Vehmas, T., & Luukkainen, S. (2005). Service Diffusion Strategies for Push to talk over Cellular. InInternational Conference on Mobile Business (ICMB’05). 427-433: IEEE
[3] Ark, W. S., & Selker, T. (1999). A look at human interaction with pervasive computers. IBM Systems Journal,38(4):504-507.
[4] Bailey, J. E., & Pearson, S. W. (1983). Development of a tool for measuring and analyzing computer usersatisfaction. Management science, 29(5), 530-545.
[5] Balaji, T. S., Landers, B., Kates, S. J., & Moritz, B. (2005). A carrier’s Perspective on creating a mobilemultimedia service. Communications of the ACM, Vol. 48: 49-53
[6] Baroudi, J. J., Olson, M. H., & Ives, B. (1986). An empirical study of the impact of user involvement onsystem usage and information satisfaction. Communications of the ACM, 29(3), 232-238.
[7] Bina, M., & Giaglis, G. M. (2005). Exploring Early Usage Pattern of Mobile Data Services in Internationalconference on Mobile Business (ICMB’05):363-369: IEEE
[8] Campbell, S. W., & Russo, T. C. (2003). The Social Construction of Mobile Telephony: An application of theSocial Influence model to Perceptions and Uses of Mobile Phones within Personal Communication Networks.Communication Monographs, 70(4):317-334.
50

International Journal of Enterprise and Innovation Management Studies (IJEIMS) Vol. 1 No. 1
[9] Charles Golvin (July, 2008) – Forrester techno graphics benchmark survey - Gen Y a generation apartSource: Forrester Research Inc. – Forrester principal analyst).
[10] Cheskin (2001) the wireless future, a look at youth unplugged
[11] Coen, A., Dai, L., Herzig, S., Gaul, S., & Linn, V. (2002). The Analysis: Investigation of the cellular phoneindustry. Retrieved 2006/08/25 from, http://web.syr.edu/~spgaul/Final%20Essay%204.1.doc
[12] Davis, F. D. (1989). Perceived Usefullness, Perceived ease of use, and user acceptance of informationtechnology. MIS Quarterly, 13(3):319-340
[13] Davis, F. D., Bagozzi, R. P., & Warshaw, P. R. (1992). Extrinsic and intrinsic motivation to use computers inthe workplace. Journal of Applied Psychology, 22(14), 1111-1132.
[14] [Davis, Bagozzi et al. 1992] Davis, F. D., Bagozzi, R. P., Warshaw, P. R.: “Extrinsic and I n t r i n s i cMotivation to Use Computers in the Workplace”; Journal of Applied Social Psychology 22, 14 (1992), 1111 - 1132.
[15] ERIC BELLMAN. (Feb 9, 2009). The wall street Journal. Digital network - Rural India Snaps up Mobile Phones
[16] Ford, G. (2005). Researching the effects of culture on usability, Thesis (M.Sc) – University of South Africa,University of South Africa, Pretoria
[17] Geser, H. (2004). Towards a Sociological theory of the Mobile Phone. Retrieved 2006/03/21, fromfile:///C:/aPhD/ Referenced_Mobile /Geser.pdf
[18] Gilbert, A. L., & Kendall, J. D. (2003). A marketing model for mobile wireless services. Proceedings of 36th Annual
Hawaii International Conference on System Sciences (HICSS’03), 3(Track 3)[19] Green, N., Harper, N. H. R., Murtagh, G., & Cooper, G. (2001). Configuring the mobile user: sociological and
industry views. Personal and Ubiquitous computing, 5(2):146-156
[20] Ho, S. Y., & Kwok, S. H. (2003). The Attraction of Personalised Services for users in mobile commerce: Anempirical study. ACM SIGecom Exchanges, 3(4):10-18
[21] Hofstede, G. (1995). The business of international business in culture. In Cross-culturalmanagement,T.Jackson(Ed):150-154.London: Butterworth-Heinemann.
[22] Hofstede, G. (2001). Culture’s Consequences: Comparing Values, Behaviours, Institutions and OrganisationsAcross nations 2 nd ed. Thousand Oaks, CA: Sage Publications Inc.
[23] Hoft, N. (1996). Developing a cultural model. In International user interfaces, E. del Gado and J. Nielsen (Eds.): 42-
72. New York: John Wiley and Sons.[24] Humphreys, L. (2005). Cell phones in public: social interactions in a wireless era. News Media & Society, 7(6):810-
833
[25] Jennifer Netherby July 24, 2008 Gen Y lead the Way on Technology Use ––The State Of Consumers AndTechnology: Benchmark 2008 Source: Forrester Research Inc. – Forrester principal analyst
[26] Jones, M., & Marsden, G. (2005a). Mobile Interaction Design Hoboken, NJ: John Wiley and Sons. In theproceedings of the 7th international conference on Human computer interaction with mobile devices andservices, 111(369-370). Salzburg, Austria: ACM Press, New York, NY
[27] Judy van Biljon & Paula Kotzé (2008). Cultural Factors in a Mobile Phone Adoption and Usage ModelJournal of Universal Computer Science, vol. 14, no. 16 (2008), 2650-2679 submitted: 9/7/07, accepted:15/10/07, appeared: 28/ 8/08 © J.UCS
[28] Katz, J. E., & Sugiyama, S. (2005). Mobile phones as fashion statements: The co-creation of mobile communication’spublic meaning. In Mobile communications: Re-negotiation of the social sphere, R. Ling & Pedersen (Eds.):63-81. Surrey, UK: Springer
[29] Khalil, A., & Connelly, K. (2005a). Context-Aware Configuration: A study on improving Cell Phone Awareness.
Lecture notes in Computer Science: Modeling and using context, 3554:197-209, Springer-Verlag.
[30] Kim, J. H., & Lee, K. P. (2005). Cultural differences and mobile phone interface design: Icon recognition
according to level of abstraction. Paper presented at the proceedings of the 7th international conference on Human-Computer Interaction with mobile devises and services, 111: 307-310, ACM Press, New York, NY, USA.
51
International Journal of Enterprise and Innovation Management Studies (IJEIMS) Vol. 1 No. 1
[31] Kleijnen, M., Wetzels, M., & De Ruyter, K. (2004). Consumer acceptance of wireless finance: Journal ofFinancial Services Marketing, 8(3):207-217
[32] Kwon, H. S., & Chidambaram, L. (2000). A test of the technology acceptance model: The case of cellular telephone
adoption. In proceedings of the 33rd Hawaii International Conference on System Sciences, 1 (1-10). Hawaii:IEEE Computer Society.
[33] Ling, R. (2001). The diffusion of mobile telephony among Norwegian teens: A report from after the revolution (No.
Presented at ICUST). Paris: Telendor R&D
[34] Ling, R., & Haddon, L. (2001, 18-19 April). Mobile telephony, mobility and the coordination of everyday life.Paper presented at the Machines That Become Us, New Brunswick, New Jersey: Leto
[35] Michael Dinan (July 21, 2008) TMCnet Editor - Forrester Report Details IT Use among Gen X, Y Members.
[36] Nickerson, R. C., & Isaac, H. (2006). “Am I disturbing you?” A research model for investigating the use ofmobile phones in social settings. In Proceedings of the International Conference on Mobile Business, 1(1):35:IEEE Computer Society.
[37] Oliver, R. L. (1980). A cognitive model of the antecedents and consequences of satisfaction decisions.Journal of Marketing Research, 17(November), 460-469.
[38] Page, C. (2005). Mobile research strategies for a global market. Communications of the ACM, 48(7):42-48
[39] Palen, L., Salzman, M., & Youngs, E. (2000). Going wireless: behaviour & practices of new mobile phone users.Paper presented at the proceedings from the 2000 ACM Conferences on Computer Supported cooperative work.,Philadelphia, Pennsylvania:201-210, ACM Press.
[40] Pedersen, P. (2003). Adoption of mobile Internet services: An exploratory study of mobile commerce earlyadopters. Journal of Organisational Computing and Electronic Commerce, 15(3):203-222
[41] Rogers, E. M. (2003). Diffusion of Innovation 5th ed. New York: The Free Press
[42] Schofield A, Sithole H, Universal Service Agency Achievement of the Telecommunication Act ObjectivesAnalysis of the extent to which the objectives of the telecommunications Act (103 of 1996), as amended wereachieved (in the period 1997 to 2004) Last Accessed Jan 2006 [Online]. Barendense, A 2003, ‘Innovativeregulatory and policy initiatives at increasing ICT connectivity in South Africa’, Journal of Telematics andInformatics, vol.21, no 1, pg 49-66
[43] Silverstone, R., & Haddon, L. (1996). Design and Domestication of information and communicationtechnologies: Technical change and everyday life. In Communication by Design: The Politics of Informationand Communication Technologies, R. Silverstone and R. Mansell (Eds.): 44-74. Oxford: Oxford University.
[44] Sun, H. (2004). Expanding the scope of Localization: A cultural usability perspective on mobile text messaging use
in American and Chinese Contexts, Doctoral dissertation, Rensselaer Polytechnic Institute, New York.
[45] Spero, I. & Stone, M. (2004) Agents of change: how young consumers are changing the world of marketing.Qualitative Market Research 7(2): 153-159.
[46] Spreng, R. A., MacKenzie, S. B., & Olshavsky, R. W. (1996). A reexamination of the determinants ofconsumer satisfaction. Journal of Marketing, 60(July), 15-32.
[47] Teo, T. S. H., & Pok, S. H. (2003a). Adoption of the internet and WAP-enabled phones in Singapore.Behaviour & Information Technology, 22(4):281-289, Taylor&Francis
[48] Urbaczewski, A., Wells, J., & Sarker, S. (2002). Exploring Cultural differences as a means for understandingthe Global Mobile Internet: A theoretical basis and program of research. Paper presented at the proceedingsof the 35th Hawaii International Conference on System Sciences: IEEE computer society.
[49] Venkatesh, V., Morris, M. G., Davis, G. B., & Davis, F. D. (2003). User acceptance of information technology:
toward a unified view. MIS Quarterly, 27(3):425-478.
[50] Wei, R., & Lo, V. (2006). Staying connected while on the move: cell phone use and social connectedness.News media & Society, 8(1):53-72
[51] Wilska, T. (2003). Mobile Phone Use as Part of Young People’s Consumption Styles. Journal of Consumer
Policy, 26(4):441-463.
52
International Journal of Enterprise and Innovation Management Studies (IJEIMS) Vol. 1 No. 1
MULTI-DIMENSIONS OF UNIT LINKED INSURANCE PLAN AMONGVARIOUS INVESTMENT AVENUES
1S. SARAVANAKUMAR and Dr. A. MAHADEVAN1Research Scholar & Assistant Professor, Department of Management Studies JKK Nataraja College of Engineeringand Technology, Komarapalayam, Namakkal-638183, Tamilnadu, India. E-Mail : [email protected]
2Assistant Professor & Head, Department of Management studies, Excel Business School,Komarapalayam, Namakkal-637303, Tamilnadu, India.
ABSTRACT
Unit linked insurance plan, simply called as ULIP, is a new kind of life insurance product that gives the benefitthe of life insurance protection and comprise the features investment. The premium invested in unit linkedinsurance plan is subdivided into units and invested in the funds selected by the policyholder; such part is calledas Net Asset Value (NAV). The fund value under this policy varies according to the market movement of theportfolio. After deducting the allocation charges and all other contingency costs from the premium, theremaining portion gets invested in the units. Unit is the component in a fund; a fund consists of many companiesusually called as portfolio. Hence the return from this unit linked insurance plan depends upon the portfolioperformance in the market. Generally ULIP policies contain several funds i.e, diversified funds, equity funds,debt funds, money market funds, growth funds, income funds etc. it is varied from company to company. Plentyof benefits are associated with this policy but the important consideration is the risk in the investment portfolio isgenerally borne by the policyholder. ULIPs are designed with lot of innovative ideas and different from thetraditional insurance plans. It provides flexibility in the life protection, investment and savings, adjustable lifecover, fund options, transparency in charges, options to take additional cover against death due to accident ordisability and liquidity through partial withdrawals etc. it is not possible in traditional package plans.
Key words used - Unit Linked Insurance Plan, flexibility, fund options, diversification, professional fund management,
fund switching, reinstatement of policy, rider options, foreclosure of policy, Top-up, free look period.
I.INTRODUCTIONANDNEEDFORTHESTUDY
There is a bewildering range of investment avenues available for the investing community, varied fromfinancial assets to physical assets. Both the asset class has its own features. Among the two investment outlets,insurance is an inevitable tool, and no financial product can rival against insurance. Before the year 2001, insurancewas sold in the form of term, endowment, whole-life, and money-back policies by the monopoly insurer LIC. Afterthe entry of private players in 2001 and growth of equity prices captured the attention of all investors to insurancesegment. Traditional plans do not offer the return in the line of equity market. In order to satisfy existing customersand to capture more prospects, the life insurers introduced some plans with innovative features to strengthen andmaximize premium income. Such kind of innovative ideas comes in the form of Unit Linked Insurance Plan. Theprivate sector life insurance companies added extra fuels in this arena.
A unit-linked insurance plan is a multi-featured product that combines the benefit of insurance, risk sharing andinvestment. The investment in a unit linked insurance plan works like a mutual fund and does not come with guaranteedreturns, unlike money back, whole-life or endowment policies. Hence a unit linked insurance plan combines the features ofinvestment and life protection. The premium of the customer can fetch life insurance cover and a part of it gets invested inspecific investment funds of the customers’ choice in the form of units. A Unit is the component of the fund and itsperformance is depends upon the performance of capital market. Under this plan, the policyholders have the choice ofinvesting their premiums in a single premium / regular or limited premium mode and in addition to that monthly,quarterly, half-yearly and annually payment method is extended to regular and limited premium payments. The premiumalteration is also allowed in the tenure of the premium payment period. For example, the customers of this plan areallowed to park their excess money in this scheme. Conversely, if any policyholder faced liquidity problem, it is allowedto pay lower premium. Shifting of the funds from one fund to another funds or fund options.
53

International Journal of Enterprise and Innovation Management Studies (IJEIMS) Vol. 1 No. 1
II.HOWULIPSDIFFERSFROMTRADITIONALPLANS?
Unit linked insurance plan and traditional plans work very differently. While the risk is borne by the insurer incase of a traditional plan, but in case of unit linked insurance plan it is borne by the customer. The traditional planmixes insurance and investment and assures the customer a certain sum at the end of given period. It includes sumassured and vested bonus. If the customer does not survive the policy term, the policyholder family gets the sumassured plus bonuses. Traditional plans are best for those with low financial discipline. They can consider includingendowment plans in their insurance portfolio. For such investors, many private sector insurers have innovations thathave worked on features, bonus payments structuring and riders. In an endowment plan, the big change has been inthe structuring of bonus payments. Reversionary bonus is accumulated until the death or maturity of the life insuredand paid whichever takes place first. The non-reversionary bonus if the policyholder is allowed to encash it.
Premiums in excess of the risk cover are invested as per the choice of the policyholder and go to a common fundand are then invested as decided by the insurer unlike in a unit linked insurance plan, where the return or the yield dependson the movement of the market and the risk is to be borne by the policyholder. The premium paid by the policyholder, netof premium allocation charge is invested in fund(s) chosen and units are allocated depending on the price of units for thefund(s). The fund value is the total value of units that the policyholders hold in the fund(s).
III.ULIPANDITSMULTI-FACE
Now the unit linked insurance plan satisfies the needs of all segments, child, adult and senior citizens. It servesas child plan, protection plan, savings plan, protection against loan, pension plan, etc., to the investing community.The unit linked policy gives varied benefits to the life insured and it includes, life protection, investment andsavings, flexibility, adjustable life cover, fund options, transparency in charges, options to take rider cover againstdeath due to accident or disability or critical illness, liquidity in the form of partial withdrawals, switching etc. Whileconsidering the long term, unit linked insurance plan gives higher return than the traditional package. However, theunit linked plan customers to bear in mind that higher return come with greater risks.
IV.HOWDOESULIPWORK?
Vimal is a thirty-year old, he interested to invest in a unit linked insurance policy. He interested to invest Rs.100 per year for 10 years subsequently in an equity fund. Based on this premium, the sum assured works out to Rs1000. Based on the current NAV of the plan that Rajeev chooses to invest in, he is allotted units in the scheme.Then, the charges are deducted by canceling the units in the investment portfolio.
The charges in the first year include a 20 per cent premium allocation charge, and policy administration chargeof Rs. 5 p.a. along with other charges, which are deducted monthly. Besides, mortality charges or the charges for thelife cover are also deducted. Fund management fee and brokerage are also charged. This cost is built into thecalculation of net asset value.
On maturity - that is, after 10 years - Rajeev would receive the sum assured of Rs. 1543.45 or the market valueof the units whichever is higher. Assuming the growth rate in the market value of the units to be 6 per cent perannum, Rajeev would receive Rs. 1231.05; assuming that if the growth rate is 10% as per the IRDA regulation,Rajeev would receive Rs. 1543.45.
In case of Rajeev’s untimely death at the end of the ninth year, his beneficiaries would receive the sum assuredof Rs. 1231.05 or the market value of the units whichever is higher. Assuming the growth rate in the market value ofunits is 6 per cent per annum, the value of investment would be Rs. 1214.15
Sample Benefit Illustration
Name : Vimal Age : 30 Gender : M
Proposal No. : 10000001 Policy No. : 123456789
Sum Assured : Rs. 1000 Policy Term : 10 Years Premium term : 10 Years
Fund opted for : Equity fund Mode of Premium Payment : Yearly Amount of Premium : Rs. 100
54

International Journal of Enterprise and Innovation Management Studies (IJEIMS) Vol. 1 No. 1
Statement of various charges along with growth of the fund expected over the duration of the policy withassumed rate of interest is mentioned (All charges in Rupees)
Polic
y Y
ear
Ann
ual p
rem
ium
Prem
ium
alloc
ation
charg
e
Inve
stmen
tAmo
unt
Polic
yAdm
inist
ratio
nCha
rge
Mor
talit
y C
harg
eFu
ndM
anag
emen
tCha
rge
Fund
Val
ue
Surr
ende
r V
alue
Dea
th B
enef
it
Mor
talit
y ch
arge
Fund
Man
agem
entC
harg
e
Fund
Val
ue
Surr
ende
r V
alue
Dea
th B
enef
it
1 100 20 80 5 2.00 1.00 76.80 NA 1000.00 1.89 1.23 79.88 NA 1000.00
2 100 20 80 5 1.80 1.25 161.55 NA 1000.00 1.78 1.32 185.68 NA 1000.00
3 100 5 95 5 1.68 1.35 285.25 285.25 1000.00 1.65 1.46 312.58 312.58 1000.00
4 100 2 98 5 1.54 1.40 410.25 410.25 1000.00 1.58 1.57 489.25 489.25 1000.00
5 100 2 98 5 1.20 1.45 589.25 589.25 1000.00 1.15 1.62 611.25 611.25 1000.00
6 100 2 98 5 0.89 1.50 789.85 789.85 1000.00 0.95 1.64 825.65 825.65 1000.00
7 100 2 98 5 0.55 1.55 912.57 912.57 1000.00 0.59 1.72 985.34 985.34 1000.00
8 100 2 98 5 0.00 1.60 1058.69 1058.69 1058.69 0.00 1.89 1198.69 1198.69 1198.69
9 100 2 98 5 0.00 1.65 1214.15 1214.15 1214.15 0.00 1.95 1354.73 1354.73 1354.73
10 100 2 98 5 0.00 1.75 1231.05 1231.05 1231.05 0.00 2.08 1543.45 1543.45 1543.45
INTHISPOLICY,THEINVESTMENTRISKISBORNEBYTHEPOLICYHOLDERANDTHEABOVEINTERESTRATES
AREONLYFORILLUSTRATIONPURPOSE
Signature of Policyholder Signature of the Sales Representative Date Place
Source: bajajallianzlife.co.in
V. MULTI-DIMENSIONS OF ULIPs
1. Protection for LifeUnit linked insurance policy gives maximum life insurance cover to the life insured, usually 50 times or 100
times of premium size is considered for life protection cover. It enable the life insured to secure protection for theirfamily in the event of untimely death and simultaneously provides the life insured, an opportunity to earn a return onthe premium paid towards this policy. In the event of the life insured untimely demise, facilitates to the nominees toreceive an amount that is the higher of the sum assured or the value of the funds in case of Type – I policies and insome cases under type – II policies both amount will be given.
2. FlexibilityThere are three types of Unit Linked Insurance Plans in two category, selling in the insurance market – single premium
(SP), limited premium (LP) and regular premium (RP). In the single premium policy, a single lump-sum premium payment isallowed to pay. The life cover (sum assured) is the minimum of 125% and maximum of 500% of the premium. But under incometax rules, if the premium paid for a policy is more than 20 percent of the sum assured in a year, and then deduction from taxableincome will be allowed only up to 20% of the sum assured. In other words, to get the entire premium deducted from taxableincome under section 80C, make sure the cover is at least five times the premium. In LP/ RP plans premium payments are madein the form of annual, semi-annual, quarterly and monthly. The life cover starts with a minimum of five times of annual premiumand maximum subject to the limit prescribed by underwriters. The customers are allowed to choose the sum assured according totheir premium size and their income earning capacity as prescribed by the insurance act. The sum assured is the death cover; itprotects the unfortunate demise of the policyholder.
The existing structure of all Unit linked plans from any insurer allows two variants. But, this variation is applicable
only in the event of death of the policyholder. Under one variant, called Type-I Ulips, if the individual dies during the
55

International Journal of Enterprise and Innovation Management Studies (IJEIMS) Vol. 1 No. 1
term of the policy, the dependant or nominee receives the sum assured or the value of the fund which is higher. Inthe other variant, called Type-II Ulips, dependants receive both the sum assured and the value of the fund, makingthe amount larger. In both the variants, the maturity value or the benefit on surviving the term of the policy remainsthe same – value of the fund as per returns from the market.
3. Safety of CapitalThe Unit linked schemes offer different types of guarantees. In some of them, the amount of premiums paid minus
the total charges is guaranteed at maturity of the policy or death during the policy term. In others, a return on the premiumpaid is guaranteed to the investor. In few others, the entire first year premium is paid back on maturity along with certainadditions. The top-up amount paid is also guaranteed as per the basic premium. At present, some insurance companiesoffer, return shield option to some plans, if this option is opted, the return earned on basic policy and top-up premium paidduring the month will be transferred to Return Shield Fund at the end of the month. The capital guarantee and return shieldoption safeguards the capital as well as the monthly return earned in the market. But all such value added services comeswith a cost to the customers. Hence here safety assured for the premium invested.
4. Fund Options and its risk profileThere are a lot of fund options that insurers provide to customers, these range from pure equity to pure debt
and money market funds and can be chosen to suit investment objectives, risk profile and time horizons. Differentfunds have different risk profiles. The potential for returns also varies from fund to fund.
The following are some of the common types of funds available in the market. The risk-return characteristic ofeach of these funds is also indicated here.
Equity Funds/ Sector Based Funds : These primarily invest in company stocks with the general aim ofcapital appreciation. The risk-reward ratio is high in these funds.
Balanced Funds : These funds combine equity investment with fixed interest instruments. The risk-rewardratio is medium in these funds.Debt Funds : These invest in corporate bonds, government securities and other fixed income instruments. Therisk-return is moderate to this fund
Cash or Money Market Funds : These invest in cash, bank deposits and money market securities. Risk andreturn level is low to this fund.
There may be other fund options, but they are broad combinations of the above-mentioned asset classes.Returns on any of these fund options are not guaranteed and the investment risk is borne by the policy owner.Depending upon the performance of the funds selected by the life insured, the policy enjoys gains or loss on itsinvestments. It is also important to know, the past performance of a fund is not an indication for future.
5. Switching FacilityThe policyholder can switch some or all of the fund value between different unit-linked funds or fund options.
The company will give effect to the switch by canceling units in the existing fund and allocating units in theproposed new fund at the next following unit price. At a maximum of 52 free switches are offering some insurers inthe market, switches beyond this limit will attract fixed fees. The fund switching request received before 3.00 p.m.in a day, the closing NAV price of the day shall be applicable. Otherwise the closing NAV price of next businessday shall be applicable. The free switches of one year not allowed carrying forward to next year.
6. Diversification and Professional Fund ManagementOne of the biggest benefits of unit linked plans is that they provide the means for individual investors to
achieve broad diversification in their investment portfolios. Diversification is process of spreading the investment innumerous assets. Ulips are large diversified portfolios and thus provide automatic diversification within theirrespective asset classes ranging from equities to fixed income securities. This scheme will spread the funds ofinvestor across a variety of asset classes; this activity increases the diversification size and decrease the market risk.A well stated diversification greatly reduces and can even eliminate the specific risk. The funds of unit linked plansgenerally administered by the professionally trained and well experienced fund managers. The fund manager duty isto analyze the potentiality to earn profit from the shares and employs the suitable portfolio techniques to preservethe funds invested by the policy owners.
56

International Journal of Enterprise and Innovation Management Studies (IJEIMS) Vol. 1 No. 1
7. Flexibility of Premium HolidayMany private insurers offer this service to its customers, if the policyholder unable to pay premiums after paying all
the due premiums for three consecutive years, the policy will not lapse immediately but the policyholder will be put on apremium holiday of two years to pay any due but unpaid policy premiums. During these two years, all applicable chargesshall continue to be deducted from the fund value till the surrender vale falls to one regular annual premium. If thepolicyholder failed to recommence paying premiums within two years from the date of the first unpaid regular premium,the owner of the policy may write to the company to continue the policy, on policy continuation option subject to thecompany approval (this facility available in Tata-Aig Life insurance company). Upon such request from the policy owner,the policy will be continued so long as the fund value does not fall below an amount equivalent to one annual regularpremium. If failed to inform, the company may return the surrender value.
8. TransparencyThe main feature of Ulips is their flexibility. ULIP policy provides transparency in insurance protection, fund
investment, alteration in life insurance cover, varied fund options and the charges. Also the premium proceeds areinvested as per the policyholder instruction and charges are informed through benefit illustration at the time ofmaking application.
9. Partial Withdrawal & SurrenderHere liquidity is possible through partial withdrawal and surrender of the policy. Unit linked plans are allowing its
customers to make partial withdrawals and after 3 years from inception. There would be a 3 years lock-in period on thebasic plans and top-up premiums paid; if any. The minimum partial withdrawal is allowed from Rs. 5,000 and themaximum limit does not exceed 20% of the fund value at the time of withdrawal. The policyholders are allowed tosurrender the policy after completing 3 policy years. Some plans attract cost for this surrender in initial years.
10. Foreclosure of PoliciesForeclosure is allowed in respect of fully paid up policies (regular premium policies wherein all the premiums
during the premium payment period have been paid) and policies under which the premium is being paid, if the fundvalue in a particular point of time is less than the mortality and policy administration charge of the next month, thepolicy will be foreclosed by paying the fund value immediately.
11. Grace PeriodIf the policyholder has failed to make the payment of Limited Premium/ Regular Premium due before the due
date, the company shall give a grace period of 30 days for premium frequencies other than monthly and 15 days formonthly premium mode. If premium of the policy are not paid within the days of grace, it is considered as lapse.
12. Reinstatement – revival of lapsed policyIn Ulips, the policyholders have the option of discontinuing of premiums. Unlike traditional plans, they may
not pay the premiums for the entire term in these plans. However, the effect of stopping payment of premiums isdifferent depending on whether premiums have been paid in the first three years. Here are some of the possibilities.
Discontinuance within three years of commencementIf the premium has not been paid for at least three consecutive years from the inception of the policy, the insurance
cover shall close down immediately. The policyholder provided an opportunity for revival within the period allowed; if thepolicy is not revived within that period, surrender value shall be paid at the end of the period allowed for revival.
Discontinuance after three years of commencementIf the policy is not revived, at the end of the period allowed for revival, the contract shall be terminated after
the surrender value is paid to the policy owner. But in certain cases, the insurance company may offer to continuethe insurance cover with the levy of same mortality cost. It is continuing up to when the fund value reaches anamount equivalent to full premium of a year.
13. Guaranteed additions or bonusThis, as a percentage of premium or fund value added to the policyholder kitty at fixed interval. Some insurers offer
1 per cent of the fund value every year from the sixth year onwards and some insurer’s offer 50 per cent of first year’sbasic premium at interval of every five years from 10th year till policy is in force. Most of the guaranteed additions or
57

International Journal of Enterprise and Innovation Management Studies (IJEIMS) Vol. 1 No. 1
loyalty bonus begins after the completion of five year and it ensures the policyholder stay for a long-term. Theguarantee bundled with these policies comes at cost. The guarantees are denied in case of death or lapse orpremature surrenders. Also choosing higher term can add more guarantees to the fund value. Usually these areattached to the fund performance; the bad market swing will not give such additions.
14. Rider OptionsRider is a condition that is added on a basic policy providing an additional benefit, with lowest cost. For
example, if accidental death rider selected, the sum assured would be double at the event of death of the life insured.Riders can be with regard to additional payments on disability or sickness, or waiver of future premiums, partly orfully, under certain conditions. Today insurers find it convenient to have a small number of basic plans, with ridersbeing offered as options, so that effectively the prospect has a number of options to choose from. Some of the ridersbeing offered by insurers in India are the following:
Term life insurance benefit rider: It provides additional death benefit cover in case of life insured death,
depending on the sum assured selected under the rider but usually not allowed to exceed basic policy sum assured.
Accidental death and Total and Permanent Disability rider: It enables additional death/disability benefitcover, if death/disability caused to the life assured as a result of an accident.
Premium Waiver rider : This is allowed in juvenile policies, if the parent dies before maturity date or in thecase of permanent disability and sickness caused to the parent. The policy continues by paying premium by theinsurance company.
Critical Illness rider : As against to some ailments like cancer, cardiac or cardiovascular surgeries, stroke,kidney failure, major organ transplants, and major burns, total blindness caused be illness or accident, this riderwill compensate the loss up to the rider cover limit.
Major surgical benefit rider : It gives lump sum amount to cover surgical expenses from disease like, OpenHeart Surgery, Kidney Transplant, Cornea Transplantation, Transplant of Lungs and many more.
15. Tax BenefitsLife insurance plan offers two kinds of tax benefits at the entry and exit stage. At the time of making
investment in insurance, the customers are provided three types of tax benefits according to the plan selection. Thefirst is, as per section 80C of Income Tax Act, life insurance premium shall qualify actual premium paid or 20% ofsum assured whichever is less. Sum assured shall not include bonus or any premium agreed to be returned. It alsoextended to the lives of spouse and children policies. Section 80CCC allows a maximum of Rs. 10,000 for deductionwhile computing tax liability, but it only applicable for pension or annuity plans. Contribution made to medicalinsurance premium or rider cover can fetch a maximum benefit Rs. 10,000. This benefit is enhanced to Rs. 15,000for senior citizens. The proceeds at the maturity are completely exempted from the tax under section 10 (10D).
16. Top-upIf the policy permits, the policyholder can invest additional contribution over and above the regular premium, this
known as top-up facility. Top-ups are normally used to increase the investment portion of plans without any change in theinsurance cover. The top-up amount is treated as a premium and is subject to a lock-in period of three years.
17. Free look PeriodIn case the policy holder disagrees or dissatisfied with any of the terms and conditions of the policy, he may
return the policy to the insurance company within the 15 days of receipt of the policy document. The companymakes refund of the premium paid after deducting mortality charges for that coverage period and the expensesincurred on medical examination for health check-up and stamp duty charges. The prevailing net asset value is paidas the refund value to the policyholder.
18. Settlement OptionUsually the maturity proceeds are paid in the form of lump sum amount, here the ULIP has a special privilege
and the customers are allowed to take their maturity proceeds in the form periodical receipts. While making proposalto the insurance company, the life insured can select this settlement option. On maturity the fund value directed todebt fund and it is paid equal installments for a period of 5 years. During this settlement period, there will be no lifeinsurance cover provided to the life to be insured.
58

International Journal of Enterprise and Innovation Management Studies (IJEIMS) Vol. 1 No. 1
19. Expenses Charged in a ULIPIt is important to know the other side of ulip; it attracts high cost while comparing with other outlets.
Insurance companies allot units on the portion of the premium remaining after providing for various charges anddeductions. Broadly, the different types of fees and charges are given below. However, it may be noted that insurershave the right to revise fees and charges over a period of time.
19.1. Premium Allocation ChargeThis is a percentage of the premium paid towards charges before allocating the units policy owner. Premium
allocation charge normally consists, underwriting charges, medical examination cost and the commission paid to theagents of the insurance company. The Actuarial funded policies will fetch up to 100% of the first year premium aspremium allocation charge. The ordinary policies attract a maximum of 30% as premium allocation charge in thefirst year and the second year onwards the premium allocation charges ranged from 1% to 15%. It is depends uponthe term and size of premium and varies from company to company.
19.2. Mortality ChargesThis provides for the cost of the insurance cover under the plan. Mortality charges levied on the basis of age of
the life to be insured, amount of sum assured and state of health of the life insured. Initially, the mortality charge isapplied on the entire sum assured. Over a period of time, as the fund value increase, mortality expenses decrease.This is because the mortality is actually charged on the difference between the sum assured i.e. life insurance coverand the fund value. This concept is popularly known as the sum at risk.
19.3. Fund Management FeesFund management is comes with a nominal cost and the same is deducted monthly basis by cancellation of
units. It is the fee charged for managing the pool of funds, the most important charge in an ULIP is the fundmanagement charge. The lesser charge is better for the fund value growth. The fund management charge varied from0.95% to 2.00% according to the funds selected by the policyholder.
19.4. Policy Administration ChargeIt is levied for administration of the plan and deducted by cancellation of units. It is deducted from the fund
value and not from the premium paid by the policyholder. This is charged at flat rate throughout the policy term andsometimes varies as per the conditions specified under a policy.
19.5. Surrender ChargeThe surrender charge is deducted in the case of premature of policy, partial withdrawal and full encashment of
units (surrender). Usually, Ulips do not charge this if the policy has run for at least 10 years. It is mainly expressedas a percentage of the fund value prevailing at the time of surrender.
19.6. Fund Switching ChargeFund switching allowed with certain conditions some policy offers, limited number of fund switches among the
different funds without any fee for a policy year. Then a minimum cost like Rs. 100 or more levied for subsequentswitches. Now this switch is allowed through online in addition to offline request by filling up requisite forms.
19.7. Service Tax DeductionsThe appropriate service tax is deducted from risk portion of the premium before allotting of units to a policyholder.
19.8. Other ChargesThese are deducted by canceling the units and include charges for the basic life insurance cover, premium
redirection and other add-on rider benefits. The amount to be charged will depend on the level or type of insurancecover chosen as well as other factors, such as age, sex and smoking status.
After deducting all charges including mortality charge is utilized for purchasing units. Ulips are usually moretransparent that other plans in disclosing the charges levied. On a fixed interval – usually one policy year – thepolicy statement is sent to the policyholder and it contains all the charges deducted so far.
59

International Journal of Enterprise and Innovation Management Studies (IJEIMS) Vol. 1 No. 1
VI.CONCLUSION
The purpose of purchasing life insurance is to replace an income that is lost when the income earner dies. Everyinvestment have some benefits, some investments like bank deposits, provident funds offer fixed rate of return without anyrisk. Many investments like mutual funds, equity shares, and derivatives of stock, currency and commodity, venturecapital funds, real estate properties give high return but the risk profile also very high. But among the various investmentalternatives, none of the asset can compensate for the unfortunate demise of the investor. Life insurance ensures lifeprotection in the form of sum assured to the diseased person’s nominee along with the fund value. If the policyholdersurvives until the maturity, the maturity proceeds are definitely high. The Unit Linked Products are bundled product thatcombines life insurance protection and investment. ULIPs offer the double benefits of providing life protection cover andsystematic investment. They are more flexible than other financial and real assets and also ensures maximum transparent.Now many life insurer offers with minimum premium of Rs. 4000, it is the cost effective way and suitable vehicle forgenerating wealth to the low income caters. Before going to invest in market linked plans, the first things that the investorsneed to set a financial goal – retirement, securing children’s future, buying a house. This will give exact idea aboutselecting right plan. It is optimum and advisable to include unit linked insurance plan in the investment portfolio.
REFERENCES1. Ajay Sharma, Unit linked insurance plan and equity market, Seminar paper presented in Industrial Park,
Mumbai 2006.
2. Balachandran.S, IC 33 - Life Insurance, Insurance Institute of India, June 2006.
3. Chakravarthi.D, Marketing of Unit Linked Insurance Plan in India, Reliance Life Insurance Company limited. 2008.
4. Elias T Paul, Life insurance and it benefit to investors, Journal of Business and Finance, 89-111, 1998.
5. Sivaprakash.R, Multi-Role of ULIP in Life Insurance, RLIC, 2008.
6. Sunil Dhawan, Best ULIPS, Outlook Money, December 17, 2008.
7. www.hdfcinsurance.com
8. www.reliancelife.com
9. www.birlasunlife.com
10. www.bajajallianzlife.co.in
60

International Journal of Enterprise and Innovation Management Studies (IJEIMS) Vol. 1 No. 1
IMPACT OF TRANSFORMATIONAL LEADERSHIP OFENGINEERS WORKING IN AUTOMOBILE SECTOR IN
INDIA ON THEIR OWN CREATIVITY
1PANKAJ SHARMA and 2Prof S C PATHAK1Pankaj Sharma , Research Scholar, MNIT, Jaipur
2Prof S C Pathak,Deptt of Mechanical Engineering, MNIT, Jaipur
ABSTRACT
To create competitive advantage, leaders must commit to bringing all members in an organization into a truepartnership in the innovation process. Those who have studied creative process understand that latent abilitiesare present in an individual. Children usually pick their own team leaders naturally and almost all of them showcreativity in one form or another. Leadership is about the ability to lead. It is about creating the vision,structures, systems, trust and clarity that inspire people in the organization to achieve its strategy and apply theircreativity to the things they do in their work.
Creative thinking and Leadership are in such high demand in business today that we need a clear understanding ofhow they are related. We need to discover the latent factors playing important roles in creative leadership. This paper isan empirical study of engineers in automobile sector to understand the latent factors which predominantly reflectleadership traits represented by Charismatic, Inspirational, Intellectual Stimulation & Individual Consideration andcreativity traits represented by Idea Fluency, Originality, Creative Flexibility & Problem Sensitivity.
Keywords - Creativity, Transformational leadership, factors, Automobile Industry
1. INTRODUCTION
Organizations, especially technologically-driven ones, need to be more creative and innovative than before tosurvive, to compete, to grow, and to lead (Jung et al., 2003; Tierney et al., 1999).[1] To create competitive advantage,leaders must commit to bringing all members in an organization into a true partnership in the innovation process.Those who have studied creative process understand that latent abilities are present in an individual. Childrenusually pick their own team leaders naturally and almost all of them show creativity in one form or another.Leadership is about the ability to lead. It is about creating the vision, structures, systems, trust and clarity that inspirepeople in the organization to achieve its strategy and apply their creativity to the things they do in their work.
1.1 Literature SurveyConsiderable evidence indicate that employee creativity can fundamentally contribute to organization and innovation,
effectiveness and survival (Ambalie 1988, Madjar, Oldham & Pratt, 2002, Shally, Gilson & Blum, 2000, Zhou & Shally, 2003)[2]
Many organizations rely on employee creativity for competitive advantage, adaptation and survival (Nonaka,1991; Zhou, 2003).[3] Not surprisingly then, understanding the dynamics of creativity in organizations is a highpriority for research in organizational behavior. [Zhou & Shalley 2008] [4]
Some researchers believe that employee creativity will flourish when a supervisor provides transformational
leadership (Shin & Zhou, 2003)[5] and when employees have a learning orientation (Redmond, Mumford, & Tech, 1993).[6]
Jaussi and Dionne (2003) found little empirical support for the notion that transformational leadership positivelyinfluence creativity in a laboratory study with student subjects. However, in the first field study of transformationalleadership and employee creativity, Shin and Zhou (2003) reported that the two related positively. [7]
Researchers have studied the effect of transformational leadership on the performance of followers and organizations in
the past decade (e.g., Dvir et al, 2002, Howell and Avolio, 1993; Lowe et al, 1996).[8] Several studies report that transformational
leaders empower their followers (e.g. Jung and Sosik,2002)[9] and establish an innovative climate (Jung et al, 2003).
Literature survey suggests that most of the Researchers are interested in finding influence of various leadership styleon followers creativity rather than investigating relation between leadership style and creativity of same individual. Thisstudy investigates the impact of transformational leadership of Engineers working in automobile sector in India on
61

International Journal of Enterprise and Innovation Management Studies (IJEIMS) Vol. 1 No. 1
their own creativity. However, available research does not examine the effect of components of transformationalleadership on creativity of Individual.
1.2 Transformational LeadershipTransformational Leadership involves anticipating future trends, inspiring followers to understand and
embrace a new vision of possibilities, developing other to be Leader or better leader, and building the organizationor group into a community of challenged and rewarded learners. [10] Gibson et. al (1997) defines TransformationLeadership as a leader that motivate followers to work for transcendental goals instead of short term self interest andfor achievements and self actualization instead of security.[11] The employee’s reward is internal the leader’s visionprovides the follower with motivation for hard worn that is self rewarding. The transformational leader overhaul theentire philosophy, system and culture of the organizations.
Burns (1978) introduces the transformational leadership theory. Bass and Avolio (1995) further developed thetheory.[12] Transformational leadership has four components; Idealized Influence, inspirational motivation,intellectual stimulation and individualized consideration.
1.2.1 Inspirational Motivation (L1)This Involves behaviors and communication that guide followers by providing them with a sense of meaning and
challenges. Transformational leaders displays great enthusiasm and optimism, which carries over into the lies of followers and
fosters a sense of team spirit. Inspirational motivation is about motivating the entire organization to follow a new idea.[13]
1.2.2 Intellectual Stimulation (L2)Intellectual Stimulation is the encouragement given to followers to be innovative and creative.
Transformational leaders urge followers to question assumption, explore new ideas and methods and approach oldsituation with new perspectives.[13]Intellectual stimulation involves responding to the specific, unique needs offollowers to ensure they are included in the transformation process of the organization.[14’]
1.2.3 Idealized Influence(L3)Transformational leaders demonstrate the behaviors that followers strive to mirror. Followers typically admire,
respect and trust such leaders. Idealized Influence is about building confidence and trust and providing a role modelthat followers seek to emulate [15]
1.2.4 Individualized consideration (L4)Individual consideration involves responding to the specific ,unique needs of followers to ensure they are
included in the transformation process of the organization [16]
1.3 CreativityThe literature includes several definitions of creativity and innovation. A widely accepted definition states
that creativity is the production of novel and useful ideas, and innovation is the successful implementation ofcreative ideas within an organization (Amabile, 1983, 1998; Amabile et al., 1996) [17] Thus, creativity is at theindividual level, while innovation is at the organizational level (Oldham and Cummings, 1996).
The cognitive components of design creativity have been defined based on Treffinger’s creative learningmodel .The cognitive aspects in Treffinger’s creative learning model are fluency, flexibility, originality, elaboration,and cognition and memory. We replaced cognition and memory with problem sensitivity, and identified fourcomponents of creativity such as Idea fluency, Creative flexibility, Originality, and problem sensitivity [18]
1.3.1 Idea Fluency (C1)This term simply means that a person can pile up a large number of alternative solutions to a given problem in
a given time. The value of this lies in the fact that the more ideas you have, the greater your chances of finding ausable one; the more plentiful your opportunities to get out of the same old ways of doing things. Idea fluencydepends largely upon personal mental habits. It is an attribute that can be developed or improved by nearly everyperson who will consciously apply himself to it.[19]. Fluency is an ability to make multiple answers to the same giveninformation in a limited time[20] and quantity of meaningful solutions.[21]
1.3.2 Originality (C2)The originality required of the business executive is more likely to be that of finding new ways to vary existing
conditions, or new ways to adapt existing ideas to new conditions or a new modification of something that will fit in an
62
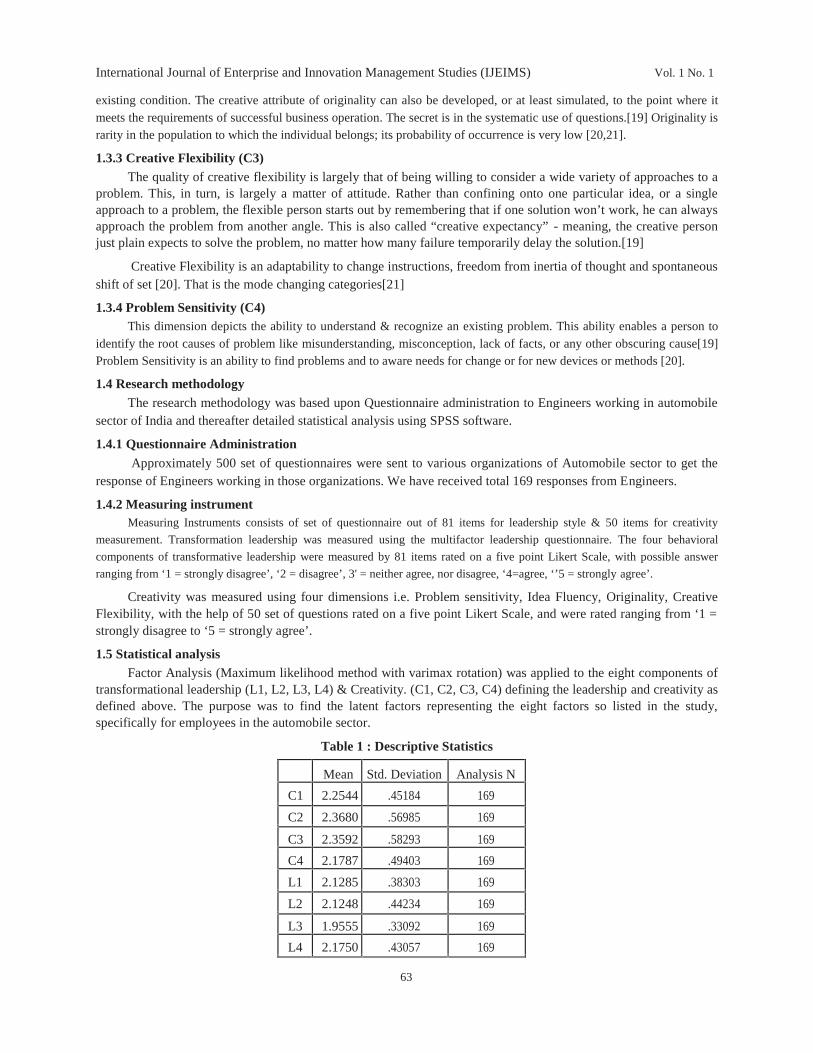
International Journal of Enterprise and Innovation Management Studies (IJEIMS) Vol. 1 No. 1
existing condition. The creative attribute of originality can also be developed, or at least simulated, to the point where itmeets the requirements of successful business operation. The secret is in the systematic use of questions.[19] Originality israrity in the population to which the individual belongs; its probability of occurrence is very low [20,21].
1.3.3 Creative Flexibility (C3)The quality of creative flexibility is largely that of being willing to consider a wide variety of approaches to a
problem. This, in turn, is largely a matter of attitude. Rather than confining onto one particular idea, or a singleapproach to a problem, the flexible person starts out by remembering that if one solution won’t work, he can alwaysapproach the problem from another angle. This is also called “creative expectancy” - meaning, the creative personjust plain expects to solve the problem, no matter how many failure temporarily delay the solution.[19]
Creative Flexibility is an adaptability to change instructions, freedom from inertia of thought and spontaneousshift of set [20]. That is the mode changing categories[21]
1.3.4 Problem Sensitivity (C4)This dimension depicts the ability to understand & recognize an existing problem. This ability enables a person to
identify the root causes of problem like misunderstanding, misconception, lack of facts, or any other obscuring cause[19]Problem Sensitivity is an ability to find problems and to aware needs for change or for new devices or methods [20].
1.4 Research methodologyThe research methodology was based upon Questionnaire administration to Engineers working in automobile
sector of India and thereafter detailed statistical analysis using SPSS software.
1.4.1 Questionnaire AdministrationApproximately 500 set of questionnaires were sent to various organizations of Automobile sector to get the
response of Engineers working in those organizations. We have received total 169 responses from Engineers.
1.4.2 Measuring instrumentMeasuring Instruments consists of set of questionnaire out of 81 items for leadership style & 50 items for creativity
measurement. Transformation leadership was measured using the multifactor leadership questionnaire. The four behavioral
components of transformative leadership were measured by 81 items rated on a five point Likert Scale, with possible answer
ranging from ‘1 = strongly disagree’, ‘2 = disagree’, 3' = neither agree, nor disagree, ‘4=agree, ‘’5 = strongly agree’.
Creativity was measured using four dimensions i.e. Problem sensitivity, Idea Fluency, Originality, CreativeFlexibility, with the help of 50 set of questions rated on a five point Likert Scale, and were rated ranging from ‘1 =strongly disagree to ‘5 = strongly agree’.
1.5 Statistical analysisFactor Analysis (Maximum likelihood method with varimax rotation) was applied to the eight components of
transformational leadership (L1, L2, L3, L4) & Creativity. (C1, C2, C3, C4) defining the leadership and creativity asdefined above. The purpose was to find the latent factors representing the eight factors so listed in the study,specifically for employees in the automobile sector.
Table 1 : Descriptive Statistics
Mean Std. Deviation Analysis N
C1 2.2544 .45184 169
C2 2.3680 .56985 169
C3 2.3592 .58293 169
C4 2.1787 .49403 169
L1 2.1285 .38303 169
L2 2.1248 .44234 169
L3 1.9555 .33092 169
L4 2.1750 .43057 169
63

International Journal of Enterprise and Innovation Management Studies (IJEIMS) Vol. 1 No. 1
Descriptive statistics shows that the average has been overing around 1.9 to 2.5 .The highest trait observed asper the means (Table 1) is that of C2, i.e. originality which means the employees have a lot of original ideas orpossible solutions for their day-to day problems. The minimum trait observed was of L3(Intellectual Stimulation)i.e. questioning the assumptions which implies that though creativity is there but there is a tendency of acceptingwhatever has been believed earlier and we embark on new idea based on those assumptions.
Table 2: Correlation Matrix
C1 C2 C3 C4 L1 L2 L3 L4
Correlation C1 1.000 .941 .975 .967 -.146 -.171 -.044 -.069
C2 .941 1.000 .982 .970 -.109 -.112 -.036 -.076
C3 .975 .982 1.000 .982 -.129 -.142 -.049 -.075
C4 .967 .970 .982 1.000 -.104 -.135 -.061 -.049
L1 -.146 -.109 -.129 -.104 1.000 .398 .343 .076
L2 -.171 -.112 -.142 -.135 .398 1.000 .188 -.022
L3 -.044 -.036 -.049 -.061 .343 .188 1.000 -.035
L4 -.069 -.076 -.075 -.049 .076 -.022 -.035 1.000
Sig. (1-tailed) C1 .000 .000 .000 .029 .013 .287 .185
C2 .000 .000 .000 .078 .073 .321 .164
C3 .000 .000 .000 .047 .033 .266 .166
C4 .000 .000 .000 .088 .040 .214 .263
L1 .029 .078 .047 .088 .000 .000 .162
L2 .013 .073 .033 .040 .000 .007 .386
L3 .287 .321 .266 .214 .000 .007 .327
L4 .185 .164 .166 .263 .162 .386 .327
From the correlation matrix (Table2) we observed that at 0.01 level of significance correlation among the leadershiptraits (L1, L2, L3, L4) is low (less then 0.45) while correlation among creativity traits (C1, C2, C3, C4) areexceptionally high(above 0.9).Which means all traits of creativity are highly interrelated with each other.
Table 3 : KMO and Bartlett’s Test
Kaiser-Meyer-Olkin Measure of Sampling Adequacy. .787
Bartlett’s Test of Sphericity Approx. Chi-Square 1708.646
Df 28.000
Sig. .000
The Kaiser Meyer Olkin Measures of sampling adequacy and Bartlett’s test of spherecity confirm that the sample isadequate and we can proceed for analysis.
Table 4 : Communalities
Initial Extraction
C1 .962 .984
C2 .971 .990
C3 .988 .993
64
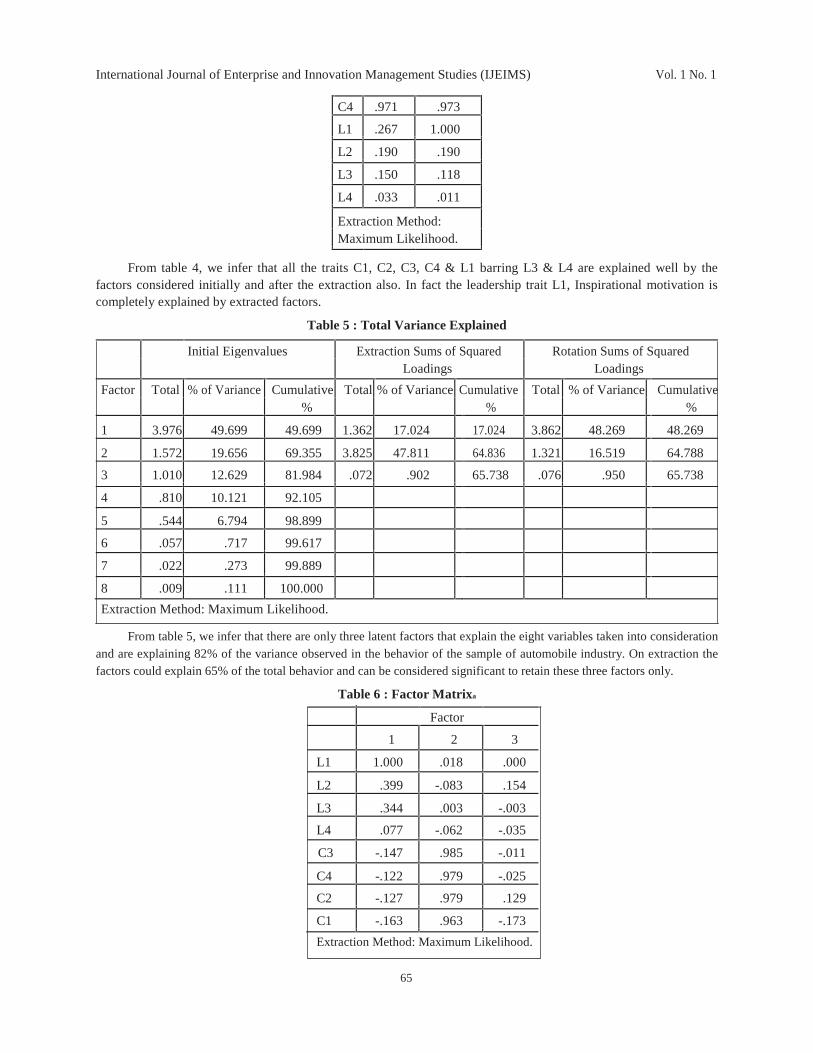
International Journal of Enterprise and Innovation Management Studies (IJEIMS) Vol. 1 No. 1
C4 .971 .973
L1 .267 1.000
L2 .190 .190
L3 .150 .118
L4 .033 .011
Extraction Method:Maximum Likelihood.
From table 4, we infer that all the traits C1, C2, C3, C4 & L1 barring L3 & L4 are explained well by thefactors considered initially and after the extraction also. In fact the leadership trait L1, Inspirational motivation iscompletely explained by extracted factors.
Table 5 : Total Variance Explained
Initial Eigenvalues Extraction Sums of Squared Rotation Sums of SquaredLoadings Loadings
Factor Total % of Variance Cumulative Total % of Variance Cumulative Total % of Variance Cumulative% % %
1 3.976 49.699 49.699 1.362 17.024 17.024 3.862 48.269 48.269
2 1.572 19.656 69.355 3.825 47.811 64.836 1.321 16.519 64.788
3 1.010 12.629 81.984 .072 .902 65.738 .076 .950 65.738
4 .810 10.121 92.105
5 .544 6.794 98.899
6 .057 .717 99.617
7 .022 .273 99.889
8 .009 .111 100.000
Extraction Method: Maximum Likelihood.
From table 5, we infer that there are only three latent factors that explain the eight variables taken into considerationand are explaining 82% of the variance observed in the behavior of the sample of automobile industry. On extraction thefactors could explain 65% of the total behavior and can be considered significant to retain these three factors only.
Table 6 : Factor Matrixa
Factor
1 2 3
L1 1.000 .018 .000
L2 .399 -.083 .154
L3 .344 .003 -.003
L4 .077 -.062 -.035
C3 -.147 .985 -.011
C4 -.122 .979 -.025
C2 -.127 .979 .129
C1 -.163 .963 -.173
Extraction Method: Maximum Likelihood.
65

International Journal of Enterprise and Innovation Management Studies (IJEIMS) Vol. 1 No. 1
From the tables 6&7 & we infer that the three factors so identified had typical characteristics. The factor F1was a good fit for all the creativity traits and instead of mentioning the traits separately we can mention creativityonly. The Factor F2 was a good fit on only one factor of leadership and that is L1 and the Factor F3 was not a goodfit on any of the factors and is insignificant also.
Table 7: Factor Transformation Matrix
Factor
1 2 3
1 -.035 .993 -.112
2 .998 .039 .040
3 -.044 .111 .993
Extraction Method: Maximum Likelihood.Rotation Method: Varimax with Kaiser Normalization.
Table 8 : Rotated Factor Matrixa
Factor
1 2 3
C3 .989 -.109 .045
C4 .982 -.085 .028
C2 .976 -.073 .181
C1 .975 -.143 -.116L1 -.017 .993 -.112
L2 -.103 .410 .104
L3 -.008 .341 -.041
L4 -.063 .071 -.046
Extraction Method: Maximum Likelihood.
Rotation Method: Varimax withKaiser Normalization.a. Rotation converged in 4 iterations.
Table 8 depicts that only two factors are important in defining creativity & leadership among the engineers ofautomobile sector ,they are four components of creativity i.e. Idea Fluency, Originality, Creative Flexibility&Problem sensitivity and other is Inspirational motivation(L1)
1.6CONCLUSION
Among all traits of Creativity the highest trait observed as per the means is originality(C2) which means theemployees have a lot of original ideas or possible solutions for their day-to day problems. we also observe that thereis high correlation among the traits of creativity .This study reveals that though eight traits have been analyzed ofcreativity and leadership, we discover that only Two latent factors of Transformational Leadership & Creativityshows strong interdependency with each other. We can conclude in another way that the Inspirational motivation(component of transformational leadership style) has major impact on all four creativity traits i.e Idea Fluency,Originality, Creative Flexibility& problem sensitivity.
REFERENCES1. Jung DI,Chowc,wu A.The role of Transformational Leadership leadership in enhancing organizational
leadership in enhancing organizational innovation hypothesis and some preliminary finding, leadershipQuarterly 2003; 14:525-4 Tierny p,Farmer sm graen gb. An Examinationof leadershipand employee Creativity:The relevance of traits and relationship’s: personnal psychology 1999;52:591-620
2. Zhou,j.(2003). When the presence of creative coworkers is related to creativity : Role of supervisor’s closemonitoring, development feedback, and creative personality. Journal of applied psychology, 88, 413-422
3. Hirst Gites, Dicu Rolfran, Knippenberg, Dgan Van A social identity perspective on leadership and employeecreativity, journal of organization behavior, Vol 30, 30, P-963-982, 2009
4. Zhou, J., & Shalley, C.E. (2008). Expanding the scope and impact of organization creativity research. In J. Zhou, &
C.E. Shalley, (Eds.), Handbook of organization creativity (pp, 347-368). New York: Lawrence Erlbaum.
5. Shin, S.J., & Zhou, J. 2003. Transformational leadership, conservation, and creativity: Evidence from Korea. Academy
of Management Journal, 46: 703-714.
66
International Journal of Enterprise and Innovation Management Studies (IJEIMS) Vol. 1 No. 1
6. Redmond, M.R, Mumford, M.D., & Teach, R. 1993. Putting creativity in work: Effects of leader behavior on subordinate
creativity, organization behavior and Human Decision Process. 55: 120-151
7. Gong. Yaping, Hunag. Jia-chi,, Farh, Jung-Lin Employee Learning orientation, Transformational Leadership,and employee creativity: The mediating role of employee creativity self-efficiency.
8. Dvir. T, Eden D, Avolio BJ, Shamir B, Impact of transformational leadership on follower development andperformance: a field experiment Academy of Management Journal 2002; 45 (4): 735-44
10. Anderson, T.D. Transforming Leadership; Equipping yourself and challenging others to build the leadershiporganization, 2nd ed Boca Raton, FL: CRC Press, 1998.
11. Gibson,J.L.,J.M. Donnely, J.H.(1997).Organizations: Behavior,Structure,Process.usa: Rob Zwetter,pp.315-319
12. Burns JM. Leadership, New York: Harper & Row 1978, Bass BM, Avolio BJ. MLQ, Multifactor LeadershipQuestionnaire, 2nd ed Redwood City, CA. Mind Garden; 1995.
13. Avolio, B.E. Full Leadership Development: Building the Vital Forces in Organizations, Thousand Oaks, CA: Sage
Publication, 1999, 43-49; Bass, B.M. Transformational Leadership: Industry, Military, and Educational Impact.Mahawah, NJ: Lawrence Erlbaum Associates, 1998
14 Kelly,,M.L.(2003) Academic advisers as transformational leaders.The mentor.Retrieved August 3 2006 fromhttp:// www.psu.edu/dus/mentor/3010
15 Bono,J.E. &Judge,T.A.(2004).Personality and Transformational and Transactional leadership :a metaanalysis.Journal of Applied psychology,89(5),pp901-910
16 Simic,I.(1998)Transformational leadership-the key to successful management of transformational organizationchanges.Facta University,1(6),pp.49-55
17 Amabile TM. How to win creativity? Harvard Business Review 1998; 76 (J): 7787, Amabite TM, Cotir, CoonH, Lazenby J, Herron M. Assessing the environment For creativity, Academy of Management Journal 1996; 9(5) 1154-84.
18 Treffinger, D. J. (1980) Encouraging Creative Learning for the Gifted and Talented, Ventura CountySchools/LTI, Ventura, CA.
19 Timple A.Dale (2005)”Creativity”Jaico Publishing House,pp.13,16,17
20 Guiford,J.P.and Hoepfner,R.The analysis of Intelligence,McGrawHill,NewYork.
21 Urban,K.K.(1995) Creativity :A component Approach Model. In Proceedings of the world conference on theEducation for the Gifted and Talented, Hong Kong.
67

International Journal of Enterprise and Innovation Management Studies (IJEIMS) Vol. 1 No. 1
DETERMINATION OF LOT SIZE IN THECONSTRUCTION OF SIX SIGMA BASED SAMPLING
PLANS
R. RADHAKRISHNAN1 and P. VASANTHAMANI2
1Associate Professor, PSG College of Arts and Science, Coimbatore - 641 014, [email protected]
2Associate Professor, SNR Sons College, Coimbatore - 641 006, India.
ABSTRACT
Six Sigma is a concept, a process, a measurement, a quality philosophy, and a management strategy used toimprove the systematized quality of an organization, which when applied reduce the number of defects to 3.4 orless per million opportunities in the long run, a concept suggested by Motorola in 1980. The main aim of SixSigma is to reduce costs/wastages as much as possible and improve the quality of the product to the maximumsatisfaction of the consumer. Focusing on reduction of non-conformities will result in enhanced quality withmore satisfaction and profit. The concept of Six Sigma can be applied in the process of quality control in generaland Acceptance Sampling in particular. Various sampling plans have been designed focusing on the sample sizeonly but not on the lot size. It is also unconvincing to say that the lot is accepted or rejected based on a fixedsample size irrespective of the huge lot size.
In this paper an attempt is made to determine the size of the lot (N) of a Six sigma based single sampling plan withPoisson distribution as a base line distribution. Tables are also constructed for the easy selection of the plan for variousvalues of sample size (n) and Average Outgoing Quality (AOQ) with probability of acceptance 1 – 3.4 x 10(-6).
Key words—Six sigma, Single Sampling Plan (SSP), rectifying inspection, Sample size (n), Lot size (N), Lotquality (p), Average Outgoing Quality (AOQ).
1.INTRODUCTION
Six Sigma is the most popular tool to convert management problem to a statistical solution then convert it to amanagement solution. Six Sigma has a measurement of standard in product variation can be traced back to the 1920’swhen Walter Shewart showed that three sigma from the mean is the point where a process requires correction.
Rectifying inspection programs were among the earliest of sampling inspection schemes. The plans developedby Harold F. Dodge and Harry G. Romig (1942) at the Bell Telephone Laboratories were rectifying inspectionplans. Later their ideas on rectifying inspection have been extended by G.A. Barnard and F.J. Anscombe (1949).Initially programs of rectifying inspection were associated with lot-by-lot acceptance sampling, but in 1943 Dodgealso proposed a rectifying scheme for continuous production. Radhakrishnan and Sivakumaran (2008) constructedsix sigma sampling plan indexed through Six Sigma Quality Level (SSQL) with Single Sampling Plan as a referenceplan. All the plans suggested by them are for infinite lot size only.
A. Average Outgoing Quality (AOQ)AOQ is the average quality of outgoing product including all accepted lots or batches plus all rejected lots or
batches after the rejected lots or batches have been effectively 100 percent inspected and all defectives replaced bynon – defectives.
B. Glossary of symbols used
P : Proportion defective / lot quality.
N : lot size
n: sample size
d: number of defectives counted
c: acceptance number
Pa : Probability of acceptance of the lot quality p
AOQ : Average Outgoing Quality
68

International Journal of Enterprise and Innovation Management Studies (IJEIMS) Vol. 1 No. 1
C. Operating ProcedureThe operating procedure of a Single Sampling Plan (SSP) is given below with a flowchart 1:
Step 1 : Take a random of size n from the lot of size N and count the number of non-conformities (say d).
Step 2 : If d d” c, accept the lot.
Step 3 : If d > c, reject the lot.
Flowchart 1
Select a sample of size n from the lot of size N
Count the number of non-conformities (d)
Accept the lot Yes Is No Reject the lotdd”c
D. Conditions for Application
1. Production is steady, so that results of past, present and future lots are broadly indicative of a continuingprocess.
2. Lots are submitted sequentially in the order of their production.
3. Inspection is by attributes, with the lot quality defined as the proportion defective.
4. Human involvement should be less in the manufacturing process.
E. OC Function
Associated with each sampling plan there is an OC curve, which portrays the performance of the samplingplan against good and poor quality. The probability that the lot will be accepted under a given sampling plan is
denoted by Pa(p) and a plot of Pa(p) against given value of the lot quality p will give the OC curve.
OC function of the SSP isc
Pa(p)= ∑{[e(-np) (np)x ] / X!},X = 0
F. Determination of the Lot Size
By fixing the probability of acceptance Pa(p) of the lot as 1-3.4 x 10⁻⁶ with Poisson Distribution as the basicdistribution the value of np is obtained for c=0 and c=1 and finally the lot size is determined using the formula
AOQ=p.P
a
(N−n)
N
provided by Duncan (1986) and are presented in Table 1 and Table 2 for various values of n and AOQ using Excelpackages.
Example 1For a given n=350 and AOQ=0.95×10(-8), the value of the lot size can be obtained from table 1 as N=15868.
The selected Single Sampling Plan (SSP) based on six sigma quality is N=15868, n=350, c=0. The OC curve for thesuggested plan is presented in figure 1.
69
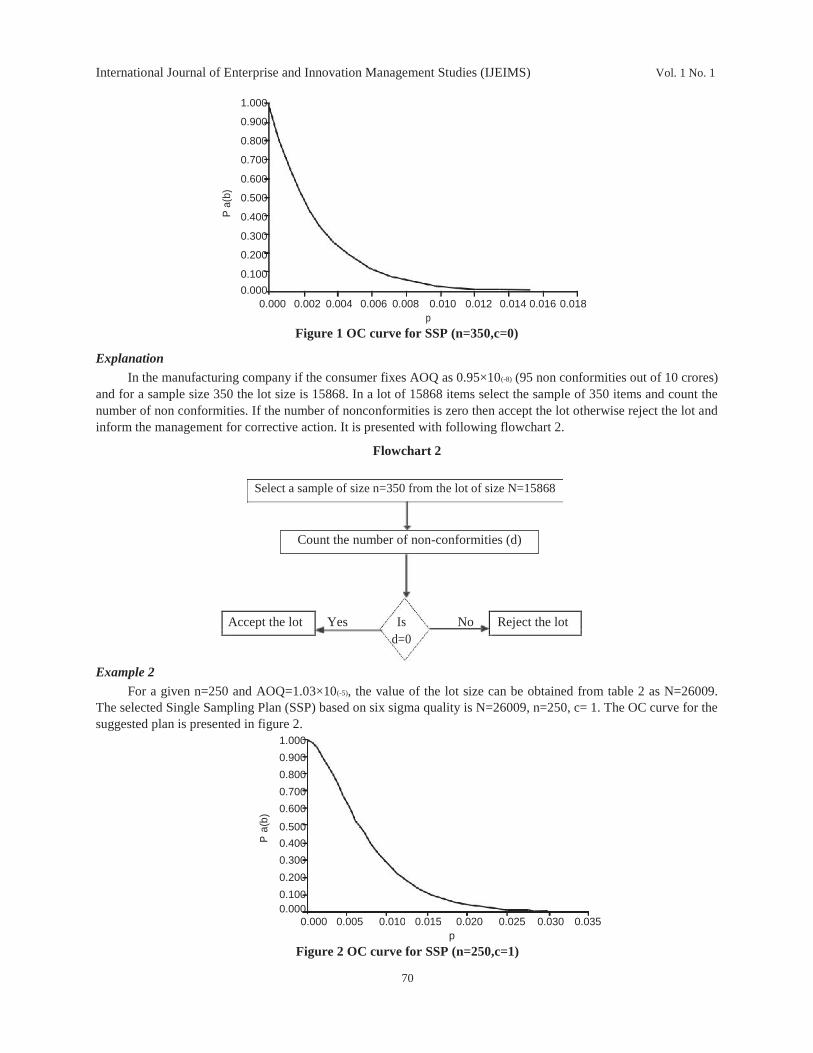
International Journal of Enterprise and Innovation Management Studies (IJEIMS) Vol. 1 No. 1
1.000
0.900
0.800
0.700
P a(
b)
0.600
0.500
0.400
0.300
0.200
0.1000.000
0.000 0.002 0.004 0.006 0.008 0.010 0.012 0.014 0.016 0.018p
Figure 1 OC curve for SSP (n=350,c=0)
Explanation
In the manufacturing company if the consumer fixes AOQ as 0.95×10(-8) (95 non conformities out of 10 crores)and for a sample size 350 the lot size is 15868. In a lot of 15868 items select the sample of 350 items and count thenumber of non conformities. If the number of nonconformities is zero then accept the lot otherwise reject the lot andinform the management for corrective action. It is presented with following flowchart 2.
Flowchart 2
Select a sample of size n=350 from the lot of size N=15868
Count the number of non-conformities (d)
Accept the lot Yes Is No Reject the lotd=0
Example 2
For a given n=250 and AOQ=1.03×10(-5), the value of the lot size can be obtained from table 2 as N=26009.The selected Single Sampling Plan (SSP) based on six sigma quality is N=26009, n=250, c= 1. The OC curve for thesuggested plan is presented in figure 2.
1.0000.9000.8000.700
a(b)
0.600
0.500
P 0.4000.3000.2000.1000.000
0.000 0.005 0.010 0.015 0.020 0.025 0.030 0.035p
Figure 2 OC curve for SSP (n=250,c=1)
70
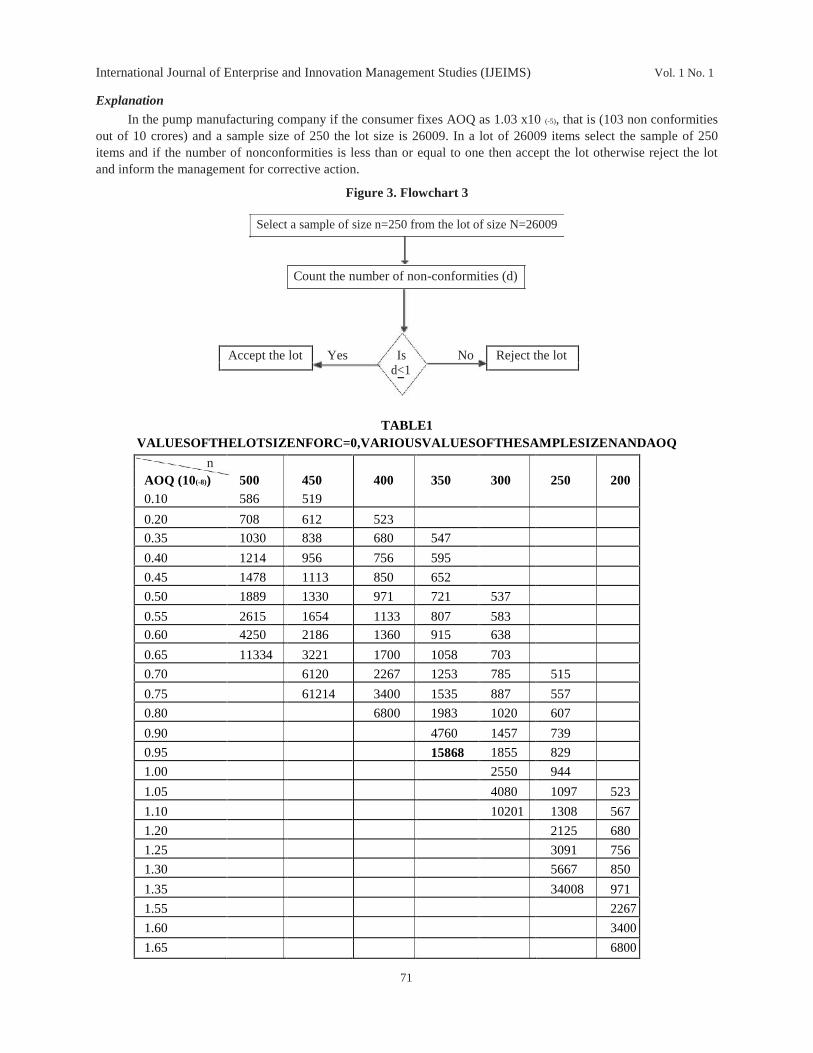
International Journal of Enterprise and Innovation Management Studies (IJEIMS) Vol. 1 No. 1
ExplanationIn the pump manufacturing company if the consumer fixes AOQ as 1.03 x10 (-5), that is (103 non conformities
out of 10 crores) and a sample size of 250 the lot size is 26009. In a lot of 26009 items select the sample of 250items and if the number of nonconformities is less than or equal to one then accept the lot otherwise reject the lotand inform the management for corrective action.
Figure 3. Flowchart 3
Select a sample of size n=250 from the lot of size N=26009
Count the number of non-conformities (d)
Accept the lot Yes Is No Reject the lotd<1
TABLE1VALUESOFTHELOTSIZENFORC=0,VARIOUSVALUESOFTHESAMPLESIZENANDAOQ
nAOQ (10(-8)) 500 450 400 350 300 250 2000.10 586 519
0.20 708 612 523
0.35 1030 838 680 547
0.40 1214 956 756 595
0.45 1478 1113 850 652
0.50 1889 1330 971 721 537
0.55 2615 1654 1133 807 5830.60 4250 2186 1360 915 638
0.65 11334 3221 1700 1058 703
0.70 6120 2267 1253 785 515
0.75 61214 3400 1535 887 557
0.80 6800 1983 1020 607
0.90 4760 1457 739
0.95 15868 1855 829
1.00 2550 944
1.05 4080 1097 523
1.10 10201 1308 567
1.20 2125 680
1.25 3091 756
1.30 5667 850
1.35 34008 971
1.55 2267
1.60 3400
1.65 6800
71

International Journal of Enterprise and Innovation Management Studies (IJEIMS) Vol. 1 No. 1
TABLE2VALUES OFTHE LOTSIZE N FOR C=1,VARIOUSVALUES OFTHE SAMPLE SIZE NANDAOQ
nAOQ(10(-5)) 500 450 400 350 300 250 200
0.10 619 544
0.19 788 670 565
0.39 2000 1385 1000 737 545
0.47 5200 2412 1444 953 655
0.49 8667 2962 1625 1028 690
0.50 13001 3343 1733 1071 709
0.51 26005 3836 1857 1117 729
0.55 9361 2600 1348 821 531
0.56 14627 2889 1422 848 542
0.57 33437 3250 1504 876 553
0.62 8667 2116 1054 619
0.63 13001 2304 1099 634
0.64 26006 2528 1147 650
0.71 7914 1660 788
0.72 11376 1773 813
0.73 20226 1902 839
0.74 91080 2053 867
0.84 9751 1300 565
0.85 15603 1368 578
0.86 39017 1444 591
1.01 8668 897
1.02 13002 929
1.03 26009 963
1.17 2000
1.26 6501
1.27 8668
1.28 13003
1.29 26011
2.CONCLUSION
In this paper an attempt is made to determine the lot size of Six Sigma based single sampling Plans which hasthe probability of acceptance Pa(p) of the lot as 1-3.4 x 10⁻⁶ using Poisson distribution as a base line distribution,acceptance numbers c=0 and c=1 and AOQ values for various values or a specified AOQ and sample size n. Thiswill help the floor engineer to suggest on the size of the lot to be submitted for inspection for a fixed sample size andacceptance number. This work can be extended for other sampling plans having finite lot size. These plans are moresuitable for the industries that are practicing Six Sigma methodologies.
3.REFERENCES[1] AMERICAN NATIONALSTANDARDS INSTITUTE/AMERICAN SOCIETYFOR
QUALITYCONTROL(1987) Standard A2, ‘Terms, Symbols and Definitions for Acceptance Sampling(Milwaukee, WI, American Society for Quality Control).
72

International Journal of Enterprise and Innovation Management Studies (IJEIMS) Vol. 1 No. 1
[2] Ansscombe, F.J. (1958), ‘Rectifying inspection of continuous output, Journal of Royal Statistical Society, 53, p702.
[3] Dodge, H.F. and Roming, H. G. (1942), ‘Army service forces tables, Bell telephone laboratories, United States.
[4] Duncan A. J. – Quality control and industrial statistics: Fifth edition, Irivin, Homewood, Illinios (1986).
[5] Hald, A.(1981), ‘Statistical Theory of Sampling Inspection By Attributes, Academic Press London.
[6] Ng, E.Tsung, F. and So, R. (2005), ‘Six Sigma approach to reducing fall hazards among cargo handlers workingon top of cargo containers: a case study, Int. J. Six Sigma and Competitive Advantage, Vol. 1, No. 2.
[7] R. Radhakrishnan, and P.K. Sivakumaran,”Construction and Selection of Six Sigma Sampling Plan indexed through
Six Sigma Quality Level”, International Journal of Statistics and Systems, Vol. 3, No. 2, pp. 153-159, (2008).
Websites
[8] General Electric Company: http://www.ge.com/
[9] Honeywell Company: www.honeywell.com/
http://www51.honeywell.com/
[10] Motorola: http://www.motorola.com/Official website: http://fonszter.com/
[11] Process Sigma Calculation: http://www.isixsigma.com/
73

International Journal of Enterprise and Innovation Management Studies (IJEIMS) Vol. 1 No. 1
BUYER BEHAVIOUR TOWARDS ELECTRONIC GOODS
Mrs. K. RAJASELVIAssistant Professor in Commerce, Emerald Heights College For Women
Finger Post Ootacamund- 6.
ABSTRACT
Buyer behavior is the outcome of both individual and environmental influences’ –BOONE KURTZ.
Buyer behavior is a study of how individuals make decision to spend their available resources (time, money andeffort) on consumption related items (what they buy, why they buy, When they buy, Where they buy, How oftenthey buy and use a product or service).
With the increasing disposable income population, their percapita consumption of electronic goods and otherproducts is increasing. They are desirous of improving their standard of living with the hygienic and reasonablyhigh quality products and get ride of the spurious and sub- standard products being supplied to them. Theydeserve quality products, correct information about a product and a door step delivery. It is remarked that themarkets were developed not because of the initiatives of Indian marketers but the “PULL’ from the consumersconsuming system itself.
In earlier times, marketers could understand consumers through the daily experience of selling to them. But thegrowth in the size of firms and markets has removed many marketing decision makers from direct contact withcustomers.
Despite the basic characteristics of consumers the behavior pattern of consumers are more or less similar to eachother, particularly in the aspects like quality, preference and decision making. However it is evident that thepresent approaches to draw the attention of customers are not adequate. The consumers are particular about theappropriate system of distribution and hence there is a great need for change in the distribution system. It maynot be always correct to say that consumers behave in the same way as it much depends on type of products,quality of the products and price of the products. Therefore the producer must be paid special attention at leastwith regard to price and distribution system to cover the large number of customers. This is mainly because of thefact that the buying capacity of the consumers may not be equal to the buying capacity.
Key words - ‘Buyer behaviour, outcome of both individual, environmental, influences’, –BOONE KURTZ.
I.INTRODUCTION
Buyer behaviour is a study of how individuals make decision to spend their available resources (time, moneyand effort) on consumption related items (what they buy, why they buy, When they buy, Where they buy, How oftenthey buy and use a product or service).
With the increasing disposable income population, their percapita consumption of electronic goods and otherproducts is increasing. They are desirous of improving their standard of living with the hygienic and reasonably highquality products and get ride of the spurious and sub- standard products being supplied to them. They deserve qualityproducts, correct information about a product and a door step delivery. It is remarked that the markets were developed notbecause of the initiatives of Indian marketers but the “PULL’ from the consumers consuming system itself.
Marketing manager who intend to develop the markets have to consider and examine distribution logistics,location, concentration of demand, dealers attitude and motivation, consumer motivation and buying habits andorganizational alternatives identification selection of target markets should be taken in developing marketing mix.Once this is completed appropriate product mix strategies should be developed. It is a usual practice with manymarkets to sell the same production the markets. This policy does not yield good results. Appropriate changes intangible and intangible features of the product should be made. The price mix is another critical marketing decisionarea. The price should tally with the ability to pay by the marketers. Appropriate adjustment should be necessarilymade in quantity size packages etc. A different approach is needed for the markets to find a solution to distributionproblems and promotion problems. Alternative distribution channels and method of promotional programmes are tobe devised. Branding and packaging are important tools used in markets.
74

International Journal of Enterprise and Innovation Management Studies (IJEIMS) Vol. 1 No. 1
In earlier times, marketers could understand consumers through the daily experience of selling to them. Butthe growth in the size of firms and markets has removed many marketing decision makers from direct contact withcustomers. Increasingly, managers have had to turn to consumers research for answers to the most importantquestions about any marketing called the seven O’s of the market place.
Who constitutes the market? Occupants
What does the market buy? Objects
Why does the market buy? Objectives
Who participates in the buying? Organizations
How does the market buy? Operations
When does the market buy? Occasions
Where does the market buy? Outlets
Of central interest is the question, How do consumers respond to various marketer-controlled stimuli? The companythat understands how consumers will respond to different product features, prices, advertising appeals, and so on will havean enormous advantage over its competitors. Therefore, business and academic marketing researchers, have invested muchenergy in researching the relationship between marketing stimuli and consumer response.
II.FACTORSINFLUENCEBUYERBEHAVIOUR
The major factors influencing buyer behaviour are cultural, social, personal and psychological.
CULTURESOCIAL
PERSONALPSYCHOLOGICAL
CultureReference Age and
Lifecycle stageMotivation
GroupsOccupation
EconomicPerceptionSub culture
CircumstancesFamily BUYER
Life style Learning
Social classPersonal and
Roles and statuses Self- concept Beliets and Attitudes
III.BUYINGROLES
For many products, it is fairly easy to identify the buyer. Many other products involve a decision making unitconsisting of more than one person. Five roles people might play in a buying decision.
1. Initiator: A person who first suggests the idea of buying the particular product or service.
2. Influencer: A person whose views or advice carries some weight in making the final decision.
3. Decider: A person who decides on any component of a buying decision. Whether to buy, what to buy, how tobuy, or where to buy.
4. Buyer: The person who makes the actual purchase.
5. User: A person who consumes or uses the product or service.
A company needs to identify these roles because they have implication for designing the product, determiningand allocating the promotional budget.
75

International Journal of Enterprise and Innovation Management Studies (IJEIMS) Vol. 1 No. 1
Types of buying behaviourConsumer decision making varies with the type of buying decision. Assail distinguished four types of
consumer buying behaviour based on the degree of buyer involvement and the degree of differences among brands.
High involvement Low involvement
Significant differences Between brands Complex buying behaviour Variety seeking buying behaviour
Few differences Between brands Dissonance-reducing Habitual buying behaviourBuying behaviour
Stages in the buying decision processBased on examining many consumer reports of buying episodes, proposals have been made by consumer
behaviour researchers for “stages models” of the buying process. The consumer passes through the five stages ofbuying decision process: Need recognition, Information search, Evaluation of alternatives, Purchase decision andpost purchase behaviour.
Need recognition Information Search Evaluation of alternative
IV.PURCHASEDECISION
In evaluation stage, the consumer forms preferences among the brands the choice set. The consumer may alsoform a purchase intension to busy the most preferred brand.
V.RESULTSANDDISCUSSION SOCIAL-ECONOMICCONDITIONOFTHERESPONDENTS Table 1 : Age
wise classification of respondents
S.NO AGE NOOFRESPONDENTS
MALE FEMALE
1. Upto 20 years 12 (22) 10(14)
2. 20 Years to 30 Years 25 (46) 30(43)
3. 30 Years to 40 Years 13 (24) 20(29)
4. 40 Years and above 5 (9) 10 (14)
TOTAL 55(100) 70(100)
Sources: Primary data
It could be seen from the table 1 that 46 percent of the male respondents and 43 percent of female respondentsbelonged to the category of 20 years to 30 years.
Table 2 : Education status of sample respondents
S.NO EDUCATIONALQUALIFICATION NO.OFRESPONDENTS PERCENTTOTHETOTAL
1. MATRIC/ SSLC 18 14.4
2. HSC/PUC 30 24.07
3. GRADUATE/DIPLOMA 37 29.67
4. POSTGRADUATE 23 18.4
5. ILLITRATE 17 13.6
TOTAL 125 100%
Sources: Primary data
76

International Journal of Enterprise and Innovation Management Studies (IJEIMS) Vol. 1 No. 1
From the above table it is known that 29.67% of the respondents were Graduate/Diploma and 13.6% were Illiterates.
24.07% of the sample respondents were HSC/ PUC.
Table 3 : Classification of Occupational status
S.NO OCCUPATIONALSTATUS NOOFRESPONDENTS PERCENTAGE
1. AGRICULTURAL 10 8.0
2. BUSINESS 37 29.6
3. EMPLOYED 61 48.8
4. RETIRED 8 6.4
5. OTHERS 9 7.2
125 100
Sources: Primary data
It was observed from the Table3. That 48.8 percent of the sample respondents are employed, 29.6 Percent ofthe respondents are doing business.
VI.BRANDAWARENESSANDPURCHASEDECISION
Table 4 : Media Creating Awareness
S.NO MEDIA NOOFRESPONDENTS PERCENTS
1. Magazine/Newspapers 26 20.8
2. Television 52 41.6
3. Radio 18 14.4
4. Others 3 2.4
5. Magazine/ Newspapers and Television 17 13.6
6. Television and Radio 9 7.2
125 100
Sources: Primary data
It was inferred from the Table 4 that 41.6 percent of respondents were aware of the electronic goods throughthe advertisement in television, 20.8 percent of the respondents were aware of the electronic goods through theadvertisement in the media of Magazine and Newspapers.
Table 5: Opinion on source of influence on purchasing Electronic goods
S.NO SOURCE NOOFTHERESPONDENTS PERCENTAGE
1. Manufactures 25 20.0
2. Dealers 16 12.8
3. Salesman 20 16.0
4. Friends and Relatives 64 51.2
125 100
Sources: Primary data
It was evident from the above table that out of the total respondents taken for the study, 51.2 percent of therespondents had been influenced by Friends and Relatives to purchase the Electronic Goods.
77

International Journal of Enterprise and Innovation Management Studies (IJEIMS) Vol. 1 No. 1
VII.POSSESSIONOFELECTRONICGOODS
Table 6 : Details of Electronic Goods possessed
S.NO LISTOFGOODS NOOFTHERESPONDENTS PERCENTAGES
1. Television 119 95.2
2. Radio & FM 41 32.8
3. VCD and DVD 85 65.6
4. Washing machine 43 34.4
5. Refrigerator 38 30.4
6. Air cooler 47 37.67
7. Iron box 113 90.47
8. Room Heater 116 92.8
9. Mixie 79 63.2
10. Wet grinder 67 53.6
11. Water Heater 41 32.8
Sources: Primary data
It was inferred from the table 6 that 95.2 percent of the respondents were possessing Television and in addition to that 92.8
percent were possessing Room heater. This indicated that Television plays a major role in mass media in Nilgiries.
Table7 : The factors considered by the respondents for their goods
S.NO REASONS NOOFRESPONDENTS PERCENTS
1. Time Saving 36 28.8
2. Convenience 16 12.8
3. Economy 12 9.6
4. Less Exertion 6 4.8
5. Entertainment 27 21.6
6. Time Saving and Entertainment 28 22.4
Sources: Primary data
The above table clearly shows that 28.8 percent of the respondents have stated time saving as the reason22.4percent of the respondents have stated time saving and entertainment as the reason.
Table 8: Showing Occupational status and Time taken to decide on purchase
S.NO OCCUPATIONALSTATUS IMMEDIATELY TIME TAKENLESSTHAN TWO MONTH MORE THAN TOTALONEMONTH TWO MONTHS
1. Agriculture 5 2 2 1 10
2. Business 18 11 5 3 37
3. Employed 21 19 16 5 61
4. Retired 3 2 2 1 8
5. Others 1 3 1 4 9
TOTAL 48 37 26 14 125
Sources: Primary data
78

International Journal of Enterprise and Innovation Management Studies (IJEIMS) Vol. 1 No. 1
The calculated value of Chi-Square is 26.046 and the tabulated value of Chi-Square with 12 degrees of freedom at5% significant level is 21.026. Since the calculated value is greater than the tabulated value the hypothesis is rejected. Theabove analysis infers that the occupational status has no significant association over the time taken to decide on purchase.
Table 9 : Occupational status and mode of purchase
S.NO OCCUPATIONALSTATUS MODE OF PURCHASE TOTAL
CREDIT CASH BOTH
1. Agriculture 2 7 1 10
2. Business 12 20 5 37
3. Employed 13 34 4 61
4. Retired 4 2 2 8
5. Others 1 1 7 9
TOTAL 32 64 29 125
Sources: Primary data
The calculated value of Chi-Square is 24.43 and the tabulated value of Chi-Square with 2 degrees of freedomat 5% significant level is 5.991.
Since the calculated value is greater than the tabulated value the hypothesis is rejected. The above analysisinfers that the occupational status has no significant influence over the mode of purchase.
Table 10 : Occupational status and media creating awareness
S.NO OCCUPATIONALSTATUS Media creating Awareness Total
Magazine/Newspaper Television Radio Others
1. Agriculture 4 15 1 1 21
2. Business 32 31 8 7 78
3. Employed 38 49 15 10 112
4. Retired 11 9 5 3 28
5. Others 8 3 4 3 18
Total 93 107 33 24 257
Sources: Primary data
The calculated value of Chi-Square is 15.629and the tabulated value of Chi-Square with 12 degrees of freedom at5% significant level is21.026.Since the calculated value is less than the tabulated value the hypothesis is accepted. Theabove analysis infers that the occupational status has no significant influence over the media creating awareness.
Table 11 : Occupational status and Items possessed
S.NO OCCUPATIONALSTATUS A B C D E F G H I J K TOTAL
1. Agriculture 21 16 21 15 11 21 45 35 15 21 9 230
2. Business 38 8 15 8 9 9 23 25 19 18 8 180
3. Employed 34 7 19 9 8 8 19 19 14 11 12 160
4. Retired 12 6 14 5 7 5 21 27 16 10 8 131
5. Others 8 4 13 6 3 4 11 10 15 7 4 85
Total 113 41 82 43 38 47 119 11 6 79 67 41Sources: Primary data
79

International Journal of Enterprise and Innovation Management Studies (IJEIMS) Vol. 1 No. 1
The calculated value of Chi-Square is 147.394 and the tabulated value of Chi-Square with 40 degrees of freedom at5% significant level is 55.758.Since the calculated value is greater than the tabulated value the hypothesis is rejected. Theabove analysis infers that the occupational status has no significant association over the item possessed.
VIII.CONCLUSION
Despite the basic characteristics of consumers the behavior pattern of consumers are more or less similar toeach other, particularly in the aspects like quality, preference and decision making. However it is evident that thepresent approaches to draw the attention of customers are not adequate. The consumers are particular about theappropriate system of distribution and hence there is a great need for change in the distribution system. It may not bealways correct to say that consumers behave in the same way as it much depends on type of products, quality of theproducts and price of the products. Therefore the producer must be paid special attention at least with regard to priceand distribution system to cover the large number of customers. This is mainly because of the fact that the buyingcapacity of the consumers may not be equal to the buying capacity.
REFERENCES1. PHLIP KOTLER, “Marketing Management” Reprint(2001) Himalaya Publishing House, Mumbai.
2. PHLIP KOTLER, “Principles of Marketing.” Reprint(2001) Himalaya Publishing House, Mumbai.
3. B.S. Rathor, “Advertising Management”- Reprint(2001) Himalaya Publishing House, Mumbai.
4. Primary data.
80

International Journal of Enterprise and Innovation Management Studies (IJEIMS) Vol. 1 No. 1
COTTON CULTIVATION AND MARKETING – A STUDY ONPROSPECTS AND PROBLEMS IN TIRUPUR DISTRICT
S.V. RAMESHAsst. Professot / Head, Dept. of Commerce, Dr. N.G.P. Arts and Science College, Coimbatore - 641 048 E-mail :
ABSTRACT
Agriculture is fundamentally different from industry and it plays a significant role in the economic developmentof a country. In the line of attack, India’s prosperity depends upon the agricultural prosperity. There are manykinds of agricultural products produced in India like Cotton, Tobacco, Paddy, Wheat, and Sugarcane etc. Themarketing of all these farm products generally tends to be a complex process. Agricultural marketing involvesmany operations and processes through which the food and raw materials move from the farm to the finalconsumers. Agriculture provides goods for consumption and exports and manufacturing sectors. The suitablemarketing system should be designed so as to give proper reward or return to the efforts of the tiller of the soil.Hence the researcher is intended to identify the existing and emerging prospects in cultivation and production ofCotton in Tirupur district as well as to analyze the emanated and enlarging problems in marketing of Cotton toarrive at appropriate authentication and respective rejuvenation.
Key words - Agriculture, Cotton Cultivation, Marketing, Rejuvenation, Paddy.
I.INTRODUCTION
Agriculture is the backbone of an agriculture country, like India. On the other hand, in India, the middlemenenjoy the cream at the cost of disability, illiteracy etc, of the poor Indian farmers. A small part of the price paid bybuyers reaches the farmers while the big part is sucked by the middlemen. Farmers are handicapped mainly insecuring a fair and reasonable price for their produce. The reasons are many-lack of regulated markets, ungradedproduce, no Agmark, inadequate storage and warehousing facility etc. At present, the conditions have been greatlyimproved. Today, agriculture being modernized, leads to manifold productions. The role of marketing is fastchanging. Hence the researcher is attempted to analyze the prospects and problems in marketing of cotton inTirupur district as it is one of the leading and traditional agricultural products in India.
II.OBJECTIVESOFTHESTUDYThe study is carried with the following specific objectives:-
¾ To analyze the production and marketing of Cotton in Tirupur district.
¾ To study the existing marketing practices of the Cotton cultivators in Tirupur district.
¾ To identify the factors influencing the cotton cultivation and problems faced by the Sample respondentsin the study area.
¾ To offer suggestions based on the results of the study for effective marketing of cotton.
III.SCOPEOFTHESTUDYThe study specifically deals with the prospects and problems in marketing of cotton with reference to Tirupur
district. The study intends to know the profile of the farmers who are cultivating cotton and problems faced by thefarmers in marketing their cotton. The findings from this study will help the government to look after the problemsof farmers who are cultivating cotton. The guidelines given by the researcher will be more suitable to overcome theproblems faced by the farmers who are cultivating cotton.
IV.METHODOLOGYOFTHESTUDYThe present study is based on the field survey conducted with the help of a well-structured questionnaire and
interviews with farmers who are cultivating and marketing cotton. The study is confined to Tirupur district and theprimary data was collected from 150 respondents.
V.LIMITATIONSOFTHESTUDY
The study is the cause to experience with the following limitations.
81

International Journal of Enterprise and Innovation Management Studies (IJEIMS) Vol. 1 No. 1
¾ Only 150 respondents have been taken into consideration
¾ The study is restrained to Tirupur district.
¾ The respondents might not have been disclosed the actual facts due to their busy schedule and hencethe findings may not be applicable to the whole universe.
VI.HYPOTHESISOFTHESTUDYIn tune with the objectives of the study, the following hypothesis were formulated and tested.
¾ There is no significant relationship between Educational Qualification and Quantity of Cotton Supplied.
¾ There is no significant relationship between Possession of Land and Quantity of Cotton Supplied.
¾ There is no significant relationship between Distance of Market Yard and Quantity of Cotton Supplied.
¾ There is no significant relationship between Experience in Cultivation of Cotton and Quantity ofCotton Supplied
VII.ANALYSISANDINTERPRETATIONTools applied for the study
The following statistical tools were applied for this research and interpretations were also made.
¾ Percentage analysis
¾ Chi-square analysis
¾ Ranking analysis
Percentage Analysis
Table A
Educational Qualification No. of Respondents % Age No. of Respondents %
Illiterate 51 34.0 Below 30 yrs 36 24.0
Primary School level 32 21.3 30 – 40 yrs 68 45.4
High School level 35 23.4 Above 40 yrs 46 30.6
College level 32 21.3 Total 150 100
Total 150 100 Distance No. of Respondents %
Type of Holding land No. of Respondents % Below 5 kms 61 40.6
Own Land 73 48.7 5-10 kms 54 36.0
Leased Land 36 24.0 Above 10 kms 35 23.4
Both Own andTotal 150 100Leased Land 41 27.3
Total 150 100 TransportationArrangements No. of Respondents %
Mobilization of Fund No. of Respondents % Own arrangement 39 26.0
Own fund 51 34.0 Commission agents 29 19.3
Borrowings fromfinancial institutions 36 24.0 Regulated market 48 32.0
Borrowings from Co-operative marketingmarket intermediaries 63 42.0 societies 34 22.7
Total 150 100 Total 150 100
Prospects No. of Respondents % Problems No. of Respondents %
Cropping finance 40 26.7 Loss of weight 49 32.7
Procurement of inputs 3 2.0 Wastage during handling 12 8.0
82
International Journal of Enterprise and Innovation Management Studies (IJEIMS) Vol. 1 No. 1
Transport arrangements 20 13.3 Improper fumigation service 25 16.7
Supply of packingmaterials 9 6.0 Damage by rats 26 17.3
Storage facility 52 34.7 Wet due to rain 23 15.3
Pledge loan facility 15 10.0 Poor maintenance 15 10.0
Immediate payments 8 5.3 Total 150 100
Market information 3 2.0
Total 150 100
Source: Survey Data
Educational Qualification of the RespondentsIt could be observed from the above A that 34.0% of the respondents are illiterates, 21.3% of the respondents are
having primary school level of education and collegiate level and 23.4% of the respondents are having higher secondaryschool level of education. It is concluded from the above analysis that majority of the respondents are illiterates.
Age of the RespondentsIt is noted from the above A that 24.0% of the respondents are belonging to below 30 years of age group,
45.4% of the respondents are belonging to 30-40 years of age group and 30.6% of the respondents are belonging toabove 40 years of age group. It is concluded from the above analysis that majority of the respondents are belongingto 30-40 years of age group.
Position of Land Holdings of the RespondentsIt is identified from the above A that 48.7% of the respondents are having own land, 24.0% of the respondents
are having leased land and 27.3% of the respondents are having both own and leased land. It is concluded from theabove analysis that majority of the respondents are having own land.
Distance of Market Yard from the Place of RespondentsIt is observed from the above A that 40.6% of the respondents are having below 5 kms of distance from their
field, 36.0% of the respondents are having 5-10 kms of distance from their field and 23.4% of the respondents arehaving above 10 kms of distance from their field. It is concluded from the above analysis that majority of therespondents are having below 5 kms of distance from their field.
Sources of Financial NeedsIt is highlighted from the above A that 34.0% of the respondents are having own fund, 24.0% of the respondents are
borrowings from financial institutions and 42.0% of the respondents are borrowings from market intermediaries. It isconcluded from the above analysis that majority of the respondents are borrowings from market intermediaries.
Marketing Facilities offered by the IntermediariesIt is identified from the above A that 34.7% of the respondents are opined that the intermediaries arranging
storage facility, 26.7% of the respondents are opined that the intermediaries arranging cropping finance, 13.3% ofthe respondents are opined that the intermediaries arranging transport arrangement and remaining 10.0% of therespondents are opined that the intermediaries arranging pledge loan facility. It is concluded from the above analysisthat majority of the respondents are opined that the intermediaries arranging storage facility.
Problems in Storing the Cotton in the GodownIt is noted from the above A that 32.7% of the respondents are facing the problem of ‘loss of weight’ while in
storing their cotton, 8.0% of the respondents are facing the problem of ‘wastage during handling’ while in storing theirCotton, 16.7% of the respondents are facing the problem of ‘improper fumigation service’ while in storing their Cotton,17.3% of the respondents are facing the problem of ‘damage by rats’ while in storing their Cotton, 15.3% of therespondents are facing the problem of ‘wet due to rain’ while in storing their Cotton, and remaining 10.0% of therespondents are facing the problem of ‘poor maintenance’ while in storing their Cotton,. It is concluded from the aboveanalysis that majority of the respondents are facing the problem of ‘loss of weight’ while in storing their Cotton.
83

International Journal of Enterprise and Innovation Management Studies (IJEIMS) Vol. 1 No. 1
Chi-Square Analysis
Table B
Educational Quantity of Cotton Supplied Total Possession of Land Quantity of Cotton Supplied TotalQualification Low Medium high Low Medium high
Illiterate 5(16.7) 19(38.0) 27(38.6) 51 Own Land 19(63.3) 25(50.0) 29(41.4) 73
Primary 13(43.3) 6(12.0) 13(18.6) 32 Leased Land 9(30.0) 16(32.0) 11(15.7) 36
High School 6(20.0) 15(30.0) 14(20.0) 35 Both Own &Leased Land 2(6.7) 9(18.0) 30(42.9) 41
Collegiate 6(20.0) 10(20.0) 16(22.9) 32 Total 30 50 70 150
Total 30 50 70 150 Experience Quantity of Cotton Supplied
Quantity of Cotton Supplied Low Medium high Total
Distance Low Medium high Total Upto 5 years 8(26.7) 26(52.0) 42(60.0) 76
Upto 5 kms 10(33.3) 14(28.0) 37(52.9) 61 6-10 years 18(60.0) 19(38.0) 21(30.0) 58
6-10 kms 14(46.7) 23(46.0) 17(24.3) 54 Above 10 years 4(13.3) 5(10.0) 7(10.0) 16
Above 10 kms 6(20.0) 13(26.0) 16(22.9) 35 Total 30 50 70 150
Total 30 50 70 150
Source: Survey Data
Chi-Square Test
Table C
No Association Between Calculated Degree of TableChi- Square Value freedom Value Result
Educational Qualification and Quantity of Cotton Supplied 13.986 6 12.592 Rejected
Possession of Land and Quantity of Cotton Supplied 18.337 4 9.488 Rejected
Distance and Quantity of Cotton Supplied 10.235 4 9.488 Rejected
Experience and Quantity of Cotton Supplied 9.778 4 9.488 Rejected
Source: Survey Data
Educational Status and Quantity of Cotton SuppliedIt could be concluded from the Table C that the calculated Chi-Square value is more than the table value and
the result is rejected at 5 percent level. Hence, there is significant relationship between Educational Qualificationand Quantity of Cotton Supplied.
Possession of Land and Quantity of Cotton SuppliedIt could be identified from the Table C that the calculated Chi-Square value is more than the table value and
the result is rejected at 5 percent level. Hence, there is significant relationship between Possession of Land andQuantity of Cotton Supplied.
Distance of Market Yard and Quantity of Cotton SuppliedIt could be noticed from the Table C that the calculated Chi-Square value is more than the table value and the
result is rejected at 5 percent level. Hence, there is significant relationship between Distance of Market Yard andQuantity of Cotton Supplied
84

International Journal of Enterprise and Innovation Management Studies (IJEIMS) Vol. 1 No. 1
Experience in Cultivation and Quantity of Cotton SuppliedIt could be inferred from the Table C that the calculated Chi-Square value is more than the table value and the
result is rejected at 5 percent level. Hence, there is significant relationship between Experience in Cultivation andQuantity of Cotton Supplied
Ranking Analysis
Reasons for Cultivating Cotton for a Long Period
Table D
S.No. Reasons Mean Score Total score Rank
1. Highly profitable 53.9 8082 I
2. Better marketing facilities 52.1 7819 III
3. Traditional crop 52.8 7923 II
4. Able to store for a longer period 48.0 7198 V
5. Less labour work 50.1 7522 IV
6. Able to wait for a better price 43.0 6447 VI
Source: Survey Data
The above table D shows the reason for cultivating cotton for a long time by the farmers. The first and bestreason for cotton cultivation is ‘Highly profitable’ with Garrett scored as 8082 points. The second reason for cottoncultivation is ‘traditional crop’ with Garrett scored as 7923 points. The third reason for cotton cultivation is ‘bettermarketing facilities’ with Garrett scored as 7819 points. The fourth reason for cotton cultivation is ‘less labourwork’ with Garrett scored as 7522 points. The fifth reason for cotton cultivation is ‘Able to store for a longer period’with Garrett scored as 7198 points and final reason for cotton cultivation is ‘Able to wait for a better price’ withGarrett scored as 6447 points. It is concluded from the above analysis that majority of the respondents are doing thecotton cultivation for the major reasons are ‘Highly profitable’ and ‘traditional crop’.
Problems Faced by the Respondents
Table E
S.No. Problems Mean Score Total Score Rank
1. Insufficient pledge loan facility 36.42 5463 XV
2. Price fluctuation 44.72 6708 XIV
3. Poor post storage facilities 48.82 7323 X
4. Non-existence of Agmark Lab. 52.99 7949 V
5. Lack of market information 52.77 7916 VI
6. Improper method of sale 53.91 8087 II
7. Unscientific weighing machines 48.79 7318 XI
8. Delay in unloading services 50.56 7584 IX
9. High marketing cost 46.36 6954 XIII
10. Unauthorized Deductions 48.65 7298 XII
11. Poor customer relationship 50.63 7594 VIII
12. Location of banks 53.77 8066 III
13. Insufficient godown facility 51.41 7712 VII
14. Poor quality of packing materials 53.45 8018 IV
15. Poor government supports 54.65 8197 I
Source: Survey Data
85

International Journal of Enterprise and Innovation Management Studies (IJEIMS) Vol. 1 No. 1
The above table E shows the problems faced by the respondents in cultivation of cotton. The first and thehighest problem for cotton cultivation is ‘Poor government support’ with Garrett scored as 8197 points. The secondand third problems are ‘Improper method of sale’ and ‘Location of banks’ with Garrett scored as 8087 and 8066points. The fourth and fifth problems are ‘Poor quality of packing materials’ and ‘Non-existence of Agmark Lab’with Garrett scored as 8018 and 7949 points. It is concluded from the above analysis that majority of therespondents are faced the major problems are ‘Poor government supports’ and ‘Improper method of sale’.
VIII.FINDINGS,SUGGESTIONSANDCONCLUSIONPercentage Analysis
¾ The majority of respondents are illiterates.
¾ The majority of respondents are belonging to 30-40 years of age group.
¾ The majority of respondents are having own land.
¾ The majority of respondents are having below 5 kms of distance from their field.
¾ The majority of respondents are borrowings from market intermediaries.
¾ The majority of respondents are opined that the intermediaries arranging storage facility.
¾ The majority of respondents are facing the problem of ‘loss of weight’ while in storing their cotton.
Chi-Squ1are Analysis¾ There is significant relationship between Educational Qualification and Quantity of Cotton Supplied.
¾ There is significant relationship between Possession of Land and Quantity of Cotton Supplied.
¾ There is significant relationship between Distance of Market Yard and Quantity of Cotton Supplied
¾ There is significant relationship between Experience in Cultivation and Quantity of Cotton Supplied
Ranking Analysis¾ The majority of respondents are cultivating cotton for the two major reasons ‘Highly Profitable’ and
‘Traditional Crop’.¾ The majority of respondents faced the major problems are ‘Poor government support’ and ‘Improper
method of Sale’.
IX.SUGGESTIONSBased on the major findings, followings are the suggestions offered to make the study more useful and appreciable.
¾ It is noticed that the prices prevailing in the cotton markets are highly fluctuating which affects themargin of the farmers. In order to avoid this situation, a steady demand for the cotton has to beidentified by expanding the global market for cotton which would boost the sales volume as well as theprice in the local market.
¾ If the cotton is stored for more than three months in the godowns then the fumigation process isessentially needed. The fumigation process should take place within a time schedule and it has tomaintain proper records about fumigation services.
¾ The packing materials in the form of gunny bags supplied by the commission agents are of good qualityand they provide transportation, loading and unloading facilities. Whereas regulated market and co-operative marketing societies do not supply the facilities. This problem leads to loss of arrivals ofcotton and sale of the same in co-operative marketing societies and regulated market. The authorities ofregulated markets and co-operative marketing societies should concentrate on these facilities andrectify the problems which would attract more farmers to have more transactions with regulatedmarkets and co-operative marketing societies.
¾ At present the transactions of cotton are taking in two different market places ie., regulated market and
commission agents’ association. In order to avoid this unhealthy environment, a common market place has
86

International Journal of Enterprise and Innovation Management Studies (IJEIMS) Vol. 1 No. 1
to be established by the government, which would promote cotton trade in the state. The commonmarket place should be equipped with all infrastructure facilities. The establishment of such a placewould solve many of the problems prevailing in the cotton trade. From the government point of view,this provision would facilitate mobilizing regular income in terms of service charges, rent for buildingsand also make it easy to monitor the trading activities.
¾ The lack of storage facility for cotton, affects the farmers to protect their cotton in a proper way. If the
authorities of the markets notify the problems, farmers may be benefited more by the way of timely sales.
¾ The other equally important inference of the study is finance related problem. To safeguard the grower-sellers from the exploitative activities emerging out of lack of adequate finance, the grower-sellers maybe given the necessary financial assistance by the Regulated and the Co-operative Marketing societiesat nominal rates of interests.
¾ The study revealed facts that the care taken by the regulated and co-operative marketing society inprotecting the stored cotton in their godowns is satisfactory comparing to the care taken by thecommission agents. In this context the authority concerned may take extra efforts and satisfy thestorage needs of the cotton cultivators.
X.CONCLUSION
Since India is the home for cultivating cotton, the government can encourage the farmers to export directly toother countries to enable them to have a fair share of the profit earned through international trade and foreignexchange. The demand for cotton can be assessed through the export promotion council in and also abroad. Thegovernment could come forward to extend the credit facilities to the farmers in accordance with their requirementseven by accepting the pledging of their future cultivation and production of cotton.
REFERENCES¾ Ahmedabad Textile Industry Research Association and Ahmedabad Institute of Management Association. 1984.
Inter-firm comparison of costs, productivity, and damage (composite mills). July to September,Ahmedabad, India
¾ Annual Survey of Industries (ASI), 2000-01. Ministry of Statistics and Programme Implementation, CentralStatistical Organisation (CSO), Kolkata, India
¾ Apparel Export Promotion Council (AEPC), various issues, Handbook of export statistics, Ministry ofTextiles,Govt. of India, New Delhi.
¾ Association of Man Made Fibre Industry of India, Various reports, Mumbai, India.
¾ Association of Synthetic Fibre Industry, Handook of Statistics on Man-Made Synthetic Fibre/Yarn Industry,Part-I,Mumbai, India.
¾ Ahmedabad Textile Industry Research Association (ATIRA), Bombay Textile Research Association (BTRA),Northern India Textile Research Association (NITRA), South India Textile Research Association(SITRA).1991. Norms for the textile industry. India.
¾ Bedi, Jatinder S. and Banerjee, Purnendu K.2007. “Discrepancies and Validation of data of Various Segmentsof Indian Manufacturing Sector: Factory Sector & Non-Factory Sector and Small, Medium & Large ScaleManufacturing Sector.” Economic and Political Weekly, March.
¾ Chatterjee, C. 2006. Textile times, February-March, New Delhi: CITI.
¾ CRISIL report in Vision for Indian Textiles and Clothing Industry, 2007–2012, Confederation of Indian TextileIndustry document, 2006.
¾ Cotton Textile Export Promotion Council. various issues. Handbook of export statistics. Bombay, India
¾ Directorate General of Commercial Intelligence and Statistics(DGCI&S),various issues, Foreign TradeStatistics,Ministry of Commerce, Kolkata, India
¾ Directorate of Cotton Development (Kipas Vikas Nideshalay, Mumbai), Department of Agriculture andCooperation, Ministry of Agriculture. India.
¾ East India Cotton Association, Mumbai, India
87

International Journal of Enterprise and Innovation Management Studies (IJEIMS) Vol. 1 No. 1
¾ Economic Survey, 2004-05, 2005-06, 2006-07, 2007-08, Government of India, Ministry of Finance, EconomicDivision, New Delhi.88
¾ Federation of Indian Textile Engineering Industry (FITE), various issues, Mumbai.
¾ Gherzi Eastern Limited. 2002 & 2006. Cost Benchmarking Study: India viz a viz Bangladesh, Indonesia, China,Sri Lanka, and Pakistan. Mumbai, India.
¾ Indian Cotton Mills’ Federation. 2004. Handbook of statistics on cotton textile industry. New Delhi: Author.
¾ International Textile Manufacturing Federation(ITMF), various issues, Werner International Inc. ManagementConsultants. Brussels, Belgium.
¾ South India Mills Association. Various issues. Coimbatore, India.
¾ South India Textile Research Association. Various issues. Coimbatore, India.
¾ Suri, K. C. 2006. Political economy of agrarian distress. Economic and Political Weekly, April 22.
¾ Synthetic and Rayon Textile Exports Promotion Council, Man Made Fibers Textiles Exports Statistics, 2006-07.Mumbai, India.Tamhene, V. K. 2005. Labour issues in textiles. Textile Times.
¾ World Bank. 2005. World Development Report 2005. Oxford University Press, New Delhi
¾ World Trade Organization. International Trade Statistics, Various Issues. Geneva. Availableat:[email protected].
¾ Kothari C.R., “Research Methodology”, Wishwa Prakasham, New Delhi, 2003.
¾ Gupta, S.P., “Statistical Methods”, Sultan Chand and Sons, New Delhi, 1990.
¾ Mamoria, C.B., “Agricultural Problems of India”, Kitab Mahal, Allahabad, 1995.
88

International Journal of Enterprise and Innovation Management Studies (IJEIMS) Vol. 1 No. 1
IMPACT OF MICROFINANCE - AN EMPIRICAL STUDY ON THEATTITUDE OF SHG LEADERS IN KANYAKUMARI DISTRICT –
TAMILNADU
Dr. N. THALAVAI PILLAI1 and Dr. S. NADARAJAN2
1Professor, Department of Management Studies, Sun College of Engineering and Technology, Erachakulam,Nagercoil, Kanyakumari District, Tamilnadu.India E-mail – [email protected]
2Head, Department of Management Studies, Anna University of Technology, Tirunelveli, Tamilnadu.India [email protected]
ABSTRACT
Microfinance is a powerful tool to alleviate poverty and empowerment of rural women and it is effective inbringing social and economic changes in the rural India with improved managerial abilities of women.Microfinance and self help groups are found to be successful in promoting empowerment of women leading todevelopment. This paper analyses the impact of microfinance on the empowerment of SHG leaders inpsychological, economic ,social aspects, managerial skills and their attitudes in Kanyakumari Disrtict.
Keywords - Microfinance-SHG-Poverty alleviation- empowerment- psychological-economical-social andManagerial.
1.INTRODUCTION
The structure of rural financial market in India has both formal and informal financial intermediaries. It iswidely accepted that formal financial sector is not effectively serving the rural poor in developing countries. Theperformance of formal financial institutions in India especially in lending the poor, has been unsatisfactory. Thereare a number of constraints viz. limited land and small economic activity but the demand for credit has beenincreasing with the growing family size, higher consumption expenditure and social obligation and so on.
Poverty and unemployment are the major problems of any underdeveloped countries, and India is no exception. In India
about 26 percent of the population is living below poverty line. In the rural area 27.1 percent of the population is living under
poverty. The overall unemployment rate is 7.32 percent. The female unemployment rate is 8.5 percent. The rate of growth of
women unemployment in the rural area is 9.8 percent. This is because of the low growth rate of new and productive employment.
2.REVIEWOFPREVIOUSSTUDIES
Impact of Microfinance on women were addressed by researchers and some important studies are presentedhere..Hashemi, Schuler, Riley (1996) and Kabeer (1998) reported that microfinance empowered women inBangladesh, Makumbe et al (2005) found that microfinance has a positive impact on decision making in Tanzania,Hulma and Mosley (1996) found growth of microfinance borrowers in Indonesia, India, Bangladesh and Sri Lanka.Sridhar Krishna(2004) advocated for giving legal status of SHGs. Nataraju et al (2005) indicated that more financialsupport does not help the members and recommended that they should be provided with institutional support inKarnataka. Rajendran et al (2010) concluded that there is s definite improvement of psychological, economical,social; and managerial skills.Among the SHG leaders in Vellore district of Tamilnadu.
3.MICROFINANCE
Microfinance refers to small savings, credit and insurance services extended to socially and economically poorsegments of society. It is defined as provision of thrift, credit and other financial services and products of very smallamounts distributed to the poor in rural and semi urban or urban areas, for enabling them to raise their income levelsand improve living standards. At present a large part of micro finance activity is confined to credit only. Womenconstitute a large number of users of micro credit savings and services.
4. ORIGIN AND CONCEPT OF SHGs
The origin of Self Help Groups (SHGs) is the brainchild of Grameen Bank of Bangaladesh, founded by Prof.
Mohammed Yunus in 1975, who tried out a new approach to rural credit in Bangaladesh. Grameen gave loans without
89

International Journal of Enterprise and Innovation Management Studies (IJEIMS) Vol. 1 No. 1
asking borrowers either to provide collateral or engage in paper work. It pioneered what has come to be known asgroup based living. In India NABARD initiated SHGs in the year 1986-87 But the real effort was taken after 1991-92 from the linkage of SHGs with the banks. A SHG is a small economically homogeneous affinity group of therural poor voluntarily coming forward to save a small amount of money regularly, which is deposited in a commonfund to meet the members’ emergency needs and to provide collateral free loans decided by the group. The SHGshave been recognised as useful tool to help the poor and as an alternative mechanism to meet the urgent credit needsof poor through thrift. In Tamilnadu the SHGs were started in 1989 at Dharmapuri District. At present Four lakhgroups are functioning with 23.83 lakh members in Tamilnadu. There are some men SHGs are also functioning.
5. WORKING OF SHGs
The SHGs are working in a democratic manner. The upper limit of members in a group is restricted to 20.Among them a member is selected as an ‘animator’ and two members are selected as representatives. The animatoris selected for a period of two years. Members of the group meet every week. They discuss social and communityprogrammes, group savings, rotation of funds, bank loan and repayment of loan.
From the previous studies it is widely believed that microfinance is a powerful tool to alleviate poverty andempowerment of rural women, it is an effective tool in bringing social, physiological and economic changes in the ruralareas with improved managerial abilities of women. SHGs and microfinance are found to be successful in promotingempowerment of women leading to development. It has been accepted that microfinance plays a vital role in reducingpoverty since it paves the way for employment and empowerment which leads to economic development. Poverty can beeradicated only by employment opportunities and the employment seeker and worker should become a job provider and itis possible through microfinance coupled with minor enterprises. Empowerment of women through microfinance benefitsindividual women, her family and the community as a whole through collective action for development. Group formation,provision of collateral free credit, participatory efforts for income generating self employment, knowledge and awareness,leadership, group management and skill development have improved the socio economic conditions of rural poor.
6.OBJECTIVEOFTHESTUDY
The objective of the present study is to analyse the impact of microfinance on the attitudes of the SHG leadersin Kanyakumari District.
7.METHODOLOGY
So far no study has been undertaken in Kanyakumari District (Tamilnadu) about the impact of microfinanceamong the leaders of the SHGs and hence the study was undertaken in Kanyakumari District. Leaders of the SHGsregistered with Panchayats from Thovalai and Thiruvattar blocks were selected for the study. Accordingly 30 SHGsfrom Thovalai block and 26 SHGs from Thiruvattar block, in total 56 SHGs were included in the study from twovillage panchayats. Leaders of the groups were interviewed with a well structured and pre-tested interview scheduleduring the month of September and October 2010. The schedule included questions related to the generalinformation and psychological, economic and social empowerment as well as managerial skill of the respondents.Simple statistical tools like percentage analysis, mean, standard deviation were used to draw conclusions in additionto ANOVA. Scores were allotted on Likert’s five point scale.
8.ANALYSISANDDISCUSSION
The impact of microfinance on the SHG leaders (respondents) has been measured through the Likert’s scaleconstructed on the basis of 36 variables. The responses have been quantified with the help of a scoring scheme. A highscore of ‘5’ was allotted to strongly agreed responses and a low score of ‘1’ was given to strongly disagreed responses.
Table - I Salient features of the study area
Block No. of SHG % to total SHGs within District % of population below poverty line
Thovalai 1067 7.37 29.08
Thiruvattar 1672 11.56 29.55
District 14463 100 28.84
Source : DRDA – Kanyakumari District.
90
International Journal of Enterprise and Innovation Management Studies (IJEIMS) Vol. 1 No. 1
9.SOCIO-ECONOMICPROFILEOFTHERESPONDENTS
The study reports that out of the total 56 samples selected for the study, three respondents (5.4 percent) are in theage group of 20 to 25 years. Six respondents (10.7 percent) are in the age group of 26 to 30 years. Eleven respondents(19.6 percent) are in the age group of 31 to 35 years. Thirteen respondents (23.2 percent) are in the age group of 36 to 40years and 23 respondents are in the age group of above 40 years. Of the total respondents 56, 4 respondents (7.1 percent)are coolies, 38 respondents (67.9 percent) are housewives, 7 respondents (12.5 percent) are agricultural labourers and 7respondents (12.5 percent) are engaged in other household activities and small trading. Regarding literacy level 20respondents (35.7 percent) have studied upto SSLC, 12 respondents (21.4 percent) studied upto HSC and 14 respondents(25 percent) are graduates, 6 (10.7 percent) are post graduates and 4 respondents (7.1 percent) have other qualification likeITI, Polytechnic and the like. Regarding monthly income of the total sample 56, 43 respondents (76.8 percent) are in themonthly income group of less than Rs. 2500, 9 respondents (16.1 percent) are in the income group of Rs. 2500 to 3000.Three respondents (5.4 percent) are in the income group of Rs. 3001 to 3500 and only one respondent is in the income ofabove Rs. 4000. Of the total 56 respondents 47 (83.9 percent) are married, 8 respondents (14.30 percent) are unmarriedand one respondent (1.8 percent) is a widow. Of the total sample, 27 respondents (48.2 percent) have family members of 4,15 respondents (26.8 percent) have family members of 5, 11 respondents (19.6 percent) have family members of 3 and 2respondents (3.6 percent) have family members of 6 and only one respondent have family members of 2. 51 respondents(91.1 percent) live in their own houses and only 5 respondents live in rented houses.
10.IMPACTOFMICROFINANCE-ANALYSISANDDISCUSSION
The researcher has identified twenty six variables covering the impact of microfinance on psychological,economic and social aspects. The measurement was on Likert’s five point scale and scores were assigned for eachstatement. A high score of ‘5’ was allotted for strongly agreed statements and a low score of ‘1’ was allotted tostrongly disagreed statements. An analysis of impact of microfinance on the psychological, economical and socialempowerment is presented in Tables 2, 3 and 4
Table - II Impact of Microfinance on Psychological well being
S. No. Variables Mean Std. Deviation
1. Improvement in Courage 4.96 0.19
2. Improvement in Self confidence 4.95 0.23
3. Improvement in Self worthiness 4.91 0.29
4. Improvement in Skill development 4.43 0.68
5. Improvement in Literacy level 3.38 1.09
6. Awareness on Health and Sanitation 3.54 0.97
7. Awareness on Children’s Education 3.96 1.03
8. Awareness on Food and Nutrition 3.82 1.21
9. Awareness about the Environment 4.13 0.90
10. Awareness about Peace in the family 4.16 0.62
Source – Primary data
10.1 Improvements in psychological well being off rural womenThe study reports that 54 respondents (97 percent) strongly agreed that microfinance brought courage among rural
women. Fifty three respondents (95 percent) strongly opined that their self confidence improved by participating inmicrofinance. Fifty one respondents (92 percent) strongly agreed that micro finance has improved their self worthiness.Twenty eight respondents (50 percent) strongly agreed that there is a development of women’s skill to generate income byusing microfinance. Twenty six respondents (46.4 percent) agreed that by participating microfinance programme theirliteracy level of rural women improved. The study reports that 34 respondents (61 percent) agreed that microfinance hasimproved awareness about the education of their children, 25 respondents (45 percent) agreed that microfinance improvedawareness on health and sanitation, 22 respondents (40 percent) strongly agreed that microfinance improved their
91

International Journal of Enterprise and Innovation Management Studies (IJEIMS) Vol. 1 No. 1
awareness on food and nutrition, 29 respondents (52 percent) agreed that micro finance programme increased someawareness about their environment and 41 respondents (74 percent) agreed that happiness in the family increasedafter the participation in microfinance programme.
Table - III Impact of Microfinance on Economic Improvement
S. No. Variables Mean Std. Deviation
1. Women are economically empowered 4.64 0.62
2. Microfinance reduce poverty 4.63 0.59
3. Microfinance improve rural savings 4.57 0.74
4. Women under take IGA 3.80 1.05
5. Increased employment opportunities 3.30 1.17
6. Created assets in rural areas 3.05 1.17
7. Increase the standard of living 3.82 0.97
Source – Primary data
10.2 Economic ImprovementThe study reports that microfinance has some economic impact among rural women. After the participation in
microfinance through the SHGs 39 respondents (70 percent) strongly agreed that women are economically andsocially empowered. Thirty seven respondents (66 percent) strongly agreed that microfinance reduced poverty.Thirty eight respondents (68 percent) agreed that microfinance programme improved rural savings. Twenty ninerespondents (52 percent) disagreed that microfinance induced income generating activities. Twenty threerespondents (41 percent) disagreed that microfinance induced income generating activities. Twenty threerespondents (41 percent) disagreed that microfinance increasing rural employment. Twenty seven respondents (48percent) disagreed that microfinance created assets in rural areas and 32 respondents (57 percent) agreed that theirstandard of living has increased through microfinance.
Table -IV Impact of Microfinance on Social aspects
S. No. Variables Mean Std. Deviation
1. Managerial abilities of women 4.18 1.19
2. Role in decision making 4.43 0.78
3. Group management 4.16 0.87
4. Awareness about training by NGO 3.45 1.23
5. Micro enterprises 3.02 1.10
6. Participation in democratic institutions 2.82 1.13
7. Sustainability and cohesiveness of the group 3.41 1.06
8. Freedom to express 3.80 0.86
9. Independent movement 3.79 0.87
Source – Primary data
10.3 Social empowermentThe study reports that the micro finance programme has increased their managerial abilities of the leaders of SHGs.
Thirty two respondents (57 percent) strongly agreed to this statement. Thirty respondents (54 percent) strongly agreed thattheir decision making abilities have increased. Twenty eight respondents (50 percent) agreed that participation inmicrofinance has enhanced their group management skill. Twenty one respondents (38 percent) disagreed with thestatement that microfinance created awareness about training programmes organised by NGOs. Twenty eight respondents(50 percent) disagreed with the statement that microfinance brought some micro enterprises in the study area. Thirty five
92

International Journal of Enterprise and Innovation Management Studies (IJEIMS) Vol. 1 No. 1
respondents (63 percent) disagreed with the statement microfinance induced to involve in participation in democraticbodies, 40 respondents (71 percent) opined that microfinance programme has helped to increase the freedom of expressionand 39 respondents (70 percent) agreed that microfinance programme helped their independent movement.
11. RESULTS
A. Among the three dimensions of empowerment, psychological wellbeing ranks first followed by social aspectsand economic aspects ranked last.
Table - V
Dimensions of empowerment Mean SD Rank
Psychological 4.23 0.48 1
Social 3.97 0.37 2
Economical 3.71 0.46 3
B. There is a significant difference between the blocks of Thovalai and. Thiruvattar with respect to the psychologicalaspects of the respondents (F = 10.805, P = 0.002) at 0.05 level of significance. The respondents of Thiruvattar havebetter improvements (mean = 4.43, SD = 0.43) than the respondents belonging to Thovalai (mean = 4.05, SD = 0.45).
C. Table - VI
Dimensions of empowerment Blocks N Mean Std. Deviation
Psychological Thiruvattar 26 4.43 0.43
Thovalai 30 4.05 0.45
Social Thiruvattar 26 3.98 0.31
Thovalai 30 3.97 0.41
Economical Thiruvattar 26 3.67 0.62
Thovalai 30 3.75 0.27
D. Table - VII ANOVA
Dimensions of empowerment Source of Variation Sum of Squares DF Mean Square F P value
Psychological Between Groups 2.100 1 2.100 10.805 0.002*
Within Groups 10.497 54 0.194
Total 12.597 55
Social Between Groups 0.004 1 0.004 0.029 0.866
Within Groups 7.388 54 0.137
Total 7.392 55
Economical Between Groups 0.088 1 0.088 0.406 0.527
Within Groups 11.656 54 0.216
Total 11.743 55
* Significant at 5% level (P < 0.05)
C. There is no significant difference between the blocks Thovalai and Thiruvattar with respect to the social aspectsof the respondents (F = 0.029, P = 0.866) at 0.05 level of significance. The respondents of Thriuvattar havestatistically insignificant better improvements (mean = 3.98, SD = 0.31) than the respondents belonging toThovalai (mean = 3.97, SD=0.41).
93

International Journal of Enterprise and Innovation Management Studies (IJEIMS) Vol. 1 No. 1
D. There is no significant difference between the blocks Thovalai and Thiruvattar with respect to the economical aspectsof the respondents (F = 0.406, P = 0.527) at 0.05 level of significance. The respondents of Thiruvattar ownstatistically insignificant lesser improvements (mean=3.67,SD=0.62) than the respondents of Thovalai Block.
12.DEVELOPMENTOFMANAGERIALSKILL
A Self Help Group is a community based organisation, leaders of the groups need managerial skill to manage the
SHGs. Therefore the impact of microfinance in developing managerial skill is analysed with the following ten variable.
Table - XI Managerial Skills
S. No. Variables Mean Std. Diviation Rank
1. Planning skill 4.38 0.93 3
2. Organising ability 4.52 0.85 2
3. Coordination skill 4.54 0.85 1
4. Technical skill 3.73 3.08 6
5. Marketing skill 2.79 1.22 8
6. Entrepreneurial skill 2.77 1.20 9
7. Communication skill 3.71 1.02 7
8. Financial management skill 4.05 0.82 5
9. Decision making skill 4.36 0.67 4
10. Leadership skill 4.52 0.71 2
Source : Primary data
While analysing the impact of microfinance on the managerial ability of the SHG leaders in the study area, co-ordination skill is ranked first, among the managerial skills with a mean score value of 4.54. Contributions to theorganising ability and leadership skill of the SHG leaders ranked second with a mean scores of 4.52 each. Planning skill ofthe SHG leaders is ranked third with a mean score of 4.38, Decision making skill was ranked fourth with a mean score of4.36, Financial management skill was ranked fifth and Technical skill was ranked sixth, Communication skill was rankedseventh, Marketing skill was ranked eight and entrepreneurial skill was ranked ninth with a minimum mean score of 2.77
13.CONCLUSION
The study concludes that microfinance has brought better psychological and social empowerment than economicempowerment. The respondents of Thiruvattar block possess better empowerment than the respondents belonging to theThovalai block, even though both the blocks have same level of socio economic conditions. The impact of microfinance iscommendable in courage, self-confidence, self worthiness, skill development, awareness about environment, peace in thefamily, reduction of poverty improving rural savings, managerial ability decision making process and group management.In other variables the impact is moderate. As a result of participation in microfinance through the SHG programmes thereis observed a significant improvement of managerial skills, psychological well being and social empowerment.It isrecommended that the SHGs may be granted legal status to enhance the performance.
REFERENCES[1]. National Bank for Agriculture and rural Development(NABARD) 2008 Annual Report 2007-08 Mumbai.
[2]. Small industries Development Bank of India (SIDBI) 2009. Annual Report 2008-09 Lucknow.
[3]. The Hindu “Microfinance, Macro challenges” dt.01-11-2010
[4]. Business Line “Microfinance on test” October 18, 2010.
[5]. The Hindu “ Microfinance on severe stress” November 1, 2010.
94

International Journal of Enterprise and Innovation Management Studies (IJEIMS) Vol. 1 No. 1
[6]. Business Line “Microfinance model to treat thalassemia patients” dt. October 19, 2010.
[7]. Jeyanthi Gayari R. 2002 “SHGs in Kanyakumari District” M.Phil dissertation- Alagappa University Karaikudi.
[8]. Raj Mohan (2003) Activities of SHGs In Virudhunagsr District- A study. Tamilnadu Journal of Co-operation.
[9]. Piyush Tiwari and S.M.Fahad (2006) “Concept Paper- Microfinance Institutions in India”
[10]. Manimekalai N. and G. Rajeswari (2002) “Gross Roots Entrepreneurship through self help group” SEDMIJournal Vol.29.
[11]. Impact of Microfinance- An empirical study on the attitude of SHG leaders in Vellore District.Global Journalof Finance and management. (2010) Volume 2 p.59.
[12]. Government of India. Ministry of Agro and Rural Industries (2008) Annual Report 2007-08. New Delhi.
95

International Journal of Enterprise and Innovation Management Studies (IJEIMS) Vol. 1 No. 1
FINANCIAL PERFORMANCE ANALYSIS OF SELECTED SOFTWARECOMPANIES IN INDIA
Dr. S. USHAAssistand Professor (Finance), Sardar Vallabhbhai Patel International School of Textiles and Management Ministry
of Textiles, Govt. of India, Coimbatore.
1.1INTRODUCTION
The Information technology industry consists of all software companies which provide software solutions toproblems relating to business management namely production, marketing, finance and Human resource. Informationtechnology has created a revolutionary change in the Indian economic scenario. Today software has come to stay aspart and parcel of human life. The importance of software application was felt more after the globalization of theeconomy. This industry has created a revolution by employing large number of people, earning huge profit andjoining the club of Multi National Corporations. The Indian software companies hold the distinction of advancingthe country into the new-age economy. The growth momentum attained by the overall economy since the late 1990sto a great extent can be owed to the Information Technology sector, well supported by a liberalized policy regimewith reduction in telecommunication cost and import duties on hardware and software. Today, India is the worldleader in information technology and business outsourcing.
1.2STATEMENTOFTHEPROBLEM
In recent years, Information technology industry has come to occupy a major chunk of the corporate sector.From the day of economic liberalization till recent days, India’s information technology industry has registered aphenomenal growth in terms of numerical strength of software companies as well as investors. The industrycontributes a lion’s share to the growth of the corporate sector in terms of employment generation, revenue andentrepreneurial skills. Its amazing performance resulting in high rate of return to investors has attracted investorsfrom within and abroad. Foreign Direct Investment and Foreign Institutional Investments have increasedconsiderably in Information Technology industry. Indian software companies cater to the software requirementsdirectly and through Business Process Outsourcing. As a result the country has become a knowledge centre of theworld. So much so, the industry has made new rich class businessmen in a few years.
This situation raises the following issues :
(1) Is the performance of Indian software companies sustainable?
(2) Do all the software companies in India perform equally well?
(3) If not, how are they different from others in terms of performance?
(4) What are the factors influencing their performance?
(5) Are the software companies investment worthy?
The present study will find the answers to the above questions apart from giving policy implications for thebetterment of software companies in India.
1.3OBJECTIVESOFTHESTUDY
1. To evaluate the overall financial performance of selected software companies in India.
2. To analyse the determinants of the Operational Efficiency of all the selected companies using Step wiseMultiple Regression model.
1.4SIGNIFICANCEOFTHESTUDY
The Indian software industry has been the growth engine of the Indian economy. Hence the benefits of thepresent study are varied. It would help the management to understand the strengths and weakness of a company. Itwould help the policy makers to decide on policy implications. It would be useful to the creditors in assessing thecredit worthiness of a company to grant credit. The study will benefit the investors in making better investmentdecisions. The results of the financial analysis are also useful to the bankers, employees, researchers, academicians,customers and public in knowing the financial condition of the companies.
96

International Journal of Enterprise and Innovation Management Studies (IJEIMS) Vol. 1 No. 1
1.5METHODOLOGY
1.5.1 Sampling designThe study is confined to the Indian Software Industry. The data for the study have been collected mainly from
the prowess database. From the total population of 396 software companies, the sample companies were selectedbased on the following criteria:
(1) The company should have been listed with any of the stock exchanges in India.
(2) The companies which have the required financial data for a continuous period of 10 years (1997-98 to2006-07) have been selected, as the study has used 10 years data for the analysis. The companies forwhich the data was not available for one or more than one year in between or in the beginning or at theend of the study period have been ignored.
65 companies which satisfied the above conditions were selected as sample for the study.
1.5.2 Sources of dataThe data required for the study is secondary in nature. The main source of the data for the present study is the
Prowess database of the Centre for Monitoring Indian Economy and Capital line plus corporate database. Other sources ofdata were annual published reports of the companies, The Reserve Bank of India Bulletin, Annual survey of industries, Bombay Stock Exchange official Directory, C M I E monthly review of the Indian Economy and yearly reports oncorporate sector, Kothari Industrial year book, Coimbatore Stock Exchange, Libraries of various institutions, Researchpublications, Dailies and periodicals such as Economic times, Financial Express, Business Standard, Dalal street, CapitalMarket, Business World, Business India, Business today and various news papers. Editing, classification, and tabulation ofthe financial data collected from the above mentioned sources have been done as per the requirements of the study.
1.5.3 Period of studyThe period of study has been confined to one decade, from 1st April 1997 to 31st March 2007.
1.6HYPOTHESIS
There is no significant influence of the independent variables on the Operating Profit
1.7LISTOFCOMPANIESSELECTEDFORTHESTUDY
Table 1 displays the list of selected companies along with their classification details.
Table 1 : List of selected companies
S.No Company Name Abbreviation for the name
1 Ace Software Exports Ltd ASE
2 Aftek Infosys Ltd. AIL
3 Asian CERC Information Technology Ltd ACI
4 ASM Technologies Ltd ASM
5 B2B Software Technologies Ltd B2B
6 California Software Company Ltd CSC
7 Choksh Infotech Ltd CHK
8 Clio Infotech Ltd CLI
9 CMC Ltd CMC
10 Computech International Ltd CIL
11 Cranes Software International Ltd CRA
12 Cybertech Systems And Software Ltd CSS
13 Dynacons Systems & Solutions Ltd DSS
14 Financial Technologies (India) Ltd FTL
15 Geometric Software Solutions Company Ltd GSS
97

International Journal of Enterprise and Innovation Management Studies (IJEIMS) Vol. 1 No. 1
16 Goldstone Technologies Ltd GLD
17 GTL Ltd GTL
18 Hexaware Technologies Ltd HEX
19 Hinduja TMT Ltd HIN
20 IEC Softwares Ltd IEC
21 ICSA ( India) Ltd ICS
22 I-Flex Solutions Ltd IFX
23 Infosys Technologies Ltd IFY
24 Infotech Enterprises Ltd IEL
25 Interworld Digital Ltd IWD
26 Jetking Infortrain Ltd JET
27 Lee & Nee Softwares (Exports) Ltd LEE
28 Libord Infotech Ltd LIB
29 Maars Software International Ltd MAA
30 Magnum Ltd MAG
31 Mangalya Soft-Tech Ltd MAN
32 Mastek Ltd MAS
33 Melstar Information Technologies Ltd MIT
34 Millennium Cybertech Ltd MIL
35 Mindtech (India) Ltd MIN
36 Mphasis Ltd MPH
37 Nettlinx Ltd NET
38 Nucleus Netsoft GIS (India) Ltd NNG
39 Nucleus Software Exports Ltd NSE
40 Odyssey Technologies Ltd ODY
41 Omega Interactive Technologies Ltd OIT
42 Onward Technologies Ltd ONW
43 Orient Information Technology Ltd ORI
44 Panoramic Universal Ltd PAN
45 Pentasoft Technologies Ltd PEN
46 Polaris Software Lab Ltd POL
47 PVP Ventures Ltd(SSI Ltd) PVP
48 RS Software India Ltd RSS
49 Ram Informatics Ltd RAM
50 Silverline Technologies Ltd SIL
51 Sonata Software Ltd SON
52 Svam Softwares Ltd SVM
53 Synergy Log-In Systems Ltd SYN
54 Tata Elxsi Ltd TEL
55 Tech Mahindra Ltd TML
56 Tera Software Ltd TER
98

International Journal of Enterprise and Innovation Management Studies (IJEIMS) Vol. 1 No. 1
57 Trigyn Technologies Ltd TRY
58 Twinstar Software Exports Ltd TWN
59 Vakrangee Softwares Ltd VAK
60 VMF Soft Tech Ltd VMF
61 Watson Software Ltd WAT
62 Wipro Ltd WIP
63 Women Networks Ltd WOM
64 Zensar Technologies Ltd ZEN
65 Zigma Software Ltd ZIG
1.8STATISTICALTOOLS
The Statistical tools used for the data analysis are
1. Summary Statistics (Mean, Standard deviation(S.D),Variance)
2. Step wise Regression model
1.9SCOPEOFTHESTUDY
The scope of the study is wider in nature. The study aims to make an analysis on the overall financial andoperational efficiency of the selected software companies during the specific period based on selected financialvariables representing liquidity, profitability, stability and turnover aspects of the companies. The study will bring tolight certain factors influencing financial performance. The study aims at identifying the problems and prospects ofthe Indian software industry.
1.10LIMITATIONS
The study has the following limitations :
1. Data used for the analysis is secondary in nature and it has been taken from the financial statements. Hence thestudy incorporates all the limitations that are inherent in the condensed published financial statements.
2. The findings cannot be generalized as the study is limited to selected 65 companies only.
While comparing the performances, industry structure, competitiveness and entry
1.11ANALYSISANDINTERPRETATION
Financial ratio analysis has been used as a yardstick for evaluating the corporate financial condition andperformance. Analysis and interpretation of various accounting ratios gives skilled and experienced analyst a betterunderstanding of the financial status of the firm.
Table 1.11.1 gives the details of the ratios selected for analyzing the financial performance. These ratios wereselected on the basis of their proven performance in earlier studies. Further, the ratios are classified into variouscategories such as Liquidity, Stability, Turnover, Coverage, Share related and Profitability so that it covers theoverall financial performance of the selected companies. Table 1.11.2 gives the results of the ratios for all the tenyears covered during the period of the study.
Table 1.11.3 gives the summary statistics of the selected ratios followed by the interpretations. The tableincludes the computed mean values (industrial average) and the standard deviations of the selected companies. Theratio values of the companies are compared with that of the industrial average to get a better understanding about theindustry’s performance. To find out the variability of these ratios the coefficient of variations were computed andappropriate interpretations have been made.
Among the various measures of financial performance, profitability plays a very important role. Hence, at the end ofthis chapter an attempt has been made to identify the variables that influence the corporate profitability i.e., the operationalefficiency of the selected software companies. For this, the operating profit has been considered as the dependent variable.The independent variables which may have an influence on the operating profit have been identified
99

International Journal of Enterprise and Innovation Management Studies (IJEIMS) Vol. 1 No. 1
carefully after making a preliminary correlation analysis. Finally Net Sales, Networth, Current Liabilities, Long termdebt, Total Fixed assets, Operating expenses, Net working capital, Employee cost and Retained earnings wereselected as independent variables. Stepwise multiple regression analysis has been carried out to find out theinfluence of the independent variables on the operating profit and the results were appropriately interpreted.
Table 1.11.1 : Ratio variables used for measuring the financial performance
S.No Category Ratio Abbreviation used for further analysis
1 I. Liquidity Ratios Current Ratio CR
2 Liquid Ratio LR
3 II. Stability Ratios Debt equity Ratio DER
4 Net Worth to Fixed Assets ratio NW/FA
5 Net Worth / Total Assets ratio NW/TA
6 Total Outsider’s Liabilities / Net Worth TOL/NW
7 Proprietary Ratio PR
8 III Coverage Ratios Interest Coverage Ratio ICR
9 IV. Turnover Ratios Debtors Turnover Ratio DTR
10 Current Assets Turnover Ratio CATR
11 Total Assets Turnover Ratio TATR
12 Net Sales / Fixed assets FATR
13 Net Sales to Net Worth ratio NS/NW
14 Working Capital Turnover Ratio WCTR
15 V. Share related Price Earning Multiple or ratio PERRatios
16 Earnings Per Share EPS
17 Market Price Per Share MPS
18 VI. Profitability Return on Shareholder’s funds ROSHRatios
19 Return on Net Worth RONW
20 Return on Total Assets ROTA
21 Earnings Before Interest and EBIT / NSTax/ Net Sales
22 Net Profit after Tax / Net Sales NP/NS
23 Dividend Payout ratio DPR
24 Return on Investment ROI
The computed ratios are shown in tables 1.11.2 and 1.11.3 followed by the interpretations on various financialparameters that describes the financial performance.
100

International Journal of Enterprise and Innovation Management Studies (IJEIMS) Vol. 1 No. 1
Table 1.11.2 : Results of the financial performance measured by selected ratios during the period 1998-2007 (in absolute terms)
RATIO 1998 1999 2000 2001 2002 2003 2004 2005 2006 2007
CR 6.887 8.612 8.7 7.351 8.664 6.786 8.746 8.4 9.029 8.993
LR 6.013 7.505 8.42 6.613 8.331 7.336 8.447 8.602 8.999 8.67
DER 1.024 0.539 0.131 0.126 0.156 -0.033 0.203 0.185 0.178 0.273
NW/FA 6.874 5.255 6.108 5.504 4.063 3.743 3.754 6.834 4.65 4.189
NW/TA 0.704 0.595 1.358 1.026 0.792 0.834 0.851 0.844 0.889 0.971
TOL/NW 2.099 1.613 1.195 1.198 1.229 1.087 1.299 1.27 1.236 1.433
PR 0.733 0.84 0.956 0.919 0.925 0.925 0.893 0.877 0.852 0.825
ICR 20.36 59.41 33.94 91.26 435 15.43 59.93 91.76 236.2 193.8
DTR 3.335 3.135 2.746 3.426 2.776 3.311 2.647 3.126 3.207 3.333
CATR 1.38 1.192 1.109 1.39 1.195 1.368 1.258 1.521 1.491 1.409
TATR 1.121 1.015 1.119 0.923 0.685 0.682 0.674 0.742 0.83 0.795
FATR 3.624 4.44 6.578 4.645 3.323 3.604 4.268 4.838 6.252 4.817
NS/NW 2.478 1.608 1.403 1.198 0.939 0.475 0.756 0.827 0.788 1.189
WCTR 2.757 2.995 4.184 1.817 -0.03 2.67 2.546 3.378 3.928 1.571
PER 40.27 103.8 411.4 34.95 23.33 15.76 25.25 30.55 40.37 56.34
EPS 6.48 8.67 10.06 11.66 8.87 8.29 7.97 6.43 6.64 13.68
MPS 140.6 406.5 308.2 155.6 181.5 207.3 139.1 168.8 200.2 266.7
RONW 0.237 0.186 0.16 0.144 0.447 0.484 0.202 0.164 0.386 0.229
ROSH 0.142 0.212 0.244 0.153 0.635 -0.393 0.018 0.106 0.064 0.108
ROTA 0.359 0.634 0.786 0.236 3.024 -0.106 0.162 0.227 0.172 0.134
EBIT / NS -0.16 0.759 1.273 -0.06 0.119 -0.99 -0.32 0.938 -0.72 0.442
NPAT/NS 0.427 0.098 1.04 0.115 0.439 1.085 0.527 0.392 0.094 0.599
DPR 0.281 0.281 0.3 0.196 0.134 -0.082 0.058 0.134 0.111 0.147
ROI 0.127 0.163 0.176 0.144 0.071 -0.092 0.059 0.494 0.752 0.163
Table 1.11.3 : Analysis of financial performance based on the results of the selected 24 ratios (inabsolute terms)
RATIO Min Max Industrial Average S.D C.V <IA* > IA
CR 6.786 9.029 8.217 0.865 10.53 45 69.2 20 30.8
LR 6.013 8.999 7.894 0.985 12.48 49 75.4 16 24.6
DER -0.033 1.024 0.278 0.299 107.51 44 67.7 21 32.3
NW/FA 3.743 6.874 5.097 1.207 23.68 50 76.9 15 23.1
NW/TA 0.595 1.358 0.886 0.206 23.24 35 53.8 30 46.2
TOL/NW 1.087 2.099 1.366 0.296 21.66 43 66.2 22 33.8
PR 0.733 0.956 0.875 0.065 7.45 35 53.8 30 46.2
101

International Journal of Enterprise and Innovation Management Studies (IJEIMS) Vol. 1 No. 1
ICR 15.43 434.97 123.71 131.3 106.15 34 52.3 31 47.7
DTR 2.647 3.426 3.104 0.281 9.04 36 55.4 29 44.6
CATR 1.109 1.521 1.331 0.136 10.25 39 60 26 40
TATR 0.674 1.121 0.859 0.176 20.51 46 70.8 19 29.2
FATR 3.323 6.578 4.639 1.077 23.22 45 69.2 20 30.8
NS/NW 0.475 2.478 1.166 0.571 48.92 46 70.8 19 29.2
WCTR -0.029 4.184 2.582 1.231 47.7 33 50.7 32 49.2
PER 15.76 411.4 78.21 119.7 153.02 30 46.1 35 53.8
EPS 6.43 13.68 8.88 2.36 26.6 36 55.4 29 44.6
MPS 139.07 406.5 217.44 85.85 39.48 48 73.8 17 26.2
RONW 0.144 0.484 0.264 0.126 47.95 41 63 24 36.9
ROSH -0.393 0.635 0.129 0.251 194.7 40 61.5 25 30.7
ROTA -0.106 3.024 0.563 0.902 160.22 45 69.2 20 1.5
EBIT / NS -0.99 1.273 0.128 0.727 567.16 36 55.4 29 44.6
NPAT/NS 0.094 1.085 0.482 0.355 73.76 37 56.9 28 43.1
DPR -0.082 0.3 0.156 0.117 74.75 45 69.2 20 30.8
ROI -0.092 0.752 0.206 0.241 117.35 47 72.3 32 27.7
* IA – Industrial Average
The interpretations of the computed ratios are discussed below to know the financial efficiency of the selectedsoftware companies.
1.11.1 Analysis of the liquidity position of the selected software companies
The term liquidity means the extent of quick convertibility of the current assets into cash to meet out the shortterm obligations. These ratios are also termed as short-term solvency ratios or working capital ratios. A firm musthave adequate working capital to run its day-to day operations. Inadequate working capital may lead the entirebusiness operation to a grinding halt because of the inability of the firm to pay for its regular expenses.
(1) Analysis and Significance of Current Ratio (CR)Current ratio establishes the relationship between Current Assets and Current Liabilities. From the
table 1.11.3, it can be understood that there has been a wide variation in the current ratio among the selectedcompanies. The current ratio has ranged between 6.786 and 9.029. Through out the study period, the current ratio isfound to be more than the ideal norm. This confirms the strong liquidity position of the selected software companies.But very high values have indicated that the some of the selected companies have underutilized the current assetsi.e., it indicates the idleness of current assets. A high industrial average of 8.217 has been observed among theselected companies. However majority (45 companies, 69.2%) of the companies have shown a lower ratio than theindustrial average. A low standard deviation of 0.865 and a coefficient of variation of 10.53 % indicate that there ishigh level of consistency among the selected companies.
(2) Analysis and Significance of Liquid Ratio (LR)Quick ratio explains the relationship between the quick / liquid assets and the current liabilities. The table
1.11.3 shows that the quick ratio has ranged between 6.013 and 8.999 indicating a very good liquidity position of thecompanies. A high industrial average of 7.894 has been observed in small group of companies. Nearly 49(75.4%)companies are having a ratio lower than the industrial average and 16(24.6%) of the companies are having values more
102

International Journal of Enterprise and Innovation Management Studies (IJEIMS) Vol. 1 No. 1
than the industrial average. If there is wide variation between the current ratio and liquid ratio, it indicates over-stocking by the concern. It is clear from the above table that the current ratio and liquid ratio are in the same rangewhich indicates that there were no such overstocking of inventory. The consistency among the selected companieshas been proved by a very low standard deviation of 0.985 and a co-efficient of variation of 12.48%.
1.11.2. Analysis of the long term solvency position of the selected software companiesLong term solvency can be measured by stability ratios. These ratios are also called as solvency ratios or leverage or
capital structure ratios. Solvency indicates the sound financial position of a firm to carry on its business smoothly. Theseratios are used to find out the capacity of the companies to meet its long term obligations. Long term liabilities includedebenture, long-term loans and long term creditors. Some of the important stability ratios are discussed below:
(1) Analysis and Significance of Debt Equity Ratio (DER)Debt equity ratio is computed by dividing the Total long term debt by Share holder’s funds. The debt-equity
ratio is determined to ascertain the soundness of the long-term financial policies of the company. It is also known as“External –Internal” equity ratio. From the table 1.11.3, it can be inferred that the debt equity ratio values rangebetween - 0.033 and 1.024. An industrial average of 0.278 has been recorded. Nearly 44(67.7%) companies haveregistered values less than the industrial average and 21(32.3%) companies have registered ratios higher than theindustrial average. This indicates that majority of the selected companies are trading on equity. i.e., the companiesmake use of their own funds rather than borrowed funds. A very high coefficient of variation of 107.51 % explainsthe high level of inconsistency among the selected companies during the study period.
(2) Analysis and Significance of Net Worth to Fixed Assets ratio (NW/FA)It explains the relationship between Net worth and Fixed assets. From the table 1.11.3, the industrial
average of this ratio has been found to be 5.097. This indicates that all fixed assets are financed through owner’sfunds. The minimum and the maximum values of the ratio are 3.743 and 6.874 respectively. This indicates that thecompanies have used owners funds to finance the fixed assets. So the solvency position of the selected companieshas been found to be good. This ratio is an important one because it helps the companies to know about the sourcesof financing the fixed assets. A low coefficient of variation of 23.68% and a low standard deviation of 1.207observed among the companies proves their high degree of consistency over the study period.
(3) Analysis and Significance of Net Worth / Total Assets ratio (NW/TA)It is computed by dividing the Net worth by Total assets. Table 1.11.3 shows that the Networth to Total
Assets ratio range between 0.595 and 1.358. This indicates that the major portions of the total assets are financed byowners funds. The companies are not dependent on the outsider’s funds. An industrial average of 0.886 is observedamong the companies. This indicates the efficiency of the companies in managing their fixed assets. 46.2% of thecompanies have recorded values more than the industrial average. A very low coefficient of variation of 23.24% hasbeen observed among the companies which illustrates a high level of consistency among the selected companies.
(4) Analysis and Significance of Total Outsider’s Liabilities / Net Worth (TOL/NW)It is computed by dividing Total Outsider’s Liabilities by Net worth. This ratio has negative correlation
with earnings i.e. higher ratios lead to lower earnings. From the table 1.11.3, it can be observed that the TOL / NWratio range between 1.087 and 2.099. This implies that the selected companies rely more on their own funds and arenot dependent on the outsiders funds to a greater extent. An industrial average of 1.366 has been recorded and thisconfirms that the companies have effectively managed their business without much leverage. Nearly 22(33.8%)companies have managed without much of the borrowed funds. A low standard deviation of 0.296 and a coefficientof variation of 21.66% explain the consistency of the selected companies over the study period.
(5) Analysis and Significance of Proprietary RatioIt is computed by dividing Total Shareholder’s Funds by Total Assets. The table 1.11.3 shows that the
proprietary ratio ranges between 0.733 and 0.956. As the minimum value (73.3 %) and the maximum value (95.6%)are more than 50%, the situation is not alarming. The industrial average of the selected companies has been 0.875.This again vouches for the protection of creditors. 35(53.8%) companies fall below the industrial average and 30(46.2%) companies have registered values more than the industrial average.
103

International Journal of Enterprise and Innovation Management Studies (IJEIMS) Vol. 1 No. 1
1.11.3 Analysis of the coverage ability of the selected software companiesThe coverage ability of the selected companies can be found out with the help of coverage ratios. These ratios
indicate the extent to which the interests of the persons entitled to get a fixed return (interest, dividend) or ascheduled repayment as per the agreed terms are safe. The higher the coverage, better it is. The coverage ratio usedin this study is given below:
(1) Analysis and Significance of Interest Coverage Ratio (ICR)This is computed by using the formula: Earnings before interest and tax / Interest. From the table
1.11.3, it can be observed that the Interest coverage ratio of the selected group of companies range between 15.43and 434.97. This indicates that the earnings of the selected groups are sufficient enough to meet out the interestliabilities i.e., the ability of the companies to pay the contractual interest payments is very high. In general, this ratiois used to find out whether the borrowing policy has an influence on the earnings or not. This ratio is also having asignificant role in finding out the imbalances, if any, in the capital structure. A very low ratio says that the companycannot meet out the interest liability which in turn leads to sickness. A high industrial average of 123.71 has beenobserved and this shows that the selected companies are capable of repaying the interest without any difficulty. Buta high degree of inconsistency has been inferred from the high values of standard deviation (131.32) and coefficientof variation (106.15%). This implies that there exists wide variation in the borrowing policies of the selectedcompanies or the financial structure of the selected companies may have lot of variations.
1.11.4. Analysis of the turnover efficiency of the selected companiesThese ratios are also called as Activity ratios. Turnover means the number of times the assets are converted or
turned over into sales. These ratios indicate the efficiency with which the capital employed is rotated in the business. Thefinancial performance of the business depends on two factors viz., rate of return on capital employed and turnover i.e., thespeed at which capital employed in the business rotates. Higher the rotation, the greater will be the profitability.
(1) Analysis and Significance of Debtors Turnover Ratio (DTR)It is computed by dividing Net Sales by Debtors. It can be observed from the table 1.11.3, that the Debtor’s
turnover ratio ranges between 2.647 and 3.426. A high ratio indicates that the firms are more efficient in managingthe receivables and vice versa. The companies have registered an industrial average of 3.104 and this indicates thatthe debtors are turned over 3 times within a year. 36 (55.4%) companies have registered values lower than theindustrial average. High degree of consistency has been observed from the lower values of standard deviation of0.284 and coefficient of variation of 9.04%.
(2) Analysis and Significance of Current Assets Turnover Ratio (CATR)This is computed by using the formula: Net Sales / Current Assets. It can be inferred from the table 1.11.3
that current assets turnover ratio ranges between a minimum value of 1.109 and a maximum value of 1.521 for thestudy period. A high ratio indicates optimum utilization of the current assets whereas a low ratio means thecompanies are not making maximum use of the current assets. An industrial average of 1.331 has been observedamong the selected companies. Nearly 26 (40%) companies fall above the industrial average category. This showsthat the companies managed their current assets very effectively.
(3) Analysis and Significance of Total Assets Turnover Ratio (TATR)It explains the relationship between Net Sales and Total Assets. From the table 1.11.3, it can be observed
that the total assets turnover ratio ranges between 0.674 and 1.121. The minimum value is 0.674 which indicates thatthe some of the selected companies are not making the maximum utilization of their fixed assets. It has been foundthat the industrial average has recorded a value of 0.859. Majority (70.8%) of the companies have recorded a lowerratio than the industrial average. On the other hand 29.2 % of the companies have registered above industry average.The performance of the selected companies with regard to this ratio is highly consistent and this has been revealedby a very low standard deviation and coefficient of variation of 0.176 and 20.51% respectively.
(4) Analysis and Significance of Net Sales to Fixed Assets (NS/FA)It is the relationship between Net Sales and Fixed assets. A high ratio of net sales to fixed assets will indicate
higher efficiency in the use of fixed assets. A low ratio is indication of under utilization of fixed assets. It can be observedfrom the table 1.11.3, that the Net Sales to Fixed assets ratio ranges between a minimum and a maximum value of 3.323and 6.578 respectively. An industrial average of 4.639 has been observed among the selected companies. This indicates
104

International Journal of Enterprise and Innovation Management Studies (IJEIMS) Vol. 1 No. 1
favourable performance of the companies. 45 companies have registered a lower value than industrial average and20 companies registered higher values than the industrial average
(5) Analysis and Significance of Net Sales to Net Worth ratio (NS/NW)It explains the relationship between Net Sales and Net Worth. This ratio indicates the utilisation of owner’s
funds in generating sales. From the table 1.11.3, it can be inferred that the range of the Net Sales / Net Worth is between0.475 and. 2.478. The industrial average has been 1.166 and this indicates that the funds invested generate 1.166 times ofSales. This means that the companies have effectively converted their funds into sales. A high coefficient of variation of48.92 indicates that the selected companies are highly inconsistent with respect to this ratio. This ratio has significantrelationship with profitability. i.e., higher the ratio more is the profitability of the companies.
(6) Analysis and Significance of Working Capital Turnover Ratio (WCTR)This is also known as working Capital Leverage ratio. The ratio is computed by using the formula: Net
Sales / Working capital. From the table, 1.11.3 it has been observed that the Working Capital Turnover ratio rangesbetween a negative value of -0.029 and 4.184. The industrial average has been 2.582. 32 companies fall above theindustrial average category which indicates that the companies are managing their working capital effectively. Theremaining companies have registered values less than the industrial average. A high coefficient of correlation of47.7% indicates that the companies are highly inconsistent during the study period.
1.11.5. Analysis of the Share related performance of the selected software companiesThe share or the market related metrics help to assess the performance of the companies in the market. These ratios
are of specific importance to the shareholders as they are interested in assessing the performance of the companies to makedecisions related to their investment in the company’s shares. The following are some of the share related ratios:
(1) Analysis and Significance of Price Earning Ratio (PER)Price earning ratio is the ratio between the Market Price per share and Earnings per share. It can be
inferred from the table 1.11.3, that the Price Earning ratio range between 15.76 and 411.42. This indicates that theinvestors expect future earnings to stabilize when compared to current level. The Price earning ratios are higher forfirms with sound financial prospects other things held constant. A high industrial average of 78.21 indicates that theselected companies are financially sound. It means that market value of every one rupee of earning is 78.21 times orRs.78.21. 35 companies have registered more than the industrial average and 30 companies have recorded valuesless than the industrial average. A high coefficient of variation of 153.02 shows the high level of inconsistencyamong the selected software companies over the study period.
(2) Analysis and Significance of Earning Per Share (EPS)This is calculated as follows: Net Profit after Tax and Preference Dividend / Number of equity shares. It can
be observed from the table 1.11.3 that the Earnings per share range between 6.43 and 13.68. An industrial average of 8.880indicates that the companies have stable earnings on per share basis over the study period. The coefficient of variation of26.6% indicates that the selected companies are consistent in their performance over the study period.
(3) Analysis and Significance of Market Price per Share (MPS).This is the quoted market price of the share. It can be observed from the table 1.11.3 that the Market Price
per Share ranges between a minimum value of 139.07 and a maximum value of 406.5. The Market price per shareindicates the investors expectation about that particular firm. It can be inferred from the table that the standarddeviation (85.9) and coefficient of variation (39.48%) values are high. This indicates that the inconsistency level ishigh with regard to this ratio among the selected companies. The industrial average has been 217.4.This indicatesthat the companies have shown good performance in the market.
1.11.6. Analysis of the profitability position of the selected software companies.Profitability of the companies can be analysed with the help of profitability ratios. The term profitability
means the earning capacity of any business activity. Profitability ratios are used to measure the overall efficiency orfinancial performance of a business. Higher the profits, more is the financial and operating efficiency of thecompanies. Some of the important profitability ratios are discussed below:
105

International Journal of Enterprise and Innovation Management Studies (IJEIMS) Vol. 1 No. 1
(1) Analysis and Significance of Return on NetWorth (RONW)It is also called as Return on Equity. Return on Networth indicates how well the company has used the
resources and it is calculated as: Net Profit after Tax / Networth. From the Table 1.11.3, it can be inferred that theReturn on Net worth range between 0.144(14.4%) and 0.484 (48.4%). This shows that the selected companies arehaving favourable performance over the study period. An industrial average of 0.264 has been observed whichindicates that the companies are making an average return of 26.4 % over the study period. But Majority (41) of thecompanies have registered values less than the Industrial average which indicates that majority of the companies arehaving less than the average performance. Moreover the coefficient of variation of 47.95 proves the inconsistency ofthe performance over the study period.
(2) Analysis and Significance of Return on Shareholder’s funds (ROSH)This ratio is calculated by using the formula: Net Profit after Interest and Tax / Total Shareholder’s funds.
Table 1.11.3 presents the minimum value and the maximum value of Return on shareholders fund as - 0.393 and 0.635respectively. The Industrial average has been 0.129. Majority of the companies are having values less than the industrialaverage. The coefficient of variation is 194.7 %. This shows that the companies are highly inconsistent.
(3) Analysis and Significance of Return on Total Assets (ROTA)Total assets turnover examines the relationship between the Net Profit after tax / Total assets. It is
observed from the table 1.11.3, that the highest value of Return on total assets is 3.024 and the lowest value is a lossof -0.106 among the selected companies. The coefficient of variation is 160.22. This indicates that there is high levelof inconsistency among the selected companies. The Industrial average has been 0.563 and majorities (69.2%) of thecompanies have registered values less than industrial average.
(4) Analysis and Significance of EBIT/ Net Sales (EBIT/NS)This is computed by using the formula: Earnings Before Interest and Taxation / Sales. From the table 1.11.3, it
can be observed that the minimum, maximum and the industrial average of this ratio are -0.99, 1.273 and 0.128respectively. The Coefficient of variation is 567.16% which illustrates that the sample companies are highly inconsistentover the study period. Further, majority of the selected companies have shown below average performance.
(5) Analysis and Significance of Net Profit after Tax / Net Sales (NPAT/NS)This ratio is expressed as the relationship between Net Profit after tax and Net Sales. From the table 1.11.3, it
can be observed that the minimum and the maximum values are 0.094 and 1.085 respectively. The Industrial average hasbeen found to be 0.482. 43 % of the companies have shown values higher than the Industrial average. The selectedcompanies have shown high level of inconsistency. This has been confirmed by a Coefficient of variation of 73.76%.
(6) Analysis and Significance of Dividend Payout Ratio (DPR)This ratio indicates that proportion of the Earning Per Share which has been used for paying the dividend. The
ratio can be calculated as:
Dividend per Equity ShareDividend Payout ratio =
Earning per Equity Share
The table 1.11.3 presents the minimum and maximum value as -0.082 and 0.3 respectively. The Industrialaverage has been 0.156. But majority of the companies have shown below average values. This indicates that onlyfew companies have distributed their profits as dividend to the share holders. The companies are highly inconsistentwith a high coefficient of variation of 74.75%.
(7) Analysis and Significance of Return on Investment (ROI)It is also called as overall profitability ratio or Return on Capital Employed. It is computed by (Net
Operating Profit before Interest and Taxation / Total capital employed. It is observed from the table 1.11.3, thatROI ranges between a minimum value of -0.092 and a maximum value of 0.752 among the selected companies overthe study period. The industrial average has been found to be 0.206. 47 companies have registered below averageperformance. The companies are highly inconsistent with a high coefficient of variation of 117.35%.
106

International Journal of Enterprise and Innovation Management Studies (IJEIMS) Vol. 1 No. 1
1.11.7. Analysis of the determinants of the Operational Efficiency of all the selected companies using Stepwise Multiple Regression model.
Profitability is an indication of the operational efficiency with which the operations of the business are carried on. Itis the major contributor to the financial performance of a company or industry. If the rate of return is high then it can beconcluded that the firm has effectively managed its finance and vice versa. Poor operational performance may indicatepoor sales and hence poor profits. A lower profitability may arise due to the lack of control over the expenses. Owners,Bankers, financial institutions, investors, creditors and other interested parties look at the profitability ratios as an indicatorof the firm’s earning potentiality. So, it may be useful to analyse the variables influencing the ROI.
ROI is measured by dividing Earnings before Interest and Tax by Total Capital employed. EBIT is the excessof the firm’s operating revenues over its operating expenses. It is also termed as Operating Profit since it representsthe operating income of the business. Operating profit explains the company’s financial strength i.e., the company’sability to meet out its interest and tax liabilities. Moreover, it indicates the operational efficiency and earnings powerof the companies. The more the Operating profit, better is the performance of the companies i.e. ROI will be higherfor companies which have huge amount of Operating Profit (Earnings before interest and tax).
This part of the analysis has been performed to identify the variables that influence the profitability position ofthe selected software companies. Hence, in order to identify the variables which influence the ROI, Step WiseMultiple Regression analysis has been performed. Operating Profit (EBIT) has been taken as the dependent variable.After making an initial correlation analysis, nine independent variables capable of influencing the ROI wereidentified. They are Net Sales, Total Assets, Current Assets, Current Liabilities, Long term debt, Fixed assets,Operating expenses, Net working capital, Employee cost and Retained earnings. Based on the F value of the modelthe significance of these variables were tested and reported. The results of the regression analysis has been displayedin table 4.1.4. To ascertain the relationship between the operating profit and its determinants, the following NullHypothesis (Ho) has been constructed.
Null Hypothesis (Ho)There is no significant influence of the independent variables on the Operating Profit (EBIT)
Alternate Hypothesis (Ha)There is significant influence of the independent variables on the Operating Profit (EBIT)
Table 1.11.4 : Regression Analysis for all the selected companies Dependent Variable: EBIT
B Std. Error t Sig. Correlations
(Constant) 1.830 3.475
Net sales 0.06702 .032 2.122 * .952
Net worth -.427 .099 -4.314 ** .949
Current Liabilities -0.06754 .055 -1.235 Ns .881
Long term debt -.136 .068 -2.010 * .107
Total fixed assets -0.0480 .033 -1.457 Ns .879
Operating Expenses (Selling & Admin.) .162 .077 2.116 * .810
Net Working Capital .127 .025 5.152 ** .879
Employee Cost .267 .047 5.686 ** .952
Retained Earnings .521 .103 5.042 ** .952
R R Square F Sig.
0.968 .938 1058.659 **
*, ** Significance at 5% and 1% level respectively
107
International Journal of Enterprise and Innovation Management Studies (IJEIMS) Vol. 1 No. 1
Table 4.1.4 examines the determinants of operating profit for all the selected companies. From the table 4.1.4,it can be observed that the multiple correlation values and the R2 values are high and the model has been proved tobe significant. The multiple correlation and the R2 values has been 0.968 and 0.938 respectively. The model explains93.8% variations in its operating profit (EBIT). It indicates that there is a strong relationship between the dependentvariable operating profit (EBIT) and the independent variables taken together. Both positive and negative values ofregression coefficient have been observed The ‘F’ ratio, with its value 1058.659 shows that the regression modelwith the simultaneous effect of all the independent variables is statistically significant at one percent level.
The‘t’ values reveal that Net Sales, long term debt and Operating Expenses influence operating profit (EBIT)at 5% level of significance. Whereas Net Worth, Net Working Capital, Employee Cost, Retained Earnings influenceoperating profit (EBIT) at 1% level of significance. Moreover Current liabilities and Fixed Assets do not havesignificant influence on operating profit (EBIT). As the ‘F’ ratio proves that the regression model is statisticallysignificant, the null hypothesis is rejected.
4.1.12 CONCLUSION
The above ratio analysis has been performed for the selected 65 software companies and the summary statistics hasbeen analysed to find out the overall financial performance. The results of the analysis show that above analysis showsthat some of the selected ratios have shown inconsistent performance in liquidity, solvency, efficiency, coverage, sharerelated and profitability ratios. DER, ICR, PER, ROSH, ROTA, EBIT/NS, NPAT/NS, DPR, ROI have exhibitedinconsistency whereas all the other ratios have exhibited consistency throughout the study period.
All the selected sample companies have been considered for the analysis i.e., Size wise classification has notbeen done before performing the ratio analysis and this may be one of the reason for the inconsistency of some ofthe ratios as size may be one of the factor that influences the financial performance. Another important reason forthe inconsistency may be the financial policies followed by the companies i.e. the selected companies have followeddifferent financial policies.
With the help of Multiple Regression analysis, it has been found that the Return on Investment of the selectedcompanies has been influenced by the variables like Net Sales, long term debt, Operating Expenses, Net Worth, NetWorking Capital, Employee Cost, Retained Earnings influence operating profit. Moreover Current liabilities andFixed Assets do not have significant influence on the operating profit.
108

International Journal of Enterprise and Innovation Management Studies (IJEIMS) Vol. 1 No. 1
“ROLE OF BEHAVIOURAL FINANCE – A STUDY”
K. VEERARAGHAVANResearch Scholar of Bharathiar University – Coimbatore & Faculty, Dept. of Management Studies, Sri Sankara Arts
& Science College, Enathur, Kanchipuram. E-mail : [email protected]
ABSTRACT
This study aimed to provide a brief introduction to behavioral finance and this paper is motivated by the newtendencies of research in future. It provides good information’s to the rational investors to functioning inefficient markets. There are two building blocks of behavioral finance that are one is cognitive psychology (howpeople think) and another one is the limits to arbitrage (when markets will be inefficient).
Keywords - Disposition effect, Decision making, Investor’s Behaviour and Financial markets
1.INTRODUCTIONOFTHESTUDY
Behavioral finance is a concept that has become widely popular in recent years. Even though the concept has justrecently found its place in the literature, and it would not be wrong to say that behavioral finance has had its place in thesubconscious of human since the time humans started to be engaged in Investment and consumption activities.
Behavioural finance focuses on how investor’s interpret results in order to make investment decisions basedon information and how they act with their investment decisions.
Behavioural finance has recently emerged in academic studies as a new paradigm to explain the anomaliesfound when empirically testing the efficient market hypothesis, but it has emerged so firmly it seems it is going tostay for a long; in fact; some waves of opinion point it out as a new discipline in the near future.
Behavioural finance is the new paradigm where financial markets are studied using models, and it is to studythe influence of psychology on the behaviour of financial markets and investors. It is very interesting subject whybecause it helps, explain why and how markets might be inefficient.
In contrast, behavioural finance assumes that in some situations, financial markets are informationallyinefficient. Not at all devaluations are caused by psychological biases, however and some of them due to temporaryvariations or changes in demand and supply.
Behavioural finance using models in which some middleman’s are not fully rational, either because of theirpreferences and choices, example for assumption about preferences is that people are gain, loss and it will makepeople to feel better and worse, mistaken beliefs are due to people are bad Bayesians.
The concept of decision-behaviour as clearly indicated through following diagram.
CONCEPTOFINVESTOR’SDECISIONBEHAVIOUR
PSYCHOLOGY
BEHAVIOURALFINANCE
INVESTOR’S BEHAVIOUR
109

International Journal of Enterprise and Innovation Management Studies (IJEIMS) Vol. 1 No. 1
INTERNALFACTORS EXTERNALFACTORS
REACTIONS
INVESTOR’SDECISIONBEHAVIOUR
The above diagram is clearly explained the decision behavior system of the investor and it is affected by bothinternal and external factors. So based on the reactions they will go for the decisions making process and reactionsincluded both positive and negative factors.
2.OBJECTIVESOFTHESTUDY
To study the role of behavioral finance in the financial markets.
To identify the changing behavior of the people while taking decisions according to the cognitive
psychologist. To study the decision behavior system of the investor’s based on reactions.
To know the role or actions of the rational investor’s in efficient markets in different situations.
If it is easy to take positions of the shares based on the situations that is selling overvalued shares or buyingundervalued shares, and the wrong valuations are certain to be corrected over a short period, then arbitrageurs willtake positions and to avoid these mispricing before they become large. But if it is difficult to take these positions,because of sales constraints, for instance, or if there is no guarantee that the mispricing will be corrected within areasonable time, then arbitrage will fail to correct the mispricing indeed, arbitrageurs may even choose to avoid themistakes where the mispricing is most severe, because the risks are too great.
On the other hand behavioral finance is comparing with the status of leading paradigm on par by means ofneoclassical paradigm. But there are not long used while the study deals with mutual funds, trades by the clients of asingle brokerage firm, huge contributions, they lack several aspects in market dynamics because the various investorgroups behave in different situation of extreme potentiality to come out from stress. In the height of the abovediscussion, how the different classes of investors get decisions under different situations and how they route orprocess their information in the stock market.
In a modern world behavioural finance has building blocks in the efficient markets hypothesis. So EMHplayed major role in deciding the markets are rational. It argues that competition between investors seekingabnormal profit drives the prices to their correct value. The assumption of the EMH that all investors are notrational, but it assumes that markets are rational. It does not assume that markets can foresee the future, but itassumes that markets make unbiased forecast of the future.
3.COGNITIVEBIASES
Some of the patterns and procedures are indicated by cognitive psychologist regarding the behaviour of thepeople as follows.
a) Heuristics
This type of decision system used by the investors to find things out of themselves usually by the trial anderror method.
110

International Journal of Enterprise and Innovation Management Studies (IJEIMS) Vol. 1 No. 1
b) Over - confidence
There are so many dimensions to the confidence and it gives more braveness, and it is known as a benchmarkto the success. People are over confident in their abilities and capabilities. They are having very cautious andanalytical mind to solve difficult problems and to make successful decisions and others have to withdraw.
Investors have over-confidence in themselves and that they have to make their guess in between limits that arenarrower than they are supposed to be.
c) Mental Accounting
It uses prospect theory to explain how individuals or investors and households are keep track their financesand investments. The peoples are mentally dividing their money according to their requirement that is food, rent,electricity, and entertaining etc.
Here mental accounting played vital role in the series of the day to day activities and money is not essential
necessity between different mental accounts. So each people will try to avoid losses, and dividing them against gains.
d) Disposition effectThis refers to the method that people seeks to realize paper gains and to ignore the realize paper losses. This effect
manifests itself number of small gains are realized and few small losses. In fact, people act as if they are trying tomaximize their returns. They clearly had known the effects of stock trading volume. For example trading volume grows inthe bull market and fall in the bear market due to systematic risk by the brokerage firms commission business.
They major drawback of the behavioural finance is that by selecting which bias to persist, one can predicteither over reaction or under reactions of the market. This drawback is known as “Model dredging”.
e) Representativeness
The decision making tendency of the investors to make it based on the previous experiences is called as stereotype. The recent success of the investors tends to continue in to the future also. When equity returns have been highfor many years, many people begin to believe that high equity returns are normal.
f) ConservatismIn this situation, when things are change, people might under react because of the conservatism bias, but they
will take more time to possibly overreact. At that time of changing things when people are pick up on the changesslowly. In other words ‘anchor’ on one trait or piece of information when decision making and this is the situationthat conservatism bias is at fight with the representativeness bias.
g) Framing
Framing is the important notion that how a concept is offered to individuals matters. For example, restaurantsmay advertise “early-bird” specials. They get more income through business if people feel they are getting adiscount at low-peak times rather than paying a surcharge at peak periods, even if the prices are identical.
4.LIMITATIONSOFTHEARBITRAGE
Misevaluations of financial assets are common, except it is not easy to reliably make abnormal profits of thesemisevaluations. Why? Misevaluations are of two types: those that are recurrent or arbitrage able, and those that are norepeating and long-term in nature. For the repeated misevaluations, trading strategies can constantly make money. Since ofthis, hedge funds and others zero in on these, and keep them from ever getting too big. Thus, the market is attractiveefficient for these assets, at least on a relative basis. For the long-term, no repeating misevaluations, it is impossible in realtime to identify the peaks and troughs until they have passed. Getting in too early risks losses that wipe out capital. Evenworse, if limited partners or other investors are supplying funds, withdrawals of capital after a behind streak may actuallyresult in buying or selling force that exacerbates the inefficiency.
Presently who are these investors who create markets efficient? Well, one clear class of Investors who aretrying to make money by identifying misevaluations is hedge funds. A Relative value hedge fund takes long andshort positions, buying undervalued securities and then finding highly correlated securities that are overvalued, andshorting them. A macro hedge fund, on the other hand, takes speculative positions that cannot be easily hedged.
111

International Journal of Enterprise and Innovation Management Studies (IJEIMS) Vol. 1 No. 1
How well do efforts by arbitrageurs to make money work in practice at making markets more efficient? AsShleifer and Vishny argue in their 1997 “Limits to Arbitrage” article, the efforts of arbitrageurs to make money willmake some markets more efficient, but they won’t have any effect on other markets.
5.APPLICATIONSTOBEHAVIORALFINANCE
The behavioural finance discuss about the situation of IPO’s are underpriced.
Prospect theory can be seen as feeling more stress in the case of loss than the happiness in the case of apossible return. Individuals tend to give a bigger weight to their losses than they do their gains and thus try to avoidrisks. However, when a loss is incurred, they tend to become risk takers.
The tendency to avoid selling an investment that incurs losses in order not to feel any grief or pain and to haveextreme self confidence regarding for which one has a certain degree of knowledge. This theory focuses on changesin wealth, where as expected utility theory focuses on the level of wealth. Gains and losses are measured relative toa reference point. Prospect theory also assumes loss aversion.
If an IPO’s under priced, pre-issue stock holder are worse off because their wealth has been diluted.
6.SUMMARYANDCONCLUSIONS
It is very difficult to find trading strategies and techniques that reliably make the money. This does not insistthat financial markets are informationally efficient; however, low frequency misevaluations may be large, withoutoffering any opportunity to reliably make money. Most of these short sellers, who were right in the long run, werewiped out before the misevaluations started to disappear. Thus, the forces of arbitrage, which work well for highfrequency events, work very poorly for low frequency events.
Behavioral finance is, relatively speaking, in its infancy. It is not a separate discipline, but instead willincreasingly be part of mainstream finance. Behavioural financing decisions are entirely based on the EMH. Ifinformation’s are effective investors always will take better decisions and if any cognitive bias in the information’stheir decision is not good.
REFERENCES1. Hirshleifer, David, 2001. “Investor psychology and asset pricing.” Journal of Finance 56, 1533-1597.
2. Loughran, Tim, and Jay R. Ritter, 2002. “Why don’t issuers get upset about leaving money on the table inIPOs?” Review of Financial Studies 15, 413-443.
3. Modigliani, Franco, and Richard Cohn, 1979. “Inflation, rational valuation and the market.” Financial AnalystsJournal 35, 24-44.
4. Siegel, Jeremy J., 1998. Stocks for the Long Run, Second Edition McGraw-Hill, New York.
5. Barber, Brad, and Terry Odean, 2001. “Boys will be boys: Gender, overconfidence, andcommon stockinvestment.” Quarterly Journal of Economics 116, 261-292.
6. Barberis, Nicholas, and Richard Thaler, 2003. “A survey of behavioral finance.” in G.Constantinides, M.Harris, and R. Stulz (editors) Handbook of the Economics of Finance North-Holland, Amsterdam.
7. Benartzi, Shlomo, and Richard Thaler, 2001. “Naive diversification strategies in defined contribution savingsplans.” American Economic Review 91, 79-98.
8. Froot, Kenneth A., and Emil A. Dabora, 1999. “How are stock prices affected by the location of trade?” Journalof Financial Economics 53, 189-216.
9. Shiller, Robert J., 2000. Irrational Exuberance Princeton University Press, Princeton.
10. Shleifer, Andrei, and Robert Vishny, 1997. “The limits of arbitrage.” Journal of Finance52, 35-55.
11. Ritter, Jay R., and Richard Warr, 2002. “The decline of inflation and the bull market of 1982- 1999.” Journal ofFinancial and Quantitative Analysis. 37, 29-61.
12. Shefrin, Hersh, 2000. Beyond Greed and Fear Harvard Business School Press, Boston.
112

International Journal of Enterprise and Innovation Management Studies (IJEIMS) Vol. 1 No. 1
STRATEGIES FOR STRENGTHENING CONSUMER AWARENESS
Dr. J. VENKATESH1 and Ms. I.S. PRABHA2
1Assistant Professor, School of Management Studies Anna Universityof Technology Coimbatore, Jothipuram Post Coimbatore – 641
047.Tamil Nadu, INDIA E-mail : [email protected] Time Research Scholar, School of Managementstudies, Anna University of Technology Coimbatore,Jothipuram Post Coimbatore – 641 047.Tamil Nadu, INDIA
E-mail : [email protected]
ABSTRACT
Consumers have a meaningful oversight about the awareness, the consumers must face the three major situations.
First, the consumer community must be clever at “giving voice” to its values. Second, the government environmentmust support a healthy consumer role by “transmitting” the consumer perspectives to points in the society where theycan expect influence. At last the professionals who can manage the program must be practiced at “listening.”Keywords : Stragetisia, Consumer, Transmiting, Listening.
I.INTRODUCTION
Consumer awareness is the idea that a consumer should have about his/her legal rights and duties. It is a mustfor a consumer to follow these rights. It is implemented for the protection of the consumer, so that the consumer isnot exploited by the seller of the products.
“There is an urgent in increasing necessity to educate and motivate the consumer to get awareness about thequality of the products, and also the possible deficiency in the services of the growing sector. [1]” The consumer hasright to reject any product or services provided by any manufacturer in the market and can select the products orgoods of their choice. Consumer is unaware of their rights and they cannot know their responsibilities. At presentthe consumer movement in India is like childhood. Most of the majority people are not even aware aboutconsumerism and its movement closely connected with the safeguard of their interest. Until and unless theseprovisions are availed of by the consumers, the protection of consumer becomes inevitable. By recognizing theimportance of the consumer problem, the Government of India and State Government have taken serious steps tointroduce agreement in put right mechanism by way of Consumer Protection Act.
II.CONSUMERAWARENESS
A. Rise of consumer AwarenessConsumers should be aware of the sale and purchase of each goods, regarding the health and security aspects
also. Now a day consumers must ensure the safety of food items which ever sold in the market is essential. Legalprocedures for consumer safety, awareness must be the same, and crystal clear in terms of prices, quality, and stockof goods. Consumers must have the tools to fight against malpractice and protect their rights. Consumer awarenessis a must for a consumer to follow these rights. Awareness is the knowledge to a consumer is to know about his/herlegal rights and duties. It is implemented for the protection of the consumer, so that the consumer is not exploited bythe seller of the products.
B. The Common Methods of Exploitation1. Under weight and under measurements - not measured or weighed correctly
2. Substandard Quality - defective home appliances and medicines beyond expiry date
3. High prices - charging above the retail price
4. Duplicate Articles - mixing duplicate goods in market in the name of the original
5. Corruption and Infection – for earn higher profits in the competition
6. Lack of safety Devices - absence of inbuilt safeguards in appliances
113

International Journal of Enterprise and Innovation Management Studies (IJEIMS) Vol. 1 No. 1
7. Artificial Scarcity - hoarding and black marketing
8. False and Incomplete Information – creating roamer in market about the quality, durability, and safety of goods.
9. No satisfaction in after sales Service - high cost items like electronics and cars require regular service tomaintain quality of product.
10. Forceful behavior and unwarranted conditions - irritation in getting LPG connection or a telephone connection.
C. Factors Causing Exploitation of Consumers1. Limited Information - essential information like safety measures and secure usage should be provided.
2. Limited Supply – when stocks of goods are short in number the price of goods is higher.
3. Limited Competition - single producer may control the market in terms of price and stocks.
4. Low Literacy - illiteracy leads to exploitation. Hence Consumer Awareness is essential.
III.THERIGHTSOFTHECONSUMER
The Consumer Protection Act 1986, [2] assurance the following statutory rights to the consumers-
1. The right to be protected besides the marketing of goods and services which are dangerous to life and property:To simplify this it can be said that it is the duty of the manufacturers and the distributor not to supply any goodsto the consumers which fails to comply with the general safety requirements in all circumstances.
2. The right to be informed about the quality, quantity, effectiveness, clarity, standard and price of goods orservices, as the case may be, so as to protect the consumer against unfair trade practices; by simplifying thisright it can be said that consumers are given the right to information. This is planned to save the consumersfrom unfair trade practices like artificial and confusing descriptions about the nature and quality of goods,exaggerated statements about their power or potency, for example, that the hair oil is capable of promoting hairgrowth or preventing hair loss where there is no such power to an appreciable extent.
3. The right to be assured where possible, access to a mixture of goods and services at competitive prices; For theconvenience of the consumers the Central Council has been charged with the responsibility of bringing about theorganization of markets and market practices in such a way that all dealers are supplied with a variety of goods for thebenefit of the consumers and that the goods with a variety are being offered at competitive prices. It is only then theconsumers will have access to range and will be able to enjoy the benefit of competitive prices.
4. The right to be heard, assured that consumer interest will accept due to fear at appropriate forums; Right to beheard is not only the foremost right of consumers it is a principle of natural justice also. The Central Council isstimulated with the responsibility of assuring to consumers that they would be heard as of right by appropriateforums and consumers will receive due attention and consideration from such forums.
5. The right to look for truth against unfair trade practices or restrictive trade practices or unscrupulousexploitation of consumers the consumers has been given the right to seek redress against restrictive/unfairtrade practices or unscrupulous exploitation.
6. The right to consumer education. The right of consumer is most important because once the people arerendered conscious of their power, they may perhaps, feel energized to struggle against exploitation bymanufacturers and traders [3].
However, consumer’s strongest and the most precious right, which he keeps to the last, is the ‘refusal tobuy’ and withdraw the patronage from the seller who always craves for it because, without it, he has none to sell.
A. Duties of Consumers1. Consumers should get bill for every purchase and also the Warranty card whichever applicable.
2. Check the ISI mark or Agmark on the goods
3. Form consumer awareness groups
4. Make a complaint on genuine grievances.
5. Consumers must know to exercise their rights.
114

International Journal of Enterprise and Innovation Management Studies (IJEIMS) Vol. 1 No. 1
IV.CONSUMERRESPONSIBILITY
Consumer responsibilities play a very important role in not only checking the market but also in restrict unnecessaryexpenditure. It is not a sole responsibility of the market or the government to offer consumers with detailed information[5]. A consumer in his part must make all effort to inform himself of the product or service. For example, if consumersconsume a health product, he must make efforts to inform himself in move forward about its possible side-effects, andmust also exercise caution regarding his eating habits, diet and physical exercise, to take full advantage of the product.
Consumer responsibility is based on ethics and rationale. There is no perfect set of consumer responsibilitiesand a consumer must exercise restraint in consumption to consume responsibly. For example, protection of theenvironment cannot be forced upon consumers but a consumer must make a conscious effort to reduce consumption,choose environment friendly alternatives and conserve energy.
A. Responsibility towards safe waste disposalMostly often we consume without any careful thought for what is going to be left behind as waste. More and
most percentage of waste generate in urban areas consists of non-biodegradable waste. Urban consumers are in needof using plastic paper and cardboard packaging, disposables batteries, plastic throw-away pens, use and thrownappies ,empty cans etc are becoming a common feature of an urban dustbin. India’s urban population is around 300million. By 2011, the total quantity of solid wastage cause in urban areas is expected to cross 56 million tones,creating a waste management crisis for urban India.” Consumers are in need to become accountable for their usagemodel and their serious environmental and economic implications. The 4R’s of consumption are (Reduce, Recycle,Refuse and Reuse) just a consumer privilege but also his consumer responsibility
B. Responsibility to endorse safer products Eco labelingEco-friendliness is an important measure in judging a product possibility. It is a way of judge how much
damage a product has caused to the environment. ‘Eco-mark’ is one way of knowing which products beconventional to environmental standards and more environment -friendly than others. Ecolabelling is a methodologyprocess which practiced in many countries, including India in the world.
V.CONSUMERPROTECTION
Consumer protection laws [4] are planned to make sure reasonable competition in the free flow of correctinformation in the market. The laws are considered to stop businesses that engage in scheme or specified unfair practicesin advance for better benefit in competition and may provide additional security for the weak and those unable to take careof themselves. Consumer Protection laws in a form of government regulation which protects the interests of consumers.”
A. Consumer protection Measure1. Legislation concerning Consumer Rights
The Consumer Protection Act 1986 provides the consumer disputes redressed at the state and national level.With the help of law the agencies can solve complaint in a immediate, simple at reasonably price A separatedepartment for consumer affairs was set up by state and central government. The three level systems of consumercourts are National, State and District levels.
2. Public Distribution System
To protect the reduce in raise of price and black market the government food security to the poor by supplyingessentials through the ration or Fair price shops.
3. Standardization of ProductsThese are done to assure the quality of products. The ISI stamp is placed in all goods by the Bureau of Indian
standards. This is to provide the industrial and consumer goods. These goods are expected for the specific standards.Agmark is meant for Agricultural products. In the International level the International Organization forStandardization (ISO) is located in Geneva frames a common standard. The FAO and WHO provide food standards.
VI.CONSUMERDECISIONMAKING
Consumer takes a decision in purchase goods according to their taste and preference in accordance to theirbudget. It may be large or small.
115
International Journal of Enterprise and Innovation Management Studies (IJEIMS) Vol. 1 No. 1
A. Need Awareness: Awareness creates advertising to place advertiser in “top of mind”, mind share building.
B. Need Assessment: Benefits oriented to advertising is to shift a needful solution toward advertising company offer.
C. Data Collection: Benefits oriented in education advertising, information and contrast print in collateral such asbrochures, flyers, directs mail.
D. Data Evaluation: Information and contrast print brochures, spec sheets, flyers direct mail.
E. Decision to Purchase: Sales in price point oriented advertising, direct mail and point-of-purchase.
F. Actual Purchase: Point of sale materials, posters, and Add-on offers will increase in up selling incentives.
G. Buyer’s Remorse: Awareness by advertising, again need customer service, follows up, direct mail.
VII.CONCLUSION
Now a day’s consumers are challenged by increase in amounts of information and wider choices of products. Tomake good choices in ever more competitive markets, they must develop a greater range of skills and knowledge. This isto establish consumer rights; responsibilities in the country, main concern should be given first to aware and to educate thepeople through awareness program and sufficient training to the consumers as well as to all the productive sectors, foodtrainer, suppliers and food business persons. There is still a need to increase the consumer’s awareness of the differentalternative providers and for the take up of new innovative services which can help in business growth.
REFERENCES[1] R. Dhir, Consumer Protection Rights in India: Awareness and Attitude of Selected Consumers and Marketer,
M.Sc. thesis, Punjab Agricultural University, Ludhiana, Punjab. 1995.
[2] Terrence O’Brien, stages of Consumer decision making Journal of Marketing Research, Vol. 8, No. 3 pp. 283-289. Aug., 1971.
[3] B.C. Neelkanta and H.B. Anand, “Educating the Consumer”. Social Welfare, 37(11-12): 5-6, 1992.
[4] K.R.Parmwshvar, Protect Consumer against quality trichsters”. Yojana, 32(5): 29-31, 1988.
[5] J.E Sabin and N. Daniels, Strengthening the consumer voice in managed care: I. can the private sector meet thepublic-sector standard? Psychiatric Services 52:461-462; 464, 2001.
116

International Journal of Enterprise and Innovation Management Studies (IJEIMS) Vol. 1 No. 1
OPINION OF CUSTOMERS ABOUT DEALERS’ SERVICE IN INDANEGAS – A STUDY WITH SPECIAL REFERENCE TO SIVAKASI TOWN
J. VIMAL PRIYAN1 and V. KARTHIHAISELVI2
1Assistant Professor in Commerce, ANJA College, Sivakasi.2Research Scholar, V.H.N.S.N College, Virudhunagar.
I.INTRODUCTION
There are various traditional as well as modern sources of energy used for cooking purpose. Yet, it is veryobvious that many go for LPG. The preference for LPG by the people of both urban and rural areas may be due to itssalient features like economy and speedy. Till the end of 20th century it has been moved towards buyers’ market.This is mainly due to the incoming of private agencies supplying LPG cylinders. Among the three governmentagencies supplying LPG such as Indian Oil Corporation, Bharat Petroleum and Hindustan Petroleum, it is the IndianOil Corporation which introduced LPG in the name “Indane” for the first time in India. Customers’ opinion ondealer’s trade practices will eventually affect their attitude towards the product on which the dealer provides variousservices. Therefore, it is necessary to study and analyses customer’s opinion on dealer’s trade practices. Generallywhen customers have favorable opinion on dealers’ trade practices in relation to the product they will have positiveattitudes towards the product. That is why, this study has been undertaken by the researcher to get know the reasonswhy customers prefer indane gas and to know about their opinion towards the services rendered by dealer.
II.OBJECTIVESOFTHESTUDY
The specific objectives of the present study are
1. To know about the customers’ opinion about the dealers service of indane gas.
2. To offer valuable suggestions on the basis of the findings of the study
III.METHODOLOGY
In this study the researcher has adopted convenience sampling technique for selecting 75 sample customers. Carewas taken to see that different types of customers such as businessmen, professionals, salaries people and agriculturistswere included in the survey. Primary data was collected from the customers by using questionnaire during the period fromJanuary 2010 to March 2010. The questionnaire was pretested with 10 customers and revised in the light of the experiencegained from the pre test. Secondary data were collected from the text books, journals and periodicals.
IV.PROFILEOFRESPONDENTSAGEOFTHECUSTOMERS
Age is identified as one of the variables that has significant relationship with level of opinion among the customers.
Table 1 shows the age wise classification of the sample customers of the study.
TABLE1:AGEWISECLASSIFICATIONOFCUSTOMERS
Age group No. of Respondents Percentage to total
Below 30 years 10 13
30–40 17 23
41–50 21 28
Above 50 years 27 36
Total 75 100
Source: Primary data
It is significant to note that most of the sample customers are aged, as they fall under the age group of 41 – 50and above 50.
117

International Journal of Enterprise and Innovation Management Studies (IJEIMS) Vol. 1 No. 1
V.EDUCATIONALSTATUSOFTHECUSTOMERS
Education is said to be an important factor which influences the opinion of customers. Table 2 shows theeducational status of the customers
TABLE2:EDUCATIONALSTATUSOFTHECUSTOMERS
Educational status No. of Respondents Percentage to total
Illiterate 10 13
High school 5 7
Diploma/ degree 15 20
Master degree 20 17
Professional 25 33
Total 75 100
Source: Primary data
It is important to note that out of 75 respondents, 25 of the respondents (33%) are professionals and 5 of them(7%) have completed matriculation.
VI.OCCUPATIONOFTHECUSTOMERS
Occupational status of the customers is considered to be an important factor in influencing the opinion ofthe customers. Table 3 shows the occupational status of the customers.
TABLE3:OCCUPATIONWISEDISTRIBUTIONOFRESPONDENTS
Occupation No. of Respondents Percentage to total
No occupation 10 13
Private / Government employee 5 7
Business man 15 20
Agriculturist 20 17
Housewife 25 33
Retired person 19 25
Total 75 100
Source: Primary data
Out of 75 respondents, 4 (6%) have no occupation and 25 (33%) respondents belong to the category ofbusinessmen and 12 (16%) respondents are housewives.
VII.INCOMEOFTHECUSTOMERS
Income is one of the important variables having significant relationship with the level of opinion of the customers.
In the present study the monthly income of the customers is classified into five categories as mentioned in table 4.
TABLE4:INCOMEOFTHECUSTOMERS
Income group No. of Respondents Percentage to total
Below Rs. 2000 32 43
Rs. 2001 - 4000 12 16
Rs. 4001 - 6000 20 27
Rs. 6001 – 8000 6 8
Above 8000 5 16
Total 75 100
Source: Primary data
118
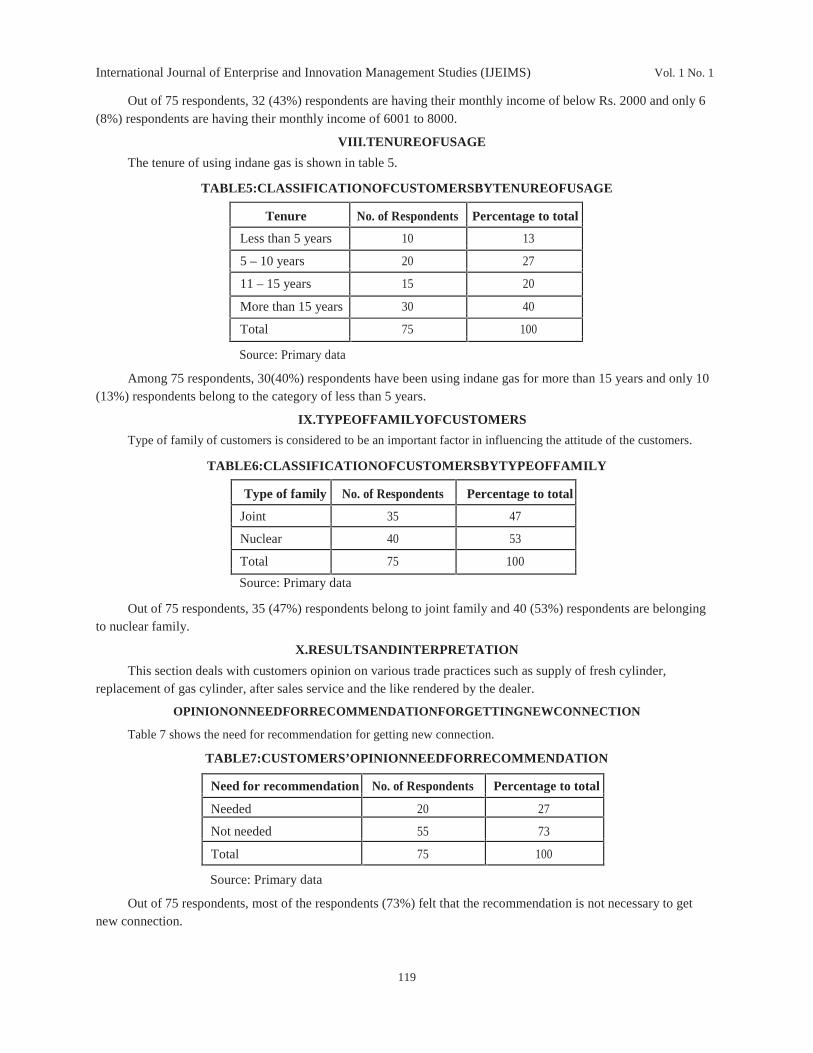
International Journal of Enterprise and Innovation Management Studies (IJEIMS) Vol. 1 No. 1
Out of 75 respondents, 32 (43%) respondents are having their monthly income of below Rs. 2000 and only 6(8%) respondents are having their monthly income of 6001 to 8000.
VIII.TENUREOFUSAGE
The tenure of using indane gas is shown in table 5.
TABLE5:CLASSIFICATIONOFCUSTOMERSBYTENUREOFUSAGE
Tenure No. of Respondents Percentage to total
Less than 5 years 10 13
5 – 10 years 20 27
11 – 15 years 15 20
More than 15 years 30 40
Total 75 100
Source: Primary data
Among 75 respondents, 30(40%) respondents have been using indane gas for more than 15 years and only 10(13%) respondents belong to the category of less than 5 years.
IX.TYPEOFFAMILYOFCUSTOMERS
Type of family of customers is considered to be an important factor in influencing the attitude of the customers.
TABLE6:CLASSIFICATIONOFCUSTOMERSBYTYPEOFFAMILY
Type of family No. of Respondents Percentage to total
Joint 35 47
Nuclear 40 53
Total 75 100
Source: Primary data
Out of 75 respondents, 35 (47%) respondents belong to joint family and 40 (53%) respondents are belongingto nuclear family.
X.RESULTSANDINTERPRETATION
This section deals with customers opinion on various trade practices such as supply of fresh cylinder,replacement of gas cylinder, after sales service and the like rendered by the dealer.
OPINIONONNEEDFORRECOMMENDATIONFORGETTINGNEWCONNECTION
Table 7 shows the need for recommendation for getting new connection.
TABLE7:CUSTOMERS’OPINIONNEEDFORRECOMMENDATION
Need for recommendation No. of Respondents Percentage to total
Needed 20 27
Not needed 55 73
Total 75 100
Source: Primary data
Out of 75 respondents, most of the respondents (73%) felt that the recommendation is not necessary to getnew connection.
119

International Journal of Enterprise and Innovation Management Studies (IJEIMS) Vol. 1 No. 1
OPINIONONWAITINGTIMETOGETTHESECONDCYLINDER
Table 8 shows the customers opinion on waiting time to get the second cylinder.
TABLE8:OPINIONONWAITINGTIMETOGETTHESECONDCYLINDER
Need for waiting No. of Respondents Percentage to total
Needed 50 67
Not needed 25 33
Total 75 100
Source: Primary data
Out of 75 respondents, most of them (67%) are of the opinion that they need to wait for a long time to get thesecond cylinder.
OPINIONONPURCHASINGSTOVESANDACCESSORIESFROMTHEDEALER
Table 9 shows the customers’ opinion on purchasing stoves and accessories from the dealer.
TABLE9:OPINIONONPURCHASINGSTOVEANDACCESSORIESFROMTHEDEALER
Opinion No. of Respondents Percentage to total
Purchasing 45 60
Not purchasing 30 40
Total 75 100
Source: Primary data
Out of 75 respondents, most of the respondents (60%) are of the opinion that they have bought the accessoriesform the dealers.
OPINIONONFREQUENCYOFWAITINGTIMETOGETTHEFRESHCYLINDER
The customers’ opinion on frequency of waiting time to get the fresh cylinders is given in table 10.
TABLE10:OPINIONONFREQUENCYOFWAITINGTIMETOGETTHEFRESHCYLINDER
Opinion No. of Respondents Percentage to total
Less than 7 days 5 7
7 – 13 days 15 20
14 – 20 days 10 13
21 – 27 days 20 27
More than 27 days 25 33
Total 75 100
Source: Primary data
Out of 75 respondents, 25 of them (33%) have to wait for more than 27 days to get fresh cylinder and 5 ofthem (7%) only get the cylinder within 7 days.
120

International Journal of Enterprise and Innovation Management Studies (IJEIMS) Vol. 1 No. 1
OPINIONONMODEOFAPPROACHINGTHEDEALERTOOBTAINTHEFRESHCYLINDER
The customers’ opinion on mode of approaching the dealer to obtain the fresh cylinder is shown in table 11
TABLE11:OPINIONONMODEOFAPPROACHINGTHEDEALERTOOBTAINTHEFRESHCYLINDER
Mode of approach No. of Respondents Percentage to total
Phone 33 44
Mail 6 8
Messenger 6 8
Personal visit 30 40
Total 75 100
Source: Primary data
Out of 75 respondents, 33 of them (44%) use phone to contact the dealer to get the fresh cylinder and only 6 ofthem (8%) use mail and messenger to approach the dealer for getting the fresh cylinder.
OPINIONONEFFECTIVENESSOFVARIOUSMODESOFAPPROACHINGTHEDEALER
Table 12 shows the customers' opinion on the dealers.
TABLE12:OPINIONONEFFECTIVENESSOFVARIOUSMODESOFAPPROACHINGTHEDEALER
Mode of approach No. of Respondents Percentage to total
Phone 30 40
Mail 4 5
Messenger 5 7
Personal visit 36 48
Total 75 100
Source: Primary data
Out of 75 respondents, 36 of them (48%) are having the opinion that personal visit is more effective mode toapproach the dealer and only 4 of them (5%) are having the opinion that sending mail is the effective mode toapproach the dealer.
OPINIONONDEFECTSINTHECYLINDER
Table 13 depicts the customers' opinion on defects in the cylinder.
TABLE13:OPINIONONDEFECTSINTHECYLINDER
Opinion No. of Respondents Percentage to total
Defects 22 29
No defects 53 46
Total 75 100
Source: Primary data
Out of 75 respondents, 53 of them (46%) are of the opinion that there is ino defect in the cylinder supplied bythe dealer and only 22 of them (29%) are of the view that they find defects in the cylinder supplied.
121

International Journal of Enterprise and Innovation Management Studies (IJEIMS) Vol. 1 No. 1
OPINIONONDEALERS'AFTERSALESSERVICE
The customers' opinion on after sales service provided by the dealer is shown in table 14.
TABLE14:OPINIONONDEALERS'AFTERSALESSERVICE
Opinion No. of Respondents Percentage to total
Provided 37 49
Not provided 38 51
Total 75 100
Source: Primary data
Out of 75 respondents, 38 of them (51%) are of the opinion that they are not provided any after sales service.
OPINIONONTHEWAYOFINCURRINGCOSTOFAFTERSALESSERVICE
Table 15 shows the customers' opinion on the way of incurring the cost of after sales service.
TABLE15:OPINIONONTHEWAYOFINCURRINGCOSTOFAFTERSALESSERVICE
Opinion No. of Respondents Percentage to total
At cost 27 36
Free of cost 48 64
Total 75 100
Source: Primary data
Out of 75 respondents, 48 of them (64%) are of the opinion that they are provided the after sales service at free of cost.
XI.SUGGESTIONS
The following suggestions were given on the basis of the findings of the study.
1. There should be one more dealer in Sivakasi so as to distribute gas cylinder quickly.
2. Gas cylinder godowns may be installed in few more places as the study area is vast.
3. There should be a periodical checking up of the cylinder. If any defect is found in any place, the dealer shouldsend immediately a mechanic to rectify the defect in the gas cylinder.
4. Gas cylinder for commercial purpose may be in different color so as to avoid irregularities in cylinder distribution.
XII.CONCLUSION
This study has been undertaken for identifying the customers' opinion towards indane gas dealers' tradepractices. Most of the customers are of the opinion that there is a delay in providing cylinder. It is suggested thatthere should be one more dealer in Sivakasi so as to distribute gas cylinder quickly. Majority of the customers preferindane gas for the reasons like economy, convenience, time saving and cleanliness. As LPG has been movedtowards buyers market, the dealer should provide better customers service that his competitors in order to haverepeated sales, increased clientele and eventually sustainable development.
REFERENCES1. Claire Selthiz, Research Methods in Social Relations, Methuen & Co. Ltd., London, 1965.
2. Grewal, P.S., Methods of Statistical Analysis, Sterling Publishers Private Limited, New Delhi.
3. Gupta, S.P., Statistical Methods, Sultan Chand & Sons, New Delhi, 1991.
4. Nalini Prava Tripathy, "An Application of Factor Analysis Approach Towards Designing Insurance Products inIndia", Insurance Chronicle, February 2006.
5. Nalini Prava, "An Application of Factor Analysis Approach Towards Designing Insurance Products in India",Insurance Chronicle, The ICFAI University Press, Hyderbad, February 2006.
6. Sudarshena Reddy, G., "Customer Perception Towards Private Life Insurance Companies Policies withReference to Bangalore City", Indian Journal of Marketing, April, 2005.
122

International Journal of Enterprise and Innovation Management Studies (IJEIMS) Vol. 1 No. 1
KINDNESS IS THE GREAT INVESTMENT OF BUSINESS
1D. EZHILARASAN and 2Dr. S.K. NAGARAJAN1Lecturer, Dept. of MBA, Thiruvallauvar College of Engineering & Technology, Vandavasi - 604 505.
2Lecturer (SS), Dept. of Business Administration, Annamalai University.
I.INTRODUCTION
Back in the “day,” if you wanted to be successful in business, it was all about kindness and the way people feltafter leaving your establishment or after a business transaction. That is what truly kept them coming back, even ifyou product was mediocre. Let’s face it, we all want to be treated kindly in every circumstance of our life. But thisseems to have gotten lost in the technologically advanced and fast-paced corporate world.
Kindness as a value in the workplace, because it is a simple concept-too simple, on first impression, to providea solution to the complex and serious challenges businesses are currently facing. It is precisely this simplicity,however, that gives this initiative the power to affect change at all levels, both with individuals and organizations.
Expert’s thoughts“The best portion of a good man’s life - his little, nameless, unremembered acts of kindness and love” says
William Wordsworth
The face of business has forever changed and the Kindness Makeover Challenge will help professionals andbusinesses adapt successfully. “People are increasingly choosing to do business with people they know, like, andtrust. The key to success now is to be who people turn to.” says Kristin Tillquist
“Kindness is the highest form of intelligence.” - Wayne Teasdale
“Act with kindness, but do not expect gratitude” says Confuscious
Kindness changes our lifeImagine someone doing something nice for you right now. A sincere compliment or holding the elevator for you.
It’s a good feeling, isn’t it? Kindness has the ability to change us, and our emotions, immediately. The pursuit of asustainable lifestyle goes beyond just ‘greening’ your life. Personal sustainability is a mindset change that shifts thepersonal value drivers in daily activities. As a professional and sustainability consultant, I see how kindness, generosityand willingness are intrinsically linked to a sustainable lifestyle or green living. While we are here on this planet, at thisprecise time in history, many of us want to make a difference in the way we treat our environment. Many of us want tomake a significant contribution to the role business takes in shaping our economy, society, and environment.
Positive impressions are like seedsEvery time you smile at a messenger, laugh at a coworker’s joke, thank an assistant, or treat a stranger with
graciousness and respect, you throw off positive energy. That energy makes an impression on the other person that, inturn, is passed along to and imprinted on the myriad others he or she meets. Such imprints have a multiplier effect. Andultimately, those favorable impressions find their way back to you. That doesn’t mean the waiter you tipped well will oneday found a Fortune 100 company and offer you stock options (unless it was one hell of a tip). The results of the power ofnice are rarely that direct. In fact, you may not notice any impact on your life for years, apart from the warm glow it givesyou inside. Nonetheless, we have found that the power of nice has a domino effect. You may not ever be able to trace yourgood fortune back to a specific encounter, but it is a mathematical certainty that the power of nice lays the groundwork formany opportunities down the road. These positive impressions are like seeds.
Nice must be automaticA friend recently told us the story of three consulting companies vying for a very large contract. One was
summarily dropped, even though the firm did a terrific presentation. Why? they wondered. It turned out that whenthe prospective client arrived at the airport, an executive from one of the consulting firms neglected to help with herbags. He lost the contract right there. She was miffed at his rudeness and lack of manners, and decided that shedidn’t want to do business with them. Here their team had worked day and night to give the client a knockoutpresentation, and the entire account was lost over a suitcase.
123

International Journal of Enterprise and Innovation Management Studies (IJEIMS) Vol. 1 No. 1
The negligent executive certainly knew the client was a VIP. So why didn’t he pick up the bag? Simple: Hewasn’t skilled in the art of being nice. If it had been part of the way he treated everyone, the oversight never wouldhave occurred. Picking up the bag for the client would have been second nature, instead of a once-in-a-while gesturegranted only to clients and bosses and other important people. He would have understood that such small gesturesand actions can have an enormous impact.
It’s the stuff of urban legend and mythIn what has become the stuff of urban legend, there is a story of an individual who had a death in the family.
Upon cleaning out their loved one’s home they discovered many unopened boxes of Zappos shoes. Not knowingwhat to do, the person called Zappos. Without a receipt or knowing how long the shoes had been sitting in thecloset, the customer service rep arranged to have the shoes picked up at no charge and a refund was made. Seemskind enough, but the individual who was dealing with a death in the family also received flowers and a note ofcondolence from Zappos the following day.
Where do you think that person religiously buys all of their shoes now? How often do you think that story getstold to family and friends? How many times has that story transcended this person’s social graph to mass mediaoutlets like this or to the online world? Does Zappos get it right 100 per cent of the time? Doubtful. Do consumersalways feel like every brand interaction they have with the company is one of kindness? Probably not. Does beingkind get people talking about, buying from, and loving a company like Zappos? Absolutely
II.BENEFITSOFKINDNESS
1. Improved Morale: The Kindness to Colleagues program umbrella is uniquely effective in improving morale asit is founded on a solid framework for building meaningful relationships and an inspiring corporate culture.
2. Reduced Turnover: Organizations are well aware of the costs associated with turnover, and a creative healthpromotion program can be a valuable “carrot” to keep employees from taking their intellectual capital to competitors.The Kindness to Colleagues program has strong implications for even further reducing turnover because itsrelationship-focused model builds friendships and loyalty, proven factors for retaining the best and brightest.
3. Increased Recruitment Potential: Creative health promotion programs can serve as a valuable recruitmentincentive. The Kindness to Colleagues™ program, however, can take this one step further by offering aframework with which to unite all organizational initiatives in the areas of employee wellbeing, managementstyle and strategy, rewards and recognition, community contribution, and environmental responsibility. Thesimplicity of the concept has the ability to provide a more powerful and unified presence that will have a higherimpact in the recruiting and retention process.
4. Reduced Absenteeism: Health promotion programs have the direct benefit of reducing the costs associated withabsenteeism. They also reduce the stress in organizations and work teams caused by having to cover for missingworkers. The Kindness to Colleagues™ program adds another dimension to reducing absenteeism whenphysical illness is not the only reason for employee absenteeism. The focus on building relationships andproactively promoting kind acts on a day to day basis can have dramatic effects on absenteeism due to stressassociated with bullying, intolerance, poor communication skills, or the lack of attention to the simple, yetcritical, factors for nurturing healthy relationships in the workplace.
5. Health Care Cost Containment: Containing costs associated with certain health problems is an important benefitof any health promotion initiative. A comprehensive wellness program such as Kindness to Colleagues™ whichintegrates a variety of initiatives under one comprehensive roof can offer further cost containment benefits in allareas of the organization by fostering a cross-pollination of ideas, creativity, and communication at all levels.
6. Improved Employee Health Status: Research is growing in support of well-designed health promotioninitiatives that impact negative behaviors such as smoking, high-risk alcohol use, lack of exercise, poornutritional habits, seatbelt usage and stress. Although little research has been conducted at this point, theKindness to Colleagues™ program is capable of producing tangible, measurable improvements in employeehealth status by directly addressing the physical, mental, emotional and social aspects of wellness. A workforcethat addresses health issues on all fronts will benefit from increased energy, performance, creativity, andproductivity which, in turn, translate into a healthy return on investment for the organization.
124

International Journal of Enterprise and Innovation Management Studies (IJEIMS) Vol. 1 No. 1
Negative impressions are like germsWhenever you’re aloof to someone who you think “doesn’t matter,” people unconsciously react to that. You
might get a better table if you scream at a waitress for service, but we can assure you that your date will silently besaying, “Check, please.” Just as positive actions are like seeds, rude gestures and remarks are like germs—you maynot see the impact they have on you for a while, but they are there, silently infecting you and everyone around you.
III.CONCLUSION
I believe kindness is the highest form of intelligence because when employed it infiltrates the deepest cocklesof the heart and mind and accomplishes the impossible where normal human efforts have failed. I have witnessed itspower and I know it works. It should be applied in business and it should be applied in our family lives and in everyrelationship we have. If we do so we will experience personal empowerment on a level never before realized. Sohere’s to being kind. Kindness is empowering the business.
REFERENCE1. Fred, Luthans. 2001. Organizational behavior, New York: McGrqw Hill.
2. Sagini, Meshack M. 2009. Organizational behavior, New Delhi: Overseas press.
3. Khan M, 2007. Consumer behavior, New Delhi: New age international.
4. Kotler, Philip. 1996. Marketing management, New York, Prentice Hall.
5. http//www.google.com
125

International Journal of Enterprise and Innovation Management Studies (IJEIMS) Vol. 1 No. 1
CUSTOMER RELATIONSHIP MANAGEMENT IN BANKING SECTOR(An Empirical Study with reference to Banks in Thiruvannamalai District, Tamil Nadu)
1M. MURUGAN and 2Dr. S.A. SENTHIL KUMAR1Assistant Professor and Research Scholar (Ph.D)
Department of Management StudiesSCSVMV University, Enathur, Kanchipuram, TN
2Associate Professor and Research Guide,Central University of Pondicherry, Pondicherry.
ABSTRACT
It is felt that Modern Banking has become wholly customer – driven and technology driven. During the lastdecade, technology has been dramatically transforming the banking activities in India. Driven by challenges oncompetition, rising customer expectation and shrinking margins, banks have been using technology to reducecost. Apart from competitive environment, there has been deregulation as to rate of interest, technology intensivedelivery channel like Internet Banking, Tele Banking, Mobile banking and Automated Teller Machines (ATMs)etc have created a multiple choice to user of the bank. The banking business is becoming more and more complexwith the changes emanating from the liberalization and globalization. For a new bank, customer creation isimportant, but an established bank it is the retention is much more efficient and cost effective mechanism.Customer Relationship Management (CRM) would also make Indian bankers realize that the purpose of theirbusiness is to create and keep a customer and to view the entire business process as consisting of HighlyIntegrated effort to discover, create and satisfy customer needs. But it is surprising to note that much of theactivities of the banking and financial remain focused on customer creation not retention.
It is revealed in the National Survey that the most effective media for increasing awareness of the bank productsis publicity through friends and relatives of potential savers. In rural areas, there is a tremendous potential fordeposits and advances, but most of the potential is left untapped due to lack of awareness of basic productsscheme. A satisfied customer is silent advertiser for banks products. Under these situations it has been thought fitto conduct a study and CRM in banking sector.
The research work is an empirical study intended to explore the technological revolution that the commercialbanks witnessed and how far it has benefited banks to build better customer relationship management (CRM)services of public sector banks with private sector banks. Further more, a comparison would also be made to findout the expectations of the customers from the banking stream and on various technical and structural fronts.
Keywords - Customer, Management, Banking sector, CRM
I.INTRODUCTION
Banking Industry in India has undergone a rapid changes followed by a series of fundamental developments.Most significant among them is the advancement in Information Technology as well as communication system. Thishas changed the concept of Traditional Banking activities and has been an instrumental behind broadening thedissemination of financial information along with lowering the cost of many financial activities. Informationtechnology and communication networking systems have revolutionized the functioning of Banks. Secondlyincreasing competition among a broad range of domestic and foreign institutions in product marketing area becomesa prevalent practice. Thirdly, inline with the increase in overall economic activities, financial institutions too, havemodified themselves accordingly in all spheres including customer service
The customers are now demanding more on price (interest rate) financial security, quick service, convenience,attractive yield, low cost loan, professional service, advice/ counseling, Easy access, simple procedure, Friendlyapproach, and variety of product.
The whole service sector is now metamorphosed to become customer specific. Until the implementation of theNarasimhan Committee recommendations, banks in India operated under protected environment. Even after 1993saw the emergency of a new breed of banks called new private sector Banks and opening of most foreign banks inIndia. The nature of competition that characterizes the banking industry before 1993 is shown in the following table.
126

International Journal of Enterprise and Innovation Management Studies (IJEIMS) Vol. 1 No. 1
In a service industry like banking, the customer is and would continue to be a prime factor and the customerservice would be one of the factors for improving profitability. Banks are conscious of the relative cost of acquiringnew customer. In the wake of increasing competition, the banks realized that ‘customer is king’ and keeping orretaining a customer is less expensive than creating a new customer for their products. According the Sam Walton,“There is only one boss. He is the customer; he can fire everybody in the company from the chairman down the line,simply by putting somewhere else”. It was the growing realization of these paradigm shifts that led banks to veertowards CRM which believes that.
Y When you lose a customer, you lose his life time value.
Y Satisfied customer is the best advertisement for a product.
Y A 5% increase in customer loyalty will result in profit increase of more than 25%.
Y 80/20 principal – In nearly every industry, 20% of the customers account for 80% of the profit.
Y A satisfied customer brings in 100 potential new customers whereas one dissatisfied customer prevents1000 potential new customer.
In the recent years, CRM has emerged as one of the most widely prescribed solutions for increasing marketchase and growth of many industries in general, banking sector in particular. CRM is a simple philosophy whichplaces the customer at the heart of the business organizations process, activities and culture with as intention toimprove customer satisfaction. In other words, CRM is described as the establishment, development, maintenanceand optimization of the long term mutually valuable relationship between the customer and the organization. Fromthe organizations competitive advantage to boost the profits.
II.REVIEWOFLITERATURE
Kamath (1979) in his thesis entitled “Marketing of bank services with special reference to branches inBombay city of syndicate bank” has concluded that quicker and better service offered by bank will be themost important variable in attracting and retaining customer.
S.G Shah (1985) in his article has stated that quality of customer service in bank has to very sunk to verylow and poor levels because of two vastly different reasons. The first is that even the simple routine servicehave broken down. The second area in which customer service is lagging is that of special situation.
T.S Ravisankar in his study “Marketing strategies and planning for business growth in banks stressed thatthe marketing plan for banking service be supported by appropriate marketing strategies. He suggests thatthe marketing strategy for banks must be oriented to customer – current and potential.
John Brooks former president and chairman of the council of the charted institute of Bankers, Londonstates “Customer care is emerging as a critical factor in the banking industry and bankers are fullyconscious of the need for attaining international standard for service”.Dr. B.C. Saraswathy (2006)in her article has stated that the mail objectives of CRM are building long term,sustaining relations with customers by delivering superior customer value and satisfaction. Instead of tryingto maximize profit for each every transaction, CRM focuses on maximizing profits over the lifetime valueof customers. Undoubtedly, CRM is a potential tool in sustaining and boosting sales in this era of hypercompetitive world.
III.OBJECTIVESOFTHESTUDY
1) To study the perception of the customers as to CRM of the banks with respect to service quality management,
2) To study the perception of the customers as to CRM of the banks with respect to customer interaction management,
3) To study the perception of the customers as to CRM of the banks with respect to customer retention management.
IV.METHODOLOGY
This research work will depend on both primary and secondary data. Primary data will be collected by ways ofwell structured questionnaire that will be administered by the researcher on banks in Thiruvannamalai District ofTamilnadu. secondary data will be collected from published records of RBI and other Bank authorities, standard textbook and published research papers.
127

International Journal of Enterprise and Innovation Management Studies (IJEIMS) Vol. 1 No. 1
The required primary data will be collected from the bank branches in Thiruvannamalai District. A minimumof 8 branches will be approached, apart from collecting information from banks, the general public who holdsaccounts with the banks in the District.
The researcher followed multi-stage sampling in the selction of sample. Public and Private sector banksoperating in Tiruvannamalai of Tamil Nadu. The sample for the study was selected through a three-stage samplingprocedure. The first stage involved the choice of banks. As it was felt that it would be useful to attempt acomparative study between Public and Private Banks, two public sector banks (SBI, IOB ,ICICI Bank and TMB.
The random selection of bank branches constituted the second stage of the sampling process. Two branchesfor each of the chosen public sector banks and two branches for each of the Private sector banks were selected forthis study.
Judgment sampling method was adopted initially 50 customers from each branch were targeted for datacollection needed for the study. Thus the final sample for the study consisted of 8 banks branches (four from topublic sector banks and four from private sector banks) which generated 210 customers for studying customerrelationship management in banks of Tiruvannamalai District. The bank wise number of respondents is show below.
SBI - 53 respondents
IOB - 54 respondents
ICICI - 51 respondents
TMB - 52 respondents
Total - 210 respondents
V.ANALYSIS
Delivering high quality service is an important strategy that attracts and retains customers and enhancescustomer relationship in banks. High quality in service pleasing and creating delightful customers and not justsimply and not just simply preventing them form getting annoyed service quality itself comprises of severaldimensions like empathy, reliability, responsiveness, tangibility, communication etc.
Customers’ perception of empathy dimension of service qualityThe empathy dimensions of service quality and its items in public and private sector banks are compared.
Table :1 : Sector-wise mean ratings of empathy dimensions items of service quality
Types of Banks
Empathy Dimension items Public Sector Bank (n=107) Private Sector Bank (n=103)
mean mean
Banks gives individual attention 3.170 3.250
Convenient operating hours 3.520 3.710
Employees understand specificneeds of the customers 3.141 3.080
Customer is made to feel important 3.260 3.150
Dimension mean 3.270 3.300
Source : computed
Table 1. shows that the empathy dimension mean of public sector banks is 3.270 and that of private sector banks is 3.300.
This clearly shows that private sector banks are rated slightly higher than public sector banks.
In both public and private sector banks, the mean ratings of Individual attention, understanding the specific needs of
the customers and importance given to the customers are lower than their respective dimension mean values.
128

International Journal of Enterprise and Innovation Management Studies (IJEIMS) Vol. 1 No. 1
Comparison of empathy dimension means in public and private sector banks :
Table :2
Types of Bank Mean S.D No t df Table value Sign
Public Sector Banks 3.270 0.67 107
Private Sector Banks 3.300 0.80 103 0.313 419 1.966 Vs
All sectors 3.290 0.74 210
Source : computed
Vs. not significant
The calculated t- test value at 0.313 which is less than the table value of 1.966 at 5% level of significance,shows that there is no significant difference between the service quality of public sector banks that of private sectorbanks in terms of empathy dimension. Hence, the hypothesis is accepted.
Customer interaction management in public sector and private sector banks
The customer interaction management is an intensive interaction between the bankers and the customers and itleads to relationship building
Table – 3 : Comparison of customers perception of customer interaction management is presented in the table -3
S.No Customer Interaction Item Public Sector Banks Private Sector Banks(N=107) Mean (n= 103) Bank
1 Skill to recognize individual 3.450 3.390
2 Skill to educate 3.330 3.180
3 Ability acquire interpersonal traits 3.120 3.110
4 Skill to motivate 3.290 2.990
5 Skill to fulfill the needs 3.350 3.100
6 Ability to respect sentimentals 3.240 3.050
7 Skill to speed up response 3.090 3.050
8 User friendly services skills 3.110 2.960
9 Ability to operate under technical environment 3.240 2.960
10 Skill to work under varies situations 3.170 2.890
Dimension rate 3.139 3.068
Table-3 shows that the dimension means as public sector bank is 3.139 and that of private sector bank is3.068-. The comparison of customer interaction management skills of both the banking sectors reveals that the meanrating of all the skills in the public sector banks is rated higher than the positive sector banks and that the publicsector banks are well interaction with their customers.
Customer retention management in public and private banksCustomer retention management is concerned with the keeping customer in the customer inventory for an
unending period by meeting their needs and exceeding their expectation it is an approach of converting a casualcustomers into a committed loyal customer.
129

International Journal of Enterprise and Innovation Management Studies (IJEIMS) Vol. 1 No. 1
Table : 4 Sector-wise mean ratings of customers retention management
S.no Customer retention management items Public sector banks (n = 107) Private sector banks (n = 103)
1. Market leader in straregies 3.510 3.660
2. Innovative services 3.340 3.610
3. Individual customer programmer 3.050 3.260
4. Customer-centric approach 3.090 3.200
5. Value added services 3.010 3.200
6. Total employees involvement 3.110 3.070
7. Low charges 3.140 2.790
Dimension mean 3.178 3.255
Table : 4 reveals that the dimension mean of customers retention management of public sector is 3.178.
Customers’ perception of customer retention management in both the banking sector is almost the same.
VI.FINDINGS
1. In both public and private sector banks, the mean rating of individual attention understanding the specific needsof the customers are lower than their respective dimension mean values.
2. Public Sector banks is rated higher than the positive section banks and the public section banks are wellinteractive with their customers perception of customer retention management practices in public and privatesectors is almost the same.
VII.SUGGESTIONS
The customers perception of service quality is lower in private sector banks. So it is suggested that privatesector banks may take steps to improve their service quality, strategies, customer interaction management strategiescustomer retention management strategies.
VIII.CONCLUSION
The present study provides some guidelines for customer relationship management satisfied customers areloyal customer, their retention rate is much higher and so is their overall profitability for the bank. CRM offers themost holistic route for banks to enhance customer relationships.
Banks can enhance customer retention, profitability and loyalty and get an increased share of banks from theircustomers.
Banks need to embrace CRM as a principle and adopt a strategy for managing customer relationships thateffectively addresses three key areas, customers, processes and technology.
Finally banks should take actions such as recognition and delegation of work, freedom to handle customer’sgrievances and management’s approval to take decision according to the situations.
REFERENCES1. Bateson J.E.G. (1995) Managing Service Marketing
2. Berry L.C. and Parasuraman A. (1991) Marketing services
3. Andicine .P (1995), The Essence of services Marketing, New Delhi
4. Kotler,P.(1999), Marketing Management:
4. The millennium edition,
5. Quality on the Line Harvard Business Review
130

International Journal of Enterprise and Innovation Management Studies (IJEIMS) Vol. 1 No. 1
Impact of Indian overseas Bank Finance to Small Scale Industry
S.N. DhanalakshmiAssistant Professor in Department of Commerce
Sri Balamurugan Arts and Science CollegeSathappadi, Mecheri.
ABSTRACT
Indian Overseas Bank provides customer and commercial Banking services extending their aims to obtain aradical change that can cause reinforcement in economy. It inculcates in every one to buy or sell or transfer moneyconferring to diverse facts and figures. The overseas Bank ensures a good way of tackling the intensificationevolving currency. Finance is an important input for an industry. For a small scale industry the need for finance isvery essential due to its limited resources. The sources of finance for small scale industries are of two types-internaland external. The role of commercial banks in the process of economic development is well recognized. The year1969 was a major turning point in Indian financial systems when 14 major banks were nationalized. Differentnational and state level institutions operating in the country for meeting the credit requirements of the SSIs sectorinclude Small Industries Development Bank of India, Commercial Banks, Regional Rural Banks, Co-operativeBanks (State, Central and Primary), State Financial Corporations/ State Industrial Investment Corporations, StateSmall Industries Development Corporation, National Bank for Agriculture and Rural Development, statutory bodies(KVIC, COIR Board, Handloom Board and Handicraft Boards), National Small Industries Corporations Limited andthe like. This Paper focus on impact bank finance to Small Scale industry. Indian overseas Bank lending to thesmall-scale industries in Salem district to the Private sector the priority sector lending. The trend values showed thatthe target has increased faster than the actual amount of advances. The recovery rate of the SSI advances is amaximum of 69% in Salem district.
Keywords: Banks; Small-scale industries; IOB Bank Lending Services , Economic development Sources ofFinance.
1.IntroductionThe Banking sector in India has always been one of the most preferred avenues of employment. In the
current decade, this has emerged as a resurgent sector in the Indian economy. Banking industry being a serviceindustry should offer speedy, timely and courteous service. Marketing of such service very much depends on thequality, quantity and the cost that satisfies the customer’s wants and needs. Banks must continuously asses theirperformance in this regard and must continuously strive to satisfy the new and emerging customer’s specifications.The improvements in customer service are a necessary concomitant of a progressive growth of the banking industry.This is probably due to the fact that hitherto banks have been operating in seller’s market and public is notarticulated or organized. In olden days Banks have not much cared for the needs of the customers, they were in thesellers’ market. After nationalization of banks, there is acceleration in the growth of business with all extensiverange of services and a wide variety of customers. In order to grow and prosper and even to survive, banks arekeeping abreast of changing customer needs and preferences apart from knowing the strategies of competing banksin the area of product innovation and customer service. In banking industry, customer service is complex in natureand dynamic in action.
2. Customers Orientation BanksBank cannot exist without customers. The bank’s operation is invested to serve customers and not vice versa. Acustomer looks for certain values like product, quality, reliability, superior services, state of the art technology, lowcost, a premium image, etc, while purchasing anything. In service sector like bank, customer service should not onlya critical function, but a way of life also. Banks can be said as being customer oriented if its various organizationalactivities like organizational restructuring, staffing, co- ordination are geared to fulfill customers’ need. So, totalcustomer satisfaction should be the focal point. That alone serves the banks objective of maximization of profit. It isobvious that a bank cannot think of making profit without customers.
131

International Journal of Enterprise and Innovation Management Studies (IJEIMS) Vol. 1 No. 1
2.1 Significance of the StudyIt’s highly essential for banks to collect customer’s feedback on the varied banking services; this would stand useful
in enabling banks take positive steps to maintain a competitive edge in today’s banking industry provide high levelof loan facilities to Small scale industry. Indeed, the bank’s overall efficiency in future will definitely count on theself-evaluation of their performance.
2.2 Statement of the ProblemDifferent national and state level institutions operating in the country for meeting the credit requirements of the SSIssector include Small Industries Development Bank of India, Commercial Banks, Regional Rural Banks, Co-operative Banks (State, Central and Primary), State Financial Corporations/State Industrial Investment Corporations,Indian overseas Bank, State Small Industries Development Corporation, National Bank for Agriculture and RuralDevelopment, statutory bodies (KVIC, COIR Board, Handloom Board and Handicraft Boards), National SmallIndustries Corporations Limited and the like In Salem district there are several financial institutions and commercialbanks which provide all sorts of financial assistance to the SSI units. Of these the State bank of India, a leadinggovernment owned bank is playing a predominant role. Hence the present study, “ Impact Bank Credit to Small-Scale Industries in Salem district– A study with reference to Indian Overseas Bank.”.
2.3 Objectives of the Study To identify the services that is offered by IOB bank to suit the Small Scale Industry in Salem District. To analyses the problems which is encountered by the Small Scale Industry in Banker’s service. To make suggestions for improvements in Industry services. To analyze the extent of the financial assistance given by the Indian Overseas bank of India to the SSI units
in Salem district.
2.4 Methodology of the StudyA descriptive research design was adopted for the study. It accounts for both primary and secondary data. Primarysource of data were collected from Small Scale Respondents through structured interview schedule by way ofpersonal interview in addition to this, personal interactions have been made with the Bank manages, office bearersof IOB Branches in Salem District district to get some first-hand information on Industry service. Secondary datawere collected from books, journals and Websites. Sampling convenient sampling method is used. The researcherhas taken 150 samples from Small Scale Industry Respondents of IOB in Salem District Tamilnadu.
3. Sources of Industry FinanceFinance is an important input for an industry. For a small scale industry the need for finance is very essential due toits limited resources. The sources of finance for small scale industries are of two types-internal and external. Theinternal sources consist of initial capital and profits reinvested. The external sources consist of loans and otherassistance from the institutional and the non-institutional sources. This paper attempts to study the extent of bankfinance made available to small-scale industries at National level, Tamil Nadu level and Salem district. Customersatisfaction is an elusive area especially in service sector since offerings are intangible. In fact, it has been said thatintangibility is the key to determine whether or not an offering is a service or a product. Customer satisfaction is thesum total of the customers’ expression of the service quality.
4. Financial Institutions Services
In spite of the thrust accorded through the administrative machinery of the government and financial assistanceextended by financial institutions and commercial banks, the growth of the SSIs sector has been much below theexpected level. At the end of the Tenth Plan, (March 2007), the small-scale industries produced goods worth Rs.790759 crore against the target of Rs. 880805 crores. They exported goods valued at Rs. 202017 crore against theTenth Plan target of Rs.233079 crores. Though the SSIs sector contributed significantly to the economy of thecountry, it has not emerged as an engine of exponential growth and rapid economic transformation of the semi-urban, rural and backward areas. The liberalization and reform process initiated in India since, 1991 has enlarged theproblem areas of the SSIs sector. While notable advances were made in exports and use of high technologies thegeneral state of many small units continues to be critical. The role of commercial banks in the process of economicdevelopment is well recognized. The year 1969 was a major turning point in Indian financial systems when 14 majorbanks were nationalized. Thereafter there was re-orientation of credit flows, so as to benefit the till then neglected
132

International Journal of Enterprise and Innovation Management Studies (IJEIMS) Vol. 1 No. 1
sectors such as agriculture, smalls Scale industries and small borrowers. The Government has constituted severalcommittees from time to time to improve the credit delivery system of commercial banks and Indian Overseas Banktowards SSIs. Accordingly, at present SSIs have been recognized as a priority sector by commercial banks and theylend liberally to SSIs units.
5. Review of LiteratureGupta (2004), in their book on “Financing of small industry” also pointed out the inadequacy of institutional credit.They concluded that only 5.1% of the borrowers were financed by institutional finance.
Kopardekar (2004), attributes excess capacity remaining unutilized in small firms was due to the lack of adequatefinance. The lack of adequate finance especially in meeting working capital requirement leads to inefficientutilization of the installed capacity, which in turn leads to inconsistent operation of the units. Many units are not in aposition to apportion funds to fix and working capitals.
Moorthy (2005), focused his attention on the financing of the small-scale industries in the particular region ofAndhra Pradesh. His emphasis was on the role of the government agencies, financial institutions and the commercialbanks in augmenting adequate finance for the small-scale sector.
Chaudhary (2007), in his article entitled “Success in Urban Small Entrepreneurship”, pointed out that creation ofpolitical awareness among the present day entrepreneurs was desirable, though not essential. This would help tocarry out their entrepreneurial activity successfully since business and politics had inter-acting relationship.
Natarajan (2006), in his study entitled, “A Study of Utilization of Incentives by Small-Scale Industrial Units inMadurai District”, measured the extent of utilization of incentives by small-scale industrial units in Madurai district.The study also highlighted the factors influencing the utilization and the impact of incentives on the industrial units.
George Verghese (2007), in his paper “Leading Issues in Credit flow to SSIs Sector is Finance for Small Enterprisein India” stated that focus on the limited impact of polices on the SSIs sector in India was mainly due to the isolatedtreatment accorded to the SSIs sector, the SSIs sector needs a renewed thrust enhancing credit flow by drasticallyimproving the problem areas of administration personal, entrepreneurial development and infrastructure indispensation of credit.
Harinath Reddy (2000), Study on Working Capital Management in Small-Scale Industries, indicating impropercontrols on the working capital funding. The preparation of periodical working capital reports at least once a month,better planning to overcome shortages and over trading are some of the steps suggested and above all banks tomonitor working capital utilization to detect early signs of sickness.
5.1 Period of the StudyThe secondary data relating to advances in India and Tamil Nadu were obtained for a period of 2 years from 2007-08 to 2008-2009.
5.2 Limitations of the Study
This study is only restricted to Indian Overseas Bank only. The result of the study may not be applicable to any other banks.
6. Development of Banks before Nationalization
Money deposits in savings account. Grant loan to its customers and Small scale industry under various schemes. Gives credit card systems to its customer.

International Journal of Enterprise and Innovation Management Studies (IJEIMS) Vol. 1 No. 1
Operates its branches in rural and urban areas so as reach all its service to farmers and villagers andBusiness Man.
Its service is also useful for small scale industries.
Development of Banks after Nationalization In India,
Bank services are flexible to all and banks are functioned without the interruption of a particular person. 2.Management of banks area is controlled by well-experienced person and skilled persons.
Its services are helpful to small scale industries development. Banks are helpful for industrial development. It is also useful for new business beginners. Exporters are benefited by its services.
LOAN POLICY FOR MSE SECTOR
Micro and Small Enterprises plays vital role in the economic well being of the country due to their abilityto generate employment, foster entrepreneurship. They provide depth to the industrial and commercial base of theeconomy. They also contribute in significant measure to the GDP and exports from the country. Government ofIndia, is attaching great importance to this sector and taking various policy measures to enhance the flow of credit toMSME sector. To ensure systematic and smooth growth of the MSME sector, the Government of India enacted theMicro, Small and Medium Enterprises Development Act 2006 (MSMED Act 2006) on 16.06.2006, which came intoeffect from 02.10.2006. The act replaced the concept of tiny/small scale industries sector with the expanded Micro,Small and Medium Enterprises Sector which includes Micro, Small and Medium manufacturing as well as serviceenterprises.
MSE Funding PolicyThe problems of the MSE sector are multifarious and credit related issues are diverse, which call for multi-
pronged, integrated, and balanced approach on the part of the bank. Hence it is necessary to have a comprehensiveliberal and forward looking policy on funding of MSE enterprises. RBI advised all Banks to formulate a loan policygoverning the extension of credit to MSE sector in the light of recommendations of the working group and BCSBI ‘scode of commitment to Micro and Small Enterprises.
Type of Credit Facilities to MSE Units Term Loans Project Finance Working Capital Finance Purchase and discounting of Bills Negotiation of Bills Non fund based facilities such as LC and LG Pre shipment/Post shipment finance
Manufacturing EnterprisesThe Micro and Small enterprises engaged in the manufacture or production of goods to any industry specified in thefirst schedule to the Industries (Development and regulation) Act, 1951. The manufacturing enterprises are definedin terms of investment in plant and machinery.
Loans for food and agro processingLoans for food and agro processing will be classified under Micro and Small Enterprises, provided the units satisfyinvestments criteria prescribed for Micro and Small Enterprises, as provided in MSMED Act, 2006.
133

Service Enterprises
International Journal of Enterprise and Innovation Management Studies (IJEIMS) Vol. 1 No. 1
Bank loans upto Rs. 2 Crores per unit to Micro and Small Enterprises engaged in providing or rendering of servicesand defined in terms of investment in equipment under MSMED Act, 2006. Export credit to MSE units (bothmanufacturing and services) for exporting of goods/ services produced by them.
Indirect Finance To MSE Sector Loans to persons involved in assisting the decentralized sector in the supply of inputs to and marketing of
outputs of artisans village and cottage industries. Loans to cooperatives of producers in the decentralised sector viz., artisans village and cottage industries Loans sanctioned by banks to MFIs for on lending to MSE sector as per the conditions specified in
paragraph VIII of this circular
Scope and CoverageThis policy covers credit facilities to micro and small enterprises. (both manufacturing and services sector)
and all related issues such as assessment of credit, margin norms, security requirements, coverage under CreditGuarantee Scheme etc.,
Guidelines on MSE FinanceAdvances to MSE sector will be assessed like any other advance (except for the specific relaxations and
concessions given in this policy) and credit decisions will be taken based on viability, merits and commercialjudgment in each case as per general norms of lending. The credit appraisal will be made in a transparent and non-discriminatory manner. All genuine and just requirements of the MSE units will be considered and adequate amountof credit will be sanctioned to ensure that the unit does not suffer for want of funds at a later date.
Pricing and Credit Rating of MSE AdvancesAs per Risk Management Policy of the Bank, all borrowal accounts with credit limits of Rs.1 crore and above toLarge Corporates, Traders, SME and Infrastructure (Road and Power) must be rated under Risk Assessment Model(RAM) before sanction. Pricing of all loan facilities of Rs.1 crore and above is to be made based on the ratingobtained. A relaxation will be made for MSE borrowal accounts in this regard and MSE accounts for credit facilitiesupto Rs.2 crores need not be rated under RAM. Pricing of MSE credit facility upto Rs. 2 crores will be based oninternal scoring model. Bank will continue to prescribe separate and favourable interest rates for MSE credit in orderto encourage the MSE sector.
Delayed Payments To MSME UnitsAs a measure to assist the MSE units to get the payment from large corporates without delay, suitable sub-limits willbe fixed within the overall working capital limits sanctioned to large borrowers (borrowers enjoying working capitallimits of Rs.10 crores and above from the banking system) specifically for meeting the payment obligations to MSEenterprises (and Medium Enterprises) for goods supplied or services rendered
MSE sector, the bank will adopt the strategies: Branch Managers and other officials handling MSE credit will be imparted training to enable them to
properly understand the nuances of MSE finance and opportunities in the sector. Efforts will be made toinculcate positive mindset amongst the officers towards financing MSE units.
MSE credit processing centres will be set up at key locations to ensure prompt and efficient processing forall MSE credit applications.
Simplified loan application forms in bilingual formats will be made available for loans to MicroEnterprises.
7. ConclusionThe role of service sector plays a vital role in economic development of the country. In rural area, the banks servicesare very important to improve the rural development Small Scale Industry. There is lack of banking habits amongthe rural people. The saving and investment and Lending facilities are considered very important to make a countryeconomically sound. The effective mobilization of saving lives is in the hands of banking sector. Therefore banks
134

must provide necessary services to its customers and and Industry can attract the potential customer also. Hence,banks especially commercial banks like Indian Overseas Bank should provide satisfactory services to its customer.In order to attain balanced development, the role of rural banks is important, the present study’s result is customersof IOB bank satisfied from the services rendered from the banks. The Small Scale Industry expect more servicesform the Indian Overseas bank for Business Growth and Economic Development of the country.
References[1] Laghu Udyog Samachar (2005) Government of India.[2] Singh I, Gupta NS (1997) Financing of Small Industry. Chand S & Co Ltd, New Delhi.[3] Kopardekar, Sharad D (2004) Financing of Working Capital in Small-Scale Industries. S.Chand & Co. Ltd,
New Delhi.[4] Moorthy GK (2005) Financing of Small-Scale Industries in Rayalaseema Region. Ph.D. Thesis submitted
to Sri Venkateshwara University, Thirupathi.[5] Chaudhary KVR (2007) Success in Urban Small Entrepreneurship. Khadi Gramodyog 32: 10-473.[6] Natarajan K (2006) A Study of Utilization of Incentives by Small-Scale Industrial Units. Ph.D. Thesis of
Madurai Kamaraj University, Tamilnadu, India.[7] Verghese GK (2007) Leading Issues in Credit Flow to SSI Sector in Finance for Small Enterprise in India.
ISED Cochin.[8] Reddy H (2000) Working Capital Management in Small-Scale Industries. Thesis Submitted to Sri
Venkateswara University, Thirupathi, AP, India.[9] Khar J (2000) Credit Repayment by Small-Scale industries. Prajnan 18: 33-41.
[10] UmaRani N (2007) Export Potential of SSIs in India: A Study. Southern Economist 46:10-12.[11] Karthihaselvi V, Neelamegam R, Magesan AA (2010) Significance of Small-Scale Industries. Southern
Economist, Tamilnadu, INDIA.[12] Pamphlets from the SBI, Madurai Regional Office, Madurai.[13] Bagchi AK (2003) The Era of Imperial Bank of India. Sage Publication, New Delhi, India.[14] Ibid page No. 17.[15] Bagchi A K Op cit page No. 15.
135
135