international journal of interactive multimedia … · international journal of interactive...
TRANSCRIPT


INTERNATIONAL JOURNAL OF INTERACTIVE MULTIMEDIA AND ARTIFICIAL INTELLIGENCEISSN: 1989-1660
IMAI RESEARCH GROUP COUNCILDirector - Dr. Rubén González Crespo, Universidad Internacional de La Rioja (UNIR), SpainOffice of Publications - Lic. Ainhoa Puente, Universidad Internacional de La Rioja (UNIR), SpainLatin-America Regional Manager - Dr. Carlos Enrique Montenegro Marín, Francisco José de Caldas District University, Colombia
EDITORIAL TEAM
Editor-in-ChiefDr. Rubén González Crespo, Universidad Internacional de La Rioja – UNIR, Spain
Associate EditorsDr. Óscar Sanjuán Martínez, CenturyLink, USADr. Jordán Pascual Espada, ElasticBox, USADr. Juan Pavón Mestras, Complutense University of Madrid, SpainDr. Alvaro Rocha, University of Coimbra, PortugalDr. Jörg Thomaschewski, Hochschule Emden/Leer, Emden, GermanyDr. Carlos Enrique Montenegro Marín, Francisco José de Caldas District University, ColombiaDr. Vijay Bhaskar Semwal, National Institute of Technology, Jamshedpur, IndiaDr. Elena Verdú, Universidad Internacional de La Rioja (UNIR), Spain
Editorial Board MembersDr. Rory McGreal, Athabasca University, CanadaDr. Jesús Soto, SEPES, SpainDr. Nilanjan Dey, Techo India College of Technology, IndiaDr. Abelardo Pardo, University of Sidney, AustraliaDr. Hernán Sasastegui Chigne, UPAO, PerúDr. Lei Shu, Osaka University, JapanDr. Roberto Recio, Cooperative University of Colombia, ColombiaDr. León Welicki, Microsoft, USADr. Enrique Herrera, University of Granada, SpainDr. Francisco Chiclana, De Montfort University, United KingdomDr. Luis Joyanes Aguilar, Pontifical University of Salamanca, SpainDr. Ioannis Konstantinos Argyros, Cameron University, USADr. Juan Manuel Cueva Lovelle, University of Oviedo, SpainDr. Pekka Siirtola, University of Oulu, FinlandDr. Francisco Mochón Morcillo, National Distance Education University, Spain Dr. Peter A. Henning, Karlsruhe University of Applied Sciences, GermanyDr. Manuel Pérez Cota, University of Vigo, SpainDr. Walter Colombo, Hochschule Emden/Leer, Emden, GermanyDr. Javier Bajo Pérez, Polytechnic University of Madrid, SpainDr. Jinlei Jiang, Dept. of Computer Science & Technology, Tsinghua University, ChinaDr. B. Cristina Pelayo G. Bustelo, University of Oviedo, SpainDr. Cristian Iván Pinzón, Technological University of Panama, PanamaDr. José Manuel Sáiz Álvarez, Nebrija University, SpainDr. Masao Mori, Tokyo Institue of Technology, JapanDr. Daniel Burgos,Universidad Internacional de La Rioja - UNIR, SpainDr. JianQiang Li, NEC Labs, ChinaDr. David Quintana, Carlos III University, SpainDr. Ke Ning, CIMRU, NUIG, IrelandDr. Alberto Magreñán, Real Spanish Mathematical Society, SpainDr. Monique Janneck, Lübeck University of Applied Sciences, GermanyDr. Carina González, La Laguna University, SpainDr. David L. La Red Martínez, National University of North East, ArgentinaDr. Juan Francisco de Paz Santana, University of Salamanca, Spain
- II -

- III -
Dr. Héctor Fernández, INRIA, Rennes, FranceDr. Yago Saez, Carlos III University of Madrid, SpainDr. Andrés G. Castillo Sanz, Pontifical University of Salamanca, SpainDr. Pablo Molina, Autonoma University of Madrid, SpainDr. José Miguel Castillo, SOFTCAST Consulting, SpainDr. Sukumar Senthilkumar, University Sains Malaysia, MalaysiaDr. Juan Antonio Morente, University of Granada, SpainDr. Holman Diego Bolivar Barón, Catholic University of Colombia, ColombiaDr. Sara Rodríguez González, University of Salamanca, SpainDr. José Javier Rainer Granados, Universidad Internacional de La Rioja - UNIR, SpainDr. Elpiniki I. Papageorgiou, Technological Educational Institute of Central Greece, GreeceDr. Edward Rolando Nuñez Valdez, Open Software Foundation, SpainDr. Luis de la Fuente Valentín, Universidad Internacional de La Rioja - UNIR, SpainDr. Paulo Novais, University of Minho, PortugalDr. Giovanny Tarazona, Francisco José de Caldas District University, ColombiaDr. Javier Alfonso Cedón, University of León, SpainDr. Sergio Ríos Aguilar, Corporate University of Orange, SpainDr. Mohamed Bahaj, Settat, Faculty of Sciences & Technologies, MoroccoDr. Madalena Riberio, Polytechnic Institute of Castelo Branco, PortugalDr. Edgar Henry Caballero Rúa, Inforfactory SRL, Bolivia
International Journal of Interactive Multimedia and Artificial Intelligence
- IV -
Data are becoming increasingly important in health management. Just think of the advantages that could derive from monitoring the vital signs of any person and their symptoms turning them into an online platform that, upon proper authorization, doctors could access at any time and from any place. This is just an example of the kind of transformation processes that health management is undergoing.
In this improvement of health services triggered by new technologies, Big Data is playing a prominent role. The benefits derived from Big Data [1] are becoming a reality in health fields [2] [3] as diverse as: medical services, synthesis of data from medical histories and clinical analysis, management of health centers, hospital administration, distribution of material (especially relevant to specific epidemic needs), detection and prevention of possible side effects of drugs and treatments, scientific documentation (generation, storage and exploitation), medical research, fight against cancer or Pandemic prevention.
Big Data allows integrating structured and unstructured data effectively. Where Big Data can bring more value is in the analysis of unstructured data, in which there is more knowledge to be discovered and exploited. In addition to all this, there is data coming from social networks and those generated by the Internet of things; devices, sensors, medical instruments, fitness equipment, ...
But the important thing is not to have a lot of data, but the fact that Big Data tools contribute to the design and implementation of efficient processes that help us carry out health care policies based not only on the available data, but also on their interpretation and understanding. This is how it can effectively contribute to improving health care, saving lives, expanding access to health systems and optimizing costs. In this regard, the important role played by Big Data in genomic research and genome sequencing should be mentioned.
Looking to the future the challenge is how to efficiently manage the growing amount of data that is being generated. Medicine and health are undergoing profound changes. Technological innovation combined with automation and miniaturization has triggered an explosion in data production, which represents an important potential for improvement in health. At the same time, we face a wide range of challenges [4]. Exploitation of available data through progress in genomic medicine, imaging, and a wide range of mobile health applications or connected devices is hampered by numerous historical, technical, legal and political barriers. The lack of harmonization of data formats, processing, analysis and data transfer is a source of incompatibilities and loss of opportunities that society should not afford.
This special issue is designed with the primary objective of showing what we have just pointed out: the diversity of fields where big data is used and consequently, how it is increasingly gaining importance as a tool for analysis and research in the field of healing. In this sense there are papers related to the following topics: re-using electronic health records with artificial intelligence, big data analytics solution for intelligent healthcare management, development of a predictive model for successful induction of labour, big data and the efficient management of outpatient visits, development of injury prevention policies following a big data approach, generating big data sets from knowledge-based decision support systems to pursue value-based healthcare, the use of administrative records of health information both for diagnoses and patients, and an analysis of the European public health system model and the corresponding healthcare and management-related information systems, the challenges that these health systems are currently facing, and the possible contributions of big data solutions to this field.
The paper issued by Ignacio Hernández Medrano, Jorge Tello Guijarro, Cristóbal Belda, Alberto Ureña, Ignacio Salcedo, Horacio Saggion and Luis Espinosa Anke, “Savana: re-using Electronic Health Records with Artificial Intelligence” focused on the fact that health information grows exponentially [5], thus generating more knowledge than we can apply [6]. Unlike what happened in the past, today doctors no longer have time to keep updated. This fact explains well the reason why only one in five medical decisions are strictly based on evidence, a fact that leads to variability. A possible solution can be found on clinical decision support systems [7], based on big data analysis. As the processing of large amounts of information gains relevance, big data analytics can see and correlate further than the human mind can. This is where healthcare professionals count on a new tool to deal with growing information. Savana uses natural language processing and neural networks to expand medical terminologies, allowing the re-use of natural language directly from clinical reports. This automated and precise digital extraction allows the generation of a real time information engine, to be applied to care, research and management.
“DataCare: Big Data Analytics Solution for Intelligent Healthcare Management” is the research carried out by Alejandro Baldominos, Fernando De Rada, and Yago Saez.
This paper presents DataCare, a solution for intelligent healthcare management. This tool is able not only to retrieve and aggregate data from different key performance indicators in healthcare centers [8][9], but also to estimate future values for these key performance indicators and, as a result, fire early alerts when undesirable values are about to occur or provide recommendations to improve the quality of service.
The architecture built up in this research ensures high scalability which enables processing very high data volumes coming at fast speed from a large set of sources.
This article describes the architecture designed for this project and the results obtained after conducting a pilot in a healthcare center. Useful conclusions have been drawn regarding to how key performance indicators change based on different situations, and how they affect patients’ satisfaction [10].
The paper of Cristina Pruenza, María Teulón, Luis Lechuga, Julia Díaz and Ana González “Development of a predictive model for induction success of labour” focused on a relevant issue for obstetricians; that is the induction procedure. Obstetricians face the need to end a pregnancy, usually for medical reasons or less frequently, for social reasons. The success of the induction procedure is conditioned by a multitude of maternal and fetal variables that appear before or during pregnancy or birth process, with a low predictive value. The failure of the induction process involves performing a caesarean section. This project arises from the clinical need to resolve a situation of uncertainty that frequently occurs in our clinical practice. Since the weight of clinical variables is not adequately evaluated. We find it very interesting to know a priori the possibility of success of induction in order to dismiss those inductions with high probability of failure, avoiding unnecessary procedures or postponing end if possible. We developed a predictive model of induced labour success [11] as a support tool in clinical decision making. Improving the predictability of a successful induction is one of the current challenges of obstetrics because of its negative impact. Identifying those patients with high chances of failure will allow us to offer them a better care, thus improving their health outcomes and patient perceived quality. Therefore a Clinical Decision Support System [12] was developed to give support to Obstetricians.
Editor’s Note
DOI: 10.9781/ijimai.2017.03.000
In Press Special Issue on Big Data and e-Health
- V -
In this article, we proposed a robust method to explore and model a source of clinical information with the purpose of obtaining all possible knowledge. Generally, in classification models it is difficult to find out the contribution that each attribute provides the model with. We worked in this direction to offer transparency to models that may be considered as black boxes. The positive results obtained from both the information recovery system and the predictions and explanations of the classification show the effectiveness and strength of this tool.
“Machine-Learning-Based no show prediction in outpatient visits” is the title of the paper written by C.Elvira, J.C.Gonzálvez, A. Martinez and F. Mochón. A problem in the area of health demand is the high percentage of patients who do not attend their appointments, whether it is a consultation or a test at hospital. In this sense, the present study aims at trying to identify if there is a pattern of behaviour that allows predicting when patients will not keep an appointment [13] for consultation or test. This article involves a study consisting in using big data analysis techniques to try to take measures to improve the consequences of patients not attending to appointments. A predictive model is constructed which uses the information related to medical appointments of patients and the information referring to the patient’s history of appointments. In view of the results, it can be stated that the information collected in the data set does not seem sufficient, neither in terms of patient description nor in terms of appointment characteristics, so as to construct a solid predictive model. The improvement of the classifier capacities presented in this work seems to require expanding and debugging the available information, both for patients and appointments.
The paper by Rosa María Cantón Croda and Damián Emilio Gibaja Romero, “Development of Injuries Prevention Policies in Mexico: A Big Data Approach” analyses the agents that can cause injuries in Mexico. Mexican injuries prevention strategies have been focused on injuries caused by car accidents and gender violence. This paper presents a whole analysis of the injuries registered in Mexico in order to have a wider overview of those agents that can cause injuries around the country. Taking into account the amount of information from both public and private sources, obtained from dynamic cubes reported by the Minister of Health, big data strategies are used with the objective of finding an appropriate extraction such as identifying the real correlations between the different variables registered by the Health Sector [14]. The results of the analysis show areas of opportunity to improve the public policies on the subject, particularly in diminishing wounds at living place, public road (pedestrians) and work.
“Generating big data sets from knowledge-based decision support systems to pursue value-based healthcare” is the research carried out by Arturo González-Ferrer, Germán Seara, Joan Cháfer and Julio Mayol. When talking about big data in healthcare we usually refer to how to use data collected from current electronic medical records, either structured or unstructured, so as to answer clinically relevant questions. This operation is typically carried out by means of analytic tools or by extracting relevant data from patient summaries through natural language processing techniques. From another perspective of research in medical computing, powerful initiatives have emerged to help physicians make decisions, in both diagnosis and therapeutics, built upon the existing medical evidence [15] (i.e. knowledge-based decision support systems). Much of the problems these tools have shown, when used in real clinical settings, are related to their implementation and deployment, more than failing to support, but technology is slowly overcoming interoperability and integration issues. Beyond the point-of-care decision support these tools can provide, the data generated when using them, even in controlled trials, could be used to further analyze facts that are traditionally ignored in the current clinical practice. In this paper, the authors reflect on the technologies available to make the leap and how they could help
driving healthcare organizations to a shift into a value-based healthcare philosophy [16].
The paper by Diego J. Bodas-Sagi and José M. Labeaga, “ Big Data and Health Economics: Opportunities, Challenges and Risks” summarize the possibilities of big data to offer useful information to policy makers [17]. In a world with tight public budgets and ageing populations we find it necessary to save costs [18] in any production process. The use of outcomes from big data could be in the future a way to improve decisions [19] at a lower cost than today. In addition, to list the advantages of properly using data and big data technologies, we also show some challenges and risks that analysts could face. In addition we present a hypothetical example of the use of administrative records with health information both for diagnoses and patients.
The last paper of this special issue is “Big Data and public health systems: issues and opportunities”, written by David Rojas de la Escalera and Javier Carnicero Giménez de Azcárate. Over the last years, the need for changing the current model of European public health systems has been repeatedly addressed, in order to ensure their sustainability. Following this line, IT has always been referred to as one of the key instruments for enhancing the information management processes of healthcare organizations, thus contributing to the improvement and evolution of health systems.
More specifically, big data solutions are expected to play a main role, since they are designed for handling huge amounts of information in a fast and efficient way, allowing users to make important decisions quickly. This article reviews the main features of the European public health system model and the corresponding healthcare and management-related information systems, the challenges that these health systems are currently facing and the possible contributions of big data solutions to this field [20]. To that end, the authors share their professional experience on the Spanish public health system and review the existing literature related to this topic.
F. Mochón and C. Elvira
RefeRences
[1] Groves, P., Kayyali, B., Knott, D., & Kuiken, S. V. (2016). The’big data’revolution in healthcare: Accelerating value and innovation.
[2] Roesems-Kerremans G. (2016). Big Data in Healthcare. J Healthc Commun., 1:4.
[3] Mayer-Schönberger, V., & Cukier, K. (2013). Big data: A revolution that will transform how we live, work, and think. Houghton Mifflin Harcourt.
[4] Street, R. L., Gold, W. R., & Manning, T. R. (2013). Health promotion and interactive technology: Theoretical applications and future directions. Routledge.
[5] Poon, E. G., Jha, A. K., Christino, M., Honour, M. M., Fernandopulle, R., Middleton, B., ... & Kaushal, R. (2006). Assessing the level of healthcare information technology adoption in the United States: a snapshot. BMC Medical Informatics and Decision Making, 6(1), 1.
[6] Kontos, E., Blake, K. D., Chou, W. Y. S., & Prestin, A. (2014). Predictors of eHealth usage: insights on the digital divide from the Health Information National Trends Survey 2012. Journal of medical Internet research, 16(7), e172.
[7] Whitney, S. N. (2003). A new model of medical decisions: exploring the limits of shared decision making. Medical Decision Making, 23(4), 275-280.
[8] Curtright, J. W., Stolp-Smith, S. C., & Edell, E. S. (2000). Strategic performance management: development of a performance measurement system at the Mayo Clinic. Journal of Healthcare Management, 45(1), 58-68.
[9] Lacy, J. S., Fielding, D. R., Sinclair III, E. L., Schremser, C. L., & Cress, J. A. (2014). U.S. Patent Application No. 14/263,940.
[10] Stock, G. N., & McFadden, K. L. (2017). Improving service operations: linking safety culture to hospital performance. Journal of Service Management, 28(1), 57-84.
International Journal of Interactive Multimedia and Artificial Intelligence
- VI -
[11] Bajpai, N., Bhakta, R., Kumar, P., Rai, L., & Hebbar, S. (2015). Manipal cervical scoring system by transvaginal ultrasound in predicting successful labour induction. Journal of clinical and diagnostic research: JCDR, 9(5), QC04.
[12] Berner, E. S., & La Lande, T. J. (2016). Overview of clinical decision support systems. In Clinical decision support systems (pp. 1-17). Springer International Publishing.
[13] Norris, J. B., Kumar, C., Chand, S., Moskowitz, H., Shade, S. A., & Willis, D. R. (2014). An empirical investigation into factors affecting patient cancellations and no-shows at outpatient clinics. Decision Support Systems, 57, 428-443.
[14] Wilkinson, R. G., & Marmot, M. (2003). Social determinants of health: the solid facts. World Health Organization.
[15] Eisenberg, J. M. (1986). Doctors’ decisions and the cost of medical care: the reasons for doctors’ practice patterns and ways to change them.
[16] Edwards, A., & Elwyn, G. (2009). Shared decision-making in health care: Achieving evidence-based patient choice. Oxford University Press.
[17] Roski, J., Bo-Linn, G. W., & Andrews, T. A. (2014). Creating value in health care through big data: opportunities and policy implications. Health Affairs, 33(7), 1115-1122.
[18] Bates, D. W., Saria, S., Ohno-Machado, L., Shah, A., & Escobar, G. (2014). Big data in health care: using analytics to identify and manage high-risk and high-cost patients. Health Affairs, 33(7), 1123-1131.
[19] Raghupathi, W., & Raghupathi, V. (2014). Big data analytics in healthcare: promise and potential. Health Information Science and Systems, 2(1), 3.
[20] Salathé, M. (2016). Digital Pharmacovigilance and Disease Surveillance: Combining Traditional and Big-Data Systems for Better Public Health. Journal of Infectious Diseases, 214 (suppl 4), S399-S403.

OPEN ACCESS JOURNAL
ISSN: 1989-1660
COPYRIGHT NOTICE
Copyright © 2017 UNIR. This work is licensed under a Creative Commons Attribution 3.0 unported License. Permissions to make digital or hard copies of part or all of this work, share, link, distribute, remix, tweak, and build upon ImaI research works, as long as users or entities credit ImaI authors for the original creation. Request permission for any other issue from [email protected]. All code published by ImaI Journal, ImaI-OpenLab and ImaI-Moodle platform is licensed according to the General Public License (GPL).
http://creativecommons.org/licenses/by/3.0/
TABLE OF CONTENTS
EDITOR’S NOTE ��������������������������������������������������������������������������������������������������������������������������������������������������������������� IV
SAVANA: RE-USING ELECTRONIC HEALTH RECORDS WITH ARTIFICIAL INTELLIGENCE �������������������������������������������������8
DATACARE: BIG DATA ANALYTICS SOLUTION FOR INTELLIGENT HEALTHCARE MANAGEMENT ����������������������������������13
DEVELOPMENT OF A PREDICTIVE MODEL FOR INDUCTION SUCCESS OF LABOUR ����������������������������������������������������21
MACHINE-LEARNING-BASED NO SHOW PREDICTION IN OUTPATIENT VISITS �������������������������������������������������������������29
DEVELOPMENT OF INJURIES PREVENTION POLICIES IN MEXICO: A BIG DATA APPROACH�����������������������������������������35
GENERATING BIG DATA SETS FROM KNOWLEDGE-BASED DECISION SUPPORT SYSTEMS TO PURSUE VALUE-BASED HEALTHCARE �������������������������������������������������������������������������������������������������������������������������������������������������������������������������������� 42
BIG DATA AND HEALTH ECONOMICS: OPPORTUNITIES, CHALLENGES AND RISKS ������������������������������������������������������47
BIG DATA AND PUBLIC HEALTH SYSTEMS: ISSUES AND OPPORTUNITIES ��������������������������������������������������������������������53
International Journal of Interactive Multimedia and Artificial Intelligence
DOI: 10.9781/ijimai.2017.03.001
Abstract — Health information grows exponentially (doubling
every 5 years), thus generating a sort of inflation of science, i.e.
the generation of more knowledge than we can leverage. In an
unprecedented data-driven shift, today doctors have no longer
time to keep updated. This fact explains why only one in every five
medical decisions is based strictly on evidence, which inevitably
leads to variability. A good solution lies on clinical decision
support systems, based on big data analysis. As the processing
of large amounts of information gains relevance, automatic
approaches become increasingly capable to see and correlate
information further and better than the human mind can. In this
context, healthcare professionals are increasingly counting on
a new set of tools in order to deal with the growing information
that becomes available to them on a daily basis. By allowing the
grouping of collective knowledge and prioritizing “mindlines”
against “guidelines”, these support systems are among the most
promising applications of big data in health. In this demo paper
we introduce Savana, an AI-enabled system based on Natural
Language Processing (NLP) and Neural Networks, capable of, for
instance, the automatic expansion of medical terminologies, thus
enabling the re-use of information expressed in natural language
in clinical reports. This automatized and precise digital extraction
allows the generation of a real time information engine, which
is currently being deployed in healthcare institutions, as well as
clinical research and management.
Keywords — Natural Language Processing, Artificial Intelligence,
E-Health, Machine Learning, Electronic Health Records.
I. IntRoductIon
the information that physicians write in Electronic Health Records (EHRs) during their daily practice generates vast amounts of
valuable information. Doctors’ notes illustrate the real and practical approach in which they address casuistry at ground level, where factors associated to their work environment and to uncertainty conditions come into play [1]. However, only a minor portion of all this information is leveraged today, namely that which “sees the light” in the form of scientific literature or other venues where experts share information (articles, reviews, meta-analyses, opinion pieces, conference submissions, and specialized webs in the medical domain) [2]. A fundamental bottleneck preventing large-scale automatic reuse of this information is that it is mostly encoded in natural language, i.e. free text written by medical practitioners in EHRs [3]. The traditional approach for knowledge extraction was, until very recently, to pre-structure certain EHR systems so that only certain type of information is allowed in certain fields. However, today there is an increasing line
of thought discouraging this practice, as the complexity of clinical reality cannot be modeled simply by means of splitting information in EHRs via drop-down menus.
As such, it is widely agreed that comprehensive reuse of information generated daily in every point of care of the Health System is of utmost importance. While individual actions do not generate added value due to lack of statistical significance, all the accumulated information provided by specialists in a medical area is an unequivocal and highly valuable reference for any practitioner. Especially considering that part of their actions is supported by the usage of Evidence Based Medicine [4]. Thus, in the daily reality of a medical professional, it is regular practice that physicians ask others, according to their subarea of expertise, confident that their decisions are generally supported by existing scientific knowledge [5].
Moreover, Spain is one of the world’s leading countries in terms of impact of EHRs, which results in a very high availability of informattion. Every 10 minutes, tens of thousands of EHRs are written in Spanish medical institutions, which results in a total of billions, if we consider how long have medical practitioners been writing down their notes in electronic form. An additional factor is the need for real-time accurate information, which is explained by the fact that knowledge (and particularly, medical knowledge) grows exponentially. IBM currently estimates that in 2020 there will be 200 times more medical information than what a single individual would be able to absorb in all his or her life [6]. Additionally, we do know that, today, doctors have on average one doubt every two patients they see [7].
Past attempts to apply Artificial Intelligence (AI) to medical decision support systems have traditionally encountered a strong limitation in the complexity of human language [8]. Today, the state of the art of Natural Language Processing, along with the availability of the computational power needed to perform large scale text understanding, results in a mature field for performing cutting-edge exploitation of text data in domain-specific scenarios. A viable system, however, must simplify its routines as much as possible, and leverage the statistical exploitation of semantic concepts (and not simply words) by combining NLP [9] and data aggregation techniques.
Savana’s starting point, in 2013, was motivated by the goal to maximize the huge amount of information contained in EHRs, which up to today had only been used to follow individual patients’ progress. Likewise, other associated issues such as defining a correct medical usage for such information, surmounting legal requirements (data protection, for example), or technical considerations, had to be accounted for.
In this context, Savana is born as a platform for clinical decision support, based on real-time dynamic exploitation of all the information contained in EHRs corpora. Savana performs immediate statistical
Savana: Re-using Electronic Health Records with Artificial Intelligence
Ignacio Hernández Medrano1, Jorge Tello Guijarro1, Cristóbal Belda2, Alberto Ureña1, Ignacio Salcedo1, Luis Espinosa-Anke1,3, Horacio Saggion3
1Savana 2HM Hospitales
3TALN DTIC, Universitat Pompeu Fabra, Barcelona (Spain)
In Press Special Issue on Big Data and e-Health
- 9 -
analysis of all patients seen in the platform (which can be queried either searching all the available EHRs, or those belonging only to a single hospital, depending on the institution’s interests), and offers results relevant to input variables provided by the user.
II. Methodology
In order to take advantage of the information contained in EHRs, it is necessary to combine computational skills with NLP (a research area which specializes in processing and understanding text written in natural language). EHRs are a paramount example of unstructured information sources: they are incomplete, contain lexical and semantic ambiguities, acronyms, named entities (e.g. commercial names of pharmacological products), and are frequently not properly structured in sections. In addition to these challenges, there are other issues related to the digital exploitation of medical data, among which we find the following:• There is currently very high sensitivity towards how EHRs are
used. While the Organic Law of Protection of Personal Data1 states that an anonymized clinical record loses its condition of personal data, several stakeholders are of the opinion that despite not possessing them, it should potentially be possible to maliciously locate specific individuals by performing an inverse association from records to patients.
• A system of such characteristics must by definition exist in the cloud, as it requires constant and on-line training.
• Different EHR systems are incompatible, and hence interoperability is seriously hindered, and data sparsity becomes an additional issue to deal with.
For the above reasons, in Savana we decided to address the technical design with the following priorities.• The source should not matter, as long as there is access to written
text. Savana had to detach itself from formatting issues, and be capable to encode any input in text format as its own ‘language’.
• It was essential to ensure that individual (single patient) information was irrelevant. In fact, we purposely randomly tamper each record, so that if a third party with malign purposes would breach into this information, it would never know which of it was accurate, and which was not (not even the team in Savana should know).
• However, information should be correct at aggregation time. Statistical approaches would be expected to automatically and reliably clean any false information the very moment in which a doctor, a manager or a researcher asked a question or performed a query.
• Records would not leave the hospital or the institution’s data center. They would be processed there in situ, and the cloud would only contain clinical concepts codified according to a predefined custom terminology.
In addition to the above concerns, we faced the challenge posed by current medical terminologies, which are not designed for the reuse of EHRs, and thus constitute a starting point, but not a long term solution. Thus, in Savana we created our own terminology, a process which, for obvious reasons, had to be done automatically. The techniques followed for automatic terminological expansion were designed in-house, and are the content of a recently published paper authored by the authors signing this article [11].
In sum, by combining Big Data with AI approaches, we designed a robot that “didn’t read well, but excelled at summarization’’, which surmounted existing shortcomings and allowed us to advance with real use cases, where the goal was to reuse information linked to clinical
1 https://www.boe.es/buscar/act.php?id=BOE-A-1999-23750
experience, which had been traditionally limited. The usual approach had always been to implement systems that encoded information on the physician’s side (structured systems for inputting information, by means of e.g. dropdown menus). These approaches did not have much success due to, among others, the fact that clinical experience is very complex, and the time available to practitioners to document it, very limited.
In order to tackle these and other technological challenges, we take advantage of current technologies such as, but not limited to:• Supervised Machine Learning. We have designed and registered
algorithms for the different stages of processing, so that, for instance, our system is able to determine that a given paragraph belongs to the ‘Background’ section, and not ‘Diagnosis’, due to certain morphologic cues (appearance of adverbs, for instance). Note that, while a traditional approach to such problem could be the development of an expert or rule-based system, in this case the output of the system is based on a statistical model which optimizes a function defined at training time.
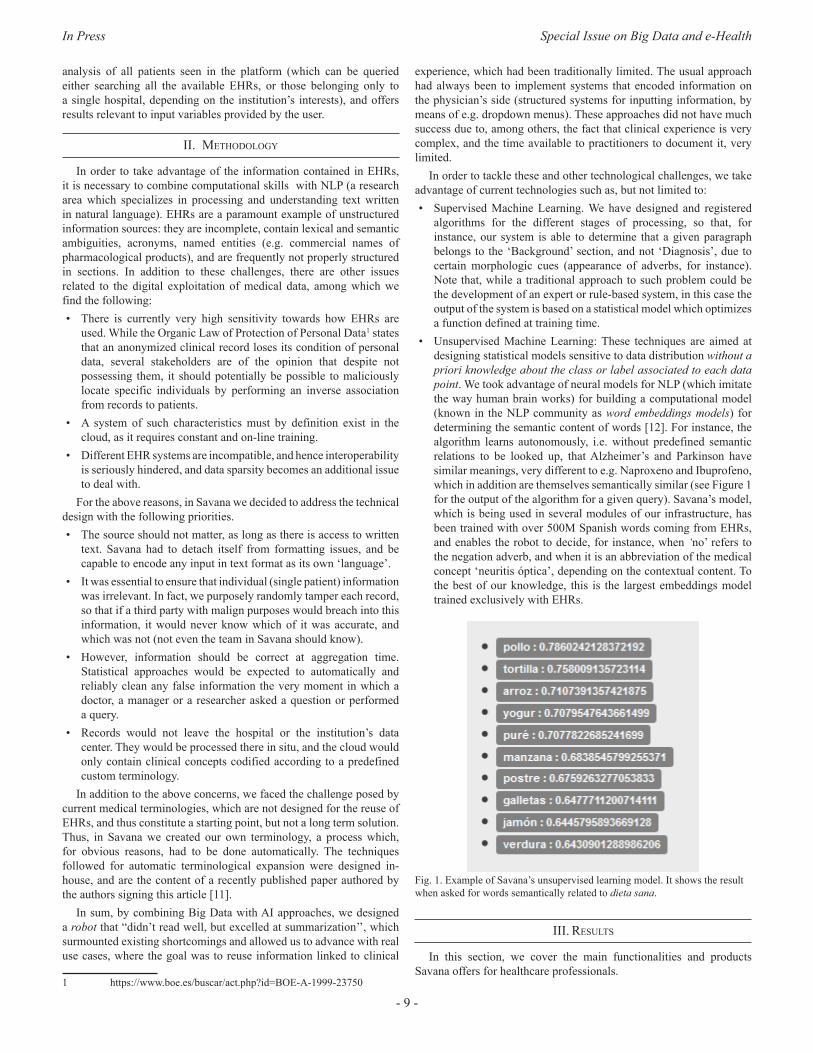
• Unsupervised Machine Learning: These techniques are aimed at designing statistical models sensitive to data distribution without a priori knowledge about the class or label associated to each data point. We took advantage of neural models for NLP (which imitate the way human brain works) for building a computational model (known in the NLP community as word embeddings models) for determining the semantic content of words [12]. For instance, the algorithm learns autonomously, i.e. without predefined semantic relations to be looked up, that Alzheimer’s and Parkinson have similar meanings, very different to e.g. Naproxeno and Ibuprofeno, which in addition are themselves semantically similar (see Figure 1 for the output of the algorithm for a given query). Savana’s model, which is being used in several modules of our infrastructure, has been trained with over 500M Spanish words coming from EHRs, and enables the robot to decide, for instance, when ‘no’ refers to the negation adverb, and when it is an abbreviation of the medical concept ‘neuritis óptica’, depending on the contextual content. To the best of our knowledge, this is the largest embeddings model trained exclusively with EHRs.
Fig. 1. Example of Savana’s unsupervised learning model. It shows the result when asked for words semantically related to dieta sana.
III. Results
In this section, we cover the main functionalities and products Savana offers for healthcare professionals.
International Journal of Interactive Multimedia and Artificial Intelligence
- 10 -
A. FunctionalitiesSavana’s technology can be leveraged in different use cases.
Today, there are three available applications already implemented and with real-world users, as well as three additional systems in development.
Once the service is deployed in an institution, usage tracking is incorporated, so that additional functionalities can be adapted, which allows Savana to develop improvements and new related services, depending on the actual use of the tool. This makes it possible to adapt the product to the users’ requirements (for instance, if its usage is more interesting in certain areas or clinical situations).
In what follows, we describe currently available applications, and their usage.
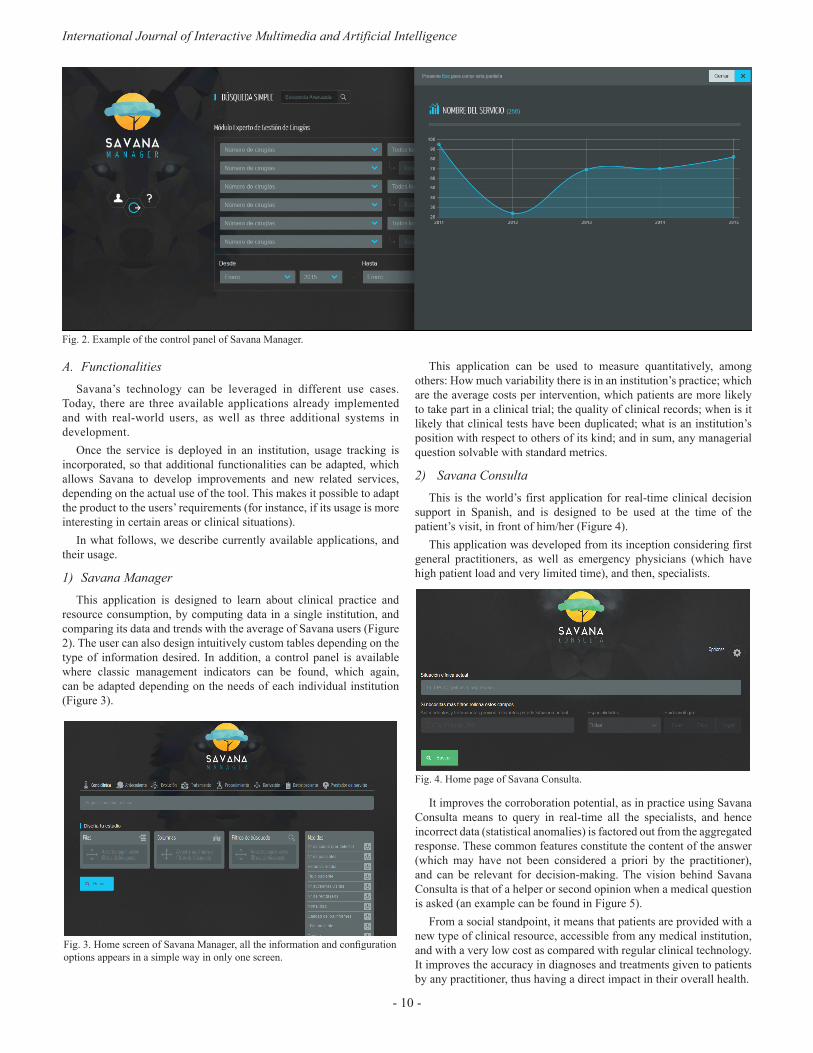
1) Savana ManagerThis application is designed to learn about clinical practice and
resource consumption, by computing data in a single institution, and comparing its data and trends with the average of Savana users (Figure 2). The user can also design intuitively custom tables depending on the type of information desired. In addition, a control panel is available where classic management indicators can be found, which again, can be adapted depending on the needs of each individual institution (Figure 3).
Fig. 3. Home screen of Savana Manager, all the information and configuration options appears in a simple way in only one screen.
This application can be used to measure quantitatively, among others: How much variability there is in an institution’s practice; which are the average costs per intervention, which patients are more likely to take part in a clinical trial; the quality of clinical records; when is it likely that clinical tests have been duplicated; what is an institution’s position with respect to others of its kind; and in sum, any managerial question solvable with standard metrics.
2) Savana ConsultaThis is the world’s first application for real-time clinical decision
support in Spanish, and is designed to be used at the time of the patient’s visit, in front of him/her (Figure 4).
This application was developed from its inception considering first general practitioners, as well as emergency physicians (which have high patient load and very limited time), and then, specialists.
Fig. 4. Home page of Savana Consulta.
It improves the corroboration potential, as in practice using Savana Consulta means to query in real-time all the specialists, and hence incorrect data (statistical anomalies) is factored out from the aggregated response. These common features constitute the content of the answer (which may have not been considered a priori by the practitioner), and can be relevant for decision-making. The vision behind Savana Consulta is that of a helper or second opinion when a medical question is asked (an example can be found in Figure 5).
From a social standpoint, it means that patients are provided with a new type of clinical resource, accessible from any medical institution, and with a very low cost as compared with regular clinical technology. It improves the accuracy in diagnoses and treatments given to patients by any practitioner, thus having a direct impact in their overall health.
Fig. 2. Example of the control panel of Savana Manager.
In Press Special Issue on Big Data and e-Health
- 11 -
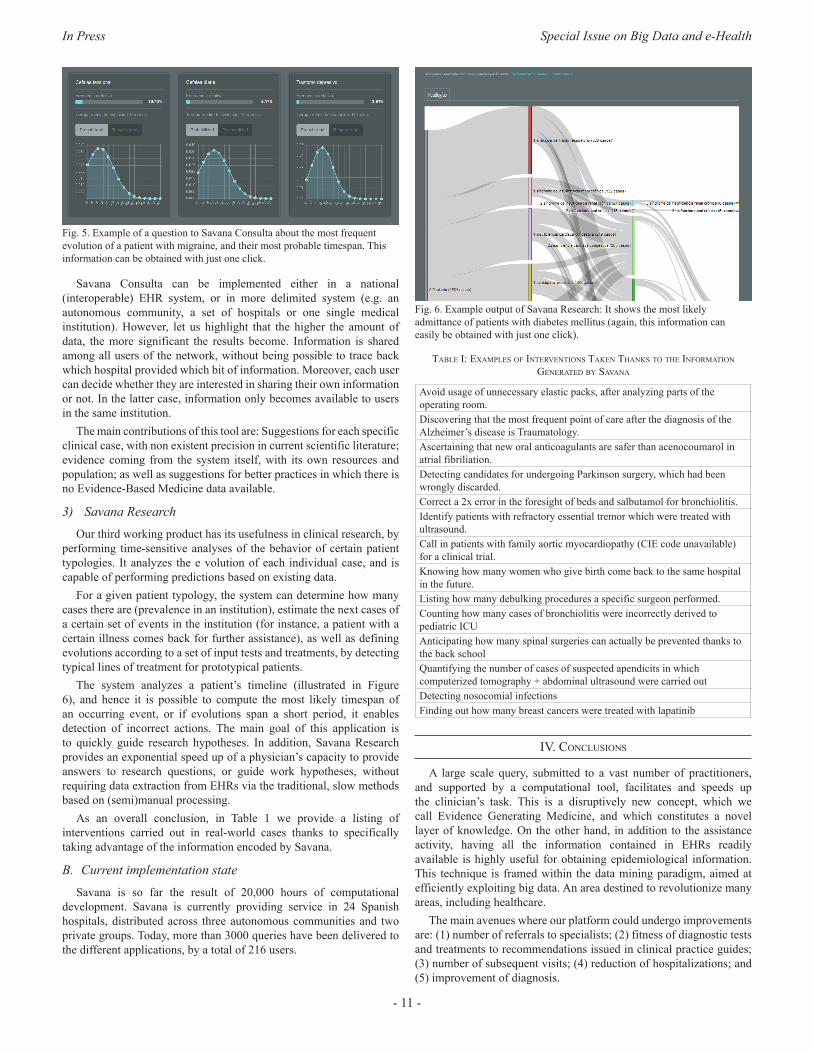
Fig. 5. Example of a question to Savana Consulta about the most frequent evolution of a patient with migraine, and their most probable timespan. This information can be obtained with just one click.
Savana Consulta can be implemented either in a national (interoperable) EHR system, or in more delimited system (e.g. an autonomous community, a set of hospitals or one single medical institution). However, let us highlight that the higher the amount of data, the more significant the results become. Information is shared among all users of the network, without being possible to trace back which hospital provided which bit of information. Moreover, each user can decide whether they are interested in sharing their own information or not. In the latter case, information only becomes available to users in the same institution.
The main contributions of this tool are: Suggestions for each specific clinical case, with non existent precision in current scientific literature; evidence coming from the system itself, with its own resources and population; as well as suggestions for better practices in which there is no Evidence-Based Medicine data available.
3) Savana ResearchOur third working product has its usefulness in clinical research, by
performing time-sensitive analyses of the behavior of certain patient typologies. It analyzes the e volution of each individual case, and is capable of performing predictions based on existing data.
For a given patient typology, the system can determine how many cases there are (prevalence in an institution), estimate the next cases of a certain set of events in the institution (for instance, a patient with a certain illness comes back for further assistance), as well as defining evolutions according to a set of input tests and treatments, by detecting typical lines of treatment for prototypical patients.
The system analyzes a patient’s timeline (illustrated in Figure 6), and hence it is possible to compute the most likely timespan of an occurring event, or if evolutions span a short period, it enables detection of incorrect actions. The main goal of this application is to quickly guide research hypotheses. In addition, Savana Research provides an exponential speed up of a physician’s capacity to provide answers to research questions, or guide work hypotheses, without requiring data extraction from EHRs via the traditional, slow methods based on (semi)manual processing.
As an overall conclusion, in Table 1 we provide a listing of interventions carried out in real-world cases thanks to specifically taking advantage of the information encoded by Savana.
B. Current implementation stateSavana is so far the result of 20,000 hours of computational
development. Savana is currently providing service in 24 Spanish hospitals, distributed across three autonomous communities and two private groups. Today, more than 3000 queries have been delivered to the different applications, by a total of 216 users.
Fig. 6. Example output of Savana Research: It shows the most likely admittance of patients with diabetes mellitus (again, this information can easily be obtained with just one click).
table I: exaMples of InteRventIons taken thanks to the InfoRMatIon geneRated by savana
Avoid usage of unnecessary elastic packs, after analyzing parts of the operating room.Discovering that the most frequent point of care after the diagnosis of the Alzheimer’s disease is Traumatology.Ascertaining that new oral anticoagulants are safer than acenocoumarol in atrial fibriliation.Detecting candidates for undergoing Parkinson surgery, which had been wrongly discarded.Correct a 2x error in the foresight of beds and salbutamol for bronchiolitis.Identify patients with refractory essential tremor which were treated with ultrasound.Call in patients with family aortic myocardiopathy (CIE code unavailable) for a clinical trial.Knowing how many women who give birth come back to the same hospital in the future.Listing how many debulking procedures a specific surgeon performed.Counting how many cases of bronchiolitis were incorrectly derived to pediatric ICUAnticipating how many spinal surgeries can actually be prevented thanks to the back schoolQuantifying the number of cases of suspected apendicits in which computerized tomography + abdominal ultrasound were carried outDetecting nosocomial infectionsFinding out how many breast cancers were treated with lapatinib
Iv. conclusIons
A large scale query, submitted to a vast number of practitioners, and supported by a computational tool, facilitates and speeds up the clinician’s task. This is a disruptively new concept, which we call Evidence Generating Medicine, and which constitutes a novel layer of knowledge. On the other hand, in addition to the assistance activity, having all the information contained in EHRs readily available is highly useful for obtaining epidemiological information. This technique is framed within the data mining paradigm, aimed at efficiently exploiting big data. An area destined to revolutionize many areas, including healthcare.
The main avenues where our platform could undergo improvements are: (1) number of referrals to specialists; (2) fitness of diagnostic tests and treatments to recommendations issued in clinical practice guides; (3) number of subsequent visits; (4) reduction of hospitalizations; and (5) improvement of diagnosis.
International Journal of Interactive Multimedia and Artificial Intelligence
- 12 -
In the case of Savana Consulta, this application allows patients without access to the best specialists to benefit from their collective knowledge. With the data we have today, the picture at 10 years sight is that we would be leveraging input from hundreds of millions of specialists, always depending on the number of patients under consideration. With Savana Research, we make the research process grow up to 15 times, enabling doctors to focus on interpreting information, rather than extracting it.
The Savana project has an almost universal potential impact, as it can be used in any healthcare point. It is known that technologies related to Internet access and EHR are exponential, and therefore they will become globally available in a few years to the majority of the population.
RefeRences
[1] Dawes M and Sampson U. Knowledge management in clinical practice: a systematic review of information seeking behavior in physicians International journal of medical informatics. 2003; 71(1), 9-15.
[2] Bravo R. La gestión del conocimiento en medicina: a la búsqueda de la información perdida. Anales del Sistema Sanitario de Navarra (Vol. 25, No. 3, pp. 255-272).
[3] Gonzalez-Gonzalez AI, Escortell Mayor E, Hernandez Fernandez T, Sanchez Mateos JF, Sanz Cuesta T and Riesgo Fuertes R. Necesidades de información de los médicos de atención primaria: análisis de preguntas y su resolución. Atención Primaria. 2005;35(8): 419-22.
[4] Lopez-Torres Hidalgo J. Hábitos de lectura de revistas científicas en los médicos de Atención Primaria. Atención Primaria. 2011;43(12): 636-37.
[5] Brassey J, Elwyn G, Price C and Kinnersley P. Just in time information for clinicians: a questionnaire evaluation of the ATTRACT project. Bmj. 2001;322: 529–30.
[6] Ferrucci D, Levas A, Bagchi S, Gondek D and Mueller ET. Watson: Beyond Jeopardy! Artificial Intelligence. 2013;93(105): 199–200.
[7] Louro Gonzalez A, Fernandez Obanza E, Fernandez López E, Vazquez Millan P, Villegas González L and Casariego Vales E. Análisis de las dudas de los médicos de atención primaria. Atención Primaria. 41(11), 592-597.
[8] Weiskopf NG, Hripcsak G, Swaminathan S and Weng C. Defining and measuring completeness of electronic health records for secondary use. Journal of Biomedical Informatics 2013;46(5): 830–6.
[9] Geissbuhler A, Haux R and Kulikowski C. Electronic patient records: some answers to the data representation and reuse challenges findings from the section on patient records editors. IMIA Yearbook of Medical Informatics 2007. Inf Med Methods. 2007; 46(1): 47-9.
[10] Espinosa-Anke L, Tello J, Pardo A, Medrano I, Ureña A, Salcedo I, Saggion H. Savana: un entorno integral de extracción de información y expansión de terminologías en el dominio de la Medicina. Procesamiento del Lenguaje Natural. 2016; 57: 23-30.
[11] Mikolov T, Sutskever I, Chen K, Corrado G, and Dean J. Distributed Representations of Words and Phrases and their Compositionality. In Proceedings of NIPS, 2013.
Jorge Tello received his Bachelor of Science and Master of Science in Industrial Egineering from the Universidad Pontificia de Comillas (ICAI) in 2006, where he also obtained postgraduate studies in Project Management in 2011. Since 2014 he is Founder and CTO of Savana. His research and work topics include Biomedical data mining, Natural Language Processing and Machine Learning.
Ignacio Hernández Medrano is a nuerologist in the Ramon y Cajal hospital. He has a long career in healthcare management, where he has coordinated teaching and the research strategy. He holds a Master’s degree in Healthcare Management, and a Master’s degree in R&D management in health sciences (Spanish National School for Healthcare-ISCIII). He teaches in areas related to innovation and digital health at postgraduate level, e.g. clinical research master’s
courses, health management or MBAs. Ignacio received a degree from the Singularity University (NASA-Silicon Valley) in 2014 in entrepreneurship with exponential technologies, is TED speaker and the CEO-founder of Savana, a startup focused on the application of AI to Electronic Health Records.
Horacio Saggion holds a PhD in Computer Science from Université de Montréal, Canada. He obtained his Bsc in Computer Science from Universidad de Buenos Aires in Argentina, and his MSc in Computer Science from UNICAMP in Brazil. Horacio is an Associate Professor at the Department of Information and Communication Technologies, Universitat Pompeu Fabra (UPF), Barcelona. He is head of the Large Scale Text Understanding Systems
Lab and a member of the Natural Language Processing group where he works on automatic text summarization, text simplification, information extraction, sentiment analysis and related topics.His research is empirical combining symbolic, pattern-based approaches and statistical and machine learning techniques. He is currently principal investigator for UPF in several EU and national projects. Horacio has published over 100 works in leading scientific journals, conferences, and books in the field of human language technology.
Luis Espinosa-Anke (Elche, Spain, 1983) received his BA in English Philology from the University of Alicante in 2006. He obtained an MA in English for Speecific Purposes in the same institution, and a second MA in Natural Language Processing and Human Language Technologies in a joint Erasmus Mundus program provided by Universitat Autònoma de Barcelona (Spain) and the University of Wolverhampton (UK). His research interests
lie on knowledge-based approaches for semantics and knowledge acquisition and modeling.
Ignacio Salcedo Ramos (1989, Cuenca, Spain) received his Msc inComputer Science from the Complutense University of Madrid in 2012. He is currently working as R&D engineer in Savana. His research interests include NLP and Machine Learning.
Alberto Ureña was born in Madrid, Spain in 1989. He obtained his Msc (2012) in Computer Science from the Complutense University of Madrid. He is currently working at Savana, developing algorithms to extract information from medical records with the goal of improving health system efficiency and future medical breakthroughs. His current interests include NLP and Machine Learning methods, as well as logic programming.
Cristóbal Belda is a medical oncologist and current CEO of HM Hospitales Foundation for Research, an organization involved in the assistance of more than 2 millions of patients every year all over Spain. PhD in Medicine from UAM and former CEO of the Spanish National School of Public Health at NIH “Carlos III”. He has developed his career in biomarkers of cancer and, recently, how health economics may help new biomedical advances to be implemented in
real life, publishing more than 80 peer-reviewed, JCR- indexed, international papers and international patents for new approaches on biomarker analysis and leading more than 100 clinical trials mainly in lung and brain cancer.
In Press Special Issue on Big Data and e-Health
DOI: 10.9781/ijimai.2017.03.002
Abstract — This paper presents DataCare, a solution for
intelligent healthcare management. This product is able not only
to retrieve and aggregate data from different key performance
indicators in healthcare centers, but also to estimate future values
for these key performance indicators and, as a result, fire early
alerts when undesirable values are about to occur or provide
recommendations to improve the quality of service. DataCare’s
core processes are built over a free and open-source cross-platform
document-oriented database (MongoDB), and Apache Spark, an
open-source cluster-computing framework. This architecture
ensures high scalability capable of processing very high data
volumes coming at fast speed from a large set of sources. This
article describes the architecture designed for this project and
the results obtained after conducting a pilot in a healthcare
center. Useful conclusions have been drawn regarding how key
performance indicators change based on different situations, and
how they affect patients’ satisfaction.
Keywords — Architecture, Artificial Intelligence, Big Data,
Healthcare, Management.
I. IntRoductIon
When managing a healthcare center, there are many key performance indicators (KPIs) that can be measured, such as the
number of events, the waiting time, the number of planned tours, etc. Often, keeping these KPIs within the expected limits is key to achieve high users’ satisfaction.
In this paper we present DataCare, a solution for intelligent healthcare management. DataCare provides a complete architecture to retrieve data from sensors installed in the healthcare center, process and analyze it, and finally obtaining relevant information which is displayed in a user-friendly dashboard.
The advantages of DataCare are twofold: first, it is intelligent. Besides retrieving and aggregating data, the system is able to predict future behavior based on past events. This means that the system can fire early alerts when a KPI in the future is expected to have a value that falls outside the expected boundaries, and to provide recommendations for improving the behavior and the metrics, or in order to prevent future problems attending events.
Second, the core system module is built over a Big Data Platform. Processing and analysis are run over Apache Spark, and data are stored in MongoDB, thus enabling a highly scalable system that can process very big volumes of data coming at very high speeds.
This article is structured as follows: section II will present a context of this research by analyzing the state of the art and related work. Section III will present an overview of DataCare’s architecture, including the three main modules responsible for retrieving data, processing and
analyzing it, and displaying the resulting valuable information.Sections IV, V and VI will describe the preprocessing, processing
and analytics engines in further detail. The design of these systems is crucial to provide a scalable solution with an intelligent behavior. Section VII describes the visual analytics engine, and the different dashboards that are presented to users.
Finally, section VIII describes how the solution has been validated, and section IX provides some conclusive remarks along with potential future work.
II. state of the aRt
Because healthcare services are very complex and life-critical, many works have tackled the design of healthcare management systems, aimed at monitoring metrics in order to detect undesirable behaviors that decrease their satisfaction or even threaten their safety.
The design and implementation of healthcare management system is not new. Already in the 2000s, Curtright et al. [4] describe a system to monitor KPIs summarizing them in a dashboard report, with a real-world application in the Mayo Clinic. Also, Griffith and King [7] proposed to establish a “championship” where those healthcare systems with consistently good metrics will help improve decision processes.
Some of these works explore the sensing technology that enable proposals. For instance, Ngai et al. [11] focus on how RFID technology can be applied for building a healthcare management system, yet it is only implemented in a quasi-real world setting. Ting et al. [13] also focus on the application of RFID technology to such a project, from the perspective of its preparation, implementation and maintenance.
Some previous works have also tackled the design of intelligent healthcare management systems. Recently Jalal et al. [8] have proposed an intelligent depth video-based human activity recognition system to track elderly patients that could be used as a part of a healthcare management and monitoring system. However, the paper does not explore this integration. Also, Ghamdi et al. [6] have proposed an ontology-based system for prediction patients’ readmission within 30 days so that these readmissions can be prevented.
Regarding the impact of data in healthcare management system, the important of data-drive approaches have been addressed by Bossen et al. [3]. Roberts et al. [12] have explored how to design healthcare management systems using a design thinking framework. Basole et al. [2] propose a web-based game using organizational simulation for healthcare management. Zeng et al. [16] have proposed an enhanced VIKOR method that can be used as a decision support tool in healthcare management contexts. A relevant work from Mohapatra [10] explores how a hospital information system is used for healthcare management, improving the KPIs; and a pilot has been conducted in Kalinga hospital (India), turning out to be beneficial for all stakeholders.
DataCare: Big Data Analytics Solution for Intelligent Healthcare Management
Alejandro Baldominos1, Fernando De Rada2, and Yago Saez1
1Computer Science Department, Universidad Carlos III de Madrid, Leganés, Spain 2Camilo José Cela University, Madrid, Spain
International Journal of Interactive Multimedia and Artificial Intelligence
- 14 -
Some works have also explored how to increase patients’ satisfaction. For example, Fortenberry and McGoldrick [5] suggest improving the patient experience via internal marketing efforts; while Minniti et al. [9] propose a model in which patient’s feedback is processed in real-time and drives rapid cycle improvement.
To place this work into its context, what we have developed is a data-driven intelligent healthcare management system. Because of the Big Data volume and fast speed, we have used a Big Data architecture based on the one proposed in Baldominos et al. [1], but updating the tools to use Apache Spark for the sake of efficiency. Also, a pilot has been conducted to evaluate the performance of the proposed system.
III. oveRvIeW of the aRchItectuRe
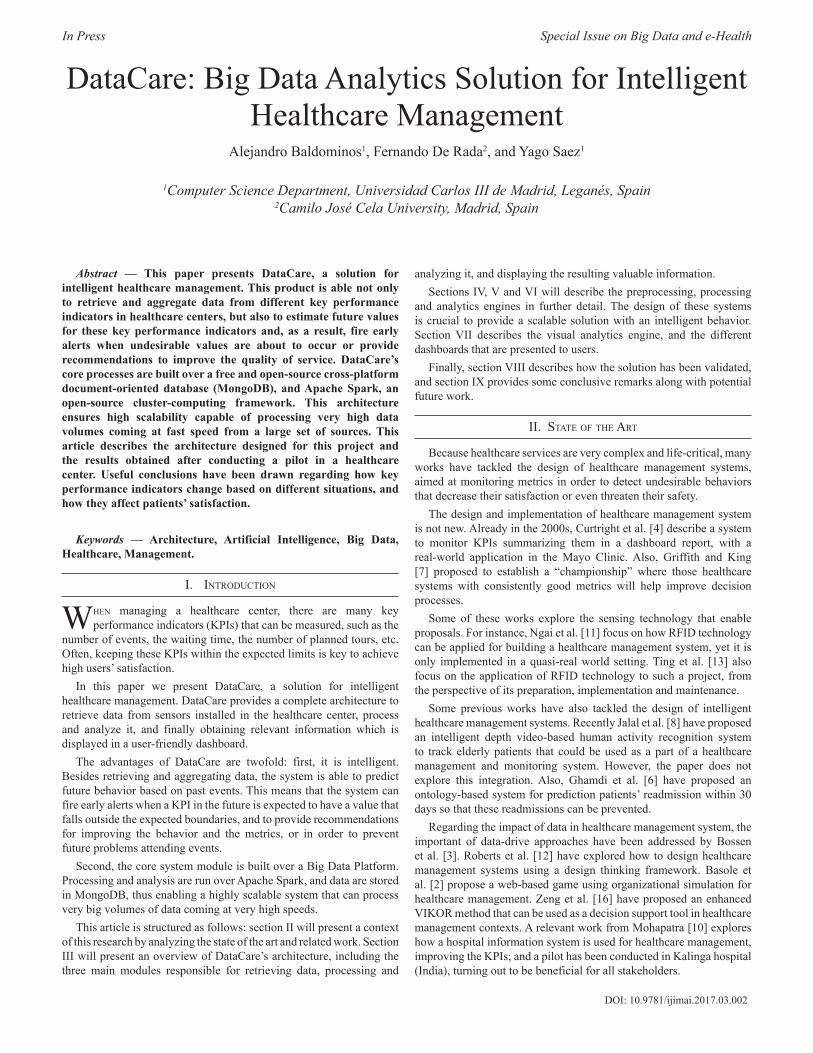
DataCare’s architecture comprises three main modules: the first oversees retrieving and aggregating the information generated in the health center or hospital, the second will process and analyze the data, and the third displays the valuable information in a dashboard, allowing the integration with external information systems.
Figure 1 depicts a broad overview of this architecture, while this section describes each of the modules in further detail.
A. Data Retrieval and Aggregation ModuleData retrieval is carried out by AdvantCare software, developed
by Itas Solutions S.L. AdvantCare is the set of hardware and software tools designed to manage communications between patients and healthcare staff. Its core comprises three main systems: 1) Buslogic manages and aggregates the information of actions carried out by non-doctor personnel (nurses and nursing assistants), 2) AdvantControl monitors and controls the infrastructure, and 3) EasyConf manages voice communication.
In the hospital rooms, different data acquisition systems are placed, which often consist on hardware devices connected to an IP network and include one of the following elements:• Sensors measuring some current value or status either in a
continuous or periodic fashion and sending it to Buslogic or AdvantControl servers; such as thermometers or noise or light sensors.
• Assistance devices such as buttons or pull handlers that are actioned by the patients and transmit the assistance call to the Buslogic server.
• Voice and video communication systems that send and receive information from other devices or from Jitsi (SIP Communicator), which are handled by EasyConf.
• Data acquisition systems operated by means of graphical user interfaces in devices such as tablets; e.g., surveys or other information systems.
In general terms, the information retrieved by AdvantCare belongs to one of the following:• Planned tours: healthcare personnel will periodically visit certain
rooms or patients as a part of a pre-established plan. Data about how shifts are carried out is essential to evaluate assistance quality and the efficiency of nurses and nursing assistants.
• Assistance tasks: nurses and nursing assistants must perform certain tasks as a response to an assistance call. It would be great to know in advance these tasks, so they can be monitored properly.
• Patients’ satisfaction: the most important service quality subjective metric is the patients’ satisfaction, which is obtained by mean of surveys.
As said before, AdvantCare software comprises three systems, as well as communication/integration interfaces.
1) BuslogicThis software oversees communication with the assistance calls
system. It also handles GestCare and MediaCare, which are the systems used for tasks planning, personnel work schedules, patient information, satisfaction surveys, and entertainment. Buslogic will retrieve core business information about the assistance process: alerts, waiting times to assist patients, and achieved assistance objectives.
2) AdvantControl This software controls and monitors the infrastructure and
automation functionalities, including the status of lights, doors or the DataCare infrastructure itself. It will provide real-time alerts about possible quality of service issues.
3) EasyConfThis software manages SIP Communicator and provides data about
calls such as the origin, the destination and the total call duration.
4) Communication/Integration APIsData can be retrieved from AdvantCare servers by means of SOAP
web services, which will be used in those requests that require high processing capacity, and are stateless. Also, the information can be accessed via a REST API, where the calls are performed through HTTP requests, and data is exchanged in JSON-serialized format. REST servers are placed in the software servers themselves (either Buslogic,
Fig. 1. DataCare’s architecture. The first column lists the data sources, which are retrieved and aggregated by AdvantCare software (second column). The last column shows the Big Data platform, which contains engines for the data processing and analytics module (yellow) and the data visualization module (purple).

In Press Special Issue on Big Data and e-Health
- 15 -
AdvantControl or EasyConf), thus allowing real-time queries; as well as parameters modifications. Finally, a TELNET channel will allow asynchronous communication to broadcast events from the servers to the connected clients.
B. Data Processing and Analysis ModuleThe Data Processing and Analysis Module is part of a Big Data
platform based on Apache Spark [14], which allows an integrated environment for the development and exploitation of real time massive data analysis, outperforming other solutions such as Hadoop MapReduce or Storm, scaling out up to 10,000 nodes, providing fault tolerance [15] and allowing queries using a SQL-like language.
As shown in Figure 1, this module comprises four different systems: Preprocessing Engine, Processing Engine, Big Data and Historic Data Warehouses and Analytics Engine.
1) Preprocessing EngineThis system performs the ETL (Extract-Transform-Load) processes
for the AdvantCare data. It will first communicate with AdvantCare using the available APIs to retrieve the data, which will be later transformed into a suitable format to be introduced to the Processing Engine. Because of the metadata provided by AdvantCare, the information can be classified to ease its analysis. Normalized and consolidated data will be stored in MongoDB, the leading free and open-source document-oriented database, where collections will store both data for real time analysis as well as historic data to support batch analysis to compute the evolution of different metrics in time.
2) Processing EngineThis system runs over the Spark computing cluster, and oversees
data consolidation processes for periodically aggregating data, as well as to support the alert and recommendation subsystems.
3) Data WarehousesData filtered by the Preprocessed Engine and enriched by the
Processing Engine will be stored in the Big Data Warehouse, that will store real-time information. Additionally, the Historic Data Warehouse stores aggregated historic data, which will be used by the Analytics Engine to identify new trends or trend shifts for the different quality metrics.
4) Analytics EngineThis system runs the batch processes that will apply the statistical
analysis methods, as well as machine learning algorithms over real-time Big Data. Along with the historic data, time series and ARIMA (autoregressive integrated moving average) techniques provides diagnosis of the temporal behavior of the model. This engine also implements a Bayes-based early alerts system (EAS) able to detect and predict a decrease in the service quality or efficiency metrics under a preset threshold, which will be notified via push or email notifications.
C. Data Visualization ModuleThis module provides a reporting dashboard that will receive
information from the Big Data platform in real time and will display two panels. The first panel will show the main quality and efficiency metrics in real time, along with its evolution over time and the quality thresholds. The second panel will provide the diagnoses computed by the Analytics Engine, as well as intelligent recommendations to prevent reaching undesired situations, such as metrics falling below acceptable thresholds.
The dashboard is implemented using the D3.js library, providing nice and intuitive visualizations.
Iv. pRepRocessIng engIne
The Preprocessing Engine performs the ETL process over the data, and this section will describe how different data are extracted from the various sources, transformed and loaded as a part of this process.
A. ExtractionThis engine extracts the assistance calls data by polling the
{“_id”: ObjectId(“565c234f152aee26874d7a18”), “full_event”: true,“presence”: {
“ev”: “EV PRES”,“ts”: ISODate(“2015-10-02T01:35:36.384Z”)
},“area”: “Madrid”, “notification” : {
“ev”: “EV NOTIF”,“ts”: ISODate(“2015-10-02T01:32:21.984Z”)
},“room_number”: “126”, “location”: “PERA”, “activation” : {
“week”: 40,“weekday”: 5,“user”: “Anonimo”,“hour”: 1,“minute”: 31,“year”: 2015,“month”: 10,“day”: 2,“ev”: “EV PERA”,“ts”: ISODate(“2015-10-02T01:31:45.696Z”)
},“room_letter”: “-”, “center”: “Aravaca”, “day_properties”: {
“holiday_or_sunday”: true, “social_events”: true, “rain”: true, “extreme_heat”: true, “summer_vacation”: true, “holiday”: true,“weekend”: true,“friday_or_eve”: true
},“floor”: “1”, “times”: {
“cancellation_notification”: 195, “used”: 194,“idle”: 36, “cancellation_activation”: 231, “total”: 230, “cancellation_presence”: 1
},“hour_properties”: {
“shift_change”: true, “shift”: “TARDE”, “sleeptime”: true, “nurse_count”: “8”, “dinnertime”: true,“lunchtime”: true
},“cancellation”: {
“ev”: “EV CPRES”,“remote”: true,“ts”: ISODate(“2015-10-02T01:35:37.248Z”)
}}
Fig. 2. Sample JSON document representing an assistance task event in the MongoDB events collection.

International Journal of Interactive Multimedia and Artificial Intelligence
- 16 -
AdvantCare module every five minutes, retrieving all data generated by all the rooms. Data from planned tours are retrieved daily also by polling the REST API, while patients’ satisfaction surveys are loaded as CSV files.
B. TransformationThe Preprocessing Engine performs several transformation tasks so
that data is in a suitable format to be handled by the Processing Engine and the Analytics Engine.
1) Assistance tasks eventsAssistance tasks events will be transformed into MongoDB
documents, where each event will be stored in a different document, and all of them will belong to the events collection. When one event status changes (e.g., from “activated” to “notified”), the document is updated to reflect these changes.
Figure 2 shows a sample document representing an event.
2) Planned toursData from planned tours are retrieved daily from AdvantCare using
the REST API, and are transformed to a MongoDB document in the shifts collection. A sample document is shown in Figure 3.
3) Satisfaction surveysAs stated before, satisfaction data are loaded as CSV files. The
Preprocessing Engine transforms it into a MongoDB document, which will be stored into the surveys collection. Figure 4 shows the structure of a sample document representing a satisfaction survey.
C. LoadOnce data is transformed into MongoDB documents (BSON
format), they are loaded into the corresponding MongoDB collection.
v. pRocessIng engIne
The Processing Engine will run batch processes to consolidate data previously transformed by the Preprocessing Engine. This consolidation will aggregate data to be handled by the Analytics Engine.
A. Periodic data consolidationAs the Processing Engine consolidates data periodically; two
new collections are created, namely hourly and daily, depending on the periodicity of the aggregated data. A sample document in the hourly collection is shown in Figure 5. This aggregation enables fast visualization of aggregated data, and it is key for the Analytics Engine to detect strange behaviors, fire alerts, or make recommendations.
Both the hourly and daily collections are indexed by timestamp, to enable fast filtering on consolidated data based on temporal queries.
B. Real-time data processingTo support the real-time dashboard, a process will take the data from
the hourly collection and compute the average value for each KPI for
{“_id”: ObjectId(“569e50b1aa40450a027eb4ec”),“floor”: 3,“room”: 326,“date”: “1/10/15”,“hour”: “9:00:45”,“center_name”: “Aravaca”, “ts”: ISODate(“2015-10-01T09:00:45.000Z”),“shift_type”: “MAÑANA”
}
Fig. 3. Sample JSON document representing a shift in the MongoDB shifts collection.
{“_id” : ObjectId(“569e483daa404509a9796754”), “care_punctuation”: 2, “center”: “Aravaca”,“area”: “Madrid”,“floor”: 2, “night_punctuation”: 5, “morning_punctuation”: 4, “speed_punctuation”: 2, “price_quality_punctuation”: 2, “afternoon_punctuation”: 4,“year”: 2015,“month”: 11, “day”: 27,“date”: ISODate(“2015-11-27T00:00:00.000Z”),“global_punctuation”: 2, “id”: “Anonimo”,“room”: 221
}Fig. 4. Sample JSON document representing a satisfaction survey in the MongoDB surveys collection.
{“_id”: ObjectId(“5665a51f0b1d4cf6f9728ae4”),“center”: “Aravaca”, “date”: {
“week”: 40,“weekday”: 4, “hour”: 4, “ts”: ISODate(“2015-10-01T04:00:00.000Z”),“year”: 2015, “month”: 10, “day”: 1
},“idle_time”: 67, “wait_time”: {
“floors”: {“1”: 0.6363636363636364,“2”: 29.5, “3”: 120,“4”: 0.5
}, “shifts”: {
“NOCHE”: 23.72222222222222 },“total”: 427, “types”: {
“EV HABA”: 4,“EV PERA”: 359
}},“used_time”: 344, “activity”: {
“floors”: { “1”: 11,“2”: 2,“3”: 3, “4”: 2
}, “shifts”: {
“NOCHE”: 18},“total”: 18, “types”: {
“EV HABA”: 17,“EV PERA”: 1
}} }Fig. 5. Sample JSON document representing consolidated data in the hourly collection.

In Press Special Issue on Big Data and e-Health
- 17 -
different time periods: last day, last week, last month, and since the beginning. This allows comparing the current value for a KPI with the average of past periods of time. A small fragment of a sample document in the realtime collection showing the aggregated data for the “activity” (number of events) KPI is shown in Figure 6.
{“_id” : ObjectId(“56850cb00b1d4cf6f9b4f2da”), “center”: “Aravaca”, “activity”: {“total”: [{“type”: “yesterday”, “hour”: 0, “value”: 106},{“type”: “lastweek”, “hour”: 0, “value”: 58},{“type”: “lastmonth”, “hour”: 0, “value”: 52},{“type”: “alltime”, “hour”: 0, “value”: 51.1489},{“type”: “yesterday”, “hour”: 1, “value”: 20},{“type”: “lastweek”, “hour”: 1, “value”: 33.571},...
}
Fig. 6. Sample JSON document representing a fragment of the real-time information for the KPI “activity” in the realtime collection.
vI. analytIcs engIne
The Analytics Engine is responsible of performing an intelligent analysis of the data to compute daily prediction, firing alerts when an undesired condition is detected (e.g., a certain metric falls under a specified threshold) and suggesting recommendations. This section describes these processes.
A. Prediction SystemThe prediction system takes the data contained in the events
collection along with contextual data (weather, holydays or labor dates, etc.) and predicts the estimated value for each KPI for every hour in the next day. This batch process is executed daily. The predicted values are stored in a document per each KPI, in the predictions collection in MongoDB. A sample document is shown in Figure 7.
{“_id”: ObjectId(“5683f978e4b0d671e427e1db”),“center”: “Aravaca”, “name”: “wait_time.total”,“date”: “1/10/15”,“predictions”: { “0”: 5637, “1”: 28557, “2”: 15711,“3”: 4133, ...
}
Fig. 7. Sample JSON document representing a fragment of the predictions for the “wait time” KPI in the predictions collection.
The prediction algorithm will analyze behavioral patterns in the events data and will apply these patterns to simulate future behavior. The algorithm proceeds as follows for each KPI:
Given clusters, the algorithm computes a matrix where each row is a cluster and each column is an hour, thus resulting in a
matrix. The value in the position will contain the average value of the KPI for events happening in the cluster and in the th hour of the day:
Also, vector will contain the hourly averages from the previous day:
Then a vector of weights is computed, where each element is obtained as given in (1):
(1)
{“_id”: ObjectId(“5697b55d0b1d4cf6f9b59a63”),“center_name”: “Vistalegre”,“date”: ISODate(“2016-01-14T15:00:00.000Z”),“type”: “activity.types.EV HABA”,“status”: “unseen”,“group”: “anticipated”,“description”: “WARNING: It has been detected
a decrease in the activity of the type EV HABA between 15:00 and 16:00 (14/01/16), falling below the acceptable threshold.”,
“shift”: “noon”,“subject”: “Early alert: activity of type EV HABA”
}
Fig. 8. Sample JSON document representing an alert in the alerts collection
Every day at 12 AM the vector containing the estimation for the following day ( is computed as in (2):
(2)
As the day goes by, we will be discovering information of the current days’ vector ( :
At 8 AM and 4 PM, we will re-estimate the DE vector as in (3):
(3)
In the previous equation, will be 0 at 8 AM and 8 at 4 PM, while will be 7 at 8 AM and 15 at 4 PM.
The clusters are determined based on contextual information, such as whether the day was weekday, it was rainy, it was extremely hot (over 35 ºC) or it was an important day because any other reason.
B. Recommendations System The recommendation system consists of a set of rules closely
related to the alerts, whose purpose is to optimize the service when some KPI can be improved. Some of these KPIs are the number of events, the waiting time, the satisfaction levels, etc.
The recommendation process runs weekly, as we have identified that it is the least amount of time required to find evidence of metrics that can be improved.
The rule database comprises 52 rules which have been designed by experts based on their domain knowledge. Besides the metrics themselves, some rules can also be based on contextual information such as weather. Also, if the system keeps firing the same alarm over time, the recommendation can be stated in more serious terms.
International Journal of Interactive Multimedia and Artificial Intelligence
- 18 -
An example of rule stated in natural language is as follows: If the current number of events is higher than the average number of events of the previous month plus half the standard deviation, and this excess has happened more than three times in the last month, then the recommendation is: “The activity is much higher than expected. At this moment, the center does not have enough healthcare personnel to attend all these events. It is urgent that the cause of the activity rise be identified or new personnel should be hired.”
When a recommendation is created, it will be stored in the recommendations collection, in a document formatted as shown in Figure 9. These documents will be processed and displayed by the dashboard.
{“_id”: ObjectId(“56962a560b1d4cf6f9b5911e”),“center_name”: “Aravaca”,“date”: ISODate(“2016-01-14T00:00:00.000Z”),“status”: “unseen”,“group”: “anticipated”,“text”: “The activity is within the expected limits.
No modification of the service is required.”,“status”: “unseen”,“subject”: “Recommendation about activity”}
Fig. 9. Sample JSON document representing a recommendation in the recommendations collection.
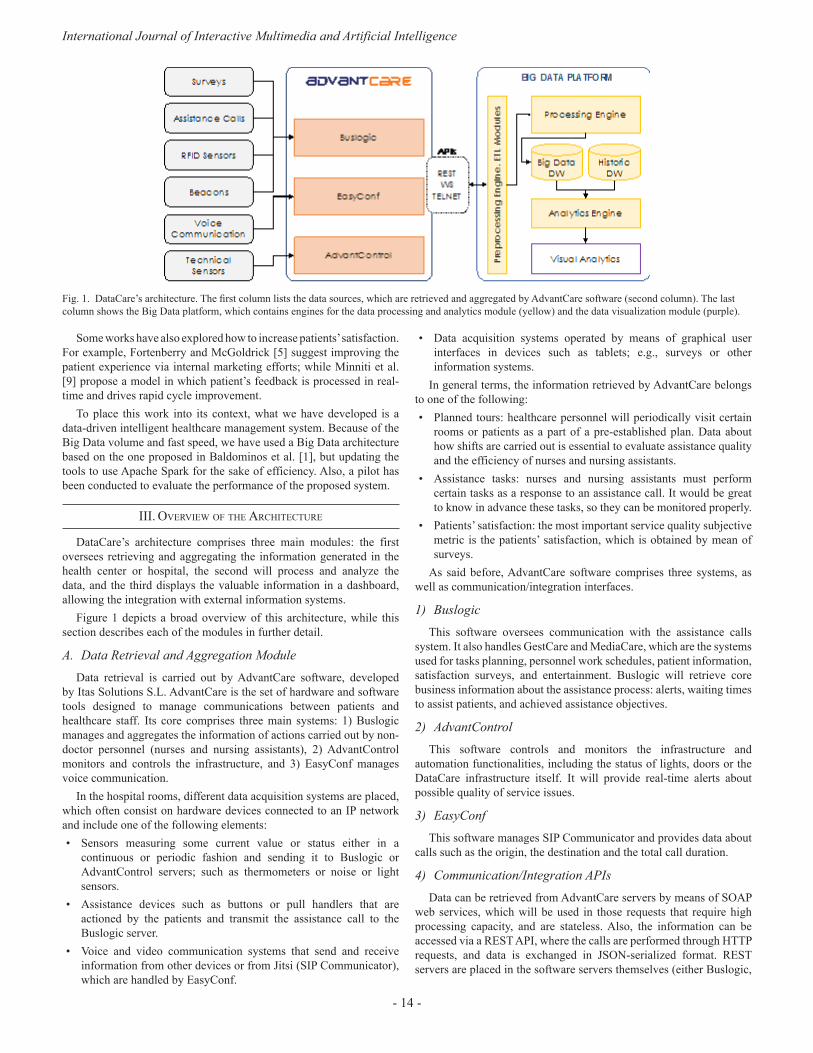
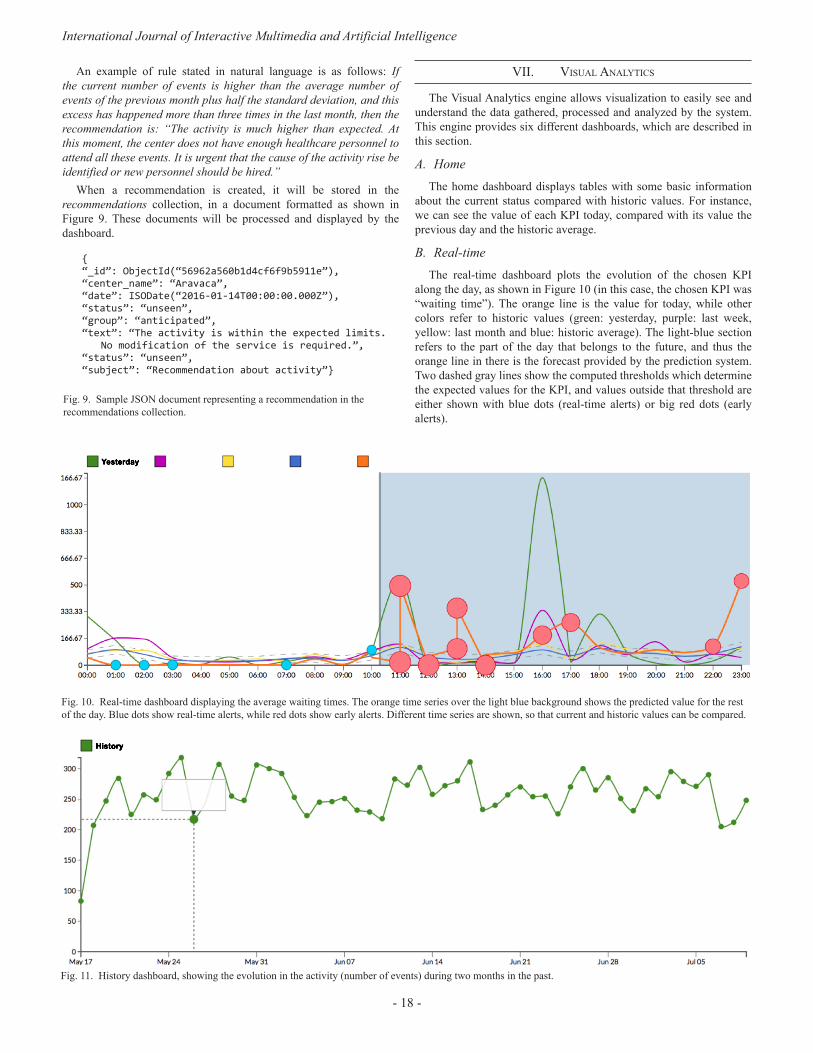
vII. vIsual analytIcs
The Visual Analytics engine allows visualization to easily see and understand the data gathered, processed and analyzed by the system. This engine provides six different dashboards, which are described in this section.
A. HomeThe home dashboard displays tables with some basic information
about the current status compared with historic values. For instance, we can see the value of each KPI today, compared with its value the previous day and the historic average.
B. Real-timeThe real-time dashboard plots the evolution of the chosen KPI
along the day, as shown in Figure 10 (in this case, the chosen KPI was “waiting time”). The orange line is the value for today, while other colors refer to historic values (green: yesterday, purple: last week, yellow: last month and blue: historic average). The light-blue section refers to the part of the day that belongs to the future, and thus the orange line in there is the forecast provided by the prediction system. Two dashed gray lines show the computed thresholds which determine the expected values for the KPI, and values outside that threshold are either shown with blue dots (real-time alerts) or big red dots (early alerts).
Fig. 10. Real-time dashboard displaying the average waiting times. The orange time series over the light blue background shows the predicted value for the rest of the day. Blue dots show real-time alerts, while red dots show early alerts. Different time series are shown, so that current and historic values can be compared.
Fig. 11. History dashboard, showing the evolution in the activity (number of events) during two months in the past.
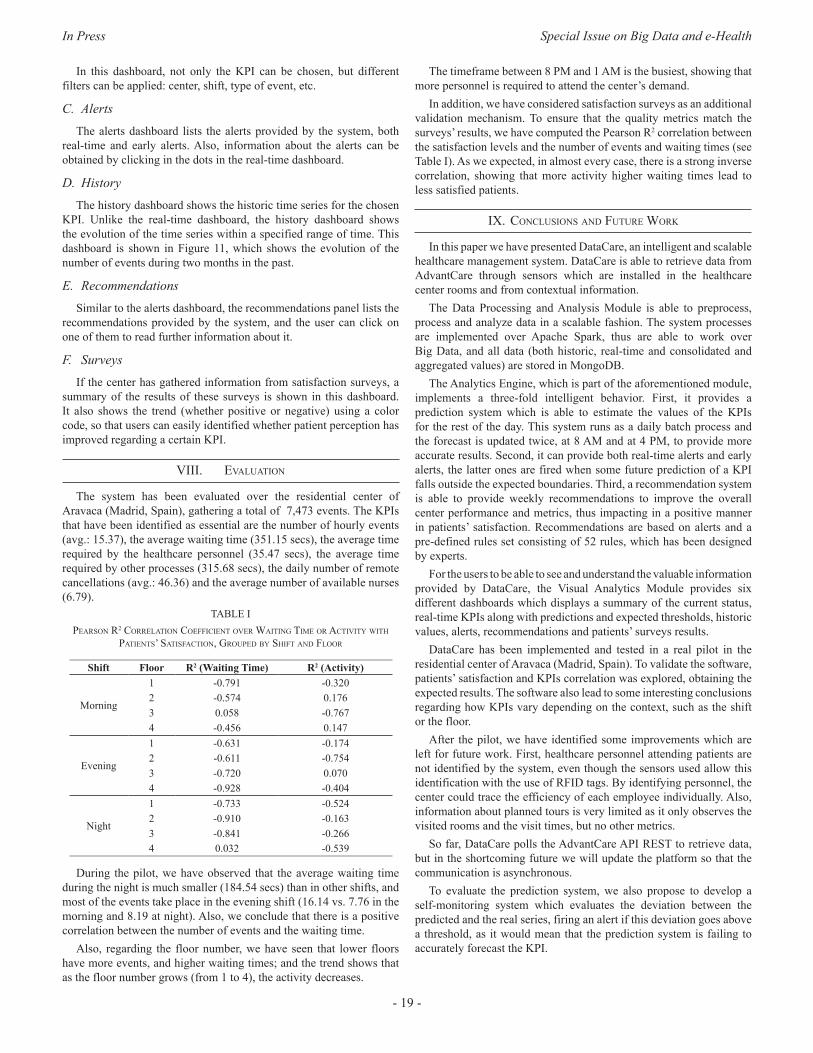
In Press Special Issue on Big Data and e-Health
- 19 -
In this dashboard, not only the KPI can be chosen, but different filters can be applied: center, shift, type of event, etc.
C. AlertsThe alerts dashboard lists the alerts provided by the system, both
real-time and early alerts. Also, information about the alerts can be obtained by clicking in the dots in the real-time dashboard.
D. HistoryThe history dashboard shows the historic time series for the chosen
KPI. Unlike the real-time dashboard, the history dashboard shows the evolution of the time series within a specified range of time. This dashboard is shown in Figure 11, which shows the evolution of the number of events during two months in the past.
E. RecommendationsSimilar to the alerts dashboard, the recommendations panel lists the
recommendations provided by the system, and the user can click on one of them to read further information about it.
F. SurveysIf the center has gathered information from satisfaction surveys, a
summary of the results of these surveys is shown in this dashboard. It also shows the trend (whether positive or negative) using a color code, so that users can easily identified whether patient perception has improved regarding a certain KPI.
vIII. evaluatIon
The system has been evaluated over the residential center of Aravaca (Madrid, Spain), gathering a total of 7,473 events. The KPIs that have been identified as essential are the number of hourly events (avg.: 15.37), the average waiting time (351.15 secs), the average time required by the healthcare personnel (35.47 secs), the average time required by other processes (315.68 secs), the daily number of remote cancellations (avg.: 46.36) and the average number of available nurses (6.79).
table IpeaRson R2 coRRelatIon coeffIcIent oveR WaItIng tIMe oR actIvIty WIth
patIents’ satIsfactIon, gRouped by shIft and flooR
Shift Floor R2 (Waiting Time) R2 (Activity)
Morning
1 -0.791 -0.3202 -0.574 0.1763 0.058 -0.7674 -0.456 0.147
Evening
1 -0.631 -0.1742 -0.611 -0.7543 -0.720 0.0704 -0.928 -0.404
Night
1 -0.733 -0.5242 -0.910 -0.1633 -0.841 -0.2664 0.032 -0.539
During the pilot, we have observed that the average waiting time during the night is much smaller (184.54 secs) than in other shifts, and most of the events take place in the evening shift (16.14 vs. 7.76 in the morning and 8.19 at night). Also, we conclude that there is a positive correlation between the number of events and the waiting time.
Also, regarding the floor number, we have seen that lower floors have more events, and higher waiting times; and the trend shows that as the floor number grows (from 1 to 4), the activity decreases.
The timeframe between 8 PM and 1 AM is the busiest, showing that more personnel is required to attend the center’s demand.
In addition, we have considered satisfaction surveys as an additional validation mechanism. To ensure that the quality metrics match the surveys’ results, we have computed the Pearson R2 correlation between the satisfaction levels and the number of events and waiting times (see Table I). As we expected, in almost every case, there is a strong inverse correlation, showing that more activity higher waiting times lead to less satisfied patients.
Ix. conclusIons and futuRe WoRk
In this paper we have presented DataCare, an intelligent and scalable healthcare management system. DataCare is able to retrieve data from AdvantCare through sensors which are installed in the healthcare center rooms and from contextual information.
The Data Processing and Analysis Module is able to preprocess, process and analyze data in a scalable fashion. The system processes are implemented over Apache Spark, thus are able to work over Big Data, and all data (both historic, real-time and consolidated and aggregated values) are stored in MongoDB.
The Analytics Engine, which is part of the aforementioned module, implements a three-fold intelligent behavior. First, it provides a prediction system which is able to estimate the values of the KPIs for the rest of the day. This system runs as a daily batch process and the forecast is updated twice, at 8 AM and at 4 PM, to provide more accurate results. Second, it can provide both real-time alerts and early alerts, the latter ones are fired when some future prediction of a KPI falls outside the expected boundaries. Third, a recommendation system is able to provide weekly recommendations to improve the overall center performance and metrics, thus impacting in a positive manner in patients’ satisfaction. Recommendations are based on alerts and a pre-defined rules set consisting of 52 rules, which has been designed by experts.
For the users to be able to see and understand the valuable information provided by DataCare, the Visual Analytics Module provides six different dashboards which displays a summary of the current status, real-time KPIs along with predictions and expected thresholds, historic values, alerts, recommendations and patients’ surveys results.
DataCare has been implemented and tested in a real pilot in the residential center of Aravaca (Madrid, Spain). To validate the software, patients’ satisfaction and KPIs correlation was explored, obtaining the expected results. The software also lead to some interesting conclusions regarding how KPIs vary depending on the context, such as the shift or the floor.
After the pilot, we have identified some improvements which are left for future work. First, healthcare personnel attending patients are not identified by the system, even though the sensors used allow this identification with the use of RFID tags. By identifying personnel, the center could trace the efficiency of each employee individually. Also, information about planned tours is very limited as it only observes the visited rooms and the visit times, but no other metrics.
So far, DataCare polls the AdvantCare API REST to retrieve data, but in the shortcoming future we will update the platform so that the communication is asynchronous.
To evaluate the prediction system, we also propose to develop a self-monitoring system which evaluates the deviation between the predicted and the real series, firing an alert if this deviation goes above a threshold, as it would mean that the prediction system is failing to accurately forecast the KPI.
International Journal of Interactive Multimedia and Artificial Intelligence
- 20 -
acknoWledgMent
Special acknowledgements to WildBit Studios for the development and pilots of DataCare. This project is partially funded by the Spanish Ministry of Industry, Energy and Tourism in the “Economy and Digital Society Strategic Action” program, under reference number TSI-100105-2014-62.
RefeRences
[1] A. Baldominos, E. Albacete, Y. Saez and P. Isasi, “A scalable machine learning online service for Big Data real-time analysis,” in Proc. 2014 IEEE Symp. Comput. Intell. Big Data, Orlando, FL, 2014.
[2] R. C. Basole, D. A. Bodner, and W. B. Rouse, “Healthcare management through organizational simulation,” Decision Support Systems, vol. 55(2), pp. 552–563, May 2013.
[3] C. Bossen, P. Danholt, M. B. Ubbesen, “Challenges of data-driven healthcare management: new skills and work,” Danish National Research Database, 2016.
[4] J. W. Curtright, S. C. Stolp-Smith, and E. S. Edell, “Strategic performance management: development of a performance measurement system at the Mayo Clinic,” Journal of Healthcare Management, vol. 45(1), pp. 58–68, Feb. 2000.
[5] J. L. Fortenberry Jr., and P. J. McGoldrick, “Internal marketing: a pathway for healthcare facilities to improve the patient experience,” International Journal of Healthcare Management, vol. 9(1), pp. 28–33, Jun. 2015.
[6] H. A. Ghamdi, R. Alshammari, and M. I. Razzak, “An ontology-based system to predict hospital readmission within 30 days,” International Journal of Healthcare Management, vol. 9(4), pp. 236–244, Apr. 2016.
[7] J. R. Griffith, and J. G. King, “Championship management for healthcare organizations,” Journal of Healthcare Management, vol. 45(1), pp. 17–30, Feb. 2000.
[8] A. Jalal, S. Kamal, and D. Kim, “A depth video-based human detection and activity recognition using multi-features and embedded hidden Markov models for health care monitoring systems,” International Journal of Interactive Multimedia and Artificial Intelligence, vol. 4(4), pp. 54–62, Jun. 2017.
[9] M. J. Minniti, T. R. Blue, D. Freed, and S. Ballen, “Patient-interactive healthcare management, a model for achieving patient experience excellence,” Healthcare Information Management Systems: Cases, Strategies and Solutions, Health Informatics, part II, pp. 257–281, Springer International Publishing, 2016.
[10] S. Mohapatra, “Using integrated information system for patient benefits: a case study in India,” International Journal of Healthcare Management, vol. 8(4), pp. 262–271, Mar 2015.
[11] E. W. T. Ngai, J. K. L. Poon, F. F. C. Suk, and C. C. Ng, “Design of an RFID-based healthcare management system using an information system design theory,” Information Systems Frontiers, vol. 11(4), pp. 405–417, Sep. 2009.
[12] J. P. Roberts, T. R. Fisher, M. J. Trowbridge, and C. Bent, “A design thinking framework for healthcare management and innovation,” Healthcare, vol. 4(1), pp. 11–14, Mar. 2016.
[13] S. L. Ting, S. K. Kwok, A. H. C. Tsang, and W. B. Lee, “Critical Elements and lessons learnt from the implementation of an RFID-enabled healthcare management system in a medical organization,” Journal of Medical Systems, vol. 35(4), pp. 657–669, Aug. 2011.
[14] M. Zaharia, M. Chowdhury, M. J. Franklin, S. Shenker, and I. Stoica, “Spark: cluster computing with working sets,” in Proc. 2nd USENIX Conf. Hot Topics Cloud Comput., Boston, MA, 2010.
[15] M. Zaharia, M. Chowdhury, T. Das, A. Dave, J. Ma, M. McCauley, M. J. Franklin, S. Shenker, and I. Stoica, “Resilient distributed datasets: a fault-tolerant abstraction for in-memory cluster computing,” in Proc. 9th USENIX Conf. Netw. Syst. Design Impl., San Jose, CA, 2012.
[16] Q. L Zeng, D. D. Li and Y. B. Yang, “VIKOR method with enhanced accuracy for multiple criteria decision making in healthcare management,” Journal of Medical Systems (first online), Apr. 2013.
Alejandro Baldominos is Computer Scientist and Engineer since 2012 from Universidad Carlos III de Madrid, and got his Master degree in 2013 from the same university. He is currently working as a researcher in the Evolutionary Computation, Neural Networks and Artificial Intelligence research group (EVANNAI) of the Computer Science Department at Universidad Carlos III de Madrid, where he is currently working in his Ph. D. thesis with a
studentship granted by the Spanish Ministry of Education, Culture and Sport. He also works as Professor of the Master in Visual Analytics and Big Data at Universidad Internacional de la Rioja. He has published several conference and journal papers in the fields of artificial intelligence, Big Data and healthcare; and has been involved in several national and European research projects.
Yago Saez received the degree in computer engineering in 1999. He got his Ph.D. in Computer Science (Software Engineering) from the Universidad Politécnica de Madrid, Spain, in 2005. Since 2007 till 2015 he was vice-head of the Computer Science Department from the Carlos III University of Madrid, where he got a tenure and is nowadays associate professor. He belongs to the Evolutionary Computation, Neural Networks and Artificial Intelligence
research group (EVANNAI) and member of the IEEE Computational Finance and Economics Technical committee.
Fernando De Rada is CEO at Wildbit Studios, and Associate Professor in Video Game Production at the University Camilo José Cela (UCJC) of Madrid. He received the degree in Physical Sciences from the Autonomous University of Madrid in 2003, and got his postgraduate Master in Image, Publicity and Corporate Identity from the UCJC in 2014. He is currently working in his Ph. D. thesis at the Faculty of Economic and Business Sciences
of the National University of Distance Education (UNED). Over 25 years of experience as entrepreneur and senior executive in mobile, gaming and digital media, since the late 1980s has founded and managed different companies leading multidisciplinary teams with a verifiable track record of remarkable results. He has been managing several national research projects, in the fields of Big Data, healthcare, mobile and visual technologies. He is also member of the Spanish Interactive Arts and Sciences Academy, and has been awarded in 2014 with the Prize for a Professional Career by Retro Madrid and AUIC.
In Press Special Issue on Big Data and e-Health
DOI: 10.9781/ijimai.2017.03.003
Abstract — Induction of the labour process is an extraordinarily
common procedure used in some pregnancies. Obstetricians face
the need to end a pregnancy, for medical reasons usually (maternal
or fetal requirements) or less frequently, social (elective inductions
for convenience). The success of induction procedure is conditioned
by a multitude of maternal and fetal variables that appear before
or during pregnancy or birth process, with a low predictive
value. The failure of the induction process involves performing
a caesarean section. This project arises from the clinical need
to resolve a situation of uncertainty that occurs frequently in
our clinical practice. Since the weight of clinical variables is not
adequately weighted, we consider very interesting to know a priori
the possibility of success of induction to dismiss those inductions
with high probability of failure, avoiding unnecessary procedures
or postponing end if possible. We developed a predictive model of
induced labour success as a support tool in clinical decision making.
Improve the predictability of a successful induction is one of the
current challenges of Obstetrics because of its negative impact.
The identification of those patients with high chances of failure,
will allow us to offer them better care improving their health
outcomes (adverse perinatal outcomes for mother and newborn),
costs (medication, hospitalization, qualified staff) and patient
perceived quality. Therefore a Clinical Decision Support System
was developed to give support to the Obstetricians. In this article,
we had proposed a robust method to explore and model a source
of clinical information with the purpose of obtaining all possible
knowledge. Generally, in classification models are difficult to know
the contribution that each attribute provides to the model. We
had worked in this direction to offer transparency to models that
may be considered as black boxes. The positive results obtained
from both the information recovery system and the predictions
and explanations of the classification show the effectiveness and
strength of this tool.
Keywords — Machine learning, Big Data, Electronic Medical
Records, Induction of Labour, Predictive Models, Clinical Decision
Support System.
I. IntRoductIon
InductIon of the labour process, more commonly known as labour induction, is one of the most studied operations within the field
of Obstetrics. Over the last two decades, the induction rate has doubled, turning into a fairly common procedure, used in over 20% of gestations [1], [2]. However, good predictive factors of the success of this procedure have not been identified yet, so there are not support tools for the experts’ criteria so far. Currently, the decision of inducing is made only on the basis of clinical knowledge itself consisting of protocols, guides and previous experience of certain characteristics of
mother and foetus, but in case of making unwise decisions it would cause serious complications [2], [3]. Under these circumstances, it seems interesting to know beforehand the probability of success of the induction in order to dismiss the inductions having a high probability of failure and thus improving results on health, reducing costs derived from medication, hospitalization or qualified staff. Therefore, one of the current challenges in Obstetrics is improving the prediction of successful induction of labour.
In works [4] and [5], the authors present usual variables related to situations where labour has been induced successfully, so these are good predictors and have been defined as a reference model. Nonetheless, some other situations present a lower predictive value than expected. In this paper, the effectiveness of these variables has been evaluated and other models are explored to determine some relevant variables with the aim of building Clinical Decision Support System tool [6].
Also, the healthcare model and, in general, the wholehealthcare sector is nowadays one of the fields in which Big
Data Technology is having a high impact on, and is experiencing an exponential growth in applications.
In this environment a high percentage of data, clinical evaluations and patient progress information are registered usually in free text fields on the Electronic Medical Records. This information should be processed and transformed into structured and normalised data. In our project, Machine Learning algorithms, Text Mining and Big Data techniques have been used to extract knowledge. A typical difficulty of applying these techniques is that algorithms outcomes are usually difficult to interpret. To prevent that, additional work was done to provide more transparency to the previous algorithms, especially those traditionally considered as black box, such as Neural Networks. Several approximations proposed in the literature were studied in the Master´s thesis [7], the Strumbelj and Kononenko proposal was used in [8], based on the cooperative game theory, which allows us to obtain the contribution of each variable in the classification obtained by the algorithm.
II. pRoposed Methodology
In this project, we developed a tool that is able to exploit, structure and normalize a source of clinical information and that works as an aid for decision making, on the basis of a predictive model. In order to achieve this work, a multidisciplinary team was formed in which clinicians, health care data experts and machine learning researchers worked together. An important step for machine learning to have a meaningful role in healthcare and more specifically in Obstetrics field.
The processes of data acquisition, preparation and validation are essential and, at the same time, the most complex tasks of the project. If there was not structured information, it would not be possible to generate predictive models or to build the validation tool.
Development of a Predictive Model for Induction Success of Labour
Cristina Pruenza1, María Teulón2, Luis Lechuga2, Julia Díaz1, Ana González1
1Universidad Autónoma de Madrid and Instituto de Ingeniería del Conocimiento, Madrid, Spain 2Hospital Universitario de Fuenlabrada, Madrid, Spain
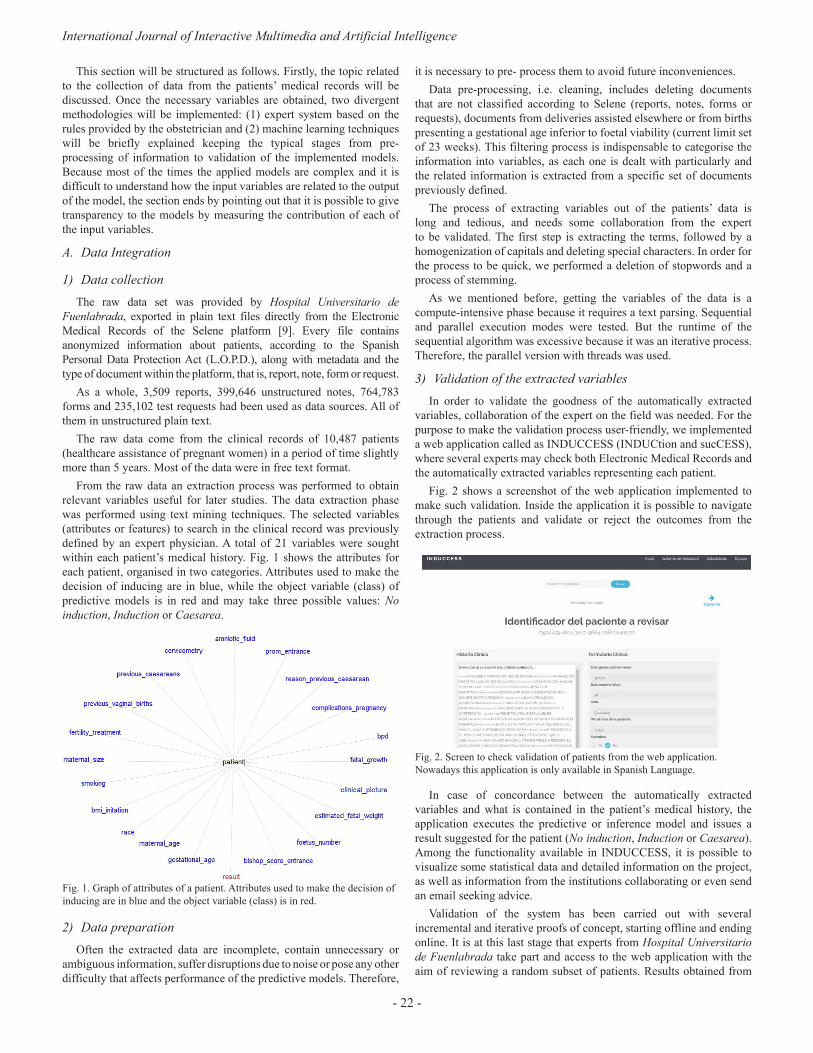
International Journal of Interactive Multimedia and Artificial Intelligence
- 22 -
This section will be structured as follows. Firstly, the topic related to the collection of data from the patients’ medical records will be discussed. Once the necessary variables are obtained, two divergent methodologies will be implemented: (1) expert system based on the rules provided by the obstetrician and (2) machine learning techniques will be briefly explained keeping the typical stages from pre- processing of information to validation of the implemented models. Because most of the times the applied models are complex and it is difficult to understand how the input variables are related to the output of the model, the section ends by pointing out that it is possible to give transparency to the models by measuring the contribution of each of the input variables.
A. Data Integration
1) Data collectionThe raw data set was provided by Hospital Universitario de
Fuenlabrada, exported in plain text files directly from the Electronic Medical Records of the Selene platform [9]. Every file contains anonymized information about patients, according to the Spanish Personal Data Protection Act (L.O.P.D.), along with metadata and the type of document within the platform, that is, report, note, form or request.
As a whole, 3,509 reports, 399,646 unstructured notes, 764,783 forms and 235,102 test requests had been used as data sources. All of them in unstructured plain text.
The raw data come from the clinical records of 10,487 patients (healthcare assistance of pregnant women) in a period of time slightly more than 5 years. Most of the data were in free text format.
From the raw data an extraction process was performed to obtain relevant variables useful for later studies. The data extraction phase was performed using text mining techniques. The selected variables (attributes or features) to search in the clinical record was previously defined by an expert physician. A total of 21 variables were sought within each patient’s medical history. Fig. 1 shows the attributes for each patient, organised in two categories. Attributes used to make the decision of inducing are in blue, while the object variable (class) of predictive models is in red and may take three possible values: No induction, Induction or Caesarea.
Fig. 1. Graph of attributes of a patient. Attributes used to make the decision of inducing are in blue and the object variable (class) is in red.
2) Data preparationOften the extracted data are incomplete, contain unnecessary or
ambiguous information, suffer disruptions due to noise or pose any other difficulty that affects performance of the predictive models. Therefore,
it is necessary to pre- process them to avoid future inconveniences.Data pre-processing, i.e. cleaning, includes deleting documents
that are not classified according to Selene (reports, notes, forms or requests), documents from deliveries assisted elsewhere or from births presenting a gestational age inferior to foetal viability (current limit set of 23 weeks). This filtering process is indispensable to categorise the information into variables, as each one is dealt with particularly and the related information is extracted from a specific set of documents previously defined.
The process of extracting variables out of the patients’ data is long and tedious, and needs some collaboration from the expert to be validated. The first step is extracting the terms, followed by a homogenization of capitals and deleting special characters. In order for the process to be quick, we performed a deletion of stopwords and a process of stemming.
As we mentioned before, getting the variables of the data is a compute-intensive phase because it requires a text parsing. Sequential and parallel execution modes were tested. But the runtime of the sequential algorithm was excessive because it was an iterative process. Therefore, the parallel version with threads was used.
3) Validation of the extracted variablesIn order to validate the goodness of the automatically extracted
variables, collaboration of the expert on the field was needed. For the purpose to make the validation process user-friendly, we implemented a web application called as INDUCCESS (INDUCtion and sucCESS), where several experts may check both Electronic Medical Records and the automatically extracted variables representing each patient.
Fig. 2 shows a screenshot of the web application implemented to make such validation. Inside the application it is possible to navigate through the patients and validate or reject the outcomes from the extraction process.
Fig. 2. Screen to check validation of patients from the web application. Nowadays this application is only available in Spanish Language.
In case of concordance between the automatically extracted variables and what is contained in the patient’s medical history, the application executes the predictive or inference model and issues a result suggested for the patient (No induction, Induction or Caesarea). Among the functionality available in INDUCCESS, it is possible to visualize some statistical data and detailed information on the project, as well as information from the institutions collaborating or even send an email seeking advice.
Validation of the system has been carried out with several incremental and iterative proofs of concept, starting offline and ending online. It is at this last stage that experts from Hospital Universitario de Fuenlabrada take part and access to the web application with the aim of reviewing a random subset of patients. Results obtained from

In Press Special Issue on Big Data and e-Health
- 23 -
this process have been considered satisfactory, rendering an error of 16.83%. However, we keep on working so that the discrepancy between patient variables and the real information should be minimized.
B. Decision-making rulesAs it was mentioned before, there are no tools that support the
expert in decision making within the field of Obstetrics. With the purpose of ameliorating this situation, we built a baseline model to aid decision making processes based on decision rules from a panel of experts on the field, formulated only according to their own clinical knowledge and experience. This baseline model was used to evaluate the effectiveness of variables and to search for other inference models determining which variables are relevant and improve results when predicting success of inducing labour.
An expert system was designed with the help of the CLIPS tool [10]. CLIPS stands out for providing a strategy of forward chaining inference, that is, it starts with an initial evidence and goes on until a solution is reached. Therefore the usual deductive reasoning of the expert was simulated. Within the system, the attributes representing the patients are part of the basis of facts used by the inference engine to check the knowledge base made of decision rules. However, not all features proposed are highly relevant when making decisions of inducing labour. Consequently the expert (obstetrician) sets the initial weights indicating the relevance of each feature and priorities were assigned to rules accordingly, following the same idea of the certainty factors (CF) from the MYCIN system [11]. MYCIN was an expert system to identify bacteria causing severe infections; represents expert reasoning as a set of rules and CF of each rule is defined as the degree of belief in the hypothesis given the evidence [12]. Then, we use the opposite of CF for evidence in rules that contain negations, CF(¬F) ; the minimum of CFs for conjunctions, CF(F1 ˄ F2) ; and the maximum of CFs for disjunctions, CF(F1 ˅ F2). In this project, priorities are calculated using CFs normalized with the equations (1), (2) and (3):
(1)
(2)
(3)
where M = max[weights] , F is the feature that defines the rule and weight (.) is the weight of the feature defined by the expert.
The attributes used and their weights are shown in Table I and it is fulfilled that the greater the value of the weight the greater is the influence of the variable.
After verifying the coherence of the system and eliminating redundant, unnecessary or conflicting rules, the problem is reduced to work with 35 rules.
The application INDUCCESS incorporates the suggested result by the expert system.
C. Machine Learning Techniques
1) Feature selection Typically, there may be some irrelevant or redundant data that, if it
is not deleted before training a machine learning model, performance may be affected. That is one of the reasons why the dimension of the original data should be reduced by selecting the most significant characteristics before using predictive models that support decision making.
table I. WeIghts of attRIbutes pRoposed by the expeRts to develop the baselIne Model
Weights Features
5-6
clinical_picture prom_entrance bishop_score_entrance estimated_fetal_weight fetal_growth gestational_age previous_caesareans
3-4previous_vaginal_births foetus_number reason_previous_caesarean
1-2
bmi_initation amniotic_fluid bpd maternal_size fertility_treatment maternal_age cervicometry complications_pregnancy
0 racesmoking
In the present work, we studied a variety of algorithms for feature selection ReliefF [13], mRMR (minimum Redundancy Maximum Relevance) [14], Gain Ratio and Information Gain attribute evaluation [15], CFS (Correlation Feature based Selection) [16] through the Weka tool [17].
2) Classification algorithmsMachine Learning and Big Data build and study systems that are
able to learn from vast amounts of data and to improve classification and prediction processes. In order for these data to be turned into knowledge, they must be processed and analysed with the models, but every model has its idiosyncrasies, so not all of them are suitable to solve any kind of problem.
In particular, in the medical service decision making processes are critical, as a wrong decision might affect people’ health directly. Therefore, we analyse advantages and disadvantages of each algorithm in the medical practice. We look for models which offer an additional explanation or information justifying the decision, as it may help healthcare specialists gain some knowledge on the given problem. In [18] machine learning techniques and models traditionally applied in medicine are reviewed, and requirements to be fulfilled are collected in order to be successful at this field. However, it is hard to know beforehand which method will be the most suitable one, so we tested several classification algorithms and compared their results in a number of experiments.
a) Naïve Bayes
Naive Bayes [19] is a probabilistic model that uses of Bayes’ theorem in the classifier’s decision rule. The Naive Bayes classifier assumes that all predictor variables are conditionally independent given the class.
Bayesian classifiers are one of the favourites in the medical field because they offer great ability to explain their predictions models. They have a good performance, acceptable noise levels are tolerated and have a good level of transparency although not as much as decision trees.
b) Decision trees
Decision trees are similar to systems based decision rules used to represent and categorize a number of conditions that occur in
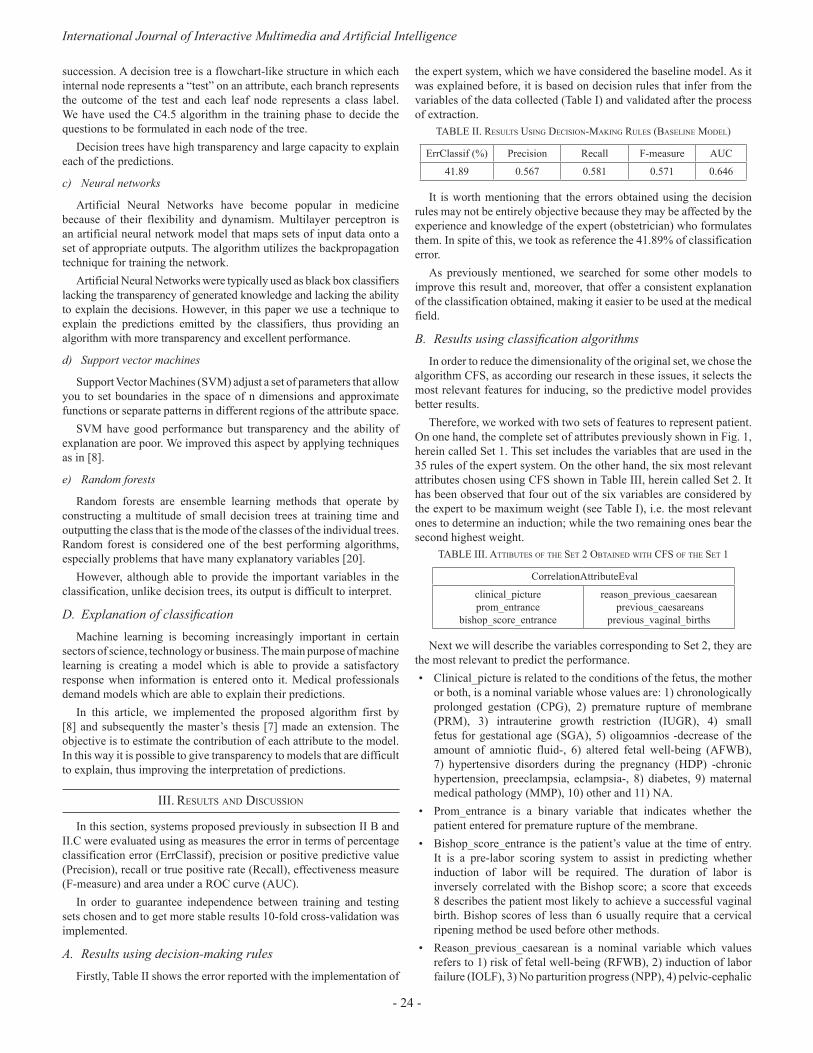
International Journal of Interactive Multimedia and Artificial Intelligence
- 24 -
succession. A decision tree is a flowchart-like structure in which each internal node represents a “test” on an attribute, each branch represents the outcome of the test and each leaf node represents a class label. We have used the C4.5 algorithm in the training phase to decide the questions to be formulated in each node of the tree.
Decision trees have high transparency and large capacity to explain each of the predictions.
c) Neural networks
Artificial Neural Networks have become popular in medicine because of their flexibility and dynamism. Multilayer perceptron is an artificial neural network model that maps sets of input data onto a set of appropriate outputs. The algorithm utilizes the backpropagation technique for training the network.
Artificial Neural Networks were typically used as black box classifiers lacking the transparency of generated knowledge and lacking the ability to explain the decisions. However, in this paper we use a technique to explain the predictions emitted by the classifiers, thus providing an algorithm with more transparency and excellent performance.
d) Support vector machines
Support Vector Machines (SVM) adjust a set of parameters that allow you to set boundaries in the space of n dimensions and approximate functions or separate patterns in different regions of the attribute space.
SVM have good performance but transparency and the ability of explanation are poor. We improved this aspect by applying techniques as in [8].
e) Random forests
Random forests are ensemble learning methods that operate by constructing a multitude of small decision trees at training time and outputting the class that is the mode of the classes of the individual trees. Random forest is considered one of the best performing algorithms, especially problems that have many explanatory variables [20].
However, although able to provide the important variables in the classification, unlike decision trees, its output is difficult to interpret.
D. Explanation of classificationMachine learning is becoming increasingly important in certain
sectors of science, technology or business. The main purpose of machine learning is creating a model which is able to provide a satisfactory response when information is entered onto it. Medical professionals demand models which are able to explain their predictions.
In this article, we implemented the proposed algorithm first by [8] and subsequently the master’s thesis [7] made an extension. The objective is to estimate the contribution of each attribute to the model. In this way it is possible to give transparency to models that are difficult to explain, thus improving the interpretation of predictions.
III. Results and dIscussIon
In this section, systems proposed previously in subsection II B and II.C were evaluated using as measures the error in terms of percentage classification error (ErrClassif), precision or positive predictive value (Precision), recall or true positive rate (Recall), effectiveness measure (F-measure) and area under a ROC curve (AUC).
In order to guarantee independence between training and testing sets chosen and to get more stable results 10-fold cross-validation was implemented.
A. Results using decision-making rulesFirstly, Table II shows the error reported with the implementation of
the expert system, which we have considered the baseline model. As it was explained before, it is based on decision rules that infer from the variables of the data collected (Table I) and validated after the process of extraction.
table II. Results usIng decIsIon-MakIng Rules (baselIne Model)
ErrClassif (%) Precision Recall F-measure AUC
41.89 0.567 0.581 0.571 0.646
It is worth mentioning that the errors obtained using the decision rules may not be entirely objective because they may be affected by the experience and knowledge of the expert (obstetrician) who formulates them. In spite of this, we took as reference the 41.89% of classification error.
As previously mentioned, we searched for some other models to improve this result and, moreover, that offer a consistent explanation of the classification obtained, making it easier to be used at the medical field.
B. Results using classification algorithmsIn order to reduce the dimensionality of the original set, we chose the
algorithm CFS, as according our research in these issues, it selects the most relevant features for inducing, so the predictive model provides better results.
Therefore, we worked with two sets of features to represent patient. On one hand, the complete set of attributes previously shown in Fig. 1, herein called Set 1. This set includes the variables that are used in the 35 rules of the expert system. On the other hand, the six most relevant attributes chosen using CFS shown in Table III, herein called Set 2. It has been observed that four out of the six variables are considered by the expert to be maximum weight (see Table I), i.e. the most relevant ones to determine an induction; while the two remaining ones bear the second highest weight.
table III. attIbutes of the set 2 obtaIned WIth cfs of the set 1
CorrelationAttributeEval
clinical_picture prom_entrance
bishop_score_entrance
reason_previous_caesarean previous_caesareans
previous_vaginal_births
Next we will describe the variables corresponding to Set 2, they are the most relevant to predict the performance.• Clinical_picture is related to the conditions of the fetus, the mother
or both, is a nominal variable whose values are: 1) chronologically prolonged gestation (CPG), 2) premature rupture of membrane (PRM), 3) intrauterine growth restriction (IUGR), 4) small fetus for gestational age (SGA), 5) oligoamnios -decrease of the amount of amniotic fluid-, 6) altered fetal well-being (AFWB), 7) hypertensive disorders during the pregnancy (HDP) -chronic hypertension, preeclampsia, eclampsia-, 8) diabetes, 9) maternal medical pathology (MMP), 10) other and 11) NA.
• Prom_entrance is a binary variable that indicates whether the patient entered for premature rupture of the membrane.
• Bishop_score_entrance is the patient’s value at the time of entry. It is a pre-labor scoring system to assist in predicting whether induction of labor will be required. The duration of labor is inversely correlated with the Bishop score; a score that exceeds 8 describes the patient most likely to achieve a successful vaginal birth. Bishop scores of less than 6 usually require that a cervical ripening method be used before other methods.
• Reason_previous_caesarean is a nominal variable which values refers to 1) risk of fetal well-being (RFWB), 2) induction of labor failure (IOLF), 3) No parturition progress (NPP), 4) pelvic-cephalic
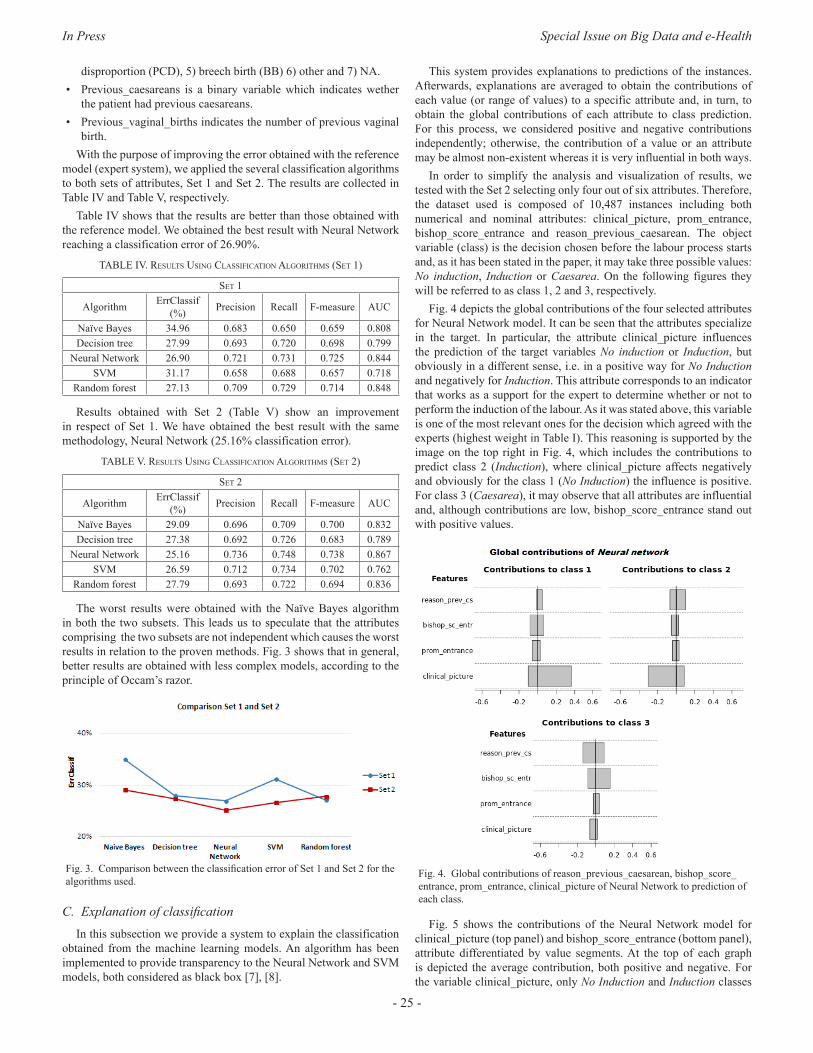
In Press Special Issue on Big Data and e-Health
- 25 -
disproportion (PCD), 5) breech birth (BB) 6) other and 7) NA.• Previous_caesareans is a binary variable which indicates wether
the patient had previous caesareans.• Previous_vaginal_births indicates the number of previous vaginal
birth.With the purpose of improving the error obtained with the reference
model (expert system), we applied the several classification algorithms to both sets of attributes, Set 1 and Set 2. The results are collected in Table IV and Table V, respectively.
Table IV shows that the results are better than those obtained with the reference model. We obtained the best result with Neural Network reaching a classification error of 26.90%.
table Iv. Results usIng classIfIcatIon algoRIthMs (set 1)
set 1
Algorithm ErrClassif (%) Precision Recall F-measure AUC
Naïve Bayes 34.96 0.683 0.650 0.659 0.808Decision tree 27.99 0.693 0.720 0.698 0.799
Neural Network 26.90 0.721 0.731 0.725 0.844SVM 31.17 0.658 0.688 0.657 0.718
Random forest 27.13 0.709 0.729 0.714 0.848
Results obtained with Set 2 (Table V) show an improvement in respect of Set 1. We have obtained the best result with the same methodology, Neural Network (25.16% classification error).
table v. Results usIng classIfIcatIon algoRIthMs (set 2)
set 2
Algorithm ErrClassif (%) Precision Recall F-measure AUC
Naïve Bayes 29.09 0.696 0.709 0.700 0.832Decision tree 27.38 0.692 0.726 0.683 0.789
Neural Network 25.16 0.736 0.748 0.738 0.867SVM 26.59 0.712 0.734 0.702 0.762
Random forest 27.79 0.693 0.722 0.694 0.836
The worst results were obtained with the Naïve Bayes algorithm in both the two subsets. This leads us to speculate that the attributes comprising the two subsets are not independent which causes the worst results in relation to the proven methods. Fig. 3 shows that in general, better results are obtained with less complex models, according to the principle of Occam’s razor.
Fig. 3. Comparison between the classification error of Set 1 and Set 2 for the algorithms used.
C. Explanation of classificationIn this subsection we provide a system to explain the classification
obtained from the machine learning models. An algorithm has been implemented to provide transparency to the Neural Network and SVM models, both considered as black box [7], [8].
This system provides explanations to predictions of the instances. Afterwards, explanations are averaged to obtain the contributions of each value (or range of values) to a specific attribute and, in turn, to obtain the global contributions of each attribute to class prediction. For this process, we considered positive and negative contributions independently; otherwise, the contribution of a value or an attribute may be almost non-existent whereas it is very influential in both ways.
In order to simplify the analysis and visualization of results, we tested with the Set 2 selecting only four out of six attributes. Therefore, the dataset used is composed of 10,487 instances including both numerical and nominal attributes: clinical_picture, prom_entrance, bishop_score_entrance and reason_previous_caesarean. The object variable (class) is the decision chosen before the labour process starts and, as it has been stated in the paper, it may take three possible values: No induction, Induction or Caesarea. On the following figures they will be referred to as class 1, 2 and 3, respectively.
Fig. 4 depicts the global contributions of the four selected attributes for Neural Network model. It can be seen that the attributes specialize in the target. In particular, the attribute clinical_picture influences the prediction of the target variables No induction or Induction, but obviously in a different sense, i.e. in a positive way for No Induction and negatively for Induction. This attribute corresponds to an indicator that works as a support for the expert to determine whether or not to perform the induction of the labour. As it was stated above, this variable is one of the most relevant ones for the decision which agreed with the experts (highest weight in Table I). This reasoning is supported by the image on the top right in Fig. 4, which includes the contributions to predict class 2 (Induction), where clinical_picture affects negatively and obviously for the class 1 (No Induction) the influence is positive. For class 3 (Caesarea), it may observe that all attributes are influential and, although contributions are low, bishop_score_entrance stand out with positive values.
Fig. 4. Global contributions of reason_previous_caesarean, bishop_score_ entrance, prom_entrance, clinical_picture of Neural Network to prediction of each class.
Fig. 5 shows the contributions of the Neural Network model for clinical_picture (top panel) and bishop_score_entrance (bottom panel), attribute differentiated by value segments. At the top of each graph is depicted the average contribution, both positive and negative. For the variable clinical_picture, only No Induction and Induction classes
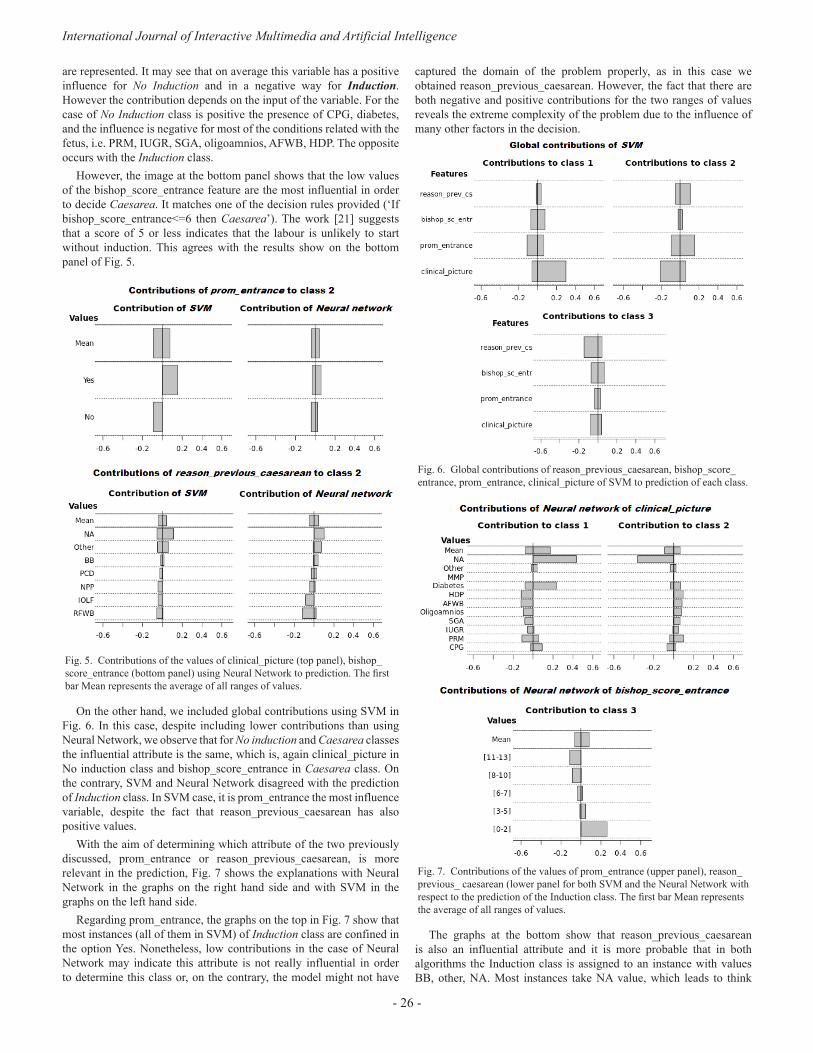
International Journal of Interactive Multimedia and Artificial Intelligence
- 26 -
are represented. It may see that on average this variable has a positive influence for No Induction and in a negative way for Induction. However the contribution depends on the input of the variable. For the case of No Induction class is positive the presence of CPG, diabetes, and the influence is negative for most of the conditions related with the fetus, i.e. PRM, IUGR, SGA, oligoamnios, AFWB, HDP. The opposite occurs with the Induction class.
However, the image at the bottom panel shows that the low values of the bishop_score_entrance feature are the most influential in order to decide Caesarea. It matches one of the decision rules provided (‘If bishop_score_entrance<=6 then Caesarea’). The work [21] suggests that a score of 5 or less indicates that the labour is unlikely to start without induction. This agrees with the results show on the bottom panel of Fig. 5.
Fig. 5. Contributions of the values of clinical_picture (top panel), bishop_score_entrance (bottom panel) using Neural Network to prediction. The first bar Mean represents the average of all ranges of values.
On the other hand, we included global contributions using SVM in Fig. 6. In this case, despite including lower contributions than using Neural Network, we observe that for No induction and Caesarea classes the influential attribute is the same, which is, again clinical_picture in No induction class and bishop_score_entrance in Caesarea class. On the contrary, SVM and Neural Network disagreed with the prediction of Induction class. In SVM case, it is prom_entrance the most influence variable, despite the fact that reason_previous_caesarean has also positive values.
With the aim of determining which attribute of the two previously discussed, prom_entrance or reason_previous_caesarean, is more relevant in the prediction, Fig. 7 shows the explanations with Neural Network in the graphs on the right hand side and with SVM in the graphs on the left hand side.
Regarding prom_entrance, the graphs on the top in Fig. 7 show that most instances (all of them in SVM) of Induction class are confined in the option Yes. Nonetheless, low contributions in the case of Neural Network may indicate this attribute is not really influential in order to determine this class or, on the contrary, the model might not have
captured the domain of the problem properly, as in this case we obtained reason_previous_caesarean. However, the fact that there are both negative and positive contributions for the two ranges of values reveals the extreme complexity of the problem due to the influence of many other factors in the decision.
Fig. 6. Global contributions of reason_previous_caesarean, bishop_score_ entrance, prom_entrance, clinical_picture of SVM to prediction of each class.
Fig. 7. Contributions of the values of prom_entrance (upper panel), reason_previous_ caesarean (lower panel for both SVM and the Neural Network with respect to the prediction of the Induction class. The first bar Mean represents the average of all ranges of values.
The graphs at the bottom show that reason_previous_caesarean is also an influential attribute and it is more probable that in both algorithms the Induction class is assigned to an instance with values BB, other, NA. Most instances take NA value, which leads to think
In Press Special Issue on Big Data and e-Health
- 27 -
that, although the knowledge of the expert tells us that reason_previous_caesarean variable is determinant for a cesarean section, in the absence of this information for a patient (NA value), the prediction of cesarean section is discarded. The prediction is leaning towards any of the two others possible results, in this case we are showing the case of Induction.
All previous contributions prove what the model has learned from training. There is no direct reference to the real distribution of instances in the space of attributes. In some of the situations depicted, the trained models have captured the real domain of the problem properly and contributions, besides explaining how the model works, reflect this field quite accurately.
Iv. conclusIon and futuRe WoRk
In this paper we have designed a system to exploit information compiled in the Electronic Medical Records about pregnancies women. The goal is to extract value out of data.
Five principles were pursued in this project: (1) accuracy, models respond correctly, (2) interpretability, responds to the question why a particular action is recommended, (3) actionable, to reduce patient risk, (4) credible, consistent with what is known in the clinical literature and (5) robust, capable of adopting changes over time and population.
A computer system was built which incorporates two divergent principles. Firstly, a Clinical Decision Support System based on decision rules provided by a panel of experts in Obstetrics and secondly, methodology based on learning techniques, Big Data and algorithms was implemented.
Finally, we have verified that a small number of variables is sufficient to obtain robust models. In addition, attempts have been made to obtain transparency in models or algorithms difficult to interpret and thus be able to obtain new rules of behavior.
Experimental results with this dataset indicate that, if there is no reason why the expert might recommend induction, the result should be No induction. For Induction, it is required that the patient had not had any previous caesarean, or that there has been a premature rupture of membranes (prom) when was admitted. In order for a Caesarea to be determined, typically the Bishop score must be less than 6. These explanations make these models more transparent and may help complement knowledge or discover relationships among data that were so far unnoticed.
The implemented system has proved to be of interest and useful to the expert in decision making. It is not only a new tool for access and validation of clinical information, but a new line of work has been created, where the application developed can be used in clinical practice in real time by expert medical personnel, hoping to improve their results. The applied methodology can be extrapolated to any other branch of Medicine.
acknoWledgMent
The authors are extremely grateful to Hospital Universitario de Fuenlabrada and Instituto de Ingeniería del Conocimiento, Madrid. This work was partially supported by the Spanish CICYT project TIN2013-42351-P.
RefeRences
[1] C. J. Verhoeven et al., “Validation of models that predict Cesarean section after induction of labor,” Ultrasound Obstet Gynecol, vol. 34, no. 3, pp. 316–321, Sep. 2009.
[2] N. Baños, F. Migliorelli, E. Posadas, J. Ferreri, and M. Palacio, “Definition
of Failed Induction of Labor and Its Predictive Factors: Two Unsolved Issues of an Everyday Clinical Situation,” Fetal Diagn Ther, vol. 38, no. 3, pp. 161–169, Jun. 2015.
[3] F. Almachi and S. Lissette, “Eficacia y seguridad de la inducción del trabajo de parto con misoprostol en pacientes con embarazo a término con indicación de inducción y cérvix desfavorable,” Escuela de Obstetricia - Universidad de Guayaquil, 2013.
[4] E. Mozurkewich, J. Chilimigras, E. Koepke, K. Keeton, and V. King, “Indications for induction of labour: a best-evidence review,” BJOG: An International Journal of Obstetrics & Gynaecology, vol. 116, no. 5, pp. 626-636, Apr. 2009.
[5] American College of Obstetricians and Gynecologists, “ACOG Practice Bulletin: Clinical Management Guidelines for Obstetrician- Gynecologists,” Obstet Gynecol, vol. 114 (2 Part 1), no. 107, pp. 386- 397, 2009.
[6] D. F. Lobach et al., “Increasing Complexity in Rule-Based Clinical Decision Support: The Symptom Assessment and Management Intervention,” JMIR Medical Informatics, vol. 4, no. 4, pp. e36, Nov. 2016.
[7] J. D. Sampedro, “Estudio y aplicación de técnicas de aprendizaje automático orientadas al ámbito médico: estimación y explicación de predicciones individuales,” EPS - UAM, 2012.
[8] E. Strumbelj and I. Kononenko, “An eficient explanation of individual classifications using game theory,” Journal of Machine Learning Research, vol. 11, pp. 1-18, 2010.
[9] “Cerner Selene Hospitales,” 2015. [Online]. Available: http://www.cerner.com/Soluciones/Sistemas-de-Informacion/Cerner- Selene/Selene-Hospitales/?LangType=1034 [Accessed 18 Feb. 2016].
[10] “CLIPS, NASA Johnson Space Center Std.,” 1984. [Online]. Available: http://clipsrules.sourceforge.net/ [Accessed 7 Apr. 2016].
[11] B. Buchanan and E. Shortliffe, “Rule-based expert systems: the MYCIN experiments of the Stanford heuristic programming project,” Addison- Wesley, NY, vol. 18, pp. 14-3, 1984.
[12] A. J. Gonzalez and D. D. Dankel, The engineering of knowledge-based systems: theory and practice. Prentice-Hall, Inc., 1993.
[13] I. Kononenko, “Estimating attributes: analysis and extensions of RELIEF,” in Machine Learning: ECML-94. Springer, 1994, pp. 171- 182.
[14] C. Ding and H. Peng, “Minimum redundancy feature selection from microarray gene expression data,” Journal of bioinformatics and computational biology, vol. 3, no. 02, pp. 185-205, Apr. 2005.
[15] A. Roy et al., “A comparative study of feature ranking methods in recognition of handwritten numerals,” in Artificial Intelligence and Evolutionary Algorithms in Engineering Systems, Springer, New Delhi, 2015, pp. 473-479.
[16] M. A. Hall, “Correlation-based feature selection for machine learning,” The University of Waikato, 1999.
[17] M. Hall et al., “The WEKA data mining software: an update,” ACM SIGKDD explorations newsletter, vol. 11, no. 1, pp. 10-18, Nov. 2009.
[18] I. Kononenko, “Machine learning for medical diagnosis: history, state of the art and perspective,” Artificial Intelligence in medicine, vol. 23, no. 1, pp. 89-109, Aug. 2001.
[19] D. A. Morales et al., “Bayesian classification for the selection of in vitro human embryos using morphological and clinical data,” Computer methods and programs in biomedicine, vol. 90, no. 2, pp. 104-116, 2008.
[20] L. Breiman, “Random forests,” Machine learning, vol. 45, no. 1, pp. 5- 32, Oct. 2001.
[21] J. Tenore, “Methods for cervical ripening and induction of labor,” American family physician, vol. 67, no. 10, pp. 2123-2128, May. 2003.

International Journal of Interactive Multimedia and Artificial Intelligence
- 28 -
Cristina Pruenza García-Hinojosa has a Degree in Mathematics and Computer Engineering from Universidad Autónoma de Madrid (2009-2014) and she has got a Master’s Degree in Computer Engineering and a Master’s Degree in ICT Research and Innovation in Computational Intelligence at the Polytechnic School, Universidad Autónoma de Madrid (2014-2016). She is currently data analyst at the Instituto de Ingeniería del Conocimiento
(IIC-UAM) in the Health and Energy Predictive Analytics group, where she is currently working in the following innovation lines: Big Data, modelling, data analysis, evaluation of wind production forecasting, e- Health among others. Pruenza García-Hinojosa has participated in several projects related to e-Health and in the ADNI project research on Alzheimer’s and some possible tools to treat MRIs.
Maria Teulón is Doctor of Medicine and Surgery, Gynecology and Obstetrics Specialist and bi-Master Health System and Hospital Management. At present, she is the Coordinator of Gynecology and Obstetrics Dept at, University Fuenlabrada Hospital, Madrid (Spain). She has spent most of her career as a specialist in Obstetrics and Fetal Medicine. She has participated in several research projects in this interest area, highlighting: Fetal Mvision-
MIT Project (Placental RNM) or Standards of Appropiateness Use of Caesarean Section (support tool in clinical decision making).
Luis Lechuga-Suárez received the B.Sc. degree in physics from the Universidad Complutense, Madrid, Spain, in 1988. He was Certified in HL7 2.x by the International Standards Organization HL7.ORG. After developing his career in the IT Department at several companies like Telefonica Spain and Madrid Stock Exchange, he has been responsible for Systems, Communications, and Integrations at Fuenlabrada University Hospital, Madrid, Spain, since 2003, where he
also leads the ICT R&D section. He has participated in the implementation, standardization, interoperability and Big Data projects of electronic health records.
Julia Díaz is Ms Degree in Mathematics, PhD in Computer Science both from Universidad Autónoma de Madrid (UAM-Spain) and General Management Program from IESE-Universidad de Navarra (Spain). At present she is Senior Innovation Manager in a private R&D+i institution named Instituto de Ingeniería del Conocimiento (IIC-UAM) dedicated to extracting knowledge on the basis of high volumes of heterogeneous data (Big Data) and
optimizing business processes in areas such as healthcare and energy. She also is Part Time PhD Professor in Computer Sciences in the UAM and Professor in Big Data & Data Sciences Master in UAM and ESADE.
Ana González is Ms Degree in Chemistry and PhD in Computer Science both from Universidad Autónoma de Madrid (UAM-Spain). At present she is Lecturer at the Department of Computer Science of the Escuela Politecnica Superior (EPS) at UAM. She is also a member of the Automatic Learning Research Group at the EPS which performs research on Machine Learning and Data Mining applications. Dr. González is also collaborating with a
private R&D+i institution named Instituto de Ingeniería del Conocimiento (IIC-UAM) in the area of healthcare.
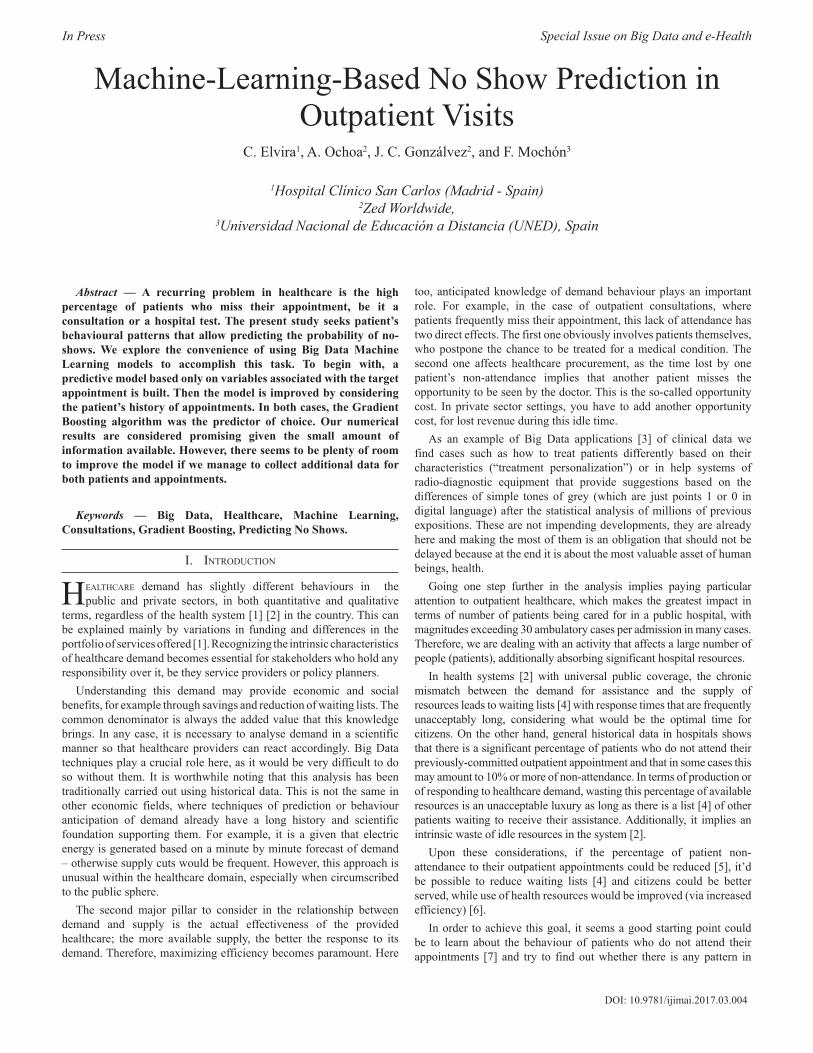
In Press Special Issue on Big Data and e-Health
DOI: 10.9781/ijimai.2017.03.004
Machine-Learning-Based No Show Prediction in Outpatient Visits
C. Elvira1, A. Ochoa2, J. C. Gonzálvez2, and F. Mochón3
1Hospital Clínico San Carlos (Madrid - Spain) 2Zed Worldwide,
3Universidad Nacional de Educación a Distancia (UNED), Spain
Abstract — A recurring problem in healthcare is the high
percentage of patients who miss their appointment, be it a
consultation or a hospital test. The present study seeks patient’s
behavioural patterns that allow predicting the probability of no-
shows. We explore the convenience of using Big Data Machine
Learning models to accomplish this task. To begin with, a
predictive model based only on variables associated with the target
appointment is built. Then the model is improved by considering
the patient’s history of appointments. In both cases, the Gradient
Boosting algorithm was the predictor of choice. Our numerical
results are considered promising given the small amount of
information available. However, there seems to be plenty of room
to improve the model if we manage to collect additional data for
both patients and appointments.
Keywords — Big Data, Healthcare, Machine Learning,
Consultations, Gradient Boosting, Predicting No Shows.
I. IntRoductIon
healthcaRe demand has slightly different behaviours in the public and private sectors, in both quantitative and qualitative
terms, regardless of the health system [1] [2] in the country. This can be explained mainly by variations in funding and differences in the portfolio of services offered [1]. Recognizing the intrinsic characteristics of healthcare demand becomes essential for stakeholders who hold any responsibility over it, be they service providers or policy planners.
Understanding this demand may provide economic and social benefits, for example through savings and reduction of waiting lists. The common denominator is always the added value that this knowledge brings. In any case, it is necessary to analyse demand in a scientific manner so that healthcare providers can react accordingly. Big Data techniques play a crucial role here, as it would be very difficult to do so without them. It is worthwhile noting that this analysis has been traditionally carried out using historical data. This is not the same in other economic fields, where techniques of prediction or behaviour anticipation of demand already have a long history and scientific foundation supporting them. For example, it is a given that electric energy is generated based on a minute by minute forecast of demand – otherwise supply cuts would be frequent. However, this approach is unusual within the healthcare domain, especially when circumscribed to the public sphere.
The second major pillar to consider in the relationship between demand and supply is the actual effectiveness of the provided healthcare; the more available supply, the better the response to its demand. Therefore, maximizing efficiency becomes paramount. Here
too, anticipated knowledge of demand behaviour plays an important role. For example, in the case of outpatient consultations, where patients frequently miss their appointment, this lack of attendance has two direct effects. The first one obviously involves patients themselves, who postpone the chance to be treated for a medical condition. The second one affects healthcare procurement, as the time lost by one patient’s non-attendance implies that another patient misses the opportunity to be seen by the doctor. This is the so-called opportunity cost. In private sector settings, you have to add another opportunity cost, for lost revenue during this idle time.
As an example of Big Data applications [3] of clinical data we find cases such as how to treat patients differently based on their characteristics (“treatment personalization”) or in help systems of radio-diagnostic equipment that provide suggestions based on the differences of simple tones of grey (which are just points 1 or 0 in digital language) after the statistical analysis of millions of previous expositions. These are not impending developments, they are already here and making the most of them is an obligation that should not be delayed because at the end it is about the most valuable asset of human beings, health.
Going one step further in the analysis implies paying particular attention to outpatient healthcare, which makes the greatest impact in terms of number of patients being cared for in a public hospital, with magnitudes exceeding 30 ambulatory cases per admission in many cases. Therefore, we are dealing with an activity that affects a large number of people (patients), additionally absorbing significant hospital resources.
In health systems [2] with universal public coverage, the chronic mismatch between the demand for assistance and the supply of resources leads to waiting lists [4] with response times that are frequently unacceptably long, considering what would be the optimal time for citizens. On the other hand, general historical data in hospitals shows that there is a significant percentage of patients who do not attend their previously-committed outpatient appointment and that in some cases this may amount to 10% or more of non-attendance. In terms of production or of responding to healthcare demand, wasting this percentage of available resources is an unacceptable luxury as long as there is a list [4] of other patients waiting to receive their assistance. Additionally, it implies an intrinsic waste of idle resources in the system [2].
Upon these considerations, if the percentage of patient non-attendance to their outpatient appointments could be reduced [5], it’d be possible to reduce waiting lists [4] and citizens could be better served, while use of health resources would be improved (via increased efficiency) [6].
In order to achieve this goal, it seems a good starting point could be to learn about the behaviour of patients who do not attend their appointments [7] and try to find out whether there is any pattern in
International Journal of Interactive Multimedia and Artificial Intelligence
- 30 -
their behaviour [8] [9] which then allows to carry out specific actions for each detected population strata. Until not so long ago, there were no technological tools available for the analysis of data related to predictive stratified studies on non-attendance, since databases are large (they can exceed one million annual appointments for a large hospital). The emergence of Big Data techniques [3] in recent years has made it possible to carry out these studies - a clear example of their usefulness in real life.
This article is structured in the following sections. Firstly, a description of the available information is presented. The next section discusses the operation of a predictive model which includes, as explanatory variables, the information related to medical appointments of different patients. Aiming to improve the results, the following section provides the model with the available data on the previous appointments that a patient has had. This information is used to construct a second predictive model. Next, the training of the model is carried out to try to improve prediction accuracy. The last section presents the work conclusions and discusses possible lines of research to try to improve the results.
II. descRIptIon of avaIlable InfoRMatIon
This research lays out a study carried out in a university hospital [10] [11] in Madrid, the San Carlos Clinical Hospital. The hospital provides practically all clinical specialties and an outpatient activity. Consequently, it processes about eight hundred thousand outpatient consultations a year and, additionally, must perform a similar number of outpatient diagnoses (radiological, analytical, day hospital sessions, ambulatory surgical procedures, etc.).
We’d like to thank this hospital for its spirit of improvement and research, for facilitating data for the study while maintaining the absolute anonymity of all records used and the strict compliance with the legislation on personal data protection. A retrospective study of at least one year is therefore proposed with all available records from the field of consultations and examinations to identify whether there is any pattern that defines the behaviour of patients who do not attend their scheduled appointment. This way, strategies for action and improvement on specific groups could be defined, taking into account the already mentioned positive repercussions on efficiency, performance and benefits for the patient.
There are two data sets with information on medical appointments of different patients from January 2015 to September 2016. One of the data sets refers to the ancillary appointments that precede diagnosis and the other one to consultations.
Consultations are acts in which there is the intervention of the patient and medical staff, basically a doctor, with a diagnosis purpose or clinical follow-up. Ancillary processes are acts that are usually related to technological equipment for diagnosis, although a doctor interpretation may be necessary later on.
We can define appointment as the information regarding an attendance commitment for a date, time and place / assistance device. A consultation as the act of assistance with purpose of diagnosis or follow-up of a clinical process carried out by health personnel.
Both data sets contain the following information:• Patient identifier (unique alphanumeric sequence that guarantees
patient anonymity).• Demographic: gender and age.• Date and time when the appointment is requested and when it
actually takes place.• Region (province) and place of the appointment.• Medical speciality and type of appointment (monographic or not).
• Type of appointment (first appointment, review, prevention).• Whether the patient attends or not.
Analysing the data set we proceed to delete the province, since it remains constant, and to add the CONSULTATION variable to indicate when an appointment belongs to the first or second data set.
Both data sets are then pre-processed, eliminating incomplete records, solving inconsistencies and correcting errors (for example, date formats). After this set of operations and the merging of both data sets, a combined data set with 2,362,850 records (one record per appointment) is obtained. Each record contains the following 12 variables:• ‘PATIENT ID’,• ‘GENDER’• ‘AGE’,• ‘APPOINTMENT DATE’,• ‘APPOINTMENT TIME ‘,• ‘DATE_REQUEST’,• ‘MEDICAL_SPECIALITY’,• ‘MONOGRAPHIC’,• ‘APPOINTMENT_TYPE’,• ‘CONSULTATION’,• ‘CENTER’ (different building where the patient will be attended)• ‘ACCOMPLISHED’.
III. constRuctIon of a pRedIctIve Model
Starting from this final data set, a predictive model [12] is constructed in order to predict the value of the ACCOMPLISHED variable, which reflects, based on the remaining variables, whether the patient attends the appointment or not.
Regarding the prediction we want to make, we may find three possible scenarios:
1. Patients who had previously requested an appointment and attend the doctor´s consultation.
2. Patients who had previously requested an appointment and do NOT attend the consultation.
3. Patients who had previously NOT requested the appointment and attend the doctor´s consultation.
Table 1 shows the figures and percentages of each of the cases previously mentioned.table I. patIents classIfIcatIon accoRdIng to WhetheR oR not they attend
the appoIntMent and If they do It WIthout appoIntMent
# Class # Consultations %
1 Show 1.997.090 85%
2 No Show 237.029 10%
3 Show without appointment 128.731 5%
Total 2.362.850 100%
Case 3 is excluded from our analysis since it would not make sense to try to predict the attendance of patients who have not requested an appointment, as we would not have information about them. Eliminating Case 3 records from the data set leaves 2,234,119 records, 90% of which correspond to patients who previously requested an appointment and attended it. The remaining 10% corresponds to patients who previously requested an appointment but failed to attend. That is, we are facing a classification problem in which classes are very unbalanced.
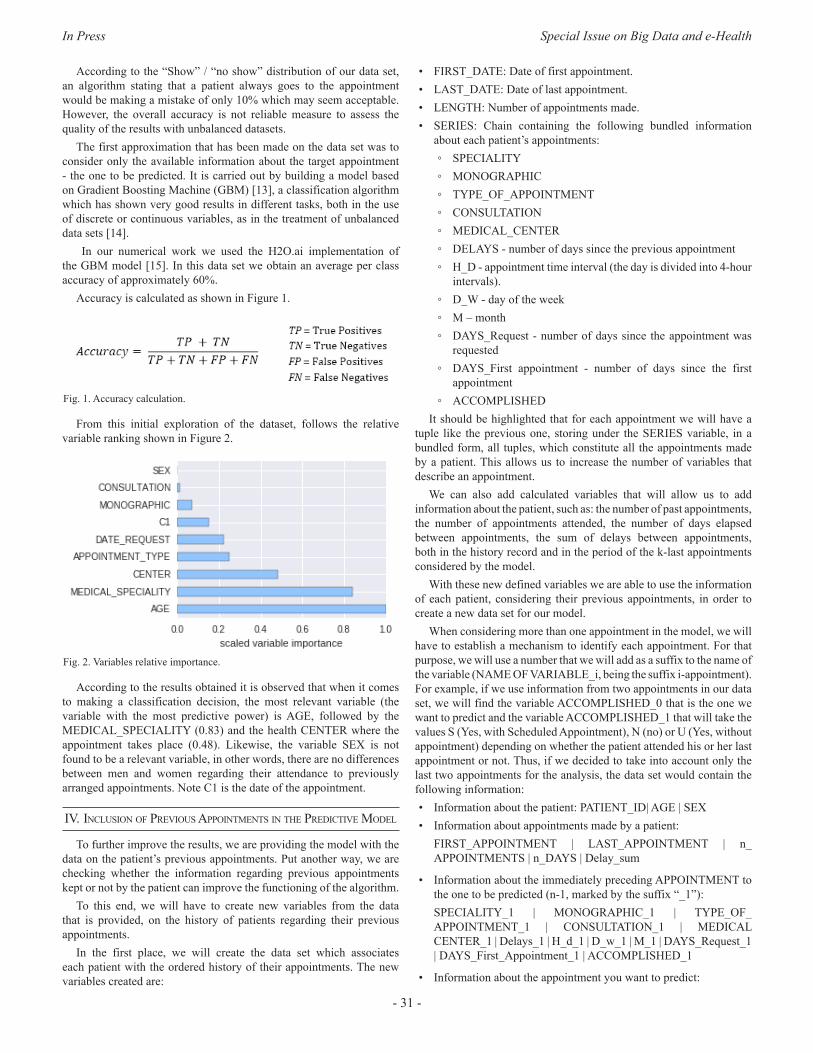
In Press Special Issue on Big Data and e-Health
- 31 -
According to the “Show” / “no show” distribution of our data set, an algorithm stating that a patient always goes to the appointment would be making a mistake of only 10% which may seem acceptable. However, the overall accuracy is not reliable measure to assess the quality of the results with unbalanced datasets.
The first approximation that has been made on the data set was to consider only the available information about the target appointment - the one to be predicted. It is carried out by building a model based on Gradient Boosting Machine (GBM) [13], a classification algorithm which has shown very good results in different tasks, both in the use of discrete or continuous variables, as in the treatment of unbalanced data sets [14].
In our numerical work we used the H2O.ai implementation of the GBM model [15]. In this data set we obtain an average per class accuracy of approximately 60%.
Accuracy is calculated as shown in Figure 1.
Fig. 1. Accuracy calculation.
From this initial exploration of the dataset, follows the relative variable ranking shown in Figure 2.
Fig. 2. Variables relative importance.
According to the results obtained it is observed that when it comes to making a classification decision, the most relevant variable (the variable with the most predictive power) is AGE, followed by the MEDICAL_SPECIALITY (0.83) and the health CENTER where the appointment takes place (0.48). Likewise, the variable SEX is not found to be a relevant variable, in other words, there are no differences between men and women regarding their attendance to previously arranged appointments. Note C1 is the date of the appointment.
Iv. InclusIon of pRevIous appoIntMents In the pRedIctIve Model
To further improve the results, we are providing the model with the data on the patient’s previous appointments. Put another way, we are checking whether the information regarding previous appointments kept or not by the patient can improve the functioning of the algorithm.
To this end, we will have to create new variables from the data that is provided, on the history of patients regarding their previous appointments.
In the first place, we will create the data set which associates each patient with the ordered history of their appointments. The new variables created are:
• FIRST_DATE: Date of first appointment.• LAST_DATE: Date of last appointment.• LENGTH: Number of appointments made.• SERIES: Chain containing the following bundled information
about each patient’s appointments: ◦ SPECIALITY ◦ MONOGRAPHIC ◦ TYPE_OF_APPOINTMENT ◦ CONSULTATION ◦ MEDICAL_CENTER ◦ DELAYS - number of days since the previous appointment ◦ H_D - appointment time interval (the day is divided into 4-hour
intervals). ◦ D_W - day of the week ◦ M – month ◦ DAYS_Request - number of days since the appointment was
requested ◦ DAYS_First appointment - number of days since the first
appointment ◦ ACCOMPLISHED
It should be highlighted that for each appointment we will have a tuple like the previous one, storing under the SERIES variable, in a bundled form, all tuples, which constitute all the appointments made by a patient. This allows us to increase the number of variables that describe an appointment.
We can also add calculated variables that will allow us to add information about the patient, such as: the number of past appointments, the number of appointments attended, the number of days elapsed between appointments, the sum of delays between appointments, both in the history record and in the period of the k-last appointments considered by the model.
With these new defined variables we are able to use the information of each patient, considering their previous appointments, in order to create a new data set for our model.
When considering more than one appointment in the model, we will have to establish a mechanism to identify each appointment. For that purpose, we will use a number that we will add as a suffix to the name of the variable (NAME OF VARIABLE_i, being the suffix i-appointment). For example, if we use information from two appointments in our data set, we will find the variable ACCOMPLISHED_0 that is the one we want to predict and the variable ACCOMPLISHED_1 that will take the values S (Yes, with Scheduled Appointment), N (no) or U (Yes, without appointment) depending on whether the patient attended his or her last appointment or not. Thus, if we decided to take into account only the last two appointments for the analysis, the data set would contain the following information:• Information about the patient: PATIENT_ID| AGE | SEX• Information about appointments made by a patient:
FIRST_APPOINTMENT | LAST_APPOINTMENT | n_APPOINTMENTS | n_DAYS | Delay_sum
• Information about the immediately preceding APPOINTMENT to the one to be predicted (n-1, marked by the suffix “_1”):SPECIALITY_1 | MONOGRAPHIC_1 | TYPE_OF_APPOINTMENT_1 | CONSULTATION_1 | MEDICAL CENTER_1 | Delays_1 | H_d_1 | D_w_1 | M_1 | DAYS_Request_1 | DAYS_First_Appointment_1 | ACCOMPLISHED_1
• Information about the appointment you want to predict:
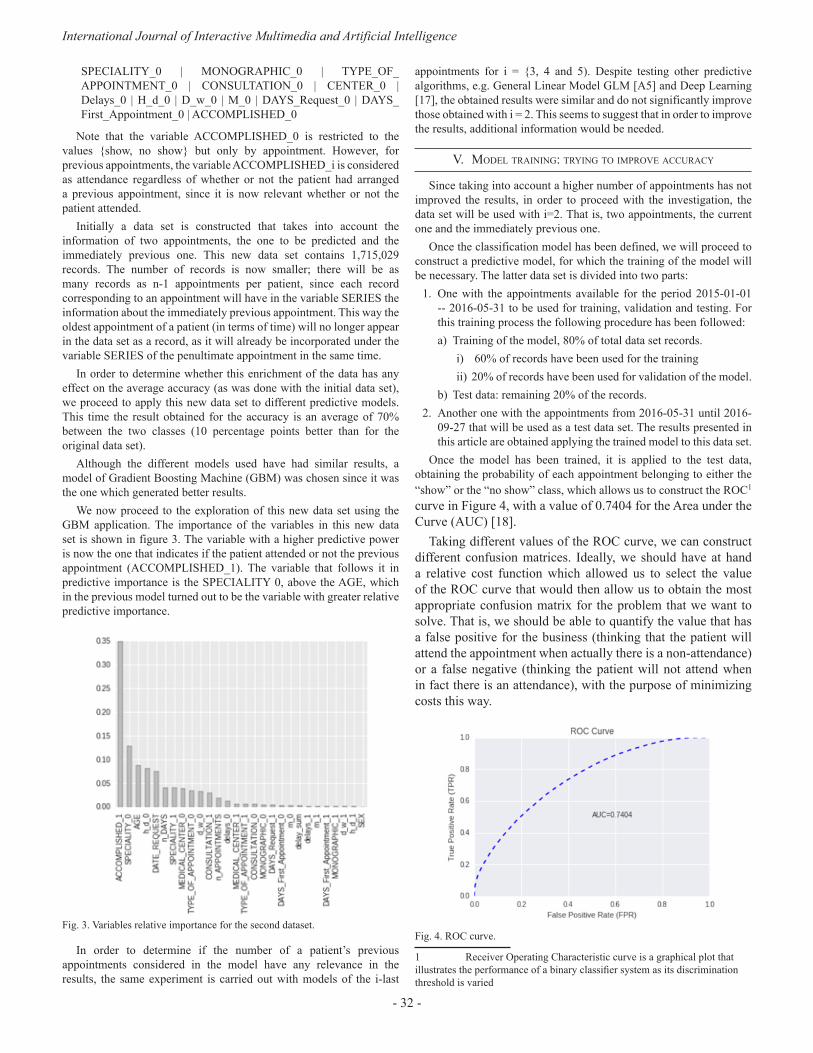
International Journal of Interactive Multimedia and Artificial Intelligence
- 32 -
SPECIALITY_0 | MONOGRAPHIC_0 | TYPE_OF_APPOINTMENT_0 | CONSULTATION_0 | CENTER_0 | Delays_0 | H_d_0 | D_w_0 | M_0 | DAYS_Request_0 | DAYS_First_Appointment_0 | ACCOMPLISHED_0
Note that the variable ACCOMPLISHED_0 is restricted to the values {show, no show} but only by appointment. However, for previous appointments, the variable ACCOMPLISHED_i is considered as attendance regardless of whether or not the patient had arranged a previous appointment, since it is now relevant whether or not the patient attended.
Initially a data set is constructed that takes into account the information of two appointments, the one to be predicted and the immediately previous one. This new data set contains 1,715,029 records. The number of records is now smaller; there will be as many records as n-1 appointments per patient, since each record corresponding to an appointment will have in the variable SERIES the information about the immediately previous appointment. This way the oldest appointment of a patient (in terms of time) will no longer appear in the data set as a record, as it will already be incorporated under the variable SERIES of the penultimate appointment in the same time.
In order to determine whether this enrichment of the data has any effect on the average accuracy (as was done with the initial data set), we proceed to apply this new data set to different predictive models. This time the result obtained for the accuracy is an average of 70% between the two classes (10 percentage points better than for the original data set).
Although the different models used have had similar results, a model of Gradient Boosting Machine (GBM) was chosen since it was the one which generated better results.
We now proceed to the exploration of this new data set using the GBM application. The importance of the variables in this new data set is shown in figure 3. The variable with a higher predictive power is now the one that indicates if the patient attended or not the previous appointment (ACCOMPLISHED_1). The variable that follows it in predictive importance is the SPECIALITY 0, above the AGE, which in the previous model turned out to be the variable with greater relative predictive importance.
Fig. 3. Variables relative importance for the second dataset.
In order to determine if the number of a patient’s previous appointments considered in the model have any relevance in the results, the same experiment is carried out with models of the i-last
appointments for i = {3, 4 and 5). Despite testing other predictive algorithms, e.g. General Linear Model GLM [A5] and Deep Learning [17], the obtained results were similar and do not significantly improve those obtained with i = 2. This seems to suggest that in order to improve the results, additional information would be needed.
v. Model tRaInIng: tRyIng to IMpRove accuRacy
Since taking into account a higher number of appointments has not improved the results, in order to proceed with the investigation, the data set will be used with i=2. That is, two appointments, the current one and the immediately previous one.
Once the classification model has been defined, we will proceed to construct a predictive model, for which the training of the model will be necessary. The latter data set is divided into two parts:
1. One with the appointments available for the period 2015-01-01 -- 2016-05-31 to be used for training, validation and testing. For this training process the following procedure has been followed:a) Training of the model, 80% of total data set records.
i) 60% of records have been used for the trainingii) 20% of records have been used for validation of the model.
b) Test data: remaining 20% of the records. 2. Another one with the appointments from 2016-05-31 until 2016-
09-27 that will be used as a test data set. The results presented in this article are obtained applying the trained model to this data set.
Once the model has been trained, it is applied to the test data, obtaining the probability of each appointment belonging to either the “show” or the “no show” class, which allows us to construct the ROC1 curve in Figure 4, with a value of 0.7404 for the Area under the Curve (AUC) [18].
Taking different values of the ROC curve, we can construct different confusion matrices. Ideally, we should have at hand a relative cost function which allowed us to select the value of the ROC curve that would then allow us to obtain the most appropriate confusion matrix for the problem that we want to solve. That is, we should be able to quantify the value that has a false positive for the business (thinking that the patient will attend the appointment when actually there is a non-attendance) or a false negative (thinking the patient will not attend when in fact there is an attendance), with the purpose of minimizing costs this way.
Fig. 4. ROC curve.
1 Receiver Operating Characteristic curve is a graphical plot that illustrates the performance of a binary classifier system as its discrimination threshold is varied
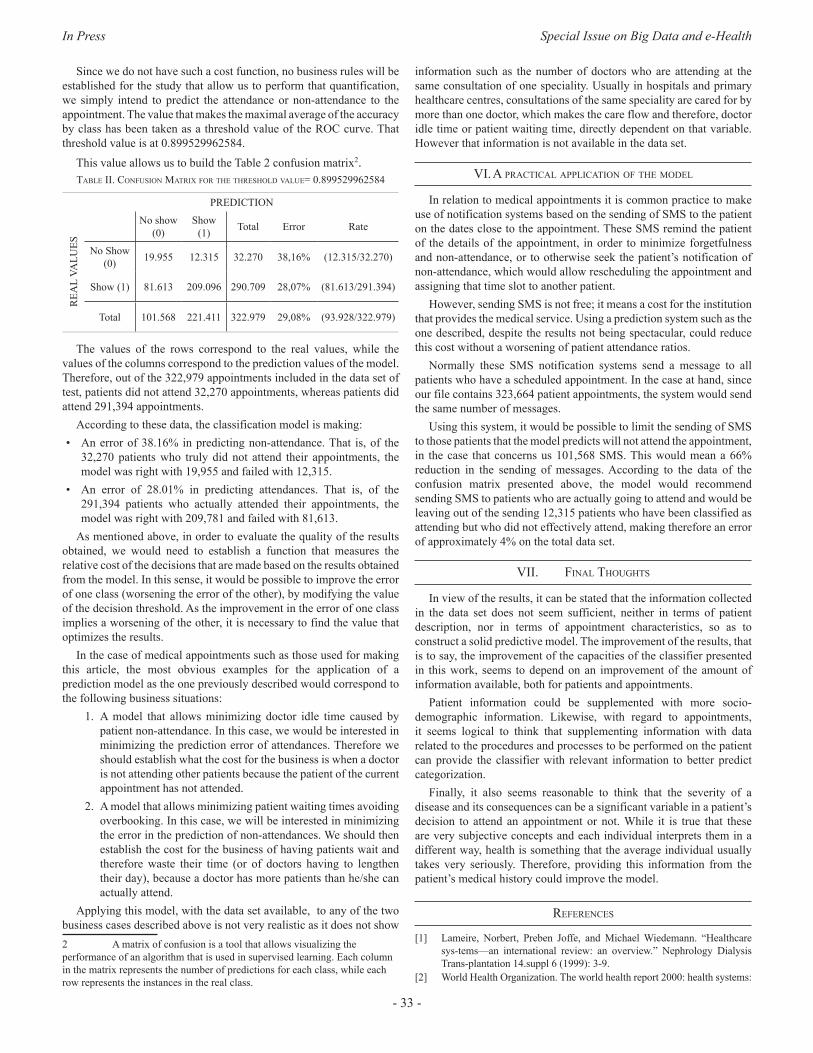
In Press Special Issue on Big Data and e-Health
- 33 -
Since we do not have such a cost function, no business rules will be established for the study that allow us to perform that quantification, we simply intend to predict the attendance or non-attendance to the appointment. The value that makes the maximal average of the accuracy by class has been taken as a threshold value of the ROC curve. That threshold value is at 0.899529962584.
This value allows us to build the Table 2 confusion matrix2.table II. confusIon MatRIx foR the thReshold value= 0.899529962584
PREDICTION
REA
L VA
LUES
No show (0)
Show (1) Total Error Rate
No Show (0) 19.955 12.315 32.270 38,16% (12.315/32.270)
Show (1) 81.613 209.096 290.709 28,07% (81.613/291.394)
Total 101.568 221.411 322.979 29,08% (93.928/322.979)
The values of the rows correspond to the real values, while the values of the columns correspond to the prediction values of the model. Therefore, out of the 322,979 appointments included in the data set of test, patients did not attend 32,270 appointments, whereas patients did attend 291,394 appointments.
According to these data, the classification model is making:• An error of 38.16% in predicting non-attendance. That is, of the
32,270 patients who truly did not attend their appointments, the model was right with 19,955 and failed with 12,315.
• An error of 28.01% in predicting attendances. That is, of the 291,394 patients who actually attended their appointments, the model was right with 209,781 and failed with 81,613.
As mentioned above, in order to evaluate the quality of the results obtained, we would need to establish a function that measures the relative cost of the decisions that are made based on the results obtained from the model. In this sense, it would be possible to improve the error of one class (worsening the error of the other), by modifying the value of the decision threshold. As the improvement in the error of one class implies a worsening of the other, it is necessary to find the value that optimizes the results.
In the case of medical appointments such as those used for making this article, the most obvious examples for the application of a prediction model as the one previously described would correspond to the following business situations:
1. A model that allows minimizing doctor idle time caused by patient non-attendance. In this case, we would be interested in minimizing the prediction error of attendances. Therefore we should establish what the cost for the business is when a doctor is not attending other patients because the patient of the current appointment has not attended.
2. A model that allows minimizing patient waiting times avoiding overbooking. In this case, we will be interested in minimizing the error in the prediction of non-attendances. We should then establish the cost for the business of having patients wait and therefore waste their time (or of doctors having to lengthen their day), because a doctor has more patients than he/she can actually attend.
Applying this model, with the data set available, to any of the two business cases described above is not very realistic as it does not show 2 A matrix of confusion is a tool that allows visualizing the performance of an algorithm that is used in supervised learning. Each column in the matrix represents the number of predictions for each class, while each row represents the instances in the real class.
information such as the number of doctors who are attending at the same consultation of one speciality. Usually in hospitals and primary healthcare centres, consultations of the same speciality are cared for by more than one doctor, which makes the care flow and therefore, doctor idle time or patient waiting time, directly dependent on that variable. However that information is not available in the data set.
vI. a pRactIcal applIcatIon of the Model
In relation to medical appointments it is common practice to make use of notification systems based on the sending of SMS to the patient on the dates close to the appointment. These SMS remind the patient of the details of the appointment, in order to minimize forgetfulness and non-attendance, or to otherwise seek the patient’s notification of non-attendance, which would allow rescheduling the appointment and assigning that time slot to another patient.
However, sending SMS is not free; it means a cost for the institution that provides the medical service. Using a prediction system such as the one described, despite the results not being spectacular, could reduce this cost without a worsening of patient attendance ratios.
Normally these SMS notification systems send a message to all patients who have a scheduled appointment. In the case at hand, since our file contains 323,664 patient appointments, the system would send the same number of messages.
Using this system, it would be possible to limit the sending of SMS to those patients that the model predicts will not attend the appointment, in the case that concerns us 101,568 SMS. This would mean a 66% reduction in the sending of messages. According to the data of the confusion matrix presented above, the model would recommend sending SMS to patients who are actually going to attend and would be leaving out of the sending 12,315 patients who have been classified as attending but who did not effectively attend, making therefore an error of approximately 4% on the total data set.
vII. fInal thoughts
In view of the results, it can be stated that the information collected in the data set does not seem sufficient, neither in terms of patient description, nor in terms of appointment characteristics, so as to construct a solid predictive model. The improvement of the results, that is to say, the improvement of the capacities of the classifier presented in this work, seems to depend on an improvement of the amount of information available, both for patients and appointments.
Patient information could be supplemented with more socio-demographic information. Likewise, with regard to appointments, it seems logical to think that supplementing information with data related to the procedures and processes to be performed on the patient can provide the classifier with relevant information to better predict categorization.
Finally, it also seems reasonable to think that the severity of a disease and its consequences can be a significant variable in a patient’s decision to attend an appointment or not. While it is true that these are very subjective concepts and each individual interprets them in a different way, health is something that the average individual usually takes very seriously. Therefore, providing this information from the patient’s medical history could improve the model.
RefeRences
[1] Lameire, Norbert, Preben Joffe, and Michael Wiedemann. “Healthcare sys-tems—an international review: an overview.” Nephrology Dialysis Trans-plantation 14.suppl 6 (1999): 3-9.
[2] World Health Organization. The world health report 2000: health systems:
International Journal of Interactive Multimedia and Artificial Intelligence
- 34 -
improving performance. World Health Organization, 2000.[3] Aldana J, Baldominos A, García JM, Gonzálvez JC, Mochón F, Navas I;
(2.016). “Introducción al Big Data”, Editorial García Maroto Editores SL.[4] Romero E. Granja, et al. “Study of the derivations to an external
consultation of Internal Medicine: can be managed the waiting list?.” Anales de Medicina Interna-Madrid-Órgano Oficial de la Sociedad Española de Medicina Interna-. Vol. 21. No. 2. ARAN, 2004.
[5] Guerrero MA, Gorgemans S. “Absentismo de pacientes citados en las consultas de Atención Especializada del Consorcio Aragonés Sanitario de Alta Resolución: repercusión económica y demoras.” XVI Encuentro de Economía Pública: 5 y 6 de febrero de 2009: Palacio de Congresos de Granada. 2009.
[6] Jabalera ML, Morales JM, Rivas F. “Factores determinantes y coste económico del absentismo de pacientes en consultas externas de la Agencia Sanitaria Costa del Sol.” Anales del Sistema Sanitario de Navarra. Vol. 38. No. 2. Gobierno de Navarra. Departamento de Salud, 2015.
[7] Fonseca E, Vázquez P, Mata P, Pita S, Muiño ML. “Estudio de la inasistencia a las citaciones en consulta en un servicio de dermatología” Piel 2001; 16: 485-489.
[8] Salinas, EA, De la Cruz R, Bastías G. “Inasistencia de pacientes a consultas médicas de especialistas y su relación con indicadores ambientales y socioeconómicos regionales en el sistema de salud público de Chile.” Medwave 14.09 (2014).
[9] Perez M, Rendon MM. Características asociadas con la inasistencia a la consulta de promoción y prevención en salud en una IPS de la Ciudad de Medellín 2016. Diss. 2016.
[10] Giunta D, et al. “Factors associated with nonattendance at clinical medi-cine scheduled outpatient appointments in a university general hospital.” Patient Prefer Adherence 7 (2013): 1163-70.
[11] Pereira-Victorio CJ, et al. “Absentismo de pacientes a la consulta externa es-pecializada en un hospital de tercer nivel en España.” Medicina General y de Familia 5.3 (2016): 83-90.
[12] Max K, Kjell J. “Applied Predictive Modeling”. Springer 2013 Edition. ISBN 978-1-4614-6848-6. DOI 10.1007/978-1-4614-6849-3.
[13] Natekin A, Knoll A. “Gradient boosting machines, a tutorial”. Frontiers in Neurorobotics, December 2013. https://doi.org/10.3389/fnbot.2013.00021.
[14] Teramoto R. “Balanced Gradient Boosting from Imbalanced Data for Clinical Outcome Prediction”. Statistical Applications in Genetics and Molecular Biology. Volume 8, Issue 1, Pages 1–19, ISSN (Online) 1544-6115, DOI: https://doi.org/10.2202/1544-6115.1422, April 2009.
[15] Click C, et al. “Gradient Boosted Models with H2O”. Published by H2O.ai, Inc. 2016.
[16] Nykodym T, et al. “Generalized Linear Modeling with H2O”. Published by H2O.ai, Inc. 2016.
[17] Candel A, et al. “Deep Learning with H2O”. Published by H2O.ai, Inc. 2016.
[18] Provost F, Fawcett T. “Data Science for Business”. O’Reilly Media. July 2013.
Carlos M. Elvira is M.D. since 1.998 from Universidad de Cantabria (Spain) and Ph.D. since 2.012 from Universidad Rey Juan Carlos (Spain). He is currently chief of the “Admission, Codding and Health Information Department” at Hospital Clínico San Carlos (Madrid-Spain). He is also a member of the Public Health and Medicine History Department at the Faculty of Medicine- Universidad Complutense of Madrid as associate professor.
Alberto Ochoa has a PhD. in Computer Science from the International Centre for Informatics and Electronics, Moscow 1992. He is one of the founders of Estimation of Distribution Algorithms (EDAs), a branch of evolutionary computation that combines statistical machine learning and evolutionary theory to build predictive models of objective functions. For over 20 years led research projects in evolutionary optimization, image analysis, complex
networks, parallel and distributed computing, probabilistic graphical models and applications of information and copula theories to optimization and machine learning. Senior Data Scientist at Zed Worldwide during the last three years.
Juan Carlos Gonzalvez has a Bachelor Degree in Chemistry from Universidad Autonoma de Madrid and he’s got an MBA from IE Business School. He counts on more than eighteen years’ experience in Telecom, Technology, Media and Internet sectors. He is currently Chief Innovation Officer at the Zed Worldwide Spanish multinational company, where he is currently working in the following innovation lines: Big Data, Advertising,
Mobile Payments and Mobile Financial Services or Security and Privacy among others. He leads several R&D projects, in collaboration with different European universities, funded by various public and semi-public Spanish and European Institutions, under the multiple existing R&D program aids, like Horizon 2020.
Francisco Mochón has a PhD in economics from the Autonomous University of Madrid and from Indiana University and is a Fulbright scholar. Currently he is full Professor of Economic Analysis at UNED, Madrid. He has been Advisor to the Ministry of Economy and Finance of Spain, Director General of Financial Policy of the Government of Andalusia, CEO of the research firm ESECA and Chief Financial Officer (CFO) of Telefónica
of Spain. He has been the Chairman of the Social Board of the University of Malaga. Currently Prof.dr. Mochón is a member of the advisory committee of U-TAD and member of the advisory committee of the Futures Market of Olive Oil (MFAO). He has published numerous research articles and is the author of more than fifty books on economics, finance and business. Currently his research interests are the Economics of Happiness in the business environment and the Digital Economy. He has been director of the MOOC course “Felicidad y práctica empresarial”.
In Press Special Issue on Big Data and e-Health
DOI: 10.9781/ijimai.2017.03.005
Abstract — Considering that Mexican injuries prevention
strategies have been focused on injuries caused by car accidents
and gender violence, a whole analysis of the injuries registered
are performed in this paper to have a wider overview of those
agents that can cause injuries around the country. Taking into
account the amount of information from both public and private
sources, obtained from dynamic cubes reported by the Minister of
Health, Big Data strategies are used with the objective of finding
an appropriate extraction such as to identify the real correlations
between the different variables registered by the Health Sector.
The results of the analysis show areas of opportunity to improve
the public policies on the subject, particularly in diminishing
wounds at living place, public road (pedestrians) and work.
Keywords — Big Data Applications, Decision Theory, Statistical
Learning.
I. IntRoductIon
In the past, injuries lacked from government and society attention because they were considered as an accident and, consequently,
inevitable [1]. Nowadays, health care literature does not longer contemplate that injuries are inevitable; on the contrary, they can be prevented when their analysis incorporates intentionality [2]. The World Health Organization (WHO) considers that an injury is a physical damage in the human body that results from its exposition to an excess of mechanical, thermal, chemical or radiant energy. Moreover, this organization classifies injuries into two types: i) unintentional injuries, for example, poisoning, road crashes, burns and drowning; and ii) intentional injuries, which are related to violence from a group or self-directed [10].
Given that eight of the 15 leading causes of death are injuries, it is important to recall that injuries have an economic impact of societies and governments [31]. The WHO European region report that around 9% of deaths, and 8% of hospital admissions, are related to some injury. Within the European Union, the number of deaths by an injury is estimated in 520,000, and a quarter of these are related to intentional injuries [3]. In Latin America, injuries represent the 5% of their hospital admissions, but, most interestingly, the mortality rate associated with injuries presents an increasing trend among the population between the ages 20 to 40 [34].
Among Latin American countries, the case of Mexico is relevant because its public health system spends around 6 billion dollars in procedures and treatments related to injuries, which represents 1.7% of Mexican Gross Domestic Product. Specifically, road traffic accidents are the second cause of death in Mexico; and death by some injury is the first cause of death for Mexican population between the ages 30 to 40. It is estimated that 1.1 million of people are involved in some road traffic in a directed or an undirected way [22].
It is important to recall that injuries do not finish with hospital
discharge; most of them generate disabilities that are not well documented because they are not easy to measure. Together with their treatment cost, these disabilities have an adverse impact on individual’s work performance, and in his years of healthy life [6, 22]. Together with a high economic cost, physical disabilities may have negative effects on the people’s productivity. Although the Mexican government has invested time and resources in different public policies oriented to create a prevention culture, they have failed. The Mexican National Academy of Medicine (MNAM) has identified an increasing trend on hospital admissions attributed to car crashes and unintentional injuries at home, but there is no information about injuries caused by another type of lesion agents [5, 13]. Even more, recent empirical evidence demonstrates that prevention policies in Mexico have not had the expected effect [24].
In this sense, research literature, on Mexican injuries, focuses on the estimation of costs and trends related to road traffic accidents and gender violence. Key results from these studies point out that those costs have increased since 2000 and prevention policies have not had a significant effect in diminishing the number of injuries associated with road traffic accidents and gender violence [22, 23]. From a geographical aspect, there are descriptive studies that determine focal points where the probability to be bitten or picketed by an animal is high [25].
Recently, [35] analyzes how the public system in Mexico works. They find a lack of efficiency in the treatment of injuries and diseases due to higher costs and limited accessibility, which points out an urgent necessity to change the public health system [27]. However, as far as our knowledge, there are no formal efforts to develop an integral policy oriented to generate a prevention culture to diminish the number of hospital admissions caused by intentional or unintentional injuries.
In this paper, we show all the factors correlated to injuries from the mexican health system. We analyze the injury database from the Mexican Health Secretary, which includes all relevant information such as the type of injury, agent of the lesion, site of occurrence, among others. So, we show the lesion agent that is strongly correlated with the location of occurrence at each federal entity in Mexico. In this sense, our most important contribution relies on offering some insights in the development of specific prevention policies.
The paper is organized as follows. Section 2 shows a brief literature review about how the applications of Big Data to Health. Section 3 describes the methodology used to the paper to collect analyze the injuries database. Section 4 shows our main results, which are the lesion agents strongly correlated to federal entities and sites of occurrence. Also, we discuss some strategies that can be implemented
II. lIteRatuRe RevIeW
For all, it is well known that Big Data methods are useful for agent’s decision-making processes. Although these analytics have been traditionally used for improving the productivity and efficiency
Development of Injuries Prevention Policies in Mexico: A Big Data Approach
Rosa María Cantón Croda and Damián Emilio Gibaja Romero
Universidad Popular Autónoma del Estado de Puebla, Mexico
International Journal of Interactive Multimedia and Artificial Intelligence
- 36 -
within the business, the public sector has incorporated such methods to analyze a huge amount of data that is generated day by day [27, 29]. There is a broad range of public problems where Big Data analytics have been used successfully. For example, during the US president election in 2012, Big Data methods were used to identify the specific needs of voters in the state of Ohio. So, the political campaign of Barack Obama got the victory in Ohio offering a dinner with George Clooney to women between 40 and 49 years old [4].
Consequently, politicians, governments and policy makers are mainly interested in Big Data analytics because they offer the possibility of designing real time strategies against social and economic problems, and natural disasters as well [20, 32]. In this sense, our paper is closely related to the literature focused on the improvement of lifestyle. This research pursues the monitoring and analysis of social networks data to establish public policies oriented to improve the public health system and present more detailed health economic studies [14].
A. Big Data and HealthGiven that Big Data methods serve to simplify and identify the most
relevant information, researchers and policy makers have pointed out the potential of these techniques in the creation and development of public policies oriented to mitigate or solve specific health problems [11]. Health-care uses Big Data to identify diseases trends and the improvement of life’s quality, while preventable deaths are avoided [6]. The model developed by the Harvard University and the Boston Children’s Hospital in the USA combine epidemiological information and searches in Google to predict influenza outbreaks one or two weeks earlier than the traditional clinical methods [16]. Although this model over-estimates flu trends, policymakers are interested in the improvement of these practices since their success in the treatment and prevention of Ebola. The use of different types if information contributed with the identification of Ebola hotspots, places where the probability of Ebola occurrence is higher. With these findings, governments allocate more efficiently resources and hospital staff in communities with particular necessities [12]. Pakistan registers another case of success in the application of these techniques in the prevention and correct treatment of dengue. Through a software implementation and the analysis of smartphones interaction, the Pakistani government can identify the residential location of dengue mosquitoes. Consequently, there studies that estimates a saving greater than 200 billion dollars, for the US health system, with the application of these kinds of analytics.
The idea behind the identification of particular diseases trends relies on the fact that people who suffer any discomfort usually search on the Internet what disease is related to their symptoms. With a proper analysis of this information through Big Data methods, health institutions can determine the more accurate treatments for patient’s recovery [7]. Even more, the McKinsey Report in 2015 points out that Big Data is transforming the discussion of what is appropriate or inappropriate in diseases treatments that receive a particular population [28]. In other words, with the identification of trends and related factors to specific communities, it is possible to define special treatments based on the characteristics and needs of the community [9]. Consequently, this report identifies the following five contributions of Big Data to health: • Right living. With a correct analysis of information, it is possible
to improve decision making with the promoting of social well-being through the engagement of consumers for their care.
• Right care. In other words, it is possible to identify specific treatments and health resources for each patient.
• Right provider. Together with a Right Care, the identification of particular need by communities contributes to the efficient allocation of Care Providers.
• Right value. An effective allocation of resources enhances health care value together with a reduction of costs. Even more, it is possible to do a continuous evaluation of medical institutions while sustainable objectives are pursued.
• Right innovation. Specific community needs require the enhancement of medicine innovation through research and development. Therefore, this new way of information analysis boosts institutions productivity and enhances public social health.
B. Injuries and Public PolicyGiven the economic and social costs associated with injuries
treatments, there is an increasing interest in the development of prevention public policies through the identification of the factors that causes an injury [30]. Although the measurement of indirect costs is difficult because a large number of disabilities are not attended, it is possible to identify specific features that contribute to a better definition of prevention policies.
The United States is pioneer and leader in the definition of policies oriented to prevent injuries, both intentional and unintentional. Since the 80’s, American researchers identified the necessity of determining the epidemiology associated with injuries for the design of better public policies. In such decade, death by injuries was the leading cause of mortality in the population of ages from 1 to 40. For example, there is evidence that injuries associated with soccer decreased in the period from 2004 to 2009, in a comparison between 1990 to 1996 due to the allocation of extra resources in the development and implementation of policies oriented to promote safe practices in soccer [17].
Also, it is well known that the possession of guns for personal security is the primary cause of firearm injuries in the United States (US), where males from minorities are the population more affected. Since the medical and work costs are estimated in 48 billion of dollars, the US government has designed different prevention strategies to diminish the number of injuries related to guns. There is evidence that these programs have contributed in decreasing the number of unintentional firearm injuries in the last twenty years, but intentional gun injuries have increased in recent years [33]. Even more, empirical studies demonstrate that US cities are safer places than rural counties. Consequently, geographical models built on ARGIS program points out the necessity of allocating resources in the countryside. This kind of studies plots twitter and google searches into dynamic maps [28].
For Mexico, the literature of injuries focuses on gender violence and road traffic accidents. There are biological studies that show hot-spots for animal bites in the federal entity of Veracruz [13]. As far as our knowledge, there are no studies that analyze the factors associated with injuries from a Big Data approach.
III. Methodology
In this work, we analyze data related to injuries following a Big Data approach. Specifically, we follow the method developed by the San Diego Supercomputer Center (SDSC) [7, 31]. This methodology, or data process, is explained in the following subsections.
A. Acquiring DataOne of the most important aspects of the acquisition of information
is to ensure that we have all the data related to our problem. Since injuries have a close relation with health care, we guarantee the previous condition through public databases generated by the Mexican government. Specifically, we get the information from its Ministry of Health, which registers all relevant information related to hospital discharges, injuries, deaths, births, urgencies, population, health resources and health services in the so-called dynamic cubes. So, the injuries cube presents information on injuries such as periodicity and
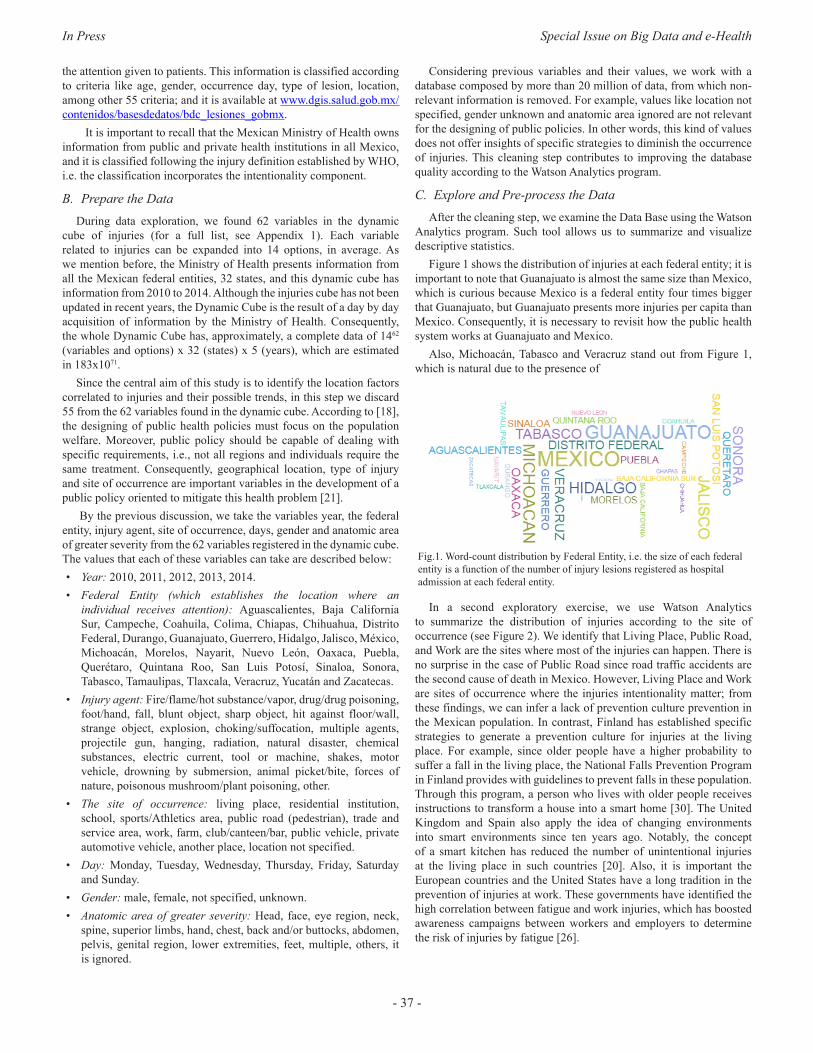
In Press Special Issue on Big Data and e-Health
- 37 -
the attention given to patients. This information is classified according to criteria like age, gender, occurrence day, type of lesion, location, among other 55 criteria; and it is available at www.dgis.salud.gob.mx/contenidos/basesdedatos/bdc_lesiones_gobmx.
It is important to recall that the Mexican Ministry of Health owns information from public and private health institutions in all Mexico, and it is classified following the injury definition established by WHO, i.e. the classification incorporates the intentionality component.
B. Prepare the DataDuring data exploration, we found 62 variables in the dynamic
cube of injuries (for a full list, see Appendix 1). Each variable related to injuries can be expanded into 14 options, in average. As we mention before, the Ministry of Health presents information from all the Mexican federal entities, 32 states, and this dynamic cube has information from 2010 to 2014. Although the injuries cube has not been updated in recent years, the Dynamic Cube is the result of a day by day acquisition of information by the Ministry of Health. Consequently, the whole Dynamic Cube has, approximately, a complete data of 1462
(variables and options) x 32 (states) x 5 (years), which are estimated in 183x1071.
Since the central aim of this study is to identify the location factors correlated to injuries and their possible trends, in this step we discard 55 from the 62 variables found in the dynamic cube. According to [18], the designing of public health policies must focus on the population welfare. Moreover, public policy should be capable of dealing with specific requirements, i.e., not all regions and individuals require the same treatment. Consequently, geographical location, type of injury and site of occurrence are important variables in the development of a public policy oriented to mitigate this health problem [21].
By the previous discussion, we take the variables year, the federal entity, injury agent, site of occurrence, days, gender and anatomic area of greater severity from the 62 variables registered in the dynamic cube. The values that each of these variables can take are described below:• Year: 2010, 2011, 2012, 2013, 2014.• Federal Entity (which establishes the location where an
individual receives attention): Aguascalientes, Baja California Sur, Campeche, Coahuila, Colima, Chiapas, Chihuahua, Distrito Federal, Durango, Guanajuato, Guerrero, Hidalgo, Jalisco, México, Michoacán, Morelos, Nayarit, Nuevo León, Oaxaca, Puebla, Querétaro, Quintana Roo, San Luis Potosí, Sinaloa, Sonora, Tabasco, Tamaulipas, Tlaxcala, Veracruz, Yucatán and Zacatecas.
• Injury agent: Fire/flame/hot substance/vapor, drug/drug poisoning, foot/hand, fall, blunt object, sharp object, hit against floor/wall, strange object, explosion, choking/suffocation, multiple agents, projectile gun, hanging, radiation, natural disaster, chemical substances, electric current, tool or machine, shakes, motor vehicle, drowning by submersion, animal picket/bite, forces of nature, poisonous mushroom/plant poisoning, other.
• The site of occurrence: living place, residential institution, school, sports/Athletics area, public road (pedestrian), trade and service area, work, farm, club/canteen/bar, public vehicle, private automotive vehicle, another place, location not specified.
• Day: Monday, Tuesday, Wednesday, Thursday, Friday, Saturday and Sunday.
• Gender: male, female, not specified, unknown.• Anatomic area of greater severity: Head, face, eye region, neck,
spine, superior limbs, hand, chest, back and/or buttocks, abdomen, pelvis, genital region, lower extremities, feet, multiple, others, it is ignored.
Considering previous variables and their values, we work with a database composed by more than 20 million of data, from which non-relevant information is removed. For example, values like location not specified, gender unknown and anatomic area ignored are not relevant for the designing of public policies. In other words, this kind of values does not offer insights of specific strategies to diminish the occurrence of injuries. This cleaning step contributes to improving the database quality according to the Watson Analytics program.
C. Explore and Pre-process the DataAfter the cleaning step, we examine the Data Base using the Watson
Analytics program. Such tool allows us to summarize and visualize descriptive statistics.
Figure 1 shows the distribution of injuries at each federal entity; it is important to note that Guanajuato is almost the same size than Mexico, which is curious because Mexico is a federal entity four times bigger that Guanajuato, but Guanajuato presents more injuries per capita than Mexico. Consequently, it is necessary to revisit how the public health system works at Guanajuato and Mexico.
Also, Michoacán, Tabasco and Veracruz stand out from Figure 1, which is natural due to the presence of
Fig.1. Word-count distribution by Federal Entity, i.e. the size of each federal entity is a function of the number of injury lesions registered as hospital admission at each federal entity.
In a second exploratory exercise, we use Watson Analytics to summarize the distribution of injuries according to the site of occurrence (see Figure 2). We identify that Living Place, Public Road, and Work are the sites where most of the injuries can happen. There is no surprise in the case of Public Road since road traffic accidents are the second cause of death in Mexico. However, Living Place and Work are sites of occurrence where the injuries intentionality matter; from these findings, we can infer a lack of prevention culture prevention in the Mexican population. In contrast, Finland has established specific strategies to generate a prevention culture for injuries at the living place. For example, since older people have a higher probability to suffer a fall in the living place, the National Falls Prevention Program in Finland provides with guidelines to prevent falls in these population. Through this program, a person who lives with older people receives instructions to transform a house into a smart home [30]. The United Kingdom and Spain also apply the idea of changing environments into smart environments since ten years ago. Notably, the concept of a smart kitchen has reduced the number of unintentional injuries at the living place in such countries [20]. Also, it is important the European countries and the United States have a long tradition in the prevention of injuries at work. These governments have identified the high correlation between fatigue and work injuries, which has boosted awareness campaigns between workers and employers to determine the risk of injuries by fatigue [26].
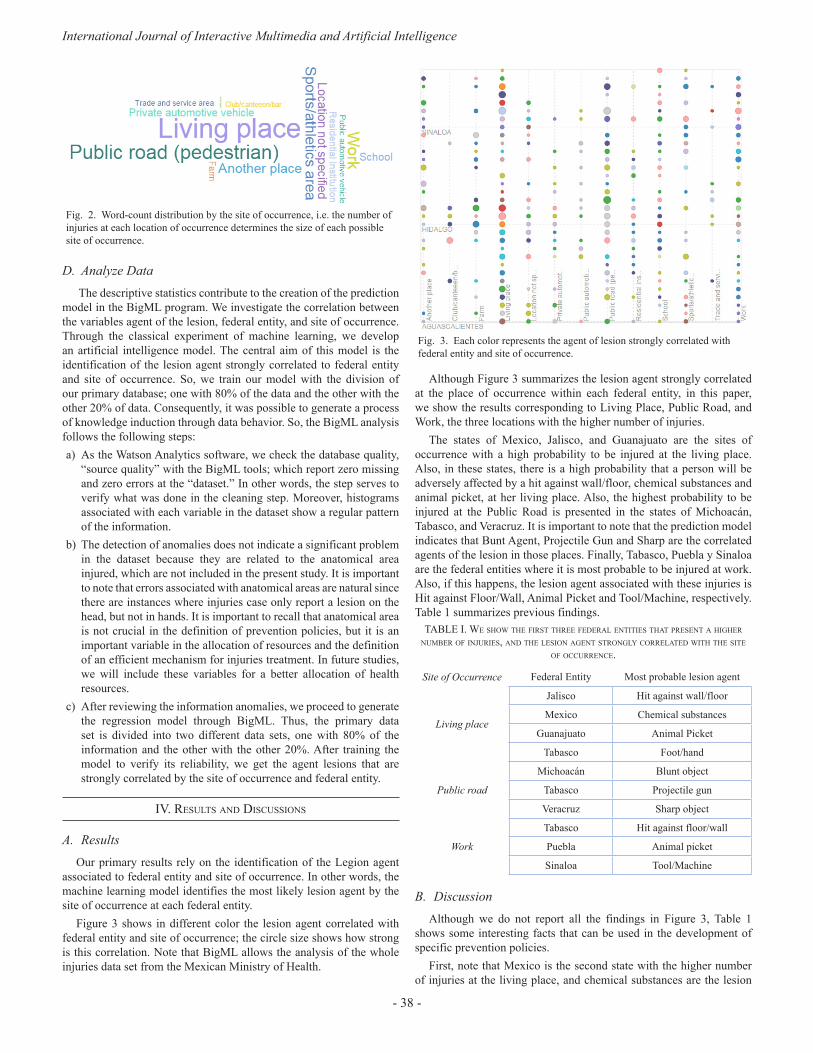
International Journal of Interactive Multimedia and Artificial Intelligence
- 38 -
Fig. 2. Word-count distribution by the site of occurrence, i.e. the number of injuries at each location of occurrence determines the size of each possible site of occurrence.
D. Analyze Data The descriptive statistics contribute to the creation of the prediction
model in the BigML program. We investigate the correlation between the variables agent of the lesion, federal entity, and site of occurrence. Through the classical experiment of machine learning, we develop an artificial intelligence model. The central aim of this model is the identification of the lesion agent strongly correlated to federal entity and site of occurrence. So, we train our model with the division of our primary database; one with 80% of the data and the other with the other 20% of data. Consequently, it was possible to generate a process of knowledge induction through data behavior. So, the BigML analysis follows the following steps:a) As the Watson Analytics software, we check the database quality,
“source quality” with the BigML tools; which report zero missing and zero errors at the “dataset.” In other words, the step serves to verify what was done in the cleaning step. Moreover, histograms associated with each variable in the dataset show a regular pattern of the information.
b) The detection of anomalies does not indicate a significant problem in the dataset because they are related to the anatomical area injured, which are not included in the present study. It is important to note that errors associated with anatomical areas are natural since there are instances where injuries case only report a lesion on the head, but not in hands. It is important to recall that anatomical area is not crucial in the definition of prevention policies, but it is an important variable in the allocation of resources and the definition of an efficient mechanism for injuries treatment. In future studies, we will include these variables for a better allocation of health resources.
c) After reviewing the information anomalies, we proceed to generate the regression model through BigML. Thus, the primary data set is divided into two different data sets, one with 80% of the information and the other with the other 20%. After training the model to verify its reliability, we get the agent lesions that are strongly correlated by the site of occurrence and federal entity.
Iv. Results and dIscussIons
A. ResultsOur primary results rely on the identification of the Legion agent
associated to federal entity and site of occurrence. In other words, the machine learning model identifies the most likely lesion agent by the site of occurrence at each federal entity.
Figure 3 shows in different color the lesion agent correlated with federal entity and site of occurrence; the circle size shows how strong is this correlation. Note that BigML allows the analysis of the whole injuries data set from the Mexican Ministry of Health.
Fig. 3. Each color represents the agent of lesion strongly correlated with federal entity and site of occurrence.
Although Figure 3 summarizes the lesion agent strongly correlated at the place of occurrence within each federal entity, in this paper, we show the results corresponding to Living Place, Public Road, and Work, the three locations with the higher number of injuries.
The states of Mexico, Jalisco, and Guanajuato are the sites of occurrence with a high probability to be injured at the living place. Also, in these states, there is a high probability that a person will be adversely affected by a hit against wall/floor, chemical substances and animal picket, at her living place. Also, the highest probability to be injured at the Public Road is presented in the states of Michoacán, Tabasco, and Veracruz. It is important to note that the prediction model indicates that Bunt Agent, Projectile Gun and Sharp are the correlated agents of the lesion in those places. Finally, Tabasco, Puebla y Sinaloa are the federal entities where it is most probable to be injured at work. Also, if this happens, the lesion agent associated with these injuries is Hit against Floor/Wall, Animal Picket and Tool/Machine, respectively. Table 1 summarizes previous findings.
table I. We shoW the fIRst thRee fedeRal entItIes that pResent a hIgheR nuMbeR of InjuRIes, and the lesIon agent stRongly coRRelated WIth the sIte
of occuRRence.
Site of Occurrence Federal Entity Most probable lesion agent
Living place
Jalisco Hit against wall/floor
Mexico Chemical substances
Guanajuato Animal Picket
Tabasco Foot/hand
Public road
Michoacán Blunt object
Tabasco Projectile gun
Veracruz Sharp object
Work
Tabasco Hit against floor/wall
Puebla Animal picket
Sinaloa Tool/Machine
B. DiscussionAlthough we do not report all the findings in Figure 3, Table 1
shows some interesting facts that can be used in the development of specific prevention policies.
First, note that Mexico is the second state with the higher number of injuries at the living place, and chemical substances are the lesion
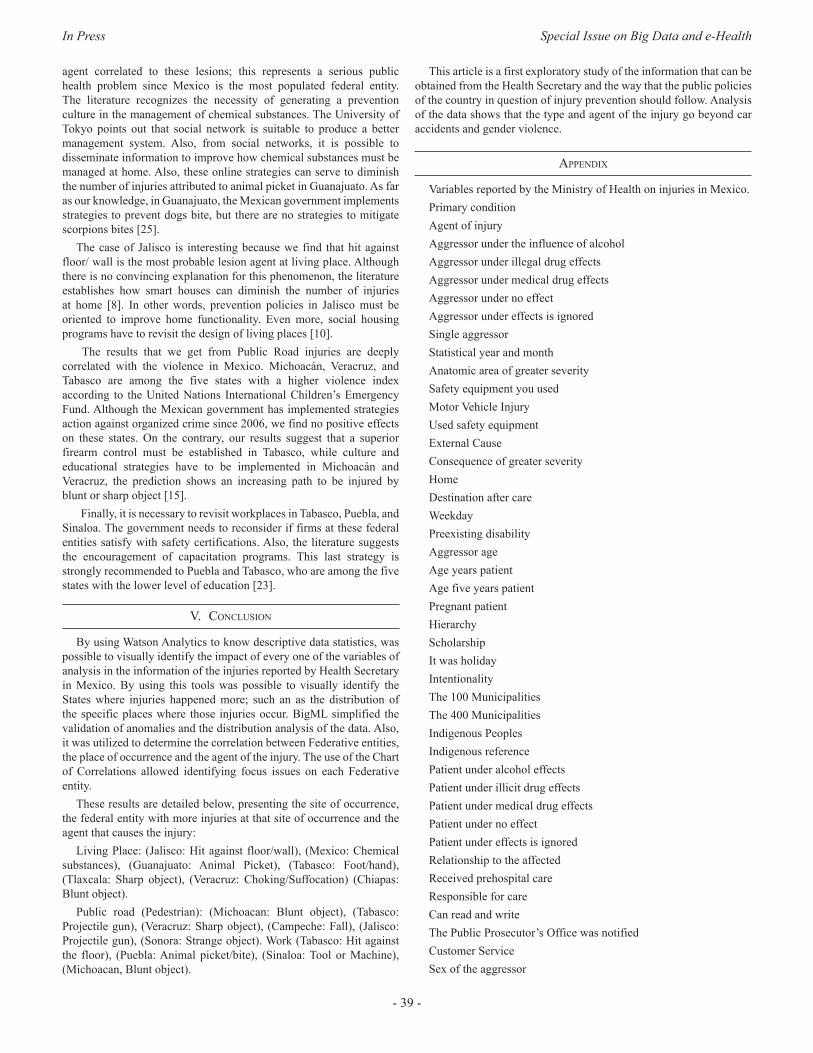
In Press Special Issue on Big Data and e-Health
- 39 -
agent correlated to these lesions; this represents a serious public health problem since Mexico is the most populated federal entity. The literature recognizes the necessity of generating a prevention culture in the management of chemical substances. The University of Tokyo points out that social network is suitable to produce a better management system. Also, from social networks, it is possible to disseminate information to improve how chemical substances must be managed at home. Also, these online strategies can serve to diminish the number of injuries attributed to animal picket in Guanajuato. As far as our knowledge, in Guanajuato, the Mexican government implements strategies to prevent dogs bite, but there are no strategies to mitigate scorpions bites [25].
The case of Jalisco is interesting because we find that hit against floor/ wall is the most probable lesion agent at living place. Although there is no convincing explanation for this phenomenon, the literature establishes how smart houses can diminish the number of injuries at home [8]. In other words, prevention policies in Jalisco must be oriented to improve home functionality. Even more, social housing programs have to revisit the design of living places [10].
The results that we get from Public Road injuries are deeply correlated with the violence in Mexico. Michoacán, Veracruz, and Tabasco are among the five states with a higher violence index according to the United Nations International Children’s Emergency Fund. Although the Mexican government has implemented strategies action against organized crime since 2006, we find no positive effects on these states. On the contrary, our results suggest that a superior firearm control must be established in Tabasco, while culture and educational strategies have to be implemented in Michoacán and Veracruz, the prediction shows an increasing path to be injured by blunt or sharp object [15].
Finally, it is necessary to revisit workplaces in Tabasco, Puebla, and Sinaloa. The government needs to reconsider if firms at these federal entities satisfy with safety certifications. Also, the literature suggests the encouragement of capacitation programs. This last strategy is strongly recommended to Puebla and Tabasco, who are among the five states with the lower level of education [23].
v. conclusIon
By using Watson Analytics to know descriptive data statistics, was possible to visually identify the impact of every one of the variables of analysis in the information of the injuries reported by Health Secretary in Mexico. By using this tools was possible to visually identify the States where injuries happened more; such an as the distribution of the specific places where those injuries occur. BigML simplified the validation of anomalies and the distribution analysis of the data. Also, it was utilized to determine the correlation between Federative entities, the place of occurrence and the agent of the injury. The use of the Chart of Correlations allowed identifying focus issues on each Federative entity.
These results are detailed below, presenting the site of occurrence, the federal entity with more injuries at that site of occurrence and the agent that causes the injury:
Living Place: (Jalisco: Hit against floor/wall), (Mexico: Chemical substances), (Guanajuato: Animal Picket), (Tabasco: Foot/hand), (Tlaxcala: Sharp object), (Veracruz: Choking/Suffocation) (Chiapas: Blunt object).
Public road (Pedestrian): (Michoacan: Blunt object), (Tabasco: Projectile gun), (Veracruz: Sharp object), (Campeche: Fall), (Jalisco: Projectile gun), (Sonora: Strange object). Work (Tabasco: Hit against the floor), (Puebla: Animal picket/bite), (Sinaloa: Tool or Machine), (Michoacan, Blunt object).
This article is a first exploratory study of the information that can be obtained from the Health Secretary and the way that the public policies of the country in question of injury prevention should follow. Analysis of the data shows that the type and agent of the injury go beyond car accidents and gender violence.
appendIx
Variables reported by the Ministry of Health on injuries in Mexico.Primary conditionAgent of injuryAggressor under the influence of alcoholAggressor under illegal drug effectsAggressor under medical drug effectsAggressor under no effectAggressor under effects is ignoredSingle aggressorStatistical year and monthAnatomic area of greater severitySafety equipment you usedMotor Vehicle InjuryUsed safety equipmentExternal CauseConsequence of greater severityHomeDestination after careWeekdayPreexisting disabilityAggressor ageAge years patientAge five years patientPregnant patientHierarchyScholarshipIt was holidayIntentionalityThe 100 MunicipalitiesThe 400 MunicipalitiesIndigenous PeoplesIndigenous referencePatient under alcohol effectsPatient under illicit drug effectsPatient under medical drug effectsPatient under no effectPatient under effects is ignoredRelationship to the affectedReceived prehospital careResponsible for careCan read and writeThe Public Prosecutor’s Office was notifiedCustomer ServiceSex of the aggressor
International Journal of Interactive Multimedia and Artificial Intelligence
- 40 -
Sex of the patientSite of occurrenceType of care counselingType of medical careType of care otherType of psychological careType of psychiatric careType of surgical careCLUESName Medical Care UnitType of Medical UnitMedical care unitUser referred byViolence, neglect and/or neglectEconomic violencePhysical violencePsychological violenceSexual violenceSingle time violence
acknoWledgMent
We acknowledge the support from the University Popular Autónoma del Estado de Puebla.
RefeRences
[1] E. Letouzé, «Big data for development: challenges & opportunities.,» UN Global Pulse, 2012.
[2] «Los accidentes como problema de salud pública en México,» Intersistemas, 2014.
[3] D. S. &. F. Racioppi, «The role of public health in injury prevention in the WHO European Region,» International Journal of Injury Control and Safety Promotion, vol. 14, nº 4, pp. 271-273, 2008.
[4] M. Joseph, «Big Data and Advanced Analytics for Healthcare,» Prime Dimensions, 2013.
[5] Y. O. Peña, A. S. Carvajal, G. A. Pech, J. H. Santos, R. O. Rodríguez y e. al.., «Risk Factors Associated with Domestic Violence and Homicidal Violence of Women: The Case of Yucatan, Mexico,» Psychology; Irvine, vol. 7, nº 1, pp. 62-73, 2016.
[6] L. A. García, «The efficacy of electronic monitoring in gender violence: criminological analysis,» International E-journal of Criminal Sciences, vol. 1, nº 10, 2016.
[7] C. Crosby, V. Nandigam, M. Phan, C. Youn, C. Baru y R. Arrowsmith, «OpenTopography: Addressing Big Data Challenges Using Cloud Computing, HPC and Data Analytics,» Proceeding od the AGU Fall Meeting, 2014.
[8] P. BSN, R. Linda BSN y H. BSN, «Aging Well With Smart Technology,» Nursing Administration Quarterly, vol. 29, nº 4, pp. 329-338, 2005.
[9] A. Chourasia, M. Wong, D. Mishin, D. R. Nadeau y M. Norman, «A scientific data sharing and collaboration platform,» Proceedings of the XSEDE16 Conference on Diversity, Big Data, and Science at Scale, 2016.
[10] M. D. Keal, N. P. P. Howden-Chapman, C. Cunningham, M. Cunningham, J. Guria, M. G. Bake y e. al, «Home modifications to reduce injuries from falls in the Home Injury Prevention Intervention (HIPI) study: a cluster-randomised controlled trial,» The Lancet, vol. 385, nº 9964, pp. 231-238, 2015.
[11] B. Marr, «How Big Data Is Changing Healthcare,» Forbes, 2015. [12] P. Groves, B. Kayyali y a. S. V. K. D. Knott, «The big-data revolution
in health care: Accelerating value and innovation,» Center for US Health System Reform. Business Technology Office. McKinsey & Company, 201.
[13] R. González, A. Chico, V. Domínguez y G. Iracheta, «Epidemiología de las mordeduras por serpiente. Su simbolismo,» Acta Pediatr Mex, vol. 30, nº 3, pp. 182-91, 2009.
[14] Y. Tsuji, K. Tonokura y R. Hayashi, «Chemical substances management systems at the University of Tokyo,» Journal of Environment and Safety, vol. 7, nº 2, pp. 129-131, 2016.
[15] S. Bautista y a. M. Magdalena, «Gender and political violence in local governments in the Central Mexican Altiplano,» Politai, vol. 7, nº 12, 2016.
[16] S. Yang, M. Santillana y a. S. C. Kou, «Accurate estimation of influenza epidemics using Google search data via ARGO,» Proceedings of the National Academy of Sciences, vol. 112, nº 47, pp. 14473-14478, 2015.
[17] A. Chandran, M. J. Barron, B. J. Westerman y a. L. DiPietro, «Time trends in incidence and severity of injury among collegiate soccer players in the United States,» The American Journal of Sports Medicine, vol. 44, nº 12, 2016.
[18] J. O. Allegrante, R. Mitchell, J. A. Taylor y K. A. Mack, «Injury surveillance: the next generation,» Injury Prevention, nº 22, pp. 63-65, 2016.
[19] A. Pat, K. Larson y a. S. Keshav, «Big-data mechanisms and energy policy design,» Proc. 30th AAAI Conf. Artificial Intelligence, pp. 3887-3893, 2016.
[20] M. Peden, K. McGee y E. Krug, «Injury: A leading cause of the global burden of disease,» Geneva: World Health Organization, 2002.
[21] A. Pentland, T. G. Reid y T. Heibeck, «Big Data: Revolutionizing medicine and public health,» Worl Innovation Summit for Health, 2013.
[22] B. A. Díaz-Apodaca, F. G. D. Cosio, G. Moye-Elizalde y a. F. F. Fornelli-Laffon, «Egresos por lesiones externas en un hospital de Ciudad Juárez, México,» Comunicación Breve, vol. 31, nº 5, pp. 442-446, 2012.
[23] B. A. Rodríguez y a. M. E. N. González, «Bases para el análisis de la problematización de la inseguridad en México,» Espacios Públicos, vol. 16, nº 36, pp. 37-54, 2013.
[24] R. Pérez-Núñez, M. Híjar, A. Celis y a. E. Hidalgo-Solórzano, «El estado de las lesiones causadas por el tránsito en México: evidencias para fortalecer la estrategia mexicana de seguridad vial,» Cadernos de Saúde Pública, vol. 30, nº 5, 2014.
[25] A. L. Cervantes-Trejo, I. Rojas-Vargas y J. S. F.-C. a. Roy, «Trends in traffic fatalities in Mexico: examining progress on the decade of action for road safety 2011–2020,» International Journal of Public Health, vol. 61, nº 8, pp. 903-913, 2016.
[26] D. T. Jamison, J. G. Breman y a. A. R. Measham, Disease control priorities in developing countries, Oxford University Press, 2006.
[27] M. D’Agostino, F. Mejía, M. Marti, D. Novillo, F. G. d. Cosío y N. Farach, «Social Dialogue and Scientific Production on Big and Open Data in Health: from Facilitating Behavioral Changes,» International Journal of Health Research, vol. 4, nº 3, pp. 14-22, 2016.
[28] D. W. Bates, S. Saria, L. Ohno-Machado y A. S. a. G. Escobar, «Big Data in Health Care: Using Analytics to Identify and Manage High-Risk and High-Cost Patients,» Health Affairs, vol. 33, nº 7, pp. 1123-1131, 2014.
[29] D. Schooper, J.-D. Lormand y a. R. Waxweiler, «Developing Policies to prevent injuries and violence: guidelines for policy-makers and planners,» World Health, 2006.
[30] National Center for Health Statistics, «Health, United States, 2010: With special feature on death and dying,» Washington, DC, 2011.
[31] P. Kline y a. E. Moreti, «People, Places, and Public Policy: Some Simple Welfare Economics of Local Economic Development Programs,» Annual Review of Economics, vol. 6, nº 1, pp. 1-45, 2014.
[32] C. J. L. Murray y et.al., «Disability-adjusted life years (DALYs) for 291 diseases and injuries in 21 regions, 1990-2010: a systematic analysis for the global burden of disease study 2010,» The Lancet, vol. 380, nº 9859, pp. 2197-2223, 2014.
[33] M. Peden, K. Oyegbite, J. Ozanne-Smith, A. A. Hyder, C. Branche, A. F. Rahman, F. Rivara y a. K. Bartolomeos, Informe mundial sobre prevención de las lesiones en los niños, UNICEF, 2008.
[34] G.-D. H, C. MV, F.-M. F, B. P y a. et.al., «La carga de la enfermedad en países de América Latina,» Salud Pública México, vol. 53, pp. 72-77, 2011.
In Press Special Issue on Big Data and e-Health
- 41 -
Rosa María Cantón Croda, Ph.D. in Computer Science from the Tecnológico de Monterrey, Ciudad de México, Master in Information Technologies from the Tecnológico de Monterrey, Veracruz, was graduated in Computer Science Administrator from the Tecnológico de Monterrey, Monterrey. She was Manager of Systems in transport and construction companies. More than twenty years of experience in the academic administration of Tecnológico
de Monterrey and currently Dean of postgraduate studies in Engineering and Business at UPAEP. She has written some articles for national and international congresses. She was certified in PMBook, Positive Psychology by Tecmilenio and in Project-Based Learning by Aalborg University in Denmark. Currently, her research interests are Big Data and Business Intelligence.
Damián Emilio Gibaja Romero, Ph.D. in Economics from El Colegio de México, Ciudad de México, Master in Economics from El Colegio de México, México. He has written some articles for national and international congresses. He did research visits at the Paris School of Economics and the University of Glasgow. Currently, hir research interests are Game Theory and Mathematical Economics.
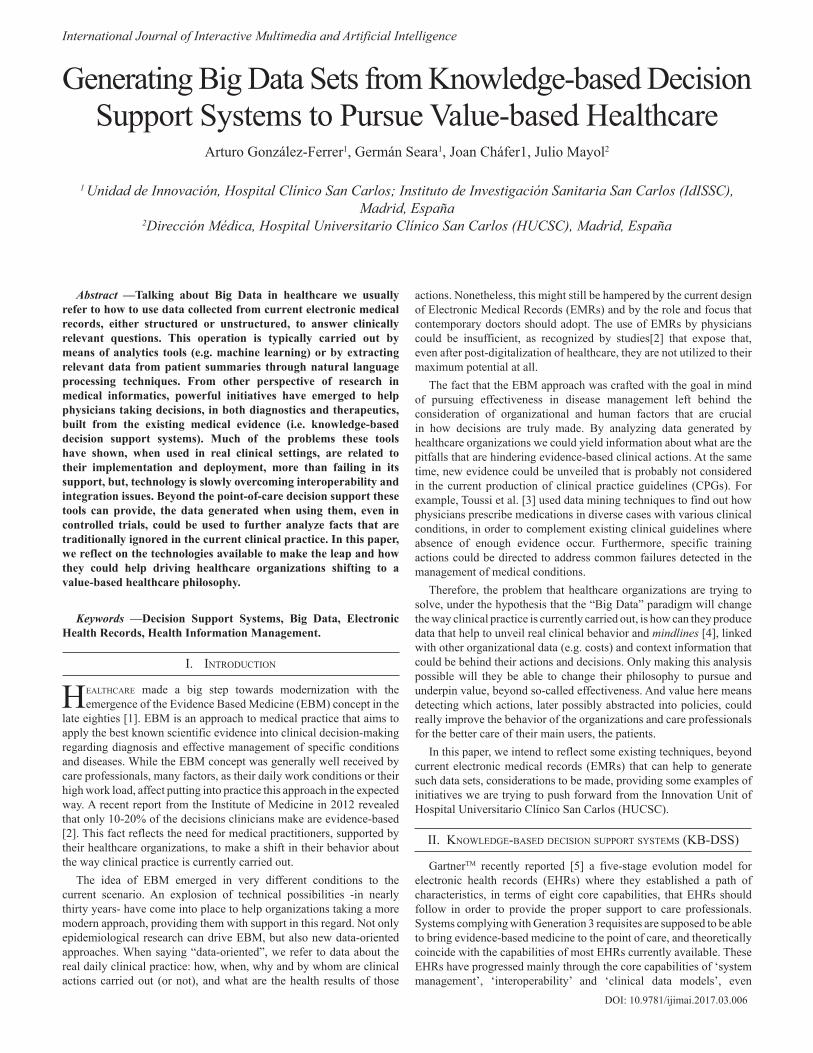
International Journal of Interactive Multimedia and Artificial Intelligence
DOI: 10.9781/ijimai.2017.03.006
Abstract —Talking about Big Data in healthcare we usually
refer to how to use data collected from current electronic medical
records, either structured or unstructured, to answer clinically
relevant questions. This operation is typically carried out by
means of analytics tools (e.g. machine learning) or by extracting
relevant data from patient summaries through natural language
processing techniques. From other perspective of research in
medical informatics, powerful initiatives have emerged to help
physicians taking decisions, in both diagnostics and therapeutics,
built from the existing medical evidence (i.e. knowledge-based
decision support systems). Much of the problems these tools
have shown, when used in real clinical settings, are related to
their implementation and deployment, more than failing in its
support, but, technology is slowly overcoming interoperability and
integration issues. Beyond the point-of-care decision support these
tools can provide, the data generated when using them, even in
controlled trials, could be used to further analyze facts that are
traditionally ignored in the current clinical practice. In this paper,
we reflect on the technologies available to make the leap and how
they could help driving healthcare organizations shifting to a
value-based healthcare philosophy.
Keywords —Decision Support Systems, Big Data, Electronic
Health Records, Health Information Management.
I. IntRoductIon
healthcaRe made a big step towards modernization with the emergence of the Evidence Based Medicine (EBM) concept in the
late eighties [1]. EBM is an approach to medical practice that aims to apply the best known scientific evidence into clinical decision-making regarding diagnosis and effective management of specific conditions and diseases. While the EBM concept was generally well received by care professionals, many factors, as their daily work conditions or their high work load, affect putting into practice this approach in the expected way. A recent report from the Institute of Medicine in 2012 revealed that only 10-20% of the decisions clinicians make are evidence-based [2]. This fact reflects the need for medical practitioners, supported by their healthcare organizations, to make a shift in their behavior about the way clinical practice is currently carried out.
The idea of EBM emerged in very different conditions to the current scenario. An explosion of technical possibilities -in nearly thirty years- have come into place to help organizations taking a more modern approach, providing them with support in this regard. Not only epidemiological research can drive EBM, but also new data-oriented approaches. When saying “data-oriented”, we refer to data about the real daily clinical practice: how, when, why and by whom are clinical actions carried out (or not), and what are the health results of those
actions. Nonetheless, this might still be hampered by the current design of Electronic Medical Records (EMRs) and by the role and focus that contemporary doctors should adopt. The use of EMRs by physicians could be insufficient, as recognized by studies[2] that expose that, even after post-digitalization of healthcare, they are not utilized to their maximum potential at all.
The fact that the EBM approach was crafted with the goal in mind of pursuing effectiveness in disease management left behind the consideration of organizational and human factors that are crucial in how decisions are truly made. By analyzing data generated by healthcare organizations we could yield information about what are the pitfalls that are hindering evidence-based clinical actions. At the same time, new evidence could be unveiled that is probably not considered in the current production of clinical practice guidelines (CPGs). For example, Toussi et al. [3] used data mining techniques to find out how physicians prescribe medications in diverse cases with various clinical conditions, in order to complement existing clinical guidelines where absence of enough evidence occur. Furthermore, specific training actions could be directed to address common failures detected in the management of medical conditions.
Therefore, the problem that healthcare organizations are trying to solve, under the hypothesis that the “Big Data” paradigm will change the way clinical practice is currently carried out, is how can they produce data that help to unveil real clinical behavior and mindlines [4], linked with other organizational data (e.g. costs) and context information that could be behind their actions and decisions. Only making this analysis possible will they be able to change their philosophy to pursue and underpin value, beyond so-called effectiveness. And value here means detecting which actions, later possibly abstracted into policies, could really improve the behavior of the organizations and care professionals for the better care of their main users, the patients.
In this paper, we intend to reflect some existing techniques, beyond current electronic medical records (EMRs) that can help to generate such data sets, considerations to be made, providing some examples of initiatives we are trying to push forward from the Innovation Unit of Hospital Universitario Clínico San Carlos (HUCSC).
II. knoWledge-based decIsIon suppoRt systeMs (kb-dss)
GartnerTM recently reported [5] a five-stage evolution model for electronic health records (EHRs) where they established a path of characteristics, in terms of eight core capabilities, that EHRs should follow in order to provide the proper support to care professionals. Systems complying with Generation 3 requisites are supposed to be able to bring evidence-based medicine to the point of care, and theoretically coincide with the capabilities of most EHRs currently available. These EHRs have progressed mainly through the core capabilities of ‘system management’, ‘interoperability’ and ‘clinical data models’, even
Generating Big Data Sets from Knowledge-based Decision Support Systems to Pursue Value-based Healthcare
Arturo González-Ferrer1, Germán Seara1, Joan Cháfer1, Julio Mayol2
1 Unidad de Innovación, Hospital Clínico San Carlos; Instituto de Investigación Sanitaria San Carlos (IdISSC), Madrid, España
2Dirección Médica, Hospital Universitario Clínico San Carlos (HUCSC), Madrid, España
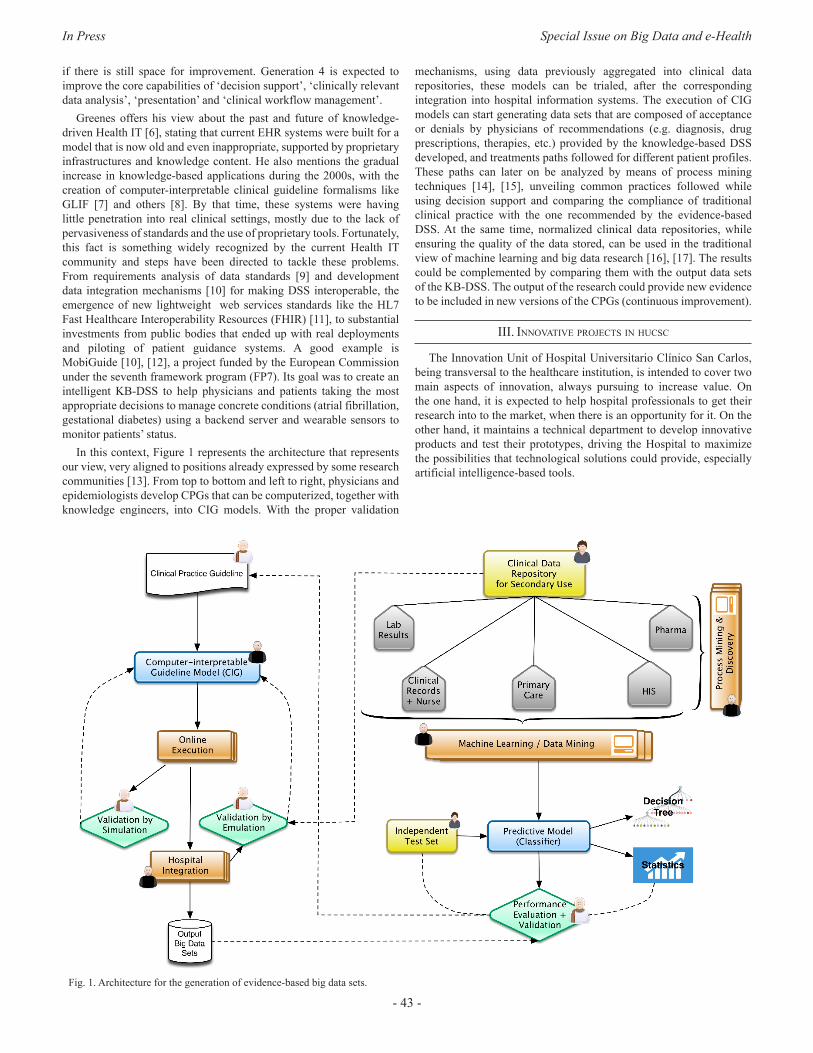
In Press Special Issue on Big Data and e-Health
- 43 -
if there is still space for improvement. Generation 4 is expected to improve the core capabilities of ‘decision support’, ‘clinically relevant data analysis’, ‘presentation’ and ‘clinical workflow management’.
Greenes offers his view about the past and future of knowledge-driven Health IT [6], stating that current EHR systems were built for a model that is now old and even inappropriate, supported by proprietary infrastructures and knowledge content. He also mentions the gradual increase in knowledge-based applications during the 2000s, with the creation of computer-interpretable clinical guideline formalisms like GLIF [7] and others [8]. By that time, these systems were having little penetration into real clinical settings, mostly due to the lack of pervasiveness of standards and the use of proprietary tools. Fortunately, this fact is something widely recognized by the current Health IT community and steps have been directed to tackle these problems. From requirements analysis of data standards [9] and development data integration mechanisms [10] for making DSS interoperable, the emergence of new lightweight web services standards like the HL7 Fast Healthcare Interoperability Resources (FHIR) [11], to substantial investments from public bodies that ended up with real deployments and piloting of patient guidance systems. A good example is MobiGuide [10], [12], a project funded by the European Commission under the seventh framework program (FP7). Its goal was to create an intelligent KB-DSS to help physicians and patients taking the most appropriate decisions to manage concrete conditions (atrial fibrillation, gestational diabetes) using a backend server and wearable sensors to monitor patients’ status.
In this context, Figure 1 represents the architecture that represents our view, very aligned to positions already expressed by some research communities [13]. From top to bottom and left to right, physicians and epidemiologists develop CPGs that can be computerized, together with knowledge engineers, into CIG models. With the proper validation
mechanisms, using data previously aggregated into clinical data repositories, these models can be trialed, after the corresponding integration into hospital information systems. The execution of CIG models can start generating data sets that are composed of acceptance or denials by physicians of recommendations (e.g. diagnosis, drug prescriptions, therapies, etc.) provided by the knowledge-based DSS developed, and treatments paths followed for different patient profiles. These paths can later on be analyzed by means of process mining techniques [14], [15], unveiling common practices followed while using decision support and comparing the compliance of traditional clinical practice with the one recommended by the evidence-based DSS. At the same time, normalized clinical data repositories, while ensuring the quality of the data stored, can be used in the traditional view of machine learning and big data research [16], [17]. The results could be complemented by comparing them with the output data sets of the KB-DSS. The output of the research could provide new evidence to be included in new versions of the CPGs (continuous improvement).
III. InnovatIve pRojects In hucsc
The Innovation Unit of Hospital Universitario Clínico San Carlos, being transversal to the healthcare institution, is intended to cover two main aspects of innovation, always pursuing to increase value. On the one hand, it is expected to help hospital professionals to get their research into to the market, when there is an opportunity for it. On the other hand, it maintains a technical department to develop innovative products and test their prototypes, driving the Hospital to maximize the possibilities that technological solutions could provide, especially artificial intelligence-based tools.
Fig. 1. Architecture for the generation of evidence-based big data sets.
International Journal of Interactive Multimedia and Artificial Intelligence
- 44 -
The ultimate intention is to disseminate the existence of these techniques while facilitating its understanding, create a culture of innovation within the Hospital and, when possible, get external companies to finalize these prototypes, or collaborate in the development, if they are demonstrated relevant and close to a market possibility. The following are several ongoing projects aligned with the goal expressed before and contributing several methods and artifacts to the architecture presented:
A. Computer-interpretable guideline for diagnosis and treatment of hyponatremia
The Endocrinology Department demanded a process-based solution to help new residents to improve their ability to diagnose and manage the hyponatremia condition (presenting low levels of serum sodium). Hyponatremia is the most frequent electrolyte disorder, however, according to some studies, it has proved to be very difficult to comprehend by physicians in general [18]. To address this project, we developed a CIG model [19], [20] using the PROForma set of tools [21], [22], covering the diagnosis of hyponatremia, classifying it into thirteen different subtypes. During a retrospective validation of the system with the data from 65 patients, we compared the system’s output to the diagnosis consensus of two experts, obtaining a very high agreement (kappa=0.86). The agreement found was also higher than a previous experiment found in the literature [23], carried out by comparing the performance of a resident physician -using the original paper guideline- with the diagnosis of senior physicians. Nonetheless, the most relevant advance of using such a system, beyond its successful diagnosis performance, was the identification and recording of data cases that were contrary to the consensus of international hyponatremia experts, specifically regarding hypoaldosteronism, where concrete markers thresholds were thought to be associated to its diagnosis. The application of our model found several cases where this hypothesis did not apply, showing the lack of real evidence and the need for further research. This is a concrete demonstration of how putting into practice these knowledge-based systems can help detecting where evidence is failing and focusing new research directions ahead.
B. Unsupervised learning of discharge data (Big Data)The syndrome of inappropriate antidiuretic hormone secretion
(SIADH) represents around one-third of all cases of hyponatremia. We carried out a project [23] to identify clusters of hospitalized SIADH patients sharing diagnosed pathologies (comorbidities), where the results coincided and extended previous research identifying individual comorbidities.
Our methods included testing of two different distance measures and hierarchical agglomerative clustering. We used similarity profile analysis for determination of the number of significant clusters and membership of individuals [25] (by means of the SIMPROF method included in the clustsig R package). The method provides also the members of each proposed cluster, where validation of the clusters produced is assessed by iteratively carrying out hundreds of permutations tests. Analyzing the data from around 650 patients, it unveiled 8 clusters, where the most significant ones were five: cancer patients, urinary tract infection patients, patients with renal failure, patients with respiratory problems, and patients with atrial fibrillation and other heart conditions.
We found a main problem; this process is very costly to be carried out in a personal computer, especially when having thousands of columns in the data (variables). We are evaluating the use of the Cloudera big data framework along with Apache Mahout [26] to build a next stage of scalable algorithms that are able to cope with big data sets. If successful, this should be accompanied by the deployment of a private cloud infrastructure [27] able to provide a machine learning
as a service (MLaaS) platform, due to the characteristics of patient sensitive data.
C. Hikari: a case study of Mental Health (Big Data)In June 2015, Fujitsu Laboratories of Europe Ltd. and Fujitsu
EMEIA in Spain signed a strategic research collaboration agreement with the Foundation for Biomedical Research of Hospital Clínico San Carlos (FIBHCSC). Mental health was selected as a key target for the initial project for several reasons: 1) the high levels of disability and morbidity associated to mental illness; 2) the important burden that mental illness imposes on patients, both at individual and social level, and on the use of healthcare resources; and 3) the virtual impossibility to analyze results and its value, despite an apparently perfect design and theoretical structure of mental health services [28]
Hikari, the Japanese word for light, is a part of the Fujitsu’s Zinrai Artificial Intelligence technologies focused on people that includes data analytics and semantic modeling. In this project we have used relevant dissociated clinical data from the Psychiatric Department, obtained during the last ten years, including patient discharge records and the specific registries of psychiatric emergency care, in order to generate a very simple and friendly tool that allows clinicians to have access to information related to the main diagnosis, comorbidities and associated health risks, and also the possibility of analysis at the population level. It has been also useful to track the pathways through the healthcare system followed by patients, and to analyze the impact on the use of resources and costs.
At the present time, the database includes approximately 30,000 emergency care records and 6,500 hospitalizations, however we expect that by the time this paper will be published, it will include data from more than 370,000 outpatients and 38,000 records of day hospital care. This will help us to establish patterns of behavior of the different pathologies and conditions, both in terms of comorbidities, pathways and use of resources.
D. Clinical Data Repository for secondary useHealth Observatories, regardless of regional, national or
supranational level, rely for their reports on data that will inform on healthcare structure and compliance with programs or pathways. However, data on health outcomes and results are very few or close to none. This is very closely related to the incoherence and fragmented evolution of health care information systems.
In the last decades it has become increasingly evident the demographic and social change in western societies that has brought the concepts of chronicity, fragility and complexity of patients. This makes the continuity of care centered on patients an absolute necessity if we are to keep our health systems sustainable. Probably one of the main factors involved in this kind of transformation is the access to daily care data that will enable patients, professionals, managers and health policy makers to address these challenges.
If we consider the previous lines, it becomes more and more evident the desirability of having repositories of relevant dissociated clinical data that will allow to evaluate the procedures and results of the real clinical practice, to compare them with recommendations based on evidence and, at the same time, to generate new evidence from the stored data. It is essential to standardize data structure, context (actors, themes, time), continuity of care (such as UNE-EN-13940), generic reference models (such as UNE-EN-ISO 13606, part1), understandable archetypes for clinicians (such as UNE-EN-ISO 13606, part2), terminologies (such as SNOMED-CT) and ontologies for knowledge representation [29]. And obviously, to fulfill the criteria of privacy and data security provided in the legislation, recently renewed in Europe with a new regulation [30].
In Press Special Issue on Big Data and e-Health
- 45 -
Iv. dIscussIon
The application of KB-DSS in healthcare can provide very diverse information. One of the most useful can be the detection of mistakes incurred frequently by professionals when comparing to evidence-based guidelines. Other outputs can be more research-oriented, identifying situations that were thought to be good recommendations but in fact they could be not, according to decisions and reasons explicitly provided by physicians while using the system.
The reader may have noted that we are not stressing from the very beginning that the requirements of the data sets generated by our approach include being of considerable size (the V for “volume”). The reason for this is that we are convinced that the data generated will be eventually growing. However, there is an increasing need to prioritize the V for “value”. We think this value is closely linked to ensuring the V for “veracity” in big data approaches in Healthcare, beyond the rest of Vs (velocity, variety), that are certainly depending on technological capabilities and solutions. This means that we need to ensure mechanisms to guarantee the quality and completeness of the data collected [31], [32] in normalized repositories, if we want to have success in applying these techniques and obtaining valuable healthcare results.
v. conclusIon
Decision support systems might be able to facilitate the autonomy of citizens when choosing their health options and the ability of professionals to make the most appropriate decision at the right moment. It may also help health policy makers and managers to prioritize the most needed actions in an environment with increasing health needs and resource constraints. But this will be very difficult without the development and maintenance of repositories of dissociated and normalized relevant clinical data from the daily clinical practice, the contributions of the patients themselves and the fusion with open access data of the social environment. Furthermore, this should be quickly accompanied by a proper regulation [33] (by the qualified bodies in Europe and the FDA in the US) that make clearer for entrepreneurs the requirements for the development, testing and validation of these new models.
RefeRences
[1] M. J. Field and K. N. Lohr, Clinical practice guidelines: directions for a new program. National Academy Press, 1990.
[2] A. Moskowitz, J. McSparron, D. J. Stone, and L. A. Celi, “Preparing a new generation of clinicians for the era of big data,” Harvard Med. student Rev., vol. 2, no. 1, p. 24, 2015.
[3] M. Toussi, J.-B. Lamy, P. Le Toumelin, and A. Venot, “Using data mining techniques to explore physicians’ therapeutic decisions when clinical guidelines do not provide recommendations: methods and example for type 2 diabetes,” BMC Med. Inform. Decis. Mak., vol. 9, no. 1, p. 1, 2009.
[4] J. Gabbay and A. le May, “Evidence based guidelines or collectively constructed ‘mindlines?’ Ethnographic study of knowledge management in primary care,” Bmj, vol. 329, no. 7473, p. 1013, 2004.
[5] T. Handler and B. Hieb, “The Updated Gartner CPR Generation Criteria,” Gart. Teleconference, vol. 13, 2007.
[6] R. A. Greenes, “Evolution and Revolution in Knowledge-Driven Health IT: A 50-Year Perspective and a Look Ahead,” in Conference on Artificial Intelligence in Medicine in Europe, 2015, pp. 3–20.
[7] D. Wang, M. Peleg, S. W. Tu, A. A. Boxwala, O. Ogunyemi, Q. Zeng, R. A. Greenes, V. L. Patel, and E. H. Shortliffe, “Design and implementation of the GLIF3 guideline execution engine,” J Biomed Inform, vol. 37, no. 5. pp. 305–318, 2004.
[8] M. Peleg, “Computer-interpretable Clinical Guidelines: a Methodological Review,” J. Biomed. Inform., vol. 46, no. 4, pp. 744–763, 2013.
[9] A. González-Ferrer and M. Peleg, “Understanding requirements of clinical
data standards for developing interoperable knowledge-based DSS: A case study,” Comput. Stand. Interfaces, vol. 42, pp. 125–136, 2015.
[10] E. Parimbelli, L. Sacchi, and R. Bellazzi, “Decision Support through Data Integration: Strategies to Meet the Big Data Challenge,” EJBI, vol. 12, no. 1, 2016.
[11] J. C. Mandel, D. A. Kreda, K. D. Mandl, I. S. Kohane, and R. B. Ramoni, “SMART on FHIR: a standards-based, interoperable apps platform for electronic health records,” J. Am. Med. Informatics Assoc., p. ocv189, 2016.
[12] M. Peleg, Y. Shahar, and S. Quaglini, “Making healthcare more accessible, better, faster, and cheaper: the MobiGuide Project,” Eur. J. e-Practice, vol. 20, pp. 5–20, 2014.
[13] R. Lenz, M. Peleg, and M. Reichert, “Healthcare Process Support: Achievements, Challenges, Current Research,” Int. J. Knowledge-Based Organ., vol. 2(4), 2012.
[14] W. Van Der Aalst, A. Adriansyah, A. K. A. de Medeiros, F. Arcieri, T. Baier, T. Blickle, J. C. Bose, P. van den Brand, R. Brandtjen, J. Buijs, and others, “Process mining manifesto,” in Business process management workshops, 2012, pp. 169–194.
[15] R. S. Mans, W. M. P. van der Aalst, R. J. B. Vanwersch, and A. J. Moleman, “Process mining in healthcare: Data challenges when answering frequently posed questions,” in Process Support and Knowledge Representation in Health Care, Springer, 2013, pp. 140–153.
[16] R. Bellazzi and B. Zupan, “Predictive data mining in clinical medicine: Current issues and guidelines,” International Journal of Medical Informatics, vol. 77, no. 2. pp. 81–97, 2008.
[17] R. Bellazzi, F. Ferrazzi, and L. Sacchi, “Predictive data mining in clinical medicine: a focus on selected methods and applications,” Wiley Interdiscip. Rev. Data Min. Knowl. Discov., vol. 1, no. 5, pp. 416–430, 2011.
[18] B. Dawson-Saunders, P. J. Feltovich, R. L. Coulson, and D. E. Steward, “A survey of medical school teachers to identify basic biomedical concepts medical students should understand.,” Acad. Med., vol. 65, no. 7, pp. 448–454, 1990.
[19] A. González-Ferrer, M. Valcárcel, J. Cháfer, M. Cuesta, I. Runkle, G. Seara, M. Armengol, and J. Mayol, “Diagnóstico y tratamiento de hiponatremia usando modelos computacionales de guías de práctica clínica,” in Actas del XIX Congreso Nacional de Informática para la Salud, INFORSALUD, 2016, pp. 193–198.
[20] A. González-Ferrer, M. Á. Valcárcel, M. Cuesta, J. Cháfer, and I. Runkle, “Development of a computer-interpretable clinical guideline model for decision support in the differential diagnosis of hyponatremia,” in (to be published), 2017.
[21] J. Fox and A. Rahmanzadeh, “Disseminating medical knowledge: the PROforma approach,” Artificial Intelligence in Medicine, vol. 14. pp. 157–181, 1998.
[22] J. Fox, M. Gutenstein, O. Khan, M. South, and R. Thomson, “OpenClinical. net: A platform for creating and sharing knowledge and promoting best practice in healthcare,” Comput. Ind., vol. 66, pp. 63–72, 2015.
[23] W. Fenske, S. K. G. Maier, A. Blechschmidt, B. Allolio, and S. Störk, “Utility and limitations of the traditional diagnostic approach to hyponatremia: a diagnostic study,” Am. J. Med., vol. 123, no. 7, pp. 652–657, 2010.
[24] A. González-Ferrer, M. Á. Valcárcel, M. Cuesta, H. González-Luengo, and I. Runkle, “Comorbidities in the Syndrome of Inappropriate Antidiuretic Hormone Secretion: A Hierarchical Clustering Analysis on Discharge Data,” in (to be published), 2017.
[25] K. R. Clarke, P. J. Somerfield, and R. N. Gorley, “Testing of null hypotheses in exploratory community analyses: similarity profiles and biota-environment linkage,” J. Exp. Mar. Bio. Ecol., vol. 366, no. 1, pp. 56–69, 2008.
[26] S. Owen, R. Anil, T. Dunning, and E. Friedman, Mahout in action. Manning Shelter Island, NY, 2012.
[27] ENISA, “Smart Hospitals: Security and Resilience for Smart Health Service and Infrastructures,” 2016.
[28] G. Seara, A. Payá, and J. Mayol, “Value-based healthcare delivery in the digital era,” Eur. Psychiatry, vol. 33, p. S33, 2016.
[29] A. Muñoz Carrero, A. Romero Gutiérrez, G. Marco Cuenca, A. Abad Acebedo, J. Cáceres Tello, R. Sánchez De Madariaga, P. Serrano Balazote, A. Moner Cano, and J. A. Maldonado Segura, Manual práctico de interoperabilidad semántica para entornos sanitarios basada en

International Journal of Interactive Multimedia and Artificial Intelligence
- 46 -
arquetipos. Madrid: Unidad de investigación en Telemedicina y e-Salud: Instituto de Salud Carlos III, 2013.
[30] European Union, “Regulation (EU) 2016/679 on the protection of natural persons with regard to the processing of personal data and on the free movement of such data, and repealing Directive 95/46/EC.” [Online]. Available: http://eur-lex.europa.eu/legal-content/EN/TXT/?uri=CELEX:32016R0679.
[31] R. J. Cruz-Correia, P. Rodrigues, A. Freitas, F. C. Almeida, R. Chen, and A. Costa-Pereira, “Data quality and integration issues in electronic health records,” Inf. Discov. Electron. Heal. Rec., pp. 55–95, 2009.
[32] N. G. Weiskopf and C. Weng, “Methods and dimensions of electronic health record data quality assessment: enabling reuse for clinical research,” J. Am. Med. Informatics Assoc., vol. 20, no. 1, pp. 144–151, 2013.
[33] R. A. Miller and S. M. Miller, “Legal and regulatory issues related to the use of clinical software in health care delivery,” in Clinical Decision Support: The Road to Broad Adoption, R. Greenes, Ed. Academic Press, Elsevier, 2014, pp. 711–740.
Arturo González-Ferrer. Born in Granada, November 1976. Graduated in B.Sc.Computer Science (2001) and holding a Ph.D. (summa cum laude) in Design, Analysis and Applications of Artificial Intelligence (2011), both degrees from the University of Granada (Spain). He was postdoctoral fellow at the Biomedical Informatics and Processes group of University of Haifa, Israel (2011-2013). He is currently employed as Chief Research Officer at the
Innovation Unit of Hospital Clínico San Carlos, Madrid. Previously he was appointed as lecturer at the Department of Computer Science of University Carlos III, Madrid, carrying out research activities in the Planning & Learning group. Relevant publications: 1. González-Ferrer, A., Ten Teije, A., Fdez-Olivares, J., & Milian, K. (2013). Automated generation of patient-tailored electronic care pathways by translating computer-interpretable guidelines into hierarchical task networks. Artificial intelligence in medicine, 57(2), 91-109. 2. Marcos, C., González-Ferrer, A., Peleg, M., & Cavero, C. (2015). Solving the interoperability challenge of a distributed complex patient guidance system: a data integrator based on HL7’s virtual medical record standard. JAMIA 22(3), p. 587-599. 3. González-Ferrer, A., & Peleg, M. (2015). Understanding requirements of clinical data standards for developing interoperable knowledge-based DSS: a case study. Computer Standards & Interfaces 42, 125-136. Research interests: artificial intelligence, biomedical informatics.
Germán Seara. Born in Madrid, March 1951, Graduated in Medicine in 1975 from Universidad Complutense de Madrid Medical School. Specialization in Pediatrics at Hospital Universitario Clinico San Carlos (HUCSC) 1976-80, Madrid.FIS Scholarship for Extension Studies at Northwick Park Hospital & Clinical Research Center, Harrow, UK.Top Managerial Programme in King’s Fund, London/UK and ENS, Madrid, Spain. He was former
Chief Medical Officer at Hospital Clinico San Carlos and in other hospitals and he is currently appointed to the Innovation Unit of HUCSC. Recent Publications: Integración clínica en el paciente crónico, Carretero Alcántara L, Comes Górriz N, Borrás López A, Rodríguez Balo A y Seara Aguilar G. Enferm Clin. 2014;24(1):35-43.G. Seara, A. Payá, J. Mayol, Value-Based Healthcare Delivery in the Digital Era. European Psychiatry March 2016, Vol 33S pp S46. Research interests: health care, innovation. Dr. Seara memberships: Asociación Española de Pediatría.
Joan Cháfer. Born in Barcelona in June 1958. Graduated with honors in Medicine in 1981 from the Universidad Autónoma de Barcelona Medical School. Specialization in internal medicine at Hospital Clínico San Carlos 1983-1988. Research Fellow in Hepatology, Immunology, and Molecular Biology at King’s College Hospital and Royal London Hospital. 1987-95. Has held several clinical and research positions in several hospitals in Madrid until 2000.
Since then he has been involved in research management. Between 2008-12 he was CTO at Hospital Clinico San Carlos. Since 2012 he is a member of the Innovation Unit of Hospital Clinico San Carlos, Madrid, where he contributes his experience in bridging medicine, science and IT.
Julio Mayol. Born in Madrid, July 22nd 1963, Graduated with honors in Medicine in 1988 and PhD summa cum laude in Medicine in Medicine in 1992, both from Universidad Complutense de Madrid Medical School. Specialization in general surgery at Hospital Clinico San Carlos 1991-1995. Fellow in Surgery at Beth Israel Deaconess Medical Center - Harvard Medical School. Attending surgeon. Associate Professor of Surgery. Chief of the Division of Colorectal
Surgery. Full Professor of Surgery at Universidad Complutense de Madrid Medical School. Visiting Professor at Wayne State University. Chief Medical Officer at Hospital Clinico San Carlos. Publications: 1. Chapman SJ, Mayol J, Brady RR. Twitter can enhance the medical conference experience. BMJ. 2016 Jul 19;354: i3973. - Mayol Martinez J. Innovation in Surgery. Cir Esp. 2016 Apr;94(4):207-9. - Maeso S, Reza M, Mayol JA, Blasco JA, Guerra M, Andradas E, Plana MN. Efficacy of the Da Vinci Surgical System in Abdominal Surgery Compared withThat of Laparoscopy: A Systematic Review and Meta-Analysis. Ann Surg. 2010 Aug;252(2):254-62. PMID: 20622659. Research interests: colorectal surgery, biomedical technology, innovation, Prof. Julio Mayol memberships: American Gastroenterological Association, Society for Surgery of the Alimentary Tract, Asociación Española de Cirujanos, Sociedad Española de Investigaciones Quirúrgicas.
In Press Special Issue on Big Data and e-Health
DOI: 10.9781/ijimai.2017.03.007
Big Data and Health Economics: Opportunities, Challenges and Risks
Diego J. Bodas-Sagi, José M. Labeaga
Universidad Nacional de Educación a Distancia (UNED), Spain
Abstract — Big Data offers opportunities in many fields.
Healthcare is not an exception. In this paper we summarize the
possibilities of Big Data and Big Data technologies to offer useful
information to policy makers. In a world with tight public budgets
and ageing populations we feel necessary to save costs in any
production process. The use of outcomes from Big Data could
be in the future a way to improve decisions at a lower cost than
today. In addition to list the advantages of properly using data and
technologies from Big Data, we also show some challenges and risks
that analysts could face. We also present an hypothetical example
of the use of administrative records with health information both
for diagnoses and patients.
Keywords — Big Data, Healthcare, Data Science, Machine
Learning.
I. IntRoductIon
accoRdIng to Edd Dumbill from O’Really Media, “Big data is data that exceeds the processing capacity of conventional database
systems. The data is too big, moves too fast, or doesn’t fit the structures of your database architectures. To gain value from this data, you must choose an alternative way to process it” [1]. The challenge is not about dealing with trillions of bytes of streaming data, it is about getting started with a quantitative approach so that you can drive value from your data, whatever size that data is. Data Scientists help understand the value of data to take timely and relevant actions [2].
Our economy depends on data. Data is everywhere, in every sector, in every country. We generate and consume data. Our interaction with machines, people, companies and public institutions produces data. Information allows us to improve the business processes and provide our customers and partners with the best quality standards, services and products. Big Data generates value in several ways, according to McKinsey [3]:
1. Creating transparency: making data accessible in • Creating transparency: making data accessible timely manner.• Enabling experimentation: collecting more accurate and detailed
performance data, setting up controlling experiments. • Segmenting populations to customize actions, target promotions
and advertisement. • Replacing/supporting human decisions making with automated
algorithms. • Innovating new business models, products and services: UBER,
Spotify, LinkedIn, Twitter, Netflix are well-known examples of this.
Big Data is affecting healthcare too. In 2012, worldwide health care data reached 500 petabytes and it is expected that in 2020 there will be more than 25000 petabytes available. The 2011 report by McKinsey
Global Institute estimate that the potential value that can be extracted from data in the healthcare sector in US could be more than $300 billion per year.
Again, in the US, several initiatives encouraging the use of Big Data for health, like the Affordable Care Act, a set of health data initiatives by the department of health and human services. The Heritage Provider Network Health Prize (http://www.heritagehealthprize.com) challenge offers a $3 millions prize to improve healthcare avoiding unnecessary hospital admissions. More than 71 million individuals in the United States are admitted to hospitals each year, which approximately implies a $30 billion bill wasted, according to a survey from the American Hospital Association. Medicare penalizes hospitals that have high rates of readmissions among patients with hearth failure, hearth attack and pneumonia, to avoid this loss.
US Government holds other projects like BRAIN (Brain Research through Advancing Innovative Neurotechnologies), bolding $100 million to revolutionize our understanding of the human brain (that generates a huge amount of information). The scientists’ goal is to get answers to Alzheimer’s disease, epilepsy and new treatments for traumatic brain injury. In March 2012, the Obama Administration launched a $200 million “Big Data Research and Development Initiative”, one of whose main aims is to transform the use of big data for scientific discovery and biomedical research.
The European Commission (EU) is not an exception and some projects have been proposed under the EU Research and Innovation Programme Horizon 2020. Other Health 2.0 initiatives are being carried out by different countries with the aim of accelerating innovation and obtaining better ways to manage patients, institutions and establish more convenient policies. Medical institutions, insurance companies and governments are applying healthcare Big Data to cut down medical service costs and to optimize patient’s attention.
Many initiatives gaze at or are focused on healthcare data digitalization. An Electronic Health Record (EHR) refers to the systematized collection of patient and population electronically stored health information in a digital format [4]. In 2005, only about 30% of office-based physicians and hospital in the US used EHR. By the end of 2011, this figure rose to more than 50% for physicians and 75% for hospitals. We come back to the importance of EHR for healthcare below.
The rest of the paper is structured as follows: First, we explore the relation between healthcare and economy. Next, we try to explain in more detail the opportunities offered by Big Data in the healthcare sector. We also comment on some challenges and risks. Big Data projects require a specific methodological approach commented in section V. Section VII present a hypothetical example based on real although non-public data from administrative records. Finally, we conclude and summarize.
International Journal of Interactive Multimedia and Artificial Intelligence
- 48 -
II. ealthcaRe and the econoMy
Health performance is positively correlated with economic performance; wealthier countries have healthier populations [5]. In many countries, the healthcare system has to afford several major challenges including ageing populations, chronic illnesses, ensuring universal access, guarantying equity and raising quality of care. New technologies and data analysis techniques might help to overcome these tasks. According to the Organisation for Economic Co-operation and Development (OECD) and due to the economic crisis, many years of consecutive health expending growth ground to a halt in 2008; health budgets were cut since then and, they are likely to remain tight for a number of years to come [6, 7]. On average, countries devote only 3% of their health budgets to spending on prevention [8]. The OECD recommends to policy makers focus their efforts on building health systems that meet population needs and deliver excellent value for money. Being able to reliably measure and compare health system performance will be crucial to achieve this goal. In this context, it is very important for governments and institutions to obtain timely data. It could help to ensure adequate and sustainable provision of high-quality services at correct administrative costs. In addition, it is necessary to study the occurrence and cost of fraud, abuse and corruption in health systems, as well as the policies to fight them. All these aims require new data, new statistics, better measures of outcomes and more patient-reported measures and it opens the door to the use of big data and suitable methods.
Health systems must adapt to take advantage of the development of new technologies to get personalized medicine. This paradigm tries to overcome the limitations of traditional medicine taking into account the unique genetic map for each individual. It is mandatory to effectively integrate new technologies into health systems to get personalized medicine and move to national aggregate measures of health care quality to more granular measures at hospitals [6, 7]. Healthcare information and advanced analytics may contribute to shift from population-based evidence for healthcare decision-making to the fusion of population and individual-based evidence in healthcare [9]. The effects might be immediate and cover from better treatments and diagnoses to reduce labor force transitions after a health/disability shock [10].
Focusing on the economic aspects of healthcare, we need to improve the state-of-the-art of forecasting models of health spending to develop expenditure projections that explore the impact of different policy scenarios and policies [11]. Some facts confirm this statement. The US has not seen an increase in life expectancy or last-days quality of life to match its huge outlay on health care. Although the US healthcare expenditures are the highest of any developed country, at 17,1% of GDP in 2014, according to the World Health Organization Global Health Expenditure database (http://data.worldbank.org/indicator/SH.XPD.TOTL.ZS), such expenditures does not seem to improve health outcomes. However, the rising cost of medical care and health insurance is impacting the livelihood of many Americans [12].
Other countries have different problems. South Korea has one of the most advanced information technology (IT) infrastructures in the world. The application of IT in health systems is rapidly progressing from computerization to information, ubiquitous and start systems. All in all, the cost of health in terms of GDP is 7,4%, less than half the cost in of the US system. However, a major problem concerning healthcare resources lies in the regional disparities between medical services [13].
There are many researchers and institutions involved in the study of economic and health inequality [14]. Inequalities in health are linked to many factors, including differences in exposure to risk factors, and differences in the access to health care [15]. The economic crisis has had deep consequences in the labor market and public policies of many
developed countries. Labor market conditions have deteriorated with increased unemployment rates and wage cuts, reforms in the public pension and the health care systems, among others. Undoubtedly, this may have an impact on the population’s health and/or the equity and efficiency of healthcare systems. Several authors provide evidence on the relationship among unemployment rates, business cycle conditions or housing conditions on health variables in the short-run [16, 17, 18]. Budget cuts have an impact on dependent people, for example and in Spain, demand for private long-term care insurance has grown in recent years and this can be attributed to budget cuts affecting the implementation of System of Autonomy and Attention to Dependent People [19].
Of course, we cannot ignore the potential that Big Data Technologies provide to pharmaceutical companies. In this sector spending is declining in real terms, due to top-selling drug patent losses and to fiscal consolidation measures adopted by many OECD countries. Using Big Data, pharmaceutical companies can better identify new potential drug candidates and develop new effective products, approving and reimbursing medicines more quickly [3].
III. bIg data oppoRtunItIes
Healthcare needs more efficient practices, research, and tools to harness the full benefits of personal health and healthcare-related data [20]. Many healthcare researches use advanced analytics tools to bring order, understanding data and reduce complexity. Researches, hospitals and physicians have access to rich sources of data that have potential for an increased understanding of disease mechanisms and better reporting. However, the size and complexity of the data present many challenges. There is a recognizable need for scalable tools that can discover patterns without discounting the statistical complexity of heterogeneous data or falling prey to the noise it includes [20]. This data-driven culture together with a share-knowledge attitude can play a critical role in the emergence of personalized healthcare. Numerous diseases have preventable risks factors or at least indicators of risk. Improving the prevention systems is possible and viable; we can consider not only healthcare or genomic variables, but also economic, demographic and lifestyle variables. Healthcare is moving from a disease-centered model towards a patient-centered model [21, 22]. Big Data technologies offer many opportunities to proactive medicine too. From the clinical patient’s data, it is possible to find similarities of that patient to millions of other patients. So, this allows physicians to go ahead and predict the likely of new relapses and the effect of drugs.
Getting into further detail, Big Data Analytics will impact healthcare in several ways [23, 24]:• Right living: data can help patients to take an active role in their
own health (i.e. practicing some sports).• Right care: data can improve outcomes and reduce medical errors.• Right provider: hospital and patients can select the best provider
based on data.• Right value: data analytics has potential to eliminate fraud, waste
and abuse.• Right innovation: a sharing-knowledge culture and data-driven
networks allow more flexible, efficient and innovative ways of working.
• Providing patient centric services: provide faster relief by providing evidence-based medicine, reducing readmissions and reducing costs.
• Detecting spreading diseases earlier.• Monitoring the hospital’s quality.• Improving the treatment methods.
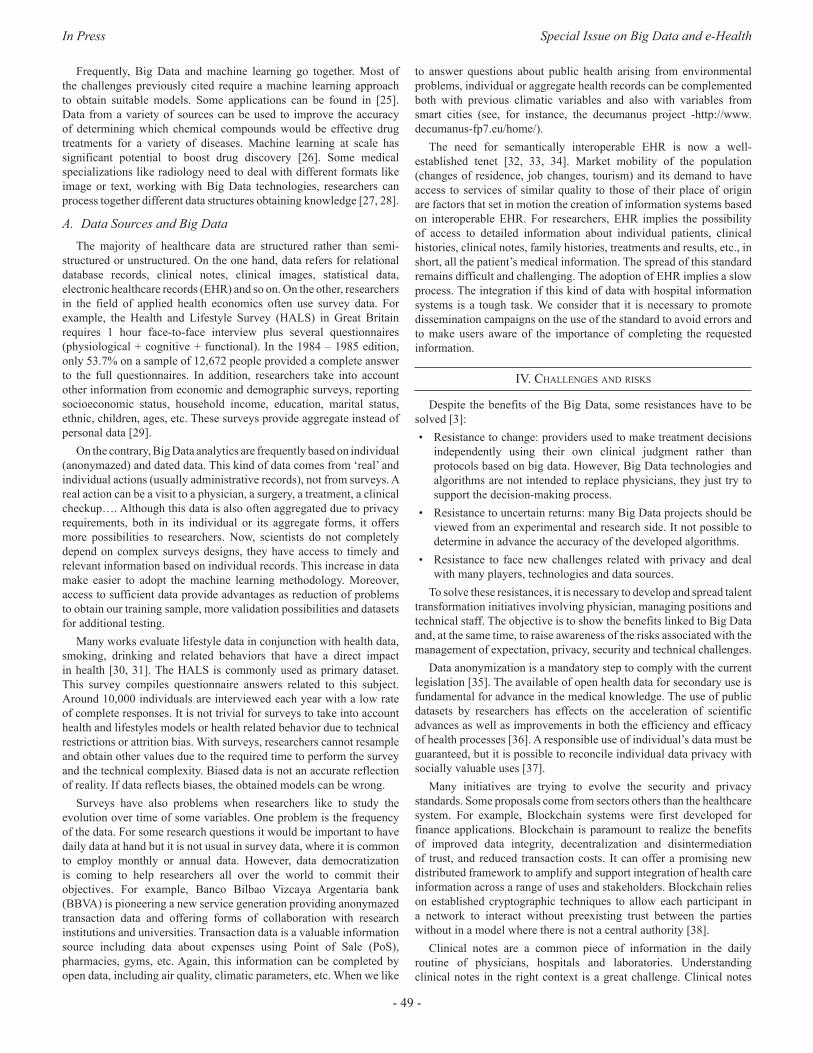
In Press Special Issue on Big Data and e-Health
- 49 -
Frequently, Big Data and machine learning go together. Most of the challenges previously cited require a machine learning approach to obtain suitable models. Some applications can be found in [25]. Data from a variety of sources can be used to improve the accuracy of determining which chemical compounds would be effective drug treatments for a variety of diseases. Machine learning at scale has significant potential to boost drug discovery [26]. Some medical specializations like radiology need to deal with different formats like image or text, working with Big Data technologies, researchers can process together different data structures obtaining knowledge [27, 28].
A. Data Sources and Big DataThe majority of healthcare data are structured rather than semi-
structured or unstructured. On the one hand, data refers for relational database records, clinical notes, clinical images, statistical data, electronic healthcare records (EHR) and so on. On the other, researchers in the field of applied health economics often use survey data. For example, the Health and Lifestyle Survey (HALS) in Great Britain requires 1 hour face-to-face interview plus several questionnaires (physiological + cognitive + functional). In the 1984 – 1985 edition, only 53.7% on a sample of 12,672 people provided a complete answer to the full questionnaires. In addition, researchers take into account other information from economic and demographic surveys, reporting socioeconomic status, household income, education, marital status, ethnic, children, ages, etc. These surveys provide aggregate instead of personal data [29].
On the contrary, Big Data analytics are frequently based on individual (anonymazed) and dated data. This kind of data comes from ‘real’ and individual actions (usually administrative records), not from surveys. A real action can be a visit to a physician, a surgery, a treatment, a clinical checkup…. Although this data is also often aggregated due to privacy requirements, both in its individual or its aggregate forms, it offers more possibilities to researchers. Now, scientists do not completely depend on complex surveys designs, they have access to timely and relevant information based on individual records. This increase in data make easier to adopt the machine learning methodology. Moreover, access to sufficient data provide advantages as reduction of problems to obtain our training sample, more validation possibilities and datasets for additional testing.
Many works evaluate lifestyle data in conjunction with health data, smoking, drinking and related behaviors that have a direct impact in health [30, 31]. The HALS is commonly used as primary dataset. This survey compiles questionnaire answers related to this subject. Around 10,000 individuals are interviewed each year with a low rate of complete responses. It is not trivial for surveys to take into account health and lifestyles models or health related behavior due to technical restrictions or attrition bias. With surveys, researchers cannot resample and obtain other values due to the required time to perform the survey and the technical complexity. Biased data is not an accurate reflection of reality. If data reflects biases, the obtained models can be wrong.
Surveys have also problems when researchers like to study the evolution over time of some variables. One problem is the frequency of the data. For some research questions it would be important to have daily data at hand but it is not usual in survey data, where it is common to employ monthly or annual data. However, data democratization is coming to help researchers all over the world to commit their objectives. For example, Banco Bilbao Vizcaya Argentaria bank (BBVA) is pioneering a new service generation providing anonymazed transaction data and offering forms of collaboration with research institutions and universities. Transaction data is a valuable information source including data about expenses using Point of Sale (PoS), pharmacies, gyms, etc. Again, this information can be completed by open data, including air quality, climatic parameters, etc. When we like
to answer questions about public health arising from environmental problems, individual or aggregate health records can be complemented both with previous climatic variables and also with variables from smart cities (see, for instance, the decumanus project -http://www.decumanus-fp7.eu/home/).
The need for semantically interoperable EHR is now a well-established tenet [32, 33, 34]. Market mobility of the population (changes of residence, job changes, tourism) and its demand to have access to services of similar quality to those of their place of origin are factors that set in motion the creation of information systems based on interoperable EHR. For researchers, EHR implies the possibility of access to detailed information about individual patients, clinical histories, clinical notes, family histories, treatments and results, etc., in short, all the patient’s medical information. The spread of this standard remains difficult and challenging. The adoption of EHR implies a slow process. The integration if this kind of data with hospital information systems is a tough task. We consider that it is necessary to promote dissemination campaigns on the use of the standard to avoid errors and to make users aware of the importance of completing the requested information.
Iv. challenges and RIsks
Despite the benefits of the Big Data, some resistances have to be solved [3]:• Resistance to change: providers used to make treatment decisions
independently using their own clinical judgment rather than protocols based on big data. However, Big Data technologies and algorithms are not intended to replace physicians, they just try to support the decision-making process.
• Resistance to uncertain returns: many Big Data projects should be viewed from an experimental and research side. It not possible to determine in advance the accuracy of the developed algorithms.
• Resistance to face new challenges related with privacy and deal with many players, technologies and data sources.
To solve these resistances, it is necessary to develop and spread talent transformation initiatives involving physician, managing positions and technical staff. The objective is to show the benefits linked to Big Data and, at the same time, to raise awareness of the risks associated with the management of expectation, privacy, security and technical challenges.
Data anonymization is a mandatory step to comply with the current legislation [35]. The available of open health data for secondary use is fundamental for advance in the medical knowledge. The use of public datasets by researchers has effects on the acceleration of scientific advances as well as improvements in both the efficiency and efficacy of health processes [36]. A responsible use of individual’s data must be guaranteed, but it is possible to reconcile individual data privacy with socially valuable uses [37].
Many initiatives are trying to evolve the security and privacy standards. Some proposals come from sectors others than the healthcare system. For example, Blockchain systems were first developed for finance applications. Blockchain is paramount to realize the benefits of improved data integrity, decentralization and disintermediation of trust, and reduced transaction costs. It can offer a promising new distributed framework to amplify and support integration of health care information across a range of uses and stakeholders. Blockchain relies on established cryptographic techniques to allow each participant in a network to interact without preexisting trust between the parties without in a model where there is not a central authority [38].
Clinical notes are a common piece of information in the daily routine of physicians, hospitals and laboratories. Understanding clinical notes in the right context is a great challenge. Clinical notes
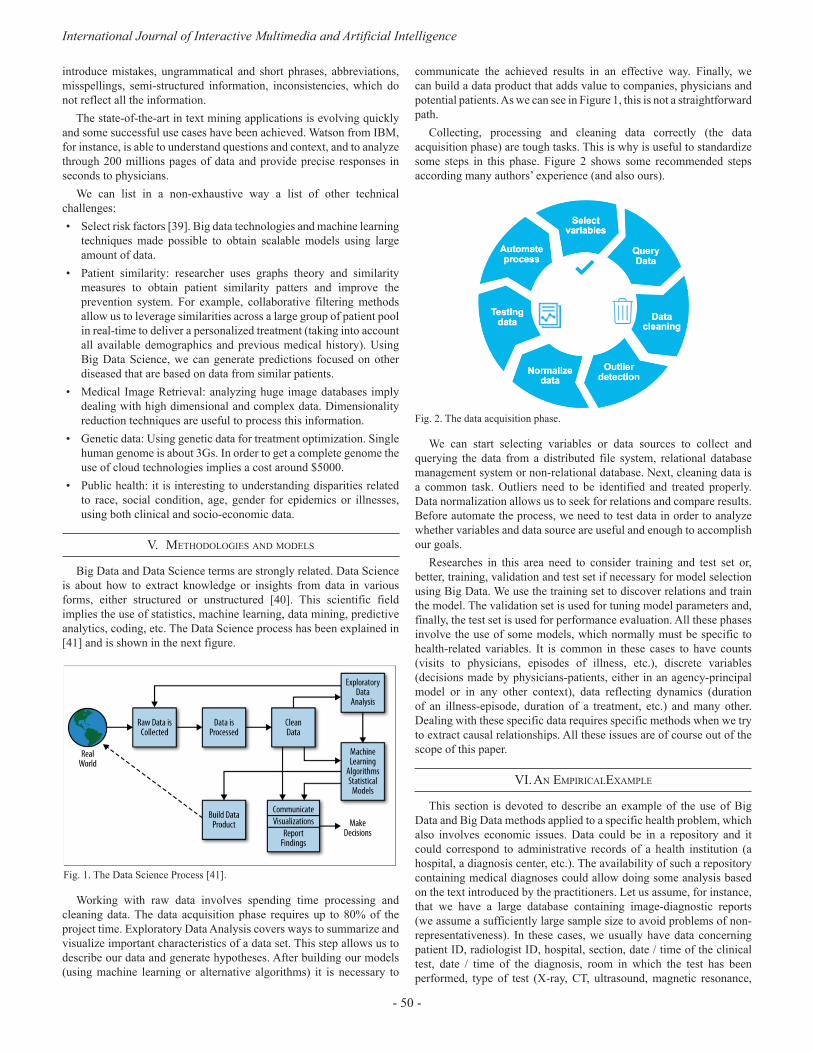
International Journal of Interactive Multimedia and Artificial Intelligence
- 50 -
introduce mistakes, ungrammatical and short phrases, abbreviations, misspellings, semi-structured information, inconsistencies, which do not reflect all the information.
The state-of-the-art in text mining applications is evolving quickly and some successful use cases have been achieved. Watson from IBM, for instance, is able to understand questions and context, and to analyze through 200 millions pages of data and provide precise responses in seconds to physicians.
We can list in a non-exhaustive way a list of other technical challenges:• Select risk factors [39]. Big data technologies and machine learning
techniques made possible to obtain scalable models using large amount of data.
• Patient similarity: researcher uses graphs theory and similarity measures to obtain patient similarity patters and improve the prevention system. For example, collaborative filtering methods allow us to leverage similarities across a large group of patient pool in real-time to deliver a personalized treatment (taking into account all available demographics and previous medical history). Using Big Data Science, we can generate predictions focused on other diseased that are based on data from similar patients.
• Medical Image Retrieval: analyzing huge image databases imply dealing with high dimensional and complex data. Dimensionality reduction techniques are useful to process this information.
• Genetic data: Using genetic data for treatment optimization. Single human genome is about 3Gs. In order to get a complete genome the use of cloud technologies implies a cost around $5000.
• Public health: it is interesting to understanding disparities related to race, social condition, age, gender for epidemics or illnesses, using both clinical and socio-economic data.
v. MethodologIes and Models
Big Data and Data Science terms are strongly related. Data Science is about how to extract knowledge or insights from data in various forms, either structured or unstructured [40]. This scientific field implies the use of statistics, machine learning, data mining, predictive analytics, coding, etc. The Data Science process has been explained in [41] and is shown in the next figure.
Fig. 1. The Data Science Process [41].
Working with raw data involves spending time processing and cleaning data. The data acquisition phase requires up to 80% of the project time. Exploratory Data Analysis covers ways to summarize and visualize important characteristics of a data set. This step allows us to describe our data and generate hypotheses. After building our models (using machine learning or alternative algorithms) it is necessary to
communicate the achieved results in an effective way. Finally, we can build a data product that adds value to companies, physicians and potential patients. As we can see in Figure 1, this is not a straightforward path.
Collecting, processing and cleaning data correctly (the data acquisition phase) are tough tasks. This is why is useful to standardize some steps in this phase. Figure 2 shows some recommended steps according many authors’ experience (and also ours).
Fig. 2. The data acquisition phase.
We can start selecting variables or data sources to collect and querying the data from a distributed file system, relational database management system or non-relational database. Next, cleaning data is a common task. Outliers need to be identified and treated properly. Data normalization allows us to seek for relations and compare results. Before automate the process, we need to test data in order to analyze whether variables and data source are useful and enough to accomplish our goals.
Researches in this area need to consider training and test set or, better, training, validation and test set if necessary for model selection using Big Data. We use the training set to discover relations and train the model. The validation set is used for tuning model parameters and, finally, the test set is used for performance evaluation. All these phases involve the use of some models, which normally must be specific to health-related variables. It is common in these cases to have counts (visits to physicians, episodes of illness, etc.), discrete variables (decisions made by physicians-patients, either in an agency-principal model or in any other context), data reflecting dynamics (duration of an illness-episode, duration of a treatment, etc.) and many other. Dealing with these specific data requires specific methods when we try to extract causal relationships. All these issues are of course out of the scope of this paper.
vI. an eMpIRIcalexaMple
This section is devoted to describe an example of the use of Big Data and Big Data methods applied to a specific health problem, which also involves economic issues. Data could be in a repository and it could correspond to administrative records of a health institution (a hospital, a diagnosis center, etc.). The availability of such a repository containing medical diagnoses could allow doing some analysis based on the text introduced by the practitioners. Let us assume, for instance, that we have a large database containing image-diagnostic reports (we assume a sufficiently large sample size to avoid problems of non-representativeness). In these cases, we usually have data concerning patient ID, radiologist ID, hospital, section, date / time of the clinical test, date / time of the diagnosis, room in which the test has been performed, type of test (X-ray, CT, ultrasound, magnetic resonance,
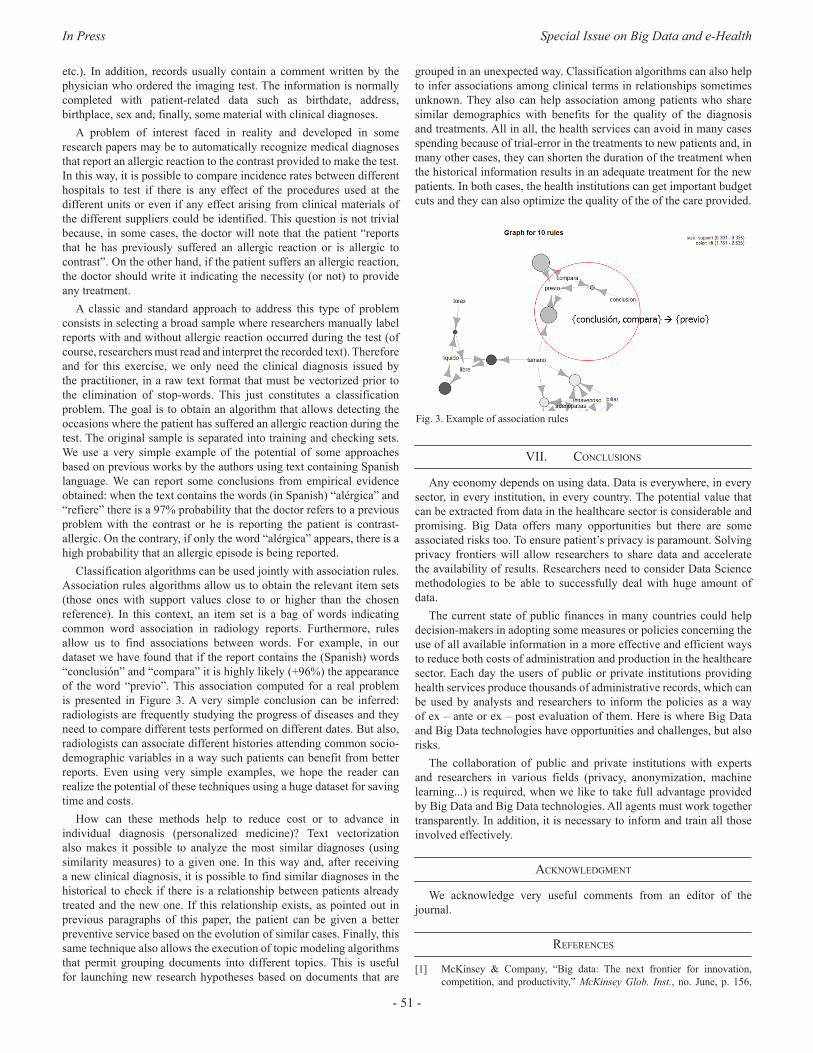
In Press Special Issue on Big Data and e-Health
- 51 -
etc.). In addition, records usually contain a comment written by the physician who ordered the imaging test. The information is normally completed with patient-related data such as birthdate, address, birthplace, sex and, finally, some material with clinical diagnoses.
A problem of interest faced in reality and developed in some research papers may be to automatically recognize medical diagnoses that report an allergic reaction to the contrast provided to make the test. In this way, it is possible to compare incidence rates between different hospitals to test if there is any effect of the procedures used at the different units or even if any effect arising from clinical materials of the different suppliers could be identified. This question is not trivial because, in some cases, the doctor will note that the patient “reports that he has previously suffered an allergic reaction or is allergic to contrast”. On the other hand, if the patient suffers an allergic reaction, the doctor should write it indicating the necessity (or not) to provide any treatment.
A classic and standard approach to address this type of problem consists in selecting a broad sample where researchers manually label reports with and without allergic reaction occurred during the test (of course, researchers must read and interpret the recorded text). Therefore and for this exercise, we only need the clinical diagnosis issued by the practitioner, in a raw text format that must be vectorized prior to the elimination of stop-words. This just constitutes a classification problem. The goal is to obtain an algorithm that allows detecting the occasions where the patient has suffered an allergic reaction during the test. The original sample is separated into training and checking sets. We use a very simple example of the potential of some approaches based on previous works by the authors using text containing Spanish language. We can report some conclusions from empirical evidence obtained: when the text contains the words (in Spanish) “alérgica” and “refiere” there is a 97% probability that the doctor refers to a previous problem with the contrast or he is reporting the patient is contrast-allergic. On the contrary, if only the word “alérgica” appears, there is a high probability that an allergic episode is being reported.
Classification algorithms can be used jointly with association rules. Association rules algorithms allow us to obtain the relevant item sets (those ones with support values close to or higher than the chosen reference). In this context, an item set is a bag of words indicating common word association in radiology reports. Furthermore, rules allow us to find associations between words. For example, in our dataset we have found that if the report contains the (Spanish) words “conclusión” and “compara” it is highly likely (+96%) the appearance of the word “previo”. This association computed for a real problem is presented in Figure 3. A very simple conclusion can be inferred: radiologists are frequently studying the progress of diseases and they need to compare different tests performed on different dates. But also, radiologists can associate different histories attending common socio-demographic variables in a way such patients can benefit from better reports. Even using very simple examples, we hope the reader can realize the potential of these techniques using a huge dataset for saving time and costs.
How can these methods help to reduce cost or to advance in individual diagnosis (personalized medicine)? Text vectorization also makes it possible to analyze the most similar diagnoses (using similarity measures) to a given one. In this way and, after receiving a new clinical diagnosis, it is possible to find similar diagnoses in the historical to check if there is a relationship between patients already treated and the new one. If this relationship exists, as pointed out in previous paragraphs of this paper, the patient can be given a better preventive service based on the evolution of similar cases. Finally, this same technique also allows the execution of topic modeling algorithms that permit grouping documents into different topics. This is useful for launching new research hypotheses based on documents that are
grouped in an unexpected way. Classification algorithms can also help to infer associations among clinical terms in relationships sometimes unknown. They also can help association among patients who share similar demographics with benefits for the quality of the diagnosis and treatments. All in all, the health services can avoid in many cases spending because of trial-error in the treatments to new patients and, in many other cases, they can shorten the duration of the treatment when the historical information results in an adequate treatment for the new patients. In both cases, the health institutions can get important budget cuts and they can also optimize the quality of the of the care provided.
Fig. 3. Example of association rules
vII. conclusIons
Any economy depends on using data. Data is everywhere, in every sector, in every institution, in every country. The potential value that can be extracted from data in the healthcare sector is considerable and promising. Big Data offers many opportunities but there are some associated risks too. To ensure patient’s privacy is paramount. Solving privacy frontiers will allow researchers to share data and accelerate the availability of results. Researchers need to consider Data Science methodologies to be able to successfully deal with huge amount of data.
The current state of public finances in many countries could help decision-makers in adopting some measures or policies concerning the use of all available information in a more effective and efficient ways to reduce both costs of administration and production in the healthcare sector. Each day the users of public or private institutions providing health services produce thousands of administrative records, which can be used by analysts and researchers to inform the policies as a way of ex – ante or ex – post evaluation of them. Here is where Big Data and Big Data technologies have opportunities and challenges, but also risks.
The collaboration of public and private institutions with experts and researchers in various fields (privacy, anonymization, machine learning...) is required, when we like to take full advantage provided by Big Data and Big Data technologies. All agents must work together transparently. In addition, it is necessary to inform and train all those involved effectively.
acknoWledgMent
We acknowledge very useful comments from an editor of the journal.
RefeRences
[1] McKinsey & Company, “Big data: The next frontier for innovation, competition, and productivity,” McKinsey Glob. Inst., no. June, p. 156,

International Journal of Interactive Multimedia and Artificial Intelligence
- 52 -
José M. Labeaga is Professor of Economics at the Open University in Madrid and Research Affiliated at UNU-MERIT (Maastricht University) and at Economics for Energy. He is Ms. and PhD. in Economics by Universitat Autónoma de Barcelona. He has served for the Spanish Government as General Director of the Institute for Fiscal Studies during the period 2008-2012. His main research interests rely on applied microeconometric
models, microsimulation and ex-ante evaluation of programs as well as ex-post or impact evaluation of public policies in several fields as health, energy or taxation. Contact address is: Universidad Nacional de Educación a Distancia. Departamento de Análisis Económico II. C/ Senda del Rey, 11 28040, Madrid (Spain); e-mail: [email protected]
2011.[2] E. Dumbill. What is Big Data? In Introduction to the Big Data Landscape.
Available: https://www.oreilly.com/ideas/what-is-big-data Accesed: Dec 2016.
[3] P. Groves, B. Kayyali, D. Knott, and S. Van Kuiken, “The ‘big data’ revolution in healthcare,” McKinsey Q., no. January, p. 22, 2013.
[4] T. D. Gunter and N. P. Terry, “The Emergence of National Electronic Health Record Architectures in the United States and Australia,” J. Med. Internet. Res., vol. 7, no. 1, pp. 1-e3, 2005.
[5] W. Hersh, J. A. Jacko, R. Greenes, J. Tan, D. Janies, P. J. Embi, and P. R. O. Payne, “Health-care hit or miss?,” Nature, vol. 470, no. 7334, pp. 327–9, 2011.
[6] OECD, Work on health. 2015. Available at: https://www.oecd.org/health/Health-Brochure.pdf. Accessed: Dec 2016.
[7] OECD, Health at a Glance 2015. 2015. Available at: http://www.patients-rights.org/uploadimages/FULL_REPORT.pdf Accessed: Dec 2016.
[8] F. Koechlin, P. Konijn, L. Lorenzoni, and P. Schreyer, “Comparing Hospital and Health Prices and Volumes Internationally,” OECD Heal. Work. Pap. No. 75, pp. 1–63, 2014.
[9] M. A. Hamburg and F. S. Collins, “The Path to Personalized Medicine - Perspective,” N. Engl. J. Med., vol. 363, no. 4, pp. 301–304, 2010.
[10] A. M. Jones, N. Rice, and J. Roberts, “Sick of work or too sick to work? Evidence on self-reported health shocks and early retirement from the BHPS,” Econ. Model., vol. 27, no. 4, pp. 866–880, 2010.
[11] R. Astolfi, L. Lorenzoni, and J. Oderkirk, “Informing policy makers about future health spending: a comparative analysis of forecasting methods in OECD countries,” Health Policy, vol. 107, no. 1, pp. 1–10, 2012.
[12] R. A. Cohen, M. G. Renee, and W. K. Kirzinger. “Financial burden of medical care: early release of estimates from the National Health Interview Survey, January-June 2011.” Natl. Cent. Heal. Stat., no. March, 2012.
[13] Y. Lee and H. Chang, “Ubiquitous Health in Korea: Progress, Barriers, and Prospects,” Healthcare Informatics Research, vol. 18, no. 4. pp. 242–251, 2012.
[14] A. Sen, On economic inequality. Oxford University Press, 1974.[15] J. Frenk, “Health and the economy: A vital relationship - OECD Observer,”
May, 2004. Available at: http://www.oecdobserver.org/news/archivestory.php/aid/1241/Health_and_the_economy:_A_vital_relationship_.html. Accesed: Dec. 2016.
[16] P. García-Góm ez, S. Jiménez-Martín, and J. M. Labeaga. “Consequences of the Economic Crisis on Health and Health Care Systems”, Health Econ., vol. 25, no. 2, pp. 3–5, 2016.
[17] C. Navarro, L. Ayala, and J. M. Labeaga, “Housing deprivation and health status: evidence from Spain,” Empir. Econ., vol. 38, no. 3, pp. 555–582, 2009.
[18] Dale, Angela, Malcolm Williams, and Brian Dodgeon. Housing Deprivation and Social Change: A Report Based on the Analysis of Individual Level Census Data for 1971, 1981 and 1991, Drawn from the Longitudinal Study and the Samples of Anonymised Records. HM Stationery Office, 1996.
[19] Jiménez-Martín, Sergi, José M. Labeaga and Cristina Vilaplana-Prieto. “Interactions between Private Health and Long-term Care Insurance and the Effects of the Crisis: Evidence for Spain,” Health Econ., vol.25, no. 2, pp. 159-179, 2016.
[20] K. Jee and K. Gang-Hoon. “Potentiality of big data in the medical sector: focus on how to reshape the healthcare system.”Healthc. Inform. Res., vol. 19, no. 2, pp. 79-85, 2013.
[21] M. W. Stanton, “Expanding patient-centered care to empower patients and assist providers,” 2002. Available at: https://archive.ahrq.gov/research/findings/factsheets/patient-centered/ria-issue5/ria-issue5.html Accesed: Dec. 2016.
[22] N. V. Chawla and D. A. Davis, “Bringing big data to personalized healthcare: A patient-centered framework,” Journal of General Internal Medicine, vol. 28, no. SUPPL.3. 2013.
[23] A. K. Roy. “Impact of Big Data Analytics on Healthcare and Society.” J. of Biom. Biostat., April, 2016.
[24] J. Archenaa and E. A. Mary Anita, “A survey of big data analytics in healthcare and government,” Procedia Comput. Sci., vol. 50, no. 1, pp. 408–413, 2015.
[25] G. D. Magoulas and A. Prentza, Machine Learning in Medical Applications, Machine Learning and Its Applications, Springer, vol. 2049, pp. 300–307, 2001.
[26] B. Ramsundar, S. Kearnes, P. Riley, D. Webster, D. Konerding, and V. Pande, “Massively Multitask Networks for Drug Discovery,” arXiv, no. Icml, 2015.
[27] J.E. Bibault, P. Giraud, and A. Burgun. “Big Data and machine learning in radiation oncology: State of the art and future prospects.” Cancer lett., 2016.
[28] I. El Naqa, “Perspectives on making big data analytics work for oncology,” Methods, vol. 111, pp. 32–44, 2016.
[29] Jones, Andrew M., et al. Applied health economics. Routledge, 2nd Ed. 2013.
[30] P. Contoyannis and A. M. Jones, “Socio-economic status, health and lifestyle,” J. Health Econ., vol. 23, no. 5, pp. 965–995, 2004.
[31] S. Balia and A. M. Jones, “Mortality, lifestyle and socio-economic status,” J. Health Econ., vol. 27, no. 1, pp. 1–26, 2008.
[32] A. Muñoz et al. “Proof-of-concept design and development of an EN13606-based electronic health care record service.” J. Am. Med. Inform. Assoc., vol. 14, no. 1, pp. 118-129, 2007.
[33] Commission of the European Communities-COM. “e-Health - making healthcare better for European citizens: an action plan for a European e-Health Area”, 2004. Available at: http://eur-lex.europa.eu/legal-content/EN/TXT/PDF/?uri=CELEX:52004DC0356&from=EN. Accessed Dec 2016.
[34] J. Walker, E. Pan, D. Johnston, J. Adler-Milstein, D. W. Bates, and B. Middleton, “The value of health care information exchange and interoperability,” Health Aff., vol. Suppl Web, pp. W5-10-W5-18, 2005.
[35] Somolinos, Roberto, et al. “Service for the pseudonymization of electronic healthcare records based on ISO/EN 13606 for the secondary use of information.” IEEE J. Biomed. Health. Informs., vol. 19, no. 6, pp. 1937-1944, 2015.
[36] Fienberg, Stephen E. “Sharing statistical data in the biomedical and health sciences: Ethical, institutional, legal, and professional dimensions.” Annu. Rev. Public Health, vol. 15, no.1, pp. 1-18, 1994.
[37] W. Lowrance, “Learning from experience: privacy and the secondary use of data in health research,” J. Health Serv. Res. Policy, vol. 8, no. suppl 1, pp. 2–7, 2003.
[38] R.J. Krawiec, D. Housman, M. White et al. “Blockchain: Opportunities for health care”. Deloitte. August 2016. Available at: https://www2.deloitte.com/content/dam/Deloitte/us/Documents/public-sector/us-blockchain-opportunities-for-health-care.pdf Accessed: Dic 2016.
[39] F. P. Machado, “SOR: scalable orthogonal regression for non-redundant feature selection and its healthcare applications.” Proceedings of the 2012 SIAM International Conference on Data Mining, 2012.
[40] V. Dhar, “Data Science and Prediction,” Commun. ACM, vol. 56, no. 12, pp. 64–73, 2012.
[41] C. O’Neil and R. Schutt, Doing Data Science: Straight Talk from the Frontline, vol. 1. 2015.
Diego J. Bodas-Sagi is an Associate BBVA Data & Analytics. He holds a PhD from the Complutense University of Madrid in Computer Science. His research interests include Big Data, Data Science, Computational Economics, modelling and e-Health. Contact address is: Universidad Nacional de Educación a Distancia. Departamento de Análisis Económico II. C/ Senda del Rey, 11 28040, Madrid (Spain); e-mail: [email protected]
In Press Special Issue on Big Data and e-Health
DOI: 10.9781/ijimai.2017.03.008
Abstract — Over the last years, the need for changing the current
model of European public health systems has been repeatedly
addressed, in order to ensure their sustainability. Following this
line, IT has always been referred to as one of the key instruments
for enhancing the information management processes of healthcare
organizations, thus contributing to the improvement and evolution
of health systems. On the IT field, Big Data solutions are expected
to play a main role, since they are designed for handling huge
amounts of information in a fast and efficient way, allowing users
to make important decisions quickly. This article reviews the main
features of the European public health system model and the
corresponding healthcare and management-related information
systems, the challenges that these health systems are currently
facing, and the possible contributions of Big Data solutions to this
field. To that end, the authors share their professional experience
on the Spanish public health system, and review the existing
literature related to this topic.
Keywords — Big Data, Health System, Healthcare Organizations,
Health Information Systems, Epidemiological Surveillance,
Strategic Planning.
I. IntRoductIon
A. The health systemAccording to the World Health Organization (WHO), “a health
system consists of all organizations, people and actions whose primary intent is to promote, restore or maintain health. This includes efforts to influence determinants of health as well as more direct health-improving activities. A health system is therefore more than the pyramid of publicly owned facilities that deliver personal health services” [1]. Furthermore, every health system performs the following set of basic functions [2]:• Delivering health services to individuals and to populations.• Creation of resources.• Stewardship.• Financing the system.
The center of any health system must be the first of these functions, since healthcare constitutes the paramount goal and therefore the reason for the existence of the health system itself. Around it, other functions are organized, essential for ensuring healthcare delivery and public health. Among these, the following ones must be remarked:• Epidemiological surveillance, which comprises the collection and
analysis of large volumes of data directly or indirectly related to people’s health, so as to detect or prevent possible health problems regarding public health.
• Planning and overseeing the management of the health system,
which allows healthcare organizations to set out their strategic goals, allocate the necessary resources, assess the degree of compliance of these goals and apply corrective measures if required.
• Clinical research, focused on generating knowledge and applying it to the development of new diagnostic and therapeutic techniques.
• Education and teaching, in order to train new professionals and keep the practicing ones appropriately updated and competent.
B. The health cluster or ecosystemFrom a structural point of view, a health system is neither an isolated
nor homogeneous entity, but it comprehends o relates to entities of diverse nature, both public and private, with interests of their own as well as shared interests. This ensemble is known as health cluster or ecosystem, and among its components the following ones must be pointed out:• Central or federal government and regional or local authorities.• Healthcare services, conceived as organizations responsible for the
management of a determined healthcare network.• Hospitals.• Primary care centers.• Emergency services.• Pharmacies.• Convalescent centers.• Health professionals acting as external providers to the health
system.• Public health services.• Insurance companies, mutual societies and other entities which
finance healthcare.• Schools for the education and training of doctors, nurses and other
health professionals.• Research centers.• Professional associations and colleges.• Foundations and learned societies.• Stakeholders, such as patients’ associations.• Pharmaceutical and other health technologies industries.
C. Challenges faced by the health systemFor decades, the public health systems of European countries,
created following the end of World War II, have been frequently mentioned as a reference model to be followed, especially in those aspects regarding coverage, quality of service and contribution to the welfare of society. However, the scene in which these systems arose has suffered a series of major changes, being the most important the following ones [4]:
Big Data and Public Health Systems: Issues and Opportunities
David Rojas de la Escalera1, Javier Carnicero Giménez de Azcárate2
1Business Development Senior Consultant – eHealth Division, Sistemas Avanzados de Tecnología (SATEC), Spain 2Health Service of Navarre, Spain
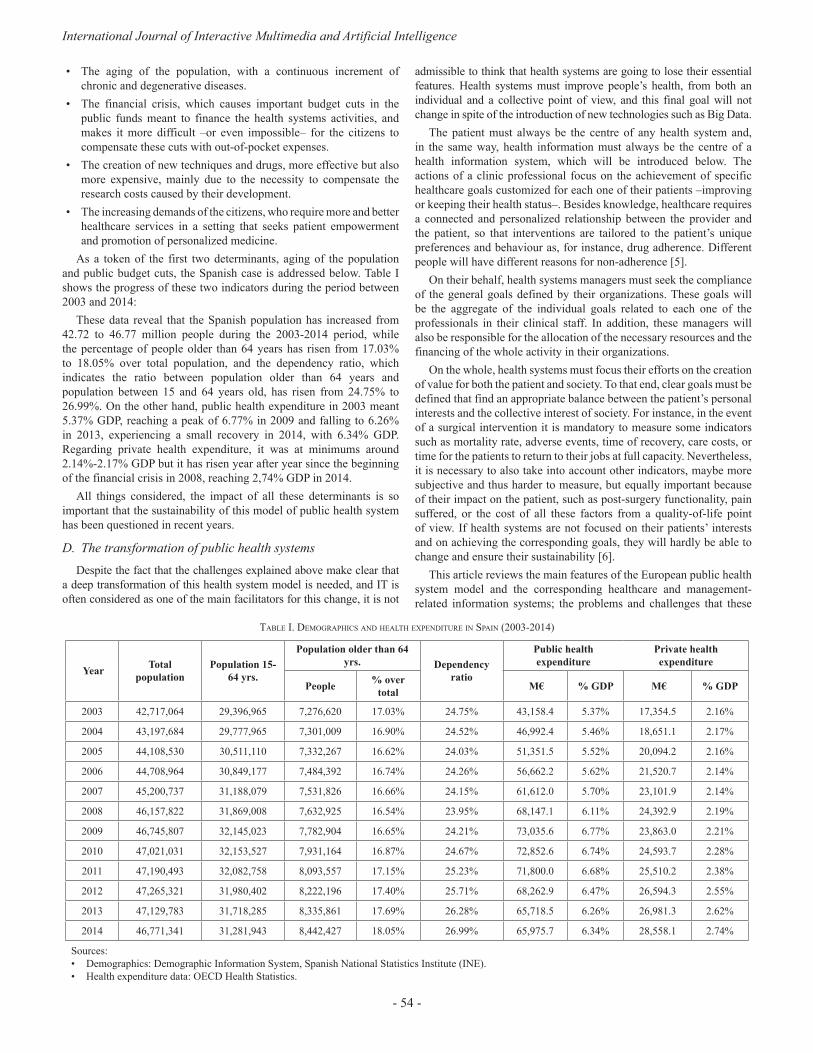
International Journal of Interactive Multimedia and Artificial Intelligence
- 54 -
• The aging of the population, with a continuous increment of chronic and degenerative diseases.
• The financial crisis, which causes important budget cuts in the public funds meant to finance the health systems activities, and makes it more difficult –or even impossible– for the citizens to compensate these cuts with out-of-pocket expenses.
• The creation of new techniques and drugs, more effective but also more expensive, mainly due to the necessity to compensate the research costs caused by their development.
• The increasing demands of the citizens, who require more and better healthcare services in a setting that seeks patient empowerment and promotion of personalized medicine.
As a token of the first two determinants, aging of the population and public budget cuts, the Spanish case is addressed below. Table I shows the progress of these two indicators during the period between 2003 and 2014:
These data reveal that the Spanish population has increased from 42.72 to 46.77 million people during the 2003-2014 period, while the percentage of people older than 64 years has risen from 17.03% to 18.05% over total population, and the dependency ratio, which indicates the ratio between population older than 64 years and population between 15 and 64 years old, has risen from 24.75% to 26.99%. On the other hand, public health expenditure in 2003 meant 5.37% GDP, reaching a peak of 6.77% in 2009 and falling to 6.26% in 2013, experiencing a small recovery in 2014, with 6.34% GDP. Regarding private health expenditure, it was at minimums around 2.14%-2.17% GDP but it has risen year after year since the beginning of the financial crisis in 2008, reaching 2,74% GDP in 2014.
All things considered, the impact of all these determinants is so important that the sustainability of this model of public health system has been questioned in recent years.
D. The transformation of public health systemsDespite the fact that the challenges explained above make clear that
a deep transformation of this health system model is needed, and IT is often considered as one of the main facilitators for this change, it is not
admissible to think that health systems are going to lose their essential features. Health systems must improve people’s health, from both an individual and a collective point of view, and this final goal will not change in spite of the introduction of new technologies such as Big Data.
The patient must always be the centre of any health system and, in the same way, health information must always be the centre of a health information system, which will be introduced below. The actions of a clinic professional focus on the achievement of specific healthcare goals customized for each one of their patients –improving or keeping their health status–. Besides knowledge, healthcare requires a connected and personalized relationship between the provider and the patient, so that interventions are tailored to the patient’s unique preferences and behaviour as, for instance, drug adherence. Different people will have different reasons for non-adherence [5].
On their behalf, health systems managers must seek the compliance of the general goals defined by their organizations. These goals will be the aggregate of the individual goals related to each one of the professionals in their clinical staff. In addition, these managers will also be responsible for the allocation of the necessary resources and the financing of the whole activity in their organizations.
On the whole, health systems must focus their efforts on the creation of value for both the patient and society. To that end, clear goals must be defined that find an appropriate balance between the patient’s personal interests and the collective interest of society. For instance, in the event of a surgical intervention it is mandatory to measure some indicators such as mortality rate, adverse events, time of recovery, care costs, or time for the patients to return to their jobs at full capacity. Nevertheless, it is necessary to also take into account other indicators, maybe more subjective and thus harder to measure, but equally important because of their impact on the patient, such as post-surgery functionality, pain suffered, or the cost of all these factors from a quality-of-life point of view. If health systems are not focused on their patients’ interests and on achieving the corresponding goals, they will hardly be able to change and ensure their sustainability [6].
This article reviews the main features of the European public health system model and the corresponding healthcare and management-related information systems; the problems and challenges that these
table I. deMogRaphIcs and health expendItuRe In spaIn (2003-2014)
YearTotal
population
Population 15-
64 yrs.
Population older than 64
yrs. Dependency
ratio
Public health
expenditure
Private health
expenditure
People% over
total M€ % GDP M€ % GDP
2003 42,717,064 29,396,965 7,276,620 17.03% 24.75% 43,158.4 5.37% 17,354.5 2.16%
2004 43,197,684 29,777,965 7,301,009 16.90% 24.52% 46,992.4 5.46% 18,651.1 2.17%
2005 44,108,530 30,511,110 7,332,267 16.62% 24.03% 51,351.5 5.52% 20,094.2 2.16%
2006 44,708,964 30,849,177 7,484,392 16.74% 24.26% 56,662.2 5.62% 21,520.7 2.14%
2007 45,200,737 31,188,079 7,531,826 16.66% 24.15% 61,612.0 5.70% 23,101.9 2.14%
2008 46,157,822 31,869,008 7,632,925 16.54% 23.95% 68,147.1 6.11% 24,392.9 2.19%
2009 46,745,807 32,145,023 7,782,904 16.65% 24.21% 73,035.6 6.77% 23,863.0 2.21%
2010 47,021,031 32,153,527 7,931,164 16.87% 24.67% 72,852.6 6.74% 24,593.7 2.28%
2011 47,190,493 32,082,758 8,093,557 17.15% 25.23% 71,800.0 6.68% 25,510.2 2.38%
2012 47,265,321 31,980,402 8,222,196 17.40% 25.71% 68,262.9 6.47% 26,594.3 2.55%
2013 47,129,783 31,718,285 8,335,861 17.69% 26.28% 65,718.5 6.26% 26,981.3 2.62%
2014 46,771,341 31,281,943 8,442,427 18.05% 26.99% 65,975.7 6.34% 28,558.1 2.74%
Sources:• Demographics: Demographic Information System, Spanish National Statistics Institute (INE).• Health expenditure data: OECD Health Statistics.
In Press Special Issue on Big Data and e-Health
- 55 -
health systems are currently facing; and the solutions that Big Data tools may potentially offer in that respect. To that end, the authors have based this work on their professional experience on the Spanish public health system, an analysis of the scene that the latter is facing in the upcoming years and decades, and a review of the existing literature on Big Data applied to health.
II. bIg data solutIons In a healthcaRe envIRonMent
A. The health information systemThe individual performance of the different components of the
health cluster, as well as their interactions, causes the creation of multiple data flows, which are also greatly varied, since they involve several business processes. This set of data flows gives the health information system as a result.
As mentioned above, just as healthcare is the centre of any health system, patient-related healthcare information must be the centre of the health information system as well, since it may and will also be used for activities other than healthcare, such as epidemiological surveillance, planning, overseeing of the management, clinical research, and education and training, as stated in the “Introduction” section. The fact that these data are stored in healthcare information systems is a consequence of them being generated during the patient’s care, but their usefulness goes clearly beyond this limit.
Therefore, the health information system must allow users to register, process, consult and share large amounts of data, ensuring their availability at the appropriate moment and point of the health cluster. On the healthcare side, this cluster reveals itself as a huge generator and at the same time consumer of enormous sets of information, related to personalized healthcare processes that take place on a daily basis and in a massive way. Healthcare is considerably intense regarding data treatment, by constantly creating immense datasets and frequently requiring access to knowledge sources.
For IT to be fully integrated in the health system value chain, it is mandatory to have a health information system which serves as an instrument for knowledge management being useful to all its users. Healthcare professionals cannot perform their duties properly without registering and using patients’ information, or without accessing the knowledge sources that allow them to make decisions on a solid basis. Public health departments need to know the population health status in order to detect or prevent potential collective health issues, as well as defining the necessary corrective and preventive measures. To those ends, these professionals must rely on data generated during every patient’s individual healthcare, properly aggregated, as well as other data sources.
Managers are not able to plan a strategy, oversee its performance and assess the achieved outcomes without a tool that allows them to process all the necessary information and provides them with accurate data, timely and in due form. These data are required from the very beginning, since the definition of an appropriate strategy must be based on the knowledge of the population’s health status, complemented with projections of its potential progress.
This complexity has been increased in recent years by a major change in healthcare organizations, which have evolved from a clearly paternalist way of interaction with their patients to another one completely different, focused on seeking their empowerment. In addition, patients are not content anymore with the information provided to them by their doctors, but search the Internet for additional data about their diseases, engage on social networks, make their own decisions, and register information on their health records. This new role is indeed required if, for instance, health authorities seek to promote one of the most important lines of action in the field of
chronic patient management, self-care encouragement, which has a beneficial impact on both the patient and the health system. However, this requires also a more varied interaction between them, combining traditional simple events, like setting up appointments with a general practitioner, with more complex actions, like monitoring health data measure and stored by wearable devices.
Despite this, it is clearly positive that both society and the medical community have evolved from a discussion about giving patients clearance to access their own healthcare information, to a totally different one about seeking the best way for the patients to register data in their health records, either in an active and conscious way or in an passive and automated one via specific devices. In any case, it must be always taken into account that the management of healthcare information is not a process unrelated to healthcare, but an inseparable component of healthcare itself, hence its management and supervision are the healthcare professionals’ responsibility, even though the patients take a more active role. Furthermore, every professional must accept this new reality and provide the patient with the necessary training, so that this initiative ends up being successful [7].
Apart from this, the temptation of exploiting the information stored on the different social networks turns out to be very powerful. It is true that, to the health system, it is a possibility worth exploring, but several conditioning factors must also be considered. The first one is data protection as a consequence of people’s right to privacy, something that, from the very first moment, seems to collide clearly with the business model of social networks themselves, designed to share large amounts of information in a quickly, heterogeneous and, up to some point, uncontrolled way.
Precisely these features represent another important conditioning factor, since social networks are nothing but huge repositories that store unstructured, poorly classified or simply uncategorized data, not to mention the more than likely irrelevance of most of them regarding healthcare and, moreover, their doubtful veracity, a feature essential to this field. Anyway, given their market penetration, with millions of users around the world, it seems advisable to assess the possibility of using social networks as an information source for health systems, as long as a model can be defined that solves or at least mitigates all the inconveniences mentioned above.
B. Potential contributions of Big Data to health systemsThe field of Big Data analytics is rapidly expanding, up to the point
that it has begun to play a main role in the evolution of healthcare practices and research, by providing tools to register, manage, and analyse huge amounts of both structured and unstructured data produced by current healthcare information systems [8].
Health-related Big Data streams can be classified into three categories [5]:• Traditional healthcare data are generated within the health system
and stored in datasets such as health records, medical imaging tests, lab reports or pathology results, among others. Analysing this information allows to achieve a better understanding of disease outcomes and their risk factors, and also to reduce health system costs, thus making them more efficient.
• “Omics’’ data deal with large-scale datasets in the biological and molecular fields, such as genomics, microbiomics or proteomics, for instance. The study of this information leads to deeper knowledge about how diseases behave, in order to accelerate the individualization of medical treatments.
• Data from social media allow to figure out how individuals or groups use the Internet, social media, apps, sensor devices, wearable devices or any other tools, to better inform and enhance their health.
International Journal of Interactive Multimedia and Artificial Intelligence
- 56 -
In addition, the inclusion of geographical and environmental information may further increase the ability to interpret gathered data and extract new knowledge [11][12].
Combinations of several types of data must also be taken into account. The concept of personalized medicine, partially introduced above, seeks to combine the patient’s health record and genomic data in order to support the clinical decision-making process, making it predictive, personalized, preventive and participatory, an idea known as “P4 Medicine” [9].
At the micro level, personalized medicine aims to customize the diagnosis of a disease and the subsequent therapy by taking into account the individual patient’s characteristics, instead of relying on decisions taken according to general guidelines, defined as a result of population-based studies and clinical trials. This will require the integration of clinical information, mainly patient records, and biological data such as genome or protein sequences. These data are generated from different and heterogeneous sources, and have very diverse formats [9].
In fact, healthcare data no longer needs to be restricted to traditional datasets such as electronic health records. For instance, mobile or wearable devices monitoring physiological signals can provide timely access to multiple data points that are increasingly interconnected. Traditionally, the data generated by this sort of devices have not been stored for more than a brief period of time, being discarded afterwards and therefore preventing any extensive investigation to benefit from the exploitation of these data. However, attempts to use this kind of datasets have been increasing lately, in order to improve patient care and management [8][10].
Nevertheless, there is a difference between collecting data, having access to data, and knowing how it should be used to improve healthcare. Now that the technology for handling massive amounts of data is available, the next step is developing tools for information sharing and knowledge management, which are seriously limited by the lack of system interoperability [9][10].
For instance, with full interoperability the ability to collect data in a timely manner from several different sources leads to an increase in registries. Disease registries are still in an early stage, but they might be valuable tools when it comes to supporting patient-centred self-management of chronic illness and defining customized treatment plans. Besides, the integration of computer analysis with appropriate care will help doctors to improve diagnostic accuracy. In a similar way, the integration of medical images with other types of electronic health record data and genomic data can also improve the accuracy of a diagnosis and reduce the time required for it [8][10].
A major emphasis of personalized medicine is to match the right drug with the right dosage to the right patient at the right time. Moreover, gene sequencing and the use of the subsequent genetic data in diagnosis and treatment will be essential to the future of personalized medicine, with actions such as the prescription of drugs based on genomic profiles of individual patients, known as pharmacogenomics. However, analytics of high-throughput sequencing techniques in genomics is a problem inherent to Big Data itself, since the human genome consists of 30,000-35,000 genes. Some ongoing projects aim to integrate clinical data from the genomic level to the physiological level of a human being. These initiatives will surely help when it comes to deliver personalized healthcare [8][9][10].
At the macro level, faster access to data allows any hospital to define and apply quality improvement policies based on the constant monitoring of outcomes, so as to ensure that the strategic goals of the organization are achieved. Hospitals have also used electronic health records, datasets originally intended to document individual healthcare processes, to identify system-related inefficiencies and quality issues. Faster access to data has also been hugely useful for the identification
and management of disease outbreaks, allowing public health initiatives to be targeted to specific areas, as a result of population analysis [10].
The mining of electronic health record data made possible for researchers to identify possible sources of adverse events. Healthcare professionals used this information to improve organizational practices and reduce error rates. Moreover, many clinical information systems such as electronic health records and computerized physician-order entry systems capture a large amount of metadata about their use, which can be used for auditing purposes, thus allowing the organization to detect user-device interaction problems, shrinking safety margins and other technology-related safety issues and concerns, before any adverse event takes place [10].
The potential impact of Big Data is not easy to estimate, let alone on such an early stage. A report sponsored by the McKinsey Global Institute states that the proper use of Big Data within the United States healthcare sector might allow improvements with an estimated value of more than $300 billion every year, two-thirds of which would be achieved by reducing the healthcare expenditure of the whole country [13].
However, healthcare IT history has made clear that technology-based panaceas do not exist. The potential of IT for transforming health systems seems to be widely accepted, as a consequence of its contribution to the improvement of healthcare processes, but IT has also caused new issues and risks, such as user-computer interaction problems or technology-induced errors. As a consequence, it seems clear that much IT outcomes-based research is still needed, in order not only to prove its value, but also to quantify it [10][14].
C. Requirements for the use of Big Data within the health information system
While the ability to manage massive amounts of data provides a huge opportunity to develop methods and applications for advanced analysis, the real value of Big Data will only be achieved if the information extracted from these data is useful to improve clinical decision-making processes and patient outcomes, as well as lower healthcare costs [9]. To that end, several basic requirements must be met, though they are very similar to the requirements of the health information system itself.
First of all, it is essential to ensure the quality of the information. This involves the development of thorough protocols which define the criteria required for data input, validation, harmonization if necessary, registry, processing and transmission to other components of the information system. In fact, several of the main requirements of data mining are the technical correctness of data, the accuracy and statistical performance, and the update or reassessment of the analysis [15].
In the health field, the information managed is so complex and heterogeneous that it is necessary to employ data carefully structured and, as long as it is possible, categorized. This is useful for data identification and error control purposes. Furthermore, healthcare information is a perfect example of three major features, commonly known as the three Vs, widely accepted as defining characteristics of Big Data: volume, variety, and velocity. In addition to these a fourth V, the veracity of healthcare data, is obviously critical for its meaningful use [8].
All possible information sources and data flows within the health information system must be perfectly identified as well. Since the information system must store all data required for the performance of the different corporate functions of the health system, it is clear that all of its components must be interoperable, as stated above, so that any data can be accessed from any point of the health system that needs them. Hence another cardinal requirement is the interoperability of systems, subsystems and components, defined as their capability of exchanging information without altering the meaning of the exchanged data, regardless of their source and their use within each system.
In Press Special Issue on Big Data and e-Health
- 57 -
For instance, a medical consultation generates information used for the patient’s healthcare, the management of the employed resources and the billing of the service, but it can also be used in the medium and long-term for outcome assessment, strategic planning, research, education, epidemiological surveillance, or even as evidence in legal proceedings. Moreover, the aggregate of every data generated during that consultation and the ones generated during millions of similar healthcare events will be useful to create knowledge, on which clinical decision-making support systems will be based.
Therefore the cycle comprehends the transition from data to information, from information to knowledge, and from knowledge to practice. All of this needs the interoperability of clinical information systems, logistic and economic-financial systems, business intelligence systems, and universities and R&D centres systems, among others. As a consequence, every system must be capable of filtering the information received in order to extract the data it needs, so as to not compromise their processing, thus avoiding the risk of producing adulterated results.
Finally, from a technological point of view, it is mandatory to have a high-performance IT infrastructure on which to rely for the generation, storing, processing and exchange of large data volumes, in a quick and efficient way. Luckily, hardware, software and communications solutions have experienced a huge progress in recent years, so technological viability is hardly an obstacle nowadays.
D. Some additional issues and barriersThe implementation of Big Data solutions and tools in the health
field requires addressing not only the organizational and technological issues detailed above, but also several legal and ethical questions.
From a legal point of view, the first cause of conflict may be data propriety. As explained in previous sections, every data properly processed and analysed can be turned into knowledge, and the latter can be easily made profitable. The first companies working this angle are tech giants such as Google, which provides personalized advertisements based on navigation and search history, and Facebook, which admitted to focus part of its efforts on sociological research based on its users’ data, and has even tried to take possession of these information in a completely unilateral way [7].
Given that the generation, registry and processing of all this information requires a powerful hardware and software infrastructure as a base, and therefore a large investment by these companies, their intention to make it profitable may be considered legitimate to a certain point, especially if they are not charging users for the service provided. However, limitations regarding the use of the stored data must be clearly established, something that seems to be far from being solved with the current legal framework, which is quite confusing. For instance, in the case of Spain, this framework combines European Union, national, regional and sectorial (both health and e-government) regulations [7]. Moreover, most of this legislation is outdated to a large extent, since it was passed in a time when IT progress was far from the current one [16].
Once at this point, a revision of these regulations, taking into account the current potential of Big Data solutions, as well as the foreseeable one on the short and mid-term, seems to be more than appropriate. Of course, this revision must be addressed with the goal of balancing the individual interests of patients (right to privacy) and professionals (legal certainty in the performance of their healthcare and management duties), as well as the general interests of society (research, education or improvement of healthcare services, among others). To that end, protocols must be defined that combine both a priori measures, such as data anonymization, and a posteriori measures, such as thorough audits regarding the access and use of data. Having the human factor in mind, one of the most crucial a priori measures will always be raising the
awareness of patients, professionals and organizations.From an ethical point of view, quite a few similarities to the legal
field can be observed. The fact that IT is going to play an increasingly important role in health systems seems to be widely accepted, since its potential as a key instrument for the transformation of the current model is appreciated. Nevertheless, there is also a great concern about the lack of transparency in the management of the large amounts of data guarded by healthcare organizations. For this reason, the promotion of more and better control measures is backed by bioethics experts, starting with the development of a specific legal framework that can be turned into clear and visible actions, thus transmitting a sense of security and contributing to promote the trust in healthcare data mining [15].
III. bIg data In seRgas: a case study
Within the Spanish National Health System, healthcare is accountable to the Autonomous Communities, which represent the regional level of the government and each has a health service. In the case of the community of Galicia, this would be the Galician Health Service (Servizo Galego de Saúde, SERGAS).
SERGAS relies on a Business Intelligence solution for the exploitation of structured datasets, these being provided by a regional database in which information supplied by the different hospitals and primary care centers of this health service is aggregated. In addition, a management system for information related to human resources and pharmaceutical expenditure provides structured data as well.
In order to complement this BI system, SERGAS has implemented Big Data technologies so as to exploit unstructured data stored in the patients’ electronic health records. This innovation makes SERGAS the first Spanish health service to use Big Data in a systematic way. On a total budget of 982.278 euros, several projects have been developed regarding the following lines of action:• Rare diseases management:
◦ Detection of suspicious cases. ◦ Creation of a Rare Diseases Registry.
• Chronic diseases management: ◦ Detection of Diabetes Mellitus type 2 patients, chronic
obstructive pulmonary disease patients and patients with pluripathology, yet uncategorized as such in their health records.
◦ Calculation of prevalence and incidence indicators, as well as risk factors.
• Clinical research: decision-making support regarding the selection of the most appropriate kind of vascular endoprostheses (stents).
• Nosocomial infections management: ◦ Research and categorization of detected cases. ◦ Automated alerts.
• Surveillance of several syndromes: ◦ Case identification. ◦ Detection of food toxi-infection and acute respiratory
symptoms outbreaks.• Exploitation of lab test results (currently in progress).
As a whole, these systems are handling information belonging to 2.900.000 patients, provided by 63 different data sources. Up to the year 2016, 59.000.000 normalized events have been compiled, 12.000.000 documents (of 50 different kinds) have been semantically processed, and 500.000 cases have been detected.
Regarding information security, SERGAS applies a set of corporate criteria, with standard measures such as the definition of user profiles
International Journal of Interactive Multimedia and Artificial Intelligence
- 58 -
and access authorization levels, the anonymization of aggregate data and the performance of audits to verify regulation compliance. Besides, there are several committees that define the guidelines for the management of ethics and governance, always within the current legal framework.
Iv. conclusIons
As it happens with IT in general, the successful implementation of Big Data solutions in a healthcare environment will depend on their capability to generate an added value that benefits patients, professionals and organizations. No one seems to doubt the need to improve public health systems by evolving their current model, or the potentially valuable contributions of Big Data in this respect, but the great complexity that characterises the implementation of this kind of tools seems to be proven too, according to the requirements and, in some cases, obstacles of different nature that must be dealt with.
Once technological viability is apparently achieved, it is time for healthcare organizations and authorities to face the challenge of studying the possibilities of Big Data and seeking the best way of applying it to the solution of their issues, problems and needs. In order to achieve this, they must not start wondering what information they have now and what they can achieve with it, but what information they need and how they can get it. The most frequent problem will not be the availability of the necessary data, but the screening of the relevant information and how to assess it. In summary, the most important thing is not having the data, since this is already happening, but being able to ask the right questions at the right moment, process them to provide only the necessary and relevant information, and show the latter to healthcare professionals in a way that they can assimilate it in a quick, correct and easy manner, in order to make the right decisions at the right time.
On the healthcare side, Big Data must become the foundation of clinical decision-making support systems, and also an instrument for data aggregation concerning public health departments, as well as research and education. On the management side, managers will be able to have a more accurate and timely knowledge of the real status of their organizations, and adopt a prospective planning instead of a retrospective one. In addition, they will be capable of detecting deviations from objectives earlier and applying the appropriate corrective and, preferably, preventive measures.
In conclusion, the implementation of Big Data must be one of the main instruments for the change of the current health system model, turning it into another one with improved effectiveness and efficiency, calculated taking into account both healthcare and economic outcomes of health services, thus being meaningful to patients and also to society, and taking advantage of the patients’ potential as active participants in their own care.
acknoWledgeMents
The authors wish to thank Ms. Pilar Carnicero and Mr. Guillermo Vázquez, for their contributions in elaborating and improving this article.
RefeRences
[1] World Health Organization (WHO). Everybody’s business: Strengthening health systems to improve health outcomes. WHO’s framework for action, 2007.
[2] World Health Organization (WHO). The Tallinn Charter: Health Systems for Health and Wealth. WHO European Ministerial Conference on Health Systems. Tallinn (Estonia), June 25th-27th, 2008.
[3] Rojas D., Carnicero J. A model of information system for healthcare: Global vision and integrated data flows. In: Berhardt L.V., editor. Advances in Medicine and Biology, Vol. 82. Nova Publishers, NY, Enero 2015.
[4] Carnicero J., Rojas D. La explotación de datos de salud: Retos, oportunidades y límites. In: Carnicero J., Rojas D. (editors). La explotación de datos de salud: Retos, oportunidades y límites. Sociedad Española de Informática de la Salud (SEIS), June 2016.
[5] Hansen M.M., Miron-Shatz T., Lau A.Y.S., Paton C. Big Data in Science and Healthcare: A Review of Recent Literature and Perspectives. Contribution of the IMIA Social Media Working Group. Yearb Med Inform 2014; 9(1): 21–6.
[6] Porter M.E., Lee T.H. The Strategy That Will Fix Health Care. Harvard Business Review. Oct 2013. 10:50–70.
[7] Martínez R., Rojas D. Gestión de la seguridad de la información en atención primaria y uso responsable de Internet y de las redes sociales. In: Carnicero J., Fernández A., Rojas D. (editors). X SEIS Report, “Manual de Salud Electrónica para directivos de servicios y sistemas de salud – Volumen II: Aplicaciones de las TIC a la atención primaria de salud”. Economic Commission for Latin American and the Caribbean (ECLAC) and Sociedad Española de Informática de la Salud (SEIS), August 2014.
[8] Belle A., Thiagarajan R., Soroushmehr S.M.R., Navidi F., Beard D.A., Najarian K. Big Data Analytics in Healthcare. Hindawi Publishing Corporation, 2015, 1–16.
[9] Panahiazar M., Taslimitehrani V., Jadhav A., Pathak J. Empowering Personalized Medicine with Big Data and Semantic Web Technology: Promises, Challenges, and Use Cases. Proc IEEE Int Conf Big Data. 2014 Oct; 2014:790-5.
[10] Kuziemsky C.E., Monkman H., Petersen C., Weber J., Borycki E.M., Adams S., Collins S. Big Data in Healthcare - Defining the Digital Persona through User Contexts from the Micro to the Macro. Contribution of the IMIA Organizational and Social Issues WG. Yearb Med Inform. 2014 Aug 15; 9:82-9.
[11] Luo J., Wu M., Gopukumar D., Zhao Y. Big Data Application in Biomedical Research and Health Care: A Literature Review. Biomed Inform Insights. 2016; 8: 1–10.
[12] Alper J. (rapporteur). Big Data and Analytics for Infectious Disease Research, Operations, and Policy: Proceedings of a Workshop. The National Academies Press, December 2016.
[13] Manyika J., Chui M., Brown B., Bughin J., Dobbs R., Roxburgh C., Byers A. Big Data: The next frontier for innovation, competition, and productivity. McKinsey Global Institute, June 2011.
[14] Rojas D., Carnicero J. La utilización de las TIC como un factor de riesgo para la seguridad de los pacientes. En: Carnicero J., Rojas D., Martínez R. (editors). XI SEIS Report, “Las TIC y la seguridad de los pacientes: Primum non nocere”. Sociedad Española de Informática de la Salud (SEIS), November 2016.
[15] León P. Bioética y explotación de grandes conjuntos de datos. In: Carnicero J., Rojas D. (editors). La explotación de datos de salud: Retos, oportunidades y límites. Sociedad Española de Informática de la Salud (SEIS), June 2016.
[16] Andérez A. Disposiciones legales aplicables. In: Carnicero J., Rojas D. (editors). La explotación de datos de salud: Retos, oportunidades y límites. Sociedad Española de Informática de la Salud (SEIS), June 2016.
David Rojas de la Escalera. Mr. Rojas has a degree in telecommunications engineering (with a specialization in telematics) from the Universidad de Cantabria. Currently, he is a Business Development Senior Consultant in the eHealth Division of the company SATEC. He has been an external advisor to the Spanish Ministry of Health, Social Policy and Equality for the eHealth Governance Initiative of the European Union. He is also a member of the Spanish
Society of Health Informatics, and acts as a referee for the editorial board of the journal Gestión y Evaluación de Costes Sanitarios (Management and Evaluation of Healthcare Costs) published by Fundación Signo.
Javier Carnicero Giménez de Azcárate, MD, PhD. Dr. Carnicero received a medical degree from the Universidad de Zaragoza and then went on to obtain a doctorate from the Universidad de Valladolid. Currently, he works in a management position for the Health Service of Navarre. He has been Director of the Spanish Healthcare System Observatory (Quality Agency - Spanish Ministry of Health, Social Policy and Equality). He is also on the executive
board of the Spanish Society of Health Informatics.

IJIMAIhttp://ijimai.unir.net