international journal of latest technology in engineering ... · impetus to use eco-friendly...
TRANSCRIPT

International Journal of Latest Technology in Engineering, Management & Applied Science (IJLTEMAS)
Volume VI, Issue IV, April 2017 | ISSN 2278-2540
www.ijltemas.in Page 13
Application of Response Surface Methodology for
Biosorption of Reactive Dyes from Textile Effluent
Using Dead Fungal Biomass of Rhizopus Arrhizus
NCIM 997 *Sukhada Saraf and Varsha K. Vaidya
The Institute of Science, 15, Madam Cama Road, Mumbai 400 032, Maharashtra, India.
*Corresponding Author: Sukhada Saraf
Abstract: - Response Surface Methodology was employed for
studying the biosorption of reactive dyes from textile effluent by
utilization of dead biomass of Rhizopus arrhizus in a batch
system. Central Composite Design at the specified combinations
of four variables (pH, biosorbent dosage, speed of agitation,
contact time) was adopted to achieve maximum biosorption. The
fitted quadratic model (P<0.0001) was used to arrive at the best
operating conditions. Under the following optimum conditions
i.e., pH 2.0; biosorbent dosage 3 g /L; speed of agitation 80 rpm
and contact time 60 min, 99.60% of the dyes were removed from
the wastewater. The mechanism of biosorption was elucidated by
FTIR, XRD and BET analysis. This work demonstrated the
feasibility of employing Rhizopus arrhizus as an effective and
economical fungal biosorbent for the removal of dyes from the
textile effluent.
Keywords: Biosorption, Textile effluent, Response surface
methodology, Rhizopus arrhizus,
I. INTRODUCTION
extile industry extensively uses reactive dyes, owing to
their technical attributes and easy availability of raw
materials [1].The effluent generated by reactive dyeing
processes contains hydrolyzed dyes amounting to 20-30% of
the dyes used; recalcitrant organics; surfactants, sizing,
coating and finishing agents, which are responsible for the
high COD and BOD of the effluents; textile fibres (60-100
g/L); electrolytes, essentially NaCl and Na2CO3, which
contribute to the high salinity of the wastewater [1-6]. Thus,
release of textile effluents in the ecosystem has raised a great
concern due to the aesthetic considerations as well as their
recalcitrant nature; potential toxicity, carcinogenicity and
mutagenicity to animals and humans [7-9]. Reactive dyes
because of their complex aromatic molecular structure tend to
pass through the conventional physical and chemical
processes while inhibiting the conventional biological
wastewater treatment processes [7, 10-14]. This has given an
impetus to use eco-friendly techniques such as adsorption
because of ease of design, effectiveness, simplicity of
operation, insensitivity to noxious materials and capacity to
treat the dyes in a more concentrated form [15]. One of the
most extensively used adsorbents is activated carbon because
of its very good adsorption capacity for organic pollutants.
However, its commercial application is limited due to high
expenses, difficulty in regeneration and problems with respect
to its ultimate disposal [16-18]. Hence, low-cost biosorbent
materials such as natural waste materials originated from
agriculture and industry (i.e. corncob, pinewood, rice husk,
bagasse, chitosan, etc.) as well as biosorbents produced from
microbial biomass have gained increase in attention due to
reduction the adsorbent dose and minimization of the disposal
problem [4,19-21]. Among the various types of biomasses, the
inactivated fungal biomass is particularly attractive due to its
constant and cheap supply from industrial fermentation
processes, selectivity, high removal rates, ease of storage and
regeneration. The effectiveness of the biosorption by some
fungi under equilibrium conditions has been shown to be
superior to the traditional ion-exchange resins and activated
carbon for reactive azo dyes [4,19, 22, 23].
The majority of wastewater treatment processes are
multi-variable and optimization of the process by statistical
approaches such as Response Surface Methodology (RSM),
offers advantages such as closer confirmation of the output
response to normal, lower process variability, reduced
development time and costs. RSM helps to optimize
operational variables, to build models, to scrutinize the
interactions between the variables while minimizing the
empiricism of trial-and-error techniques [24,25]. Recently,
several wastewater treatment processes including; textile,
tannery, palm oil mill and industrial paint effluents, landfill
leachate, etc. have been optimized via RSM [26,27]. The
current work focuses on the application of RSM in studying
the usability and effectiveness of the biosorbent made from
the dead biomass of Rhizopus arrhizus in optimization of
textile wastewater treatment and modeling the process
parameters. The kinetics data were used to identify the
T

International Journal of Latest Technology in Engineering, Management & Applied Science (IJLTEMAS)
Volume VI, Issue IV, April 2017 | ISSN 2278-2540
www.ijltemas.in Page 14
adsorption mechanism and the rate limiting step. Surface
characterization of the biomass was done using FTIR, XRD
and BET analyses.
II. MATERIALS AND METHODS
1. Materials
Rhizopus arrhizus NCIM 997 used as a biosorbent in
this study was obtained from National Chemical Laboratory,
Pune, India. Textile effluent was directly collected in airtight
plastic bottles from the outlet before it was subjected for
further treatment from DyStar Pvt. Ltd., Rabale, India. The
structure of the dyes in the effluent was not revealed for
commercial purposes. All the chemicals used in this study
were of analytical grade and procured from HiMedia, India.
2. Preparation of the biosorbent
Fungal biomass was acquired by aseptically
transferring mycelia from the potato dextrose agar (PDA)
spread-plate cultures to 100 mL of potato dextrose broth
(PDB) (g /L: potato infusion from 200 g potatoes, dextrose 20,
yeast extracts 0.1, pH 5.0) containing 0.25 % Tween 80 (to
prevent sporulation) in 250 mL Erlenmeyer flasks. The
biomass was harvested after seven days of incubation at
30±1oC under static conditions with sporadic shaking. Fungal
biomass was then washed thoroughly with double distilled
water and dried at 80oC for 24 h. The size of the biomass
particles was kept uniform by grinding into a fine powder and
sieving through a 150-mesh sieve. Dried biomass was then
preserved in a desiccator and was used without any physical
or chemical treatment for the biosorption experiments [28].
3. Characterization of the biosorbent
The Fourier transform infrared spectroscopy (FTIR)
analysis was used to identify different functional groups
present on the biosorbent before and after biosorption of the
dyes in the textile effluent. The analysis was carried out using
the KBr, with the spectral range varying from 4,000 cm−1
to
400 cm−1
. The infrared spectra were obtained and averaged
over 32 scans in the transmission mode. In order to assess the
presence of crystalline phases present in the biosorbent before
and after biosorption, X-ray diffraction patterns were obtained
with a diffractometer (Rigaku Miniflex X-ray diffractometer)
with the 2θ angle varying between 5oand 80
o.The BET
(Brunauer, Emmett and Teller) technique that measures the
quantity of gas molecules needed to saturate the solid surface
under equilibrium conditions was used to analyze the surface
area of the biomass. A known quantity of the sample (0.0001
g), after drying in an oven at 80oC for 24 h, was evacuated and
then saturated with liquid nitrogen. The quantity of the gas
required for saturation of the sample was taken as a measure
of surface area using the BET Surface Area Dual Component
Gas Analyzer Model SAA-2002.
4. Characterization of the textile effluent
The effluent used in this study was a multi-
component solution containing commercial reactive dyes
(used to dye cotton fabric at 60 0C for 90 min) viz. Remazol
G.Y. RGB, Remazol Navy RGB, Remazol Blue RGB,
Remazol Red RGB, Glauber salt (80g /L) and soda ash (20g
/L).The temperature was measured with laboratory
thermometer and pH was determined using pH meter (Hanna
digital pH meter, model-HI 9125) at the sampling site. The
sample was transported to laboratory and stored at 4±1°C
until use in accordance with the standard methods [29]. The
effluent was immediately subjected to physico-chemical
analysis following standard APHA methods (APHA, 2002)
after filtering to remove large suspended particles [30]. The
textile effluent was characterized for odor, color, chlorides,
total solids (TS), total dissolved solids (TDS), total suspended
solids (TSS), biological oxygen demand (BOD) and chemical
oxygen demand (COD) (Table 2). The effluent was diluted
1:10 for further experiments. The color of the sample was
checked from time to time before every experiment to
ascertain sample integrity.
5. Batch biosorption studies
The batch biosorption experiments were carried out
at the specified combinations of physical parameters to
evaluate the potential of the biosorbent made from the dead
biomass of R. arrhizus in removing color from the textile
effluent. 250 mL Erlenmeyer flasks containing 50 mLof 1:10
diluted effluent at desired pH and concentration of biosorbent
dosage were kept under agitation in a rotating orbital shaker
(Labtop Quality Lab Equipment, India) for desired period of
time for these experiments. The residual concentration of dyes
in the effluent was determined after centrifugation at 4000
rpm using modified ADMI (American Dye Manufacturers’
Institute) spectroscopic method [31,32]. The ADMI values are
a true measurement of water color due to the presence of
colored minerals and dyes, humic breakdown substances and
iron, independent of hue and thus give a more accurate
description of wastewater and colored mixture. The change in
hue of the effluent was determined by spectrophotometric
comparison of the sample with calibration curve prepared by
measuring the absorbance of known concentrations of the
APHA/Pt-Co liquid color standards at 450 nm using a UV–
Vis spectrophotometer (Shimadzu, Kyoto, Japan).
Simultaneously blank without biosorbent was run as a control.
The unit of color in platinum-cobalt method of measuring
color is that produced by 1 mg platinum /L in the form of the
chloroplatinate ion was calculated as:
(1)
Where, A = Estimated color of diluted sample; B = mL of
sample taken for dilution.

International Journal of Latest Technology in Engineering, Management & Applied Science (IJLTEMAS)
Volume VI, Issue IV, April 2017 | ISSN 2278-2540
www.ijltemas.in Page 15
The response expressed as percent decolorization was
calculated as:
(2)
Where, Absorbance (t0) and Absorbance (t) are the initial
absorbance value (at 0 h) and the absorbance value after a
particular reaction time (t), respectively.
6. Central Composite Design (CCD) and statistical analysis
The optimal levels of the significant variables and
their interactions on the biosorption process were investigated
using Central Composite Design (CCD) [33]. In order to make
the design rotatable, a value of α= (nF)1/4
=2 was taken. A four
factor, five level CCD consisting of 30 runs, with 6 center
points (4 cube points and 2 axial points) was conducted to
locate true optimum values of pH (X1), biosorbent dosage
(X2), speed of agitation (X3) and contact time (X4) (Table 1).
Randomized run order was used to minimize the effects of
variability in the observed responses due to extraneous
factors. To check for the adequacy of the model and to
estimate the experimental error, replicates were used.
According to this design, the total number of treatment
combinations were 2k + 2k + n0, where k is the number of
independent variables and n0 is the number of repetitions of
experiments at the center point [34]. A second-order
polynomial response equation (Eq.3) was proposed to
correlate the dependent and independent variables:
Y= β0+ Σβi xi + Σβii xi2 + Σβijxixj, i= 1, 2, 3. . .k, (3)
Where, Y is the predicted response, β0 is the intercept, xi and xj
are the coded independent factors, βi is the linear coefficient,
βii is the quadratic coefficient and βij is the interaction
coefficient.
Table 1.Experimental range and levels of independent process variables tested in Central Composite Design
Designation Variable -2 -1 0 1 2
X1 pH 1.0 1.5 2.0 2.5 3.0
X2 Biosorbent dosage (g /L) 2.0 3.0 4.0 5.0 6.0
X3 Speed of agitation (rpm) 70 75 80 85 90
X4 Contact time (min) 30 60 90 120 150
The quality of the polynomial equation was judged by
determination coefficient (R2) and its statistical significance
was checked by Fischer’s F-test. Analysis of variance
(ANOVA) was conducted to determine the significance of the
model. The response surface plots of the model-predicted
responses were utilized to assess the interactive relationships
between the significant variables. The results obtained from
the statistical analyses of CCD were verified by validation
tests, using the predicted optimized conditions against the
basal conditions. Minitab 16 (State College, PA, USA) and
Design Expert Version 6.0.8 (Stat-Ease Inc., Minneapolis,
USA) software were used for experimental design,
construction of quadratic models and graphical analysis of the
experimental data. Response surface plots of the model-
predicted responses were utilized to assess the interactive
relationships between the variables [35].
III. RESULTS AND DISCUSSION
1. Characterization of the textile effluent
The initial characterization of the dark bluish purple
colored effluent collected from DyStar India Ltd., Mumbai is
shown in Table 2. The effluent had objectionable odor
probably due to the presence of volatile compounds, which is
aesthetically unacceptable. The temperature of the raw textile
dyeing effluent was 40oC, indicating potential to pose harm to
the aquatic life [36,37]. One of the important factors serving
as an index for pollution and a determinant for effluent
treatment is pH. A pH of 11.23 associated with the effluent
was above the tolerance limits of (5.5-9.0) prescribed by the
Bureau of Indian Standards (BIS) (1981) for the discharge of
industrial effluents. The waste water used in this study was
highly turbid and showed high concentration of total dissolved
solids (TDS) (10350 mg /L) which exceeded the BIS limit of
2000 mg /L. Total suspended solids (TSS) denote the
suspended pollutants present in the waste water which are
contributed by fiber scrap and undissolved raw materials in
the production process [38].Chloride content of the effluent
was extremely high (891 mg /L) which is an index of the
surface pollution level. Based on BOD (1100 mg /L) and
COD (4520 mg /L) values, the effluent could be classified as
high strength effluent indicating the risk posed to the aquatic
ecosystem. BOD/ COD ratio, also called the
"Biodegradability index" (B.I.) has been commonly used as an
indicator for biodegradation capacity and is the cut-off point
between biodegradable and non-biodegradable waste
[33,39,40]. A BOD/ COD ratio of > 0.6 indicates fair
biodegradability of the waste, while BOD/COD <0.3, inhibits
biodegradation and the effluent cannot be treated biologically,
because the wastewater inhibits the metabolic activity of

International Journal of Latest Technology in Engineering, Management & Applied Science (IJLTEMAS)
Volume VI, Issue IV, April 2017 | ISSN 2278-2540
www.ijltemas.in Page 16
bacterial seed due to their refractory properties [41,42].
BOD/COD of 0.24 in the present study indicated that the
effluent was not amenable to biological treatment and
required more potent method for its management.
Table 2. Physico-chemical characteristics of textile effluent before and after biosorption by R. arrizus
Sr. No. Test parameter Textile effluent BIS tolerance limits
(1981) Before biosorption After biosorption
1 Color(ADMI units) Dark bluish purple colored (65320) Colorless with a tinge of pale yellow (454.4)
≤150
2 Turbidity Highly turbid Slightly Turbid NA
3 pH 11.23 2.44 5.5-9.0
4 Odor Foul Unobjectionable Unobjectionable
5 Chlorides (mg /L) 891 95 500
6 Total dissolved solids (mg /L) 10350 1620 2000
7 Total suspended solids (mg /L) 150 60 100
8 Total solids (mg /L) 10500 1680 2100
9 Chemical oxygen demand (mg /L) 4520 463 250
10 Biochemical oxygen demand (mg /L) 1100 150 350
Ref: Bureau of Indian Standards IS 2490 (1981).
2. Optimization of significant variables using Central
Composite Design (CCD)
CCD was employed with the particular combinations
of four independent variables (pH, biosorbent dosage, speed
of agitation and contact time) at five levels (- 2, -1, 0, +1, +2).
The design matrix of 30 experimental runs along with the
experimental results and the results of theoretically predicted
responses (using the model equation) are shown in Table 3.
Table 3. Input variables and experimental design matrix for percent decolorization of textile effluent by R. arrhizus
Sr. No. Variables % Sorption
pH Biosorbent
Dosage
Speed of
Agitation
Contact Time Actual Predicted
1 1 -1 -1 1 98.46 98.23
2 1 -1 1 -1 99.60 99.74
3 -1 1 -1 1 93.29 93.63
4 -1 1 1 1 92.05 92.13
5 1 1 -1 1 98.14 98.03
6 -1 -1 1 -1 98.29 98.20
7 1 -1 1 1 98.94 98.88
8 -1 -1 -1 -1 98.44 98.56
9 1 1 1 -1 98.76 98.41
10 -1 1 1 -1 95.12 95.42
11 1 -1 -1 -1 96.28 96.23

International Journal of Latest Technology in Engineering, Management & Applied Science (IJLTEMAS)
Volume VI, Issue IV, April 2017 | ISSN 2278-2540
www.ijltemas.in Page 17
12 1 1 1 1 97.19 97.13
13 -1 1 -1 -1 95.70 95.79
14 -1 -1 -1 1 98.18 98.56
15 -1 -1 1 1 98.58 98.61
16 1 1 -1 -1 98.14 98.18
17 0 0 0 -2 99.30 99.34
18 0 0 0 2 98.20 98.06
19 -2 0 0 0 97.38 96.68
20 2 0 0 0 98.76 99.35
21 0 2 0 0 94.78 94.66
22 0 0 -2 0 98.53 98.28
23 0 -2 0 0 99.18 99.19
24 0 0 2 0 98.42 98.56
25 0 0 0 0 98.40 98.38
26 0 0 0 0 98.58 98.38
27 0 0 0 0 98.58 98.38
28 0 0 0 0 98.38 98.38
29 0 0 0 0 98.96 99.17
30 0 0 0 0 98.96 99.17
R2=0.9640 R2adj= 0.9493 R2pred= 0.9255
The percent sorption ranged from 92.05% to 99.60%. The
highest percent sorption of 99.60 % was obtained in run No. 2
using following conditions: pH 2.5, biosorbent dosage 3 g /L,
speed of agitation 85 rpm and contact time 60 min. Multiple
regression analysis was used to analyze the data and to obtain
empirical model for the best responses and thus second-order
polynomial equation was obtained (Eq. 23):
Y=98.77+(0.73*X1)+(-1.15*X2)+(0.12*X3)+(-
0.37*X4)+X1*(X2*1.09)+X1*(X3*0.28)+X1*(X4*-
0.37)+X3*(X2*-0.46)+X3*(X4*-0.32)+X3*(X4*-0.47)+X1*(X1*-
0.28)+X2*(X2*-0.56)+X3*(X3*-0.18)+X4*(X4*-0.11)
(22)
The mathematical expression of the relationships between the
independent variables and dependent response are given in
terms of uncoded factors. Apart from the linear effect of the
parameters on the dye removal, the RSM gives an insight into
the quadratic and interaction effects of the parameters. These
analyses are done by means of Fisher's F test and Student’s t
test. Student’s t test is used to determine the significance of
the regression coefficients of the parameters. The regression
coefficient and the t and P values for all the linear, quadratic,
and interaction effects of the parameters were calculated to
study the contribution of each variable towards biosorption as
shown in Table 4.
Table 4. Estimated regression coefficients for percent biosorption of dyes in the textile effluent
Term Coefficient SE Coefficient t- Statistics P-
Value
Constant 98.7707 0.2054 480.7 0
Block -0.3822 0.0962 -3.97 0.001
pH 0.7297 0.1014 7.191 0
Biosorbent dosage -1.1545 0.1014 -11.377 0
Speed of agitation 0.1165 0.1014 1.148 0.270
Contact time -0.3675 0.1014 -3.621 0.003

International Journal of Latest Technology in Engineering, Management & Applied Science (IJLTEMAS)
Volume VI, Issue IV, April 2017 | ISSN 2278-2540
www.ijltemas.in Page 18
pH*pH -0.2833 0.0949 -2.984 0.010
Biosorbent dosage*Biosorbent dosage -0.5558 0.0949 -5.855 0
Speed of agitation* Speed of agitation -0.1822 0.0949 -1.919 0.076
Contact time*Contact time -0.1119 0.0949 -1.179 0.258
pH*Biosorbent dosage 1.0871 0.1242 8.747 0
pH*Speed of agitation 0.2814 0.1242 2.265 0.040
pH*Contact time 0.3704 0.1242 2.981 0.010
Speed of agitation*Biosorbent dosage -0.4578 0.1242 -3.684 0.002
Speed of agitation*Contact time -0.3164 0.1242 -2.546 0.023
Biosorbent dosage*Contact time -0.4681 0.1242 -3.766 0.002
The variable with the highest t- value is considered to be the
best and is ranked one. Based on the t- values, the variables
were ranked in the following order: biosorbent dosage, pH,
contact time and speed of agitation. The variable with the
large coefficient, either positive or negative, indicates a large
impact on the response. A positive sign of the effect of the
tested variable indicates its greater influence on biosorption at
a high level and a negative effect indicates greater influence
of the variable at a low level. Analysis of the regression
coefficients of four variables showed that pH and speed of
agitation had a positive effect on biosorption while biosorbent
dosage and contact time had a negative effect on biosorption.
The corresponding probability values (P values) point towards
the significance of each of the coefficient [43]. From very
small P values (P < 0.05) for all the linear effects (except for
speed of agitation), quadratic effects (except for speed of
agitation and contact time), as well as all the interaction
effects, it can be said that the coefficients were highly
significant. These measures indicated that the accuracy and
general ability of the polynomial model was good and that
analysis of the response trends using the model was
reasonable.
The statistical implication of the ratio of the mean
square variation due to the regression and mean square
residual error was also tested using analysis of variance
(ANOVA) as shown in Table 5. The ANOVA of the quadratic
regression model demonstrated that the model was highly
important, as was evident from the low P-value of the Fisher’s
F-test (Fmodel, 25.71) [(Pmodel>F) = 0.000]. The lower
calculated F14,14-value (8.99) than the tabulated F-value even
at the 0.0001 confidence level showed a statistically
unimportant lack of fit. The model was found to be adequate
for prediction within the range of variables employed.
Table 5.ANOVA for response surface quadratic model
Source DF Seq SS Adj SS Adj MS F-value P-value
Blocks 1 3.8949 3.8949 3.8949 15.76 0.001
Regression 14 88.97 88.97 6.355 25.71 0.000
Linear 4 48.3325 48.3325 12.0831 48.89 0.000
Square 4 9.8063 9.8063 2.5162 9.92 0.001
Interaction 6 30.8311 30.8311 5.1385 20.79 0.000
Residual Error 14 3.4599 3.4599 0.2471
Lack-of-Fit 10 3.4236 3.4236 0.3424 37.72 0.002
Pure Error 4 0.0363 0.0363 0.0091
Total 29 96.3247
DF: Degree of freedom; SS: Sum of squares; MS: Mean sum of square; CV=0.36%;
The values of R2 and Adj-R
2 were close to 1.0, which
advocates a high correlation between the observed values and
the predicted values. It indicates the efficiency of the
regression model in providing an excellent explanation of the
relationship between the independent variables and the
response [44]. The R2 also indicated that only 3.60 % of the
International Journal of Latest Technology in Engineering, Management & Applied Science (IJLTEMAS)
Volume VI, Issue IV, April 2017 | ISSN 2278-2540
www.ijltemas.in Page 19
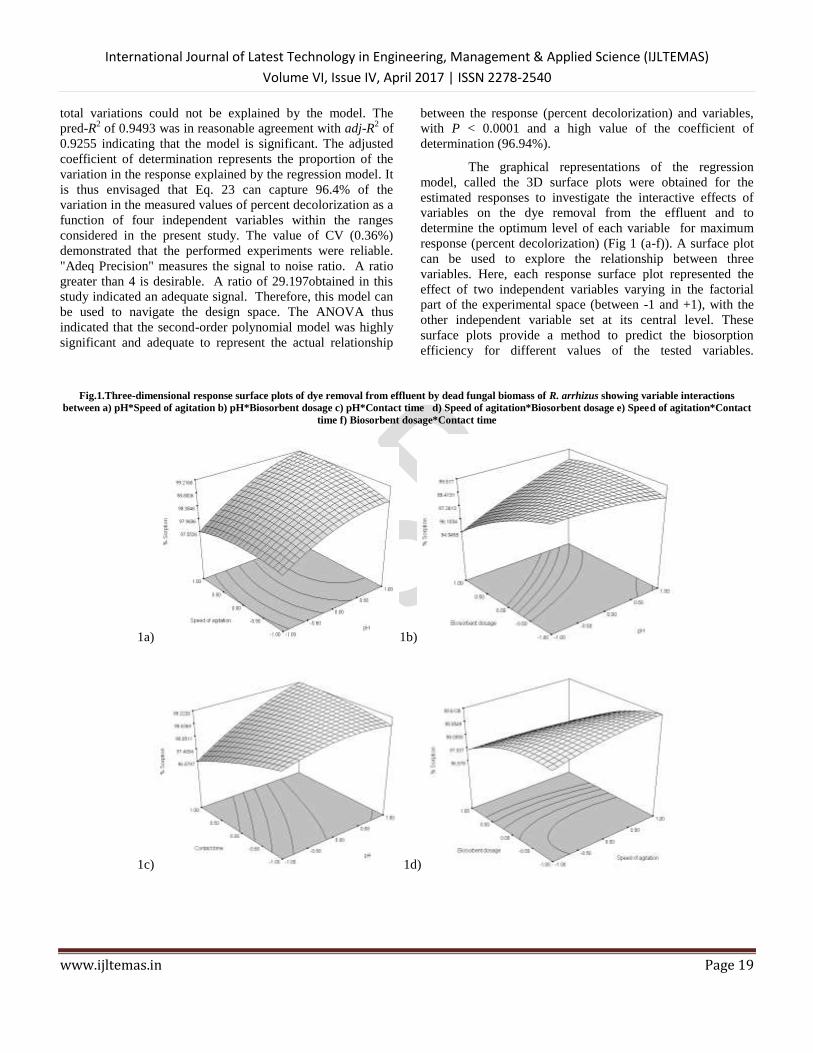
total variations could not be explained by the model. The
pred-R2 of 0.9493 was in reasonable agreement with adj-R
2 of
0.9255 indicating that the model is significant. The adjusted
coefficient of determination represents the proportion of the
variation in the response explained by the regression model. It
is thus envisaged that Eq. 23 can capture 96.4% of the
variation in the measured values of percent decolorization as a
function of four independent variables within the ranges
considered in the present study. The value of CV (0.36%)
demonstrated that the performed experiments were reliable.
"Adeq Precision" measures the signal to noise ratio. A ratio
greater than 4 is desirable. A ratio of 29.197obtained in this
study indicated an adequate signal. Therefore, this model can
be used to navigate the design space. The ANOVA thus
indicated that the second-order polynomial model was highly
significant and adequate to represent the actual relationship
between the response (percent decolorization) and variables,
with P < 0.0001 and a high value of the coefficient of
determination (96.94%).
The graphical representations of the regression
model, called the 3D surface plots were obtained for the
estimated responses to investigate the interactive effects of
variables on the dye removal from the effluent and to
determine the optimum level of each variable for maximum
response (percent decolorization) (Fig 1 (a-f)). A surface plot
can be used to explore the relationship between three
variables. Here, each response surface plot represented the
effect of two independent variables varying in the factorial
part of the experimental space (between -1 and +1), with the
other independent variable set at its central level. These
surface plots provide a method to predict the biosorption
efficiency for different values of the tested variables.
Fig.1.Three-dimensional response surface plots of dye removal from effluent by dead fungal biomass of R. arrhizus showing variable interactions
between a) pH*Speed of agitation b) pH*Biosorbent dosage c) pH*Contact time d) Speed of agitation*Biosorbent dosage e) Speed of agitation*Contact
time f) Biosorbent dosage*Contact time
1a) 1b)
1c) 1d)

International Journal of Latest Technology in Engineering, Management & Applied Science (IJLTEMAS)
Volume VI, Issue IV, April 2017 | ISSN 2278-2540
www.ijltemas.in Page 20
1e) 1f)
As seen in Fig. 1a–f, each response surface yield showed a
clear peak suggesting that the optimum point was inside the
design boundary [28]. The surface plot based on independent
variables, i.e., pH (X1) and speed of agitation (X3), while the
other independent variables biosorbent dosage (X2) and
contact time (X4) were kept at zero level is shown in Fig. 1a.
The figure revealed an interaction behavior with a positive
main effect of both pH and speed of agitation, where the
contribution of pH was prominent compared to that of speed
of agitation. When the pH was increased from 1.5 to 2.5, the
percent biosorption increased from 96.37 % to 98.27%, while
only a slight increase was achieved when the speed of
agitation was raised from 75 rpm to85 rpm. This indicated that
high values of pH in the acidic range employed and speed of
agitation yielded high biosorption capacities. Agitation
promotes adequate contact between the dye ions in the
solution and the binding sites on the biomass. It is known that,
external film diffusion can influence the rate of biosorption
process. With appropriate agitation, this mass transfer
resistance thickness and the liquid boundary layer around the
biosorbent particles are minimized [45-47]. This enhances the
diffusion rate of a solute from the bulk liquid to the liquid
boundary layer surrounding biosorbent particles thereby
promoting effective transfer of dye ions to the biosorbent sites
[48,49].
The pH of the dye solution was also involved in a
two-way interaction with biosorbent dosage as well as contact
time (Fig. 1b and 1c). The profile shown in Fig. 1b presents an
interaction between pH and biosorbent dosage with the other
independent variables kept at zero level. It suggested that
percent biosorption increased when the pH of the system
increased from 1.5 to 2.5 and biosorbent dosage decreased
from 5 g /L to 3 g /L. The interaction between the dye
molecules and the biosorbent is basically a collective result of
charges on the dye molecules and the surface of the
biosorbent [50].The dyes present in the effluent employed in
this study were typically monoazo dyes containing various
types of reactive groups such as vinylsulphone and
monochloro- s triazine that are known to interact with the
active groups on the cell surface of the fungal cell wall. The
hexosamines-chitin and chitosan constituting approximately
24–40% of the cell dry weight of Rhizopus serve as a matrix
of various functional groups like amine R–NH2 (amino acids,
proteins, glycoproteins, etc.), carboxylic (fatty acids,
lipopolysaccharides, etc.), phosphate and sulfonate which take
part in binding of dye ions [51].
Solution pH other than determining the surface
charge of the biosorbent also determines the degree of
ionization and speciation of the adsorbate, which affects the
adsorption of dyes. Reactive dyes are anionic dyes because of
the negative electrical structure of their azo based
chromophore group and release colored dye anions in
solution. At low pH of the solution, more protons are
available to protonate the amino groups of chitosan molecules
thereby forming positively charged–NH3+ groups that provide
cationic anchor points with which the dye anions interact via
ionic bonding. The chemical affinity between the positive
charge of the protonated amino group (–NH3+) of biomass and
negative charges in the structures of anionic dyes (-SO3-
)
weakens the resistance of the boundary layer surrounding the
biosorbent leading to more sorption under acidic conditions
by electrostatic attraction [52,53]. Higher pH values (> 3),
lead to deprotonation of the surface groups contributing to the
decreased removal of dyes due to the electrostatic repulsion
[54,55]. A similar trend for binding of reactive and acid dyes
by fungus R. arrhizus and alga Enteromorpha prolifera has
shown maximum values in the range pH 2–3 with a sharp
drop off at higher values [28,53, 57]. Various reasons have
been suggested to explain the reduced uptake capacity at
increasing biomass including electrostatic interactions,
overlapping or aggregation of adsorption sites resulting in a
decrease in the total adsorbent surface area, interference
between binding sites and reduced mixing at higher biomass
densities [58-60]. Biosorbent dosage also exhibited interaction
with speed of agitation (Fig. 1d) and contact time (Fig. 1f).
The highest percent biosorption of 99.60 % was achieved with
contact time of 60 min.
3. Validation of the model

International Journal of Latest Technology in Engineering, Management & Applied Science (IJLTEMAS)
Volume VI, Issue IV, April 2017 | ISSN 2278-2540
www.ijltemas.in Page 21
To assess the prediction capability of the model
developed, several validation experiments were carried out in
the region of experimentation surrounded by the factorial
points (xi varying between -1 and +1) [61]. The special feature
of the RSM tool, 'Point prediction' was used to find optimum
value of the combination of the four factors for the maximum
biosorption. The observed values of percent decolorization
(99.60%) were in good agreement with the predicted values
(99.24 %) and fell into the 95% prediction intervals, further
validating the model presented above. The predicted optimal
conditions were as follows: pH 2.5, biosorbent dosage 3.7 g
/L, speed of agitation 85 rpm, and contact time 69 min. The
results revealed the efficiency of the biosorbent in removing
not only color but other pollutants in the textile effluent as
well. The biosorbent achieved a high degree of removal of
color (99.60%), chloride (88.94%), TDS (84.35%), TSS
(60%), TS (84%), COD (89.76%), BOD (86.36%). Thus, the
dead biomass of R. arrhizus showed potential to be used as an
efficient biosorbent for the treatment of biologically refractory
textile effluent.
4. Mechanism of biosorption of dyes in the textile effluent by
R. arrhizus
The relatively short contact time, necessary for
achieving equilibrium conditions (an hour as seen in this
study) is considered as an initial indication that the adsorption
of dyes on R. arrhizus is a chemically controlled process,
rather than a diffusion controlled one [28].
The mechanism of adsorption of dyes in the effluent
by R. arrhizus was elucidated on the basis of BET, XRD and
FTIR analysis. The BET analysis revealed that the biomass
had a low surface area (0.618m2/g) and showed a mesoporous
structure (pore diameter=64.789Å). Dubinin (1967) suggested
that mesopores are instrumental in the transport of adsorbate
molecules to the micropores and the pore size distribution is
of more importance than the surface area. High biosorption
values achieved in the present investigation despite a low
surface area could also be attributed to the mesoporous
structure of the biosorbent as revealed by the BET analysis.
X-ray diffraction technique is a powerful tool to analyze the
crystalline nature of the materials. Adsorption of dye may lead
to change in molecular and crystalline structure of the
adsorbent. The resulting changes provide a valuable
information regarding adsorption reaction while elucidating
the molecular and crystalline structure of the adsorbent [64].
The XRD pattern of R. arrhizus biosorbent revealed poorly
resolved peaks indicating a predominance of amorphous
material indicating its suitability for biosorption. The broad
peaks were obtained at 2θ= 19.7572, 21.4273, 24.0244 and a
small sharp peak at 2θ= 72.6714 with d spacing 4.49365,
4.14703, 3.70429 and 1.30113, respectively. Presence of
broad peaks can be attributed to a heterogeneous and complex
matrix composed of several substances, including proteins,
lipids, carbohydrates etc. The XRD patterns of the dye-laden
biomass displayed more amorphous characters, suggesting
that the dye molecules were adsorbed on the surface mostly
by chemisorption causing alteration of the structure of the
biomass, as a result of the adsorption reaction (Fig. 4) [61].
Fig.4. XRD pattern of (a) biosorbent and (b) wastewater loaded biosorbent
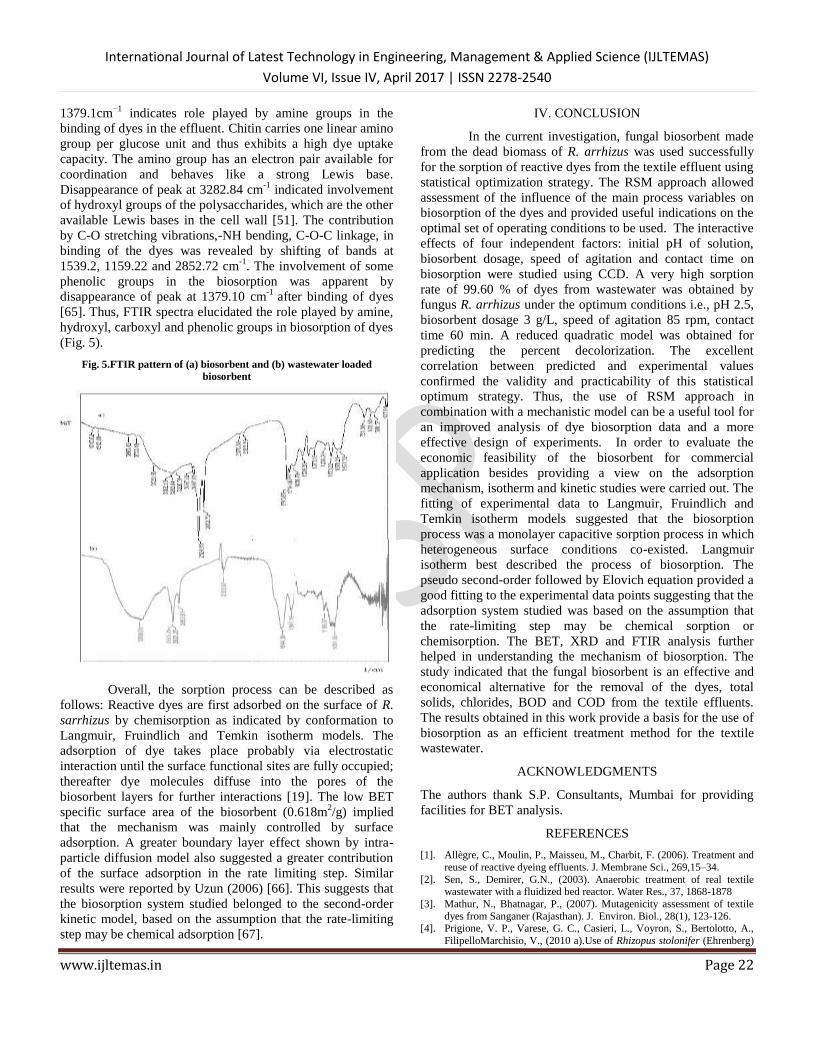
The FTIR spectral analysis is important in
identifying the characteristic functional groups, which are
responsible for biosorption of dye molecules. A closer insight
into the biomass surface properties was obtained by
comparing the FTIR spectra of dye effluent loaded biomass of
R. arrhizus, with that of the unloaded biomass in the range of
400–4000 cm-1
. The infrared spectrum of the biomasses
displayed characteristic bands of proteins, lipids, polymeric
compounds indicating the complex and heterogeneous nature
of the biomass [62,63]. Peaks between 3500 to 3200 cm−1
represent the presence of –OH groups of alcohols and phenols
and primary, secondary amines or amide –N-H groups, while
peaks between 3300 to 2500 cm-1
indicate O-H stretch of
carboxylic acids. Peak positions between the wave number
range of 2000 cm-1
to 500 cm-1
, indicate the vibrational modes
that are specific to the type of polysaccharides and glycosidic
linkages. Peaks in this range denote the presence of aldehyde
functional groups which are actively involved in biosorption.
Amide I bands (1700cm-1
-1600cm-1
) due to C=O stretching
vibrations of peptide bond provide insight into the secondary
structure of proteins [124]. Similar peaks (1658.78 cm-1
) were
obtained in the biosorbent used in this study. Peaks between
910-665 cm-1
represent N-H wag of primary and secondary
amines.
The spectrum displayed the absorption peaks at
3523.95–3226.91, 1743.65, 1710.86, 1658.78, and 1238.3
cm−1
, corresponding to carboxyl groups. Shifts in peaks
corresponding to carboxylic groups (1658.78 to 1644.39cm−1
)
and disappearance of peaks at 3523.95, 3302.13, 3282.84,
3226.91, 1743.65, 1710.86, 1238.3 cm-1
after dye biosorption
indicates their involvement. Disappearance of peaks at
3226.91 and 3302.13 cm−1
and shifting of peaks at 1539.2 and
International Journal of Latest Technology in Engineering, Management & Applied Science (IJLTEMAS)
Volume VI, Issue IV, April 2017 | ISSN 2278-2540
www.ijltemas.in Page 22
1379.1cm−1
indicates role played by amine groups in the
binding of dyes in the effluent. Chitin carries one linear amino
group per glucose unit and thus exhibits a high dye uptake
capacity. The amino group has an electron pair available for
coordination and behaves like a strong Lewis base.
Disappearance of peak at 3282.84 cm-1
indicated involvement
of hydroxyl groups of the polysaccharides, which are the other
available Lewis bases in the cell wall [51]. The contribution
by C-O stretching vibrations,-NH bending, C-O-C linkage, in
binding of the dyes was revealed by shifting of bands at
1539.2, 1159.22 and 2852.72 cm-1
. The involvement of some
phenolic groups in the biosorption was apparent by
disappearance of peak at 1379.10 cm-1
after binding of dyes
[65]. Thus, FTIR spectra elucidated the role played by amine,
hydroxyl, carboxyl and phenolic groups in biosorption of dyes
(Fig. 5).
Fig. 5.FTIR pattern of (a) biosorbent and (b) wastewater loaded
biosorbent
Overall, the sorption process can be described as
follows: Reactive dyes are first adsorbed on the surface of R.
sarrhizus by chemisorption as indicated by conformation to
Langmuir, Fruindlich and Temkin isotherm models. The
adsorption of dye takes place probably via electrostatic
interaction until the surface functional sites are fully occupied;
thereafter dye molecules diffuse into the pores of the
biosorbent layers for further interactions [19]. The low BET
specific surface area of the biosorbent (0.618m2/g) implied
that the mechanism was mainly controlled by surface
adsorption. A greater boundary layer effect shown by intra-
particle diffusion model also suggested a greater contribution
of the surface adsorption in the rate limiting step. Similar
results were reported by Uzun (2006) [66]. This suggests that
the biosorption system studied belonged to the second-order
kinetic model, based on the assumption that the rate-limiting
step may be chemical adsorption [67].
IV. CONCLUSION
In the current investigation, fungal biosorbent made
from the dead biomass of R. arrhizus was used successfully
for the sorption of reactive dyes from the textile effluent using
statistical optimization strategy. The RSM approach allowed
assessment of the influence of the main process variables on
biosorption of the dyes and provided useful indications on the
optimal set of operating conditions to be used. The interactive
effects of four independent factors: initial pH of solution,
biosorbent dosage, speed of agitation and contact time on
biosorption were studied using CCD. A very high sorption
rate of 99.60 % of dyes from wastewater was obtained by
fungus R. arrhizus under the optimum conditions i.e., pH 2.5,
biosorbent dosage 3 g/L, speed of agitation 85 rpm, contact
time 60 min. A reduced quadratic model was obtained for
predicting the percent decolorization. The excellent
correlation between predicted and experimental values
confirmed the validity and practicability of this statistical
optimum strategy. Thus, the use of RSM approach in
combination with a mechanistic model can be a useful tool for
an improved analysis of dye biosorption data and a more
effective design of experiments. In order to evaluate the
economic feasibility of the biosorbent for commercial
application besides providing a view on the adsorption
mechanism, isotherm and kinetic studies were carried out. The
fitting of experimental data to Langmuir, Fruindlich and
Temkin isotherm models suggested that the biosorption
process was a monolayer capacitive sorption process in which
heterogeneous surface conditions co-existed. Langmuir
isotherm best described the process of biosorption. The
pseudo second-order followed by Elovich equation provided a
good fitting to the experimental data points suggesting that the
adsorption system studied was based on the assumption that
the rate-limiting step may be chemical sorption or
chemisorption. The BET, XRD and FTIR analysis further
helped in understanding the mechanism of biosorption. The
study indicated that the fungal biosorbent is an effective and
economical alternative for the removal of the dyes, total
solids, chlorides, BOD and COD from the textile effluents.
The results obtained in this work provide a basis for the use of
biosorption as an efficient treatment method for the textile
wastewater.
ACKNOWLEDGMENTS
The authors thank S.P. Consultants, Mumbai for providing
facilities for BET analysis.
REFERENCES
[1]. Allègre, C., Moulin, P., Maisseu, M., Charbit, F. (2006). Treatment and
reuse of reactive dyeing effluents. J. Membrane Sci., 269,15–34.
[2]. Sen, S., Demirer, G.N., (2003). Anaerobic treatment of real textile wastewater with a fluidized bed reactor. Water Res., 37, 1868-1878
[3]. Mathur, N., Bhatnagar, P., (2007). Mutagenicity assessment of textile
dyes from Sanganer (Rajasthan). J. Environ. Biol., 28(1), 123-126. [4]. Prigione, V. P., Varese, G. C., Casieri, L., Voyron, S., Bertolotto, A.,
FilipelloMarchisio, V., (2010 a).Use of Rhizopus stolonifer (Ehrenberg)

International Journal of Latest Technology in Engineering, Management & Applied Science (IJLTEMAS)
Volume VI, Issue IV, April 2017 | ISSN 2278-2540
www.ijltemas.in Page 23
Vuillemin in methods for treating industrial wastewaters containing dyes. US Patent No: 7658849.
[5]. Ayed, L., Achour, S., Bakhrouf, A., (2011). Application of the mixture
design to decolourise effluent textile wastewater using continuous stirred bed reactor. Water SA., 37 (1), 21-26.
[6]. Adinew, B. (2012). Textile effluent treatment and decolorization techniques– A review. Chemistry: Bulg J Sci Educ, 21 (3), 434-456.
[7]. Khalaf, M.A. (2008). Biosorption of reactive dye from textile
wastewater by non-viable biomass of Aspergillus niger and Spirogyra sp. Bioresour. Technol., 99, 6631–6634.
[8]. Reddy, M.C.S., (2006). Removal of direct dye from aqueous solutions
with an adsorbent made from tamarind fruit shell from tamarind fruit shell, an agricultural solid waste. J. Sci. Ind. Res., 65, 443-446.
[9]. Corso, C.R., Maganha de Almeida, A.C., (2009). Bioremediation of
dyes in textile effluents byAspergillus oryzae. Microb. Ecol., 57,384–390.
[10]. McKay, G. (1979). Waste colour removal from textile effluents. Am
Dyestuff Rep., 68, 29–36.
[11]. Fu, Y., Viraraghavan, T., (2003). Column studies for biosorption of
dyes from aqueous solutions on immobilised Aspergillus niger fungal
biomass. Water SA., 29, 465–472. [12]. Murugesan, K., (2003). Bioremediation of paper and pulp mill effluents.
Ind. J. Exp. Biol., 41(11),1239-1248.
[13]. Zille, A., (2005). Laccase reactions for textile applications. Dissertation, the University of Minho, Italy.
[14]. Arami, M., Limaee, N. Y. and Mahmoodi, N. M., (2008).Evaluation of
the adsorption kinetics and equilibrium for the potential removal of acid dyes using a biosorbent. Chem. Eng. J., 139,2–10.
[15]. McKay, G., (1983). Adsorption of dyestuffs from aqueous solutions
using activated carbon. J. Chem. Technol. Biotechnol., 33A, 196-204. [16]. Scult, F., (2009).The biosorption behavior of inactive Aspergillus niger
modified by autoclaving in treating dye wastewater. Thesis,
Undergraduate Student Research Program, Lund University. [17]. Russo, M.E., Marzocchella, A., Olivieri, G., Prigione, V., Salatino, P.,
Tigini, V.,Varese, G.C., Characterization of dyes biosorption on fungal
biomass. In: Pierucci, S. (Ed.), ICheaP-9: 9th International Conference on Chemical and Process Engineering. AIDIC, Milano (10th-13thMay
2009, Rome, Italy) pp 1071-1076 (Chemical Engineering Transactions,
17). ISBN: 9788895608013. [18]. Erden, E., Kaymaz, Y., Pazarlioglu, N. K., (2011). Biosorption kinetics
of a direct azo dye Sirius Blue K-CFN by Trametes versicolor. E. J.
Biotechnol., 14(2). http://dx.doi.org/10.2225/vol14-issue2-fulltext-8 - 2011.
[19]. Crini, G., (2006). Non-conventional low-cost adsorbents for dye
removal. Biores. Technol., 97:1061–1085. [20]. Chen, A.H., Chen, S.M., (2009).Biosorption of azo dyes from aqueous
solution by glutaraldehyde-crosslinked chitosans. J. Hazard Mater., 172,
1111-1121. [21]. Yang, Y., Li, Z., Wang, G., Zhao, X.-P., Crowley, D.E., Zhao, Y.-
H.,(2012). Computational identification and analysis of the key
biosorbent characteristics for the biosorption process of Reactive Black 5 onto Fungal Biosorbent. PLOS one, 7 (3).
doi:10.1371/journal.pone.0033551.
[22]. Aksu, Z., (2005). Application of biosorption for the removal of organic pollutants: A review. Process Biochem., 40,997–1026.
[23]. Ambrósio, S.T., José, C., Vilar, J., Carlos, A., Alves, S., Kaoru, O.,
Nascimento, A.E., Longo, R.L., Takaki, G.M.C., (2012).A Biosorption isotherm model for the removal of reactive azo dyes by inactivated
mycelia of Cunninghamella elegans UCP542.Molecules, 17: 452-462. [24]. Czitrom, V., (1999). One-factor-at-a-time versus designed experiments.
Am. Stat., 53(2), 126-131.
[25]. Zhou, J., Yu, X., Ding, C., Wang, Z., Zhou, Q., Pao, H., Cai, W., (2011).Optimization of phenol degradation by Candida tropicalis Z-04
using Plackett-Burman design and response surface methodology. J.
Environ. Sci., 23(1), 22–30. [26]. Bashir, M. J.K., Aziz, H.A., Aziz, S.Q., Amr, S.A., (2012). An overview
of wastewater treatment processes optimization using response surface
methodology (RSM). The 4th International Engineering Conference –Towards engineering of 21stcentury, Gaza, Palestine.
[27]. Ebrahimi, A., Arami, M., Bahrami, H. and Pajootan, E. (2013). Fish
bone as a low-cost adsorbent for dye removal from wastewater: Response surface methodology and classical method. Environ. Model
Assess. doi: 10.1007/s10666-013-9369-z. [28]. Saraf, S., Vaidya, V. K., (2015).Statistical optimization of biosorption
of Reactive Orange 13 by dead biosorbent of Rhizopus arrhizus NCIM
997 using response surface methodology. Int. J. Ind. Chem., 6, 93–104. [29]. Yatome, C., Ogawa, T., Koga, D., Idaka, E., (1981). Biodegradability of
azo and triphenylmethanes dyes by Pseudomonas pseudomallei 13NA. J
Soc Dyers Colorists, 97,166–169. [30]. APHA, 2002, Standard methods for the examination of water and
wastewater, 20 th edn., “American Public Health Association”,
Washington, DC. [31]. Chowdhury, S., Das Saha, P., (2012). Biosorption of methylene blue
from aqueous solutions by a waste biomaterial: Hen feathers. Appl.
Water Sci., 2,209–219.
[32]. Sztarr, Y. (2008).Measuring colour in trade waste.2nd Annual WIOA
NSW Water Industry Engineers & Operators Conference Jockey Club –
Newcastle, (8th -10th April, 2008), pp. 97-103. [33]. Kurade, M. B., Waghmode, T. R., Kagalkar, A. N. and Govindwar, S.P.
(2012). Decolorization of textile industry effluent containing
disperse dye Scarlet RR by a newly developed bacterial-yeast consortium BL-GG.Chem. Eng.J. 184: 33– 41.
[34]. Plackett, R. L., Burman, J.P., (1946).The design of optimum
multifactorial experiments. Biometrika, 33,305–325. [35]. Song, X., Zhang, X., Kuang, C., Zhu, L., Guo, N., (2007).Optimization
of fermentation parameters for the biosorbent and DHA production of
Schizochytrium limacinum OUC88 using response surface methodology. Process Biochem., 42(10),1391-1397.
[36]. Allen, S.J., McKay, G., Porter, J.F., (2004). Adsorption isotherm models
for basic dye adsorption by peat in single and binary component systems. J. Colloid Int. Sci., 280:322–333.
[37]. Akan, J.C., Abdulrahman, F.I., Dimari, G.A., Ogugbuaja, V.O., (2008).
Physicochemical determination of pollutants in wastewater and vegetable samples along the Jakara wastewater Channelin Kano
metropolis, Kano State, Nigeria. Eur. J. Sci. Res., 23 (1), 122-133.
[38]. Alaguprathana, M., Poonkothai, M., (2015).Bio-sorption of physico-chemical constituents in textile dyeing effluent using Spirogyra gracilis
K ützing. J. Algal Biomass Utln., 6 (2), 11- 21.
[39]. BIS 1981. Tolerance limits for industrial effluents discharged into inland surface waters, IS 2490, Part 1. Bureau of Indian Standards. New
Delhi.
[40]. Metcalf & Eddy, Wastewater Engineering, Treatment and Reuse.4th Ed., McGraw-Hill New York, USA, (2003).
[41]. U. G. Turak and H. A. Fsar, A Donor Menderes Univ., 4th AACD
Congress, Kusadasi – Aydin, Turkey, Proceeding Book, p177 (2004). [42]. Mahmoued, E., (2010). Cement kiln dust and coal filters treatment of
textile industrial effluents. Desalination., 255: 175–178.
[43]. Abdalla, K.Z., Hammam, G., (2014). Correlation between biochemical oxygen demand and chemical oxygen demand for various wastewater
treatment plants in Egypt to obtain the biodegradability indices. Int. J.
Sci.: Basic Appl. Res., 13(1),42-48. [44]. Montgomery, D.C., (2005). Design and analysis of experiments, Sixth
ed. John Wiley & Sons, New York.
[45]. Kaushik, R., Saran, S., Isar, J., Saxena, R.K., (2006).Statistical optimization of medium components and growth conditions by response
surface methodology to enhance lipase production by Aspergillus carneus. J. Mol. Catal. B: Enz., 40,121-126.
[46]. Bai, S.R., Abraham, T.E., (2003).Studies on chromium (IV) adsorption-
desorption using immobilized fungal biomass. Bioresour. Technol., 87,17–26.
[47]. Ahalya, N., Kanamadi, R.D., Ramachandra, T.V., (2005).Biosorption of
chromium (VI) from aqueous solutions by the husk of Bengal gram (Cicer arientinum). Electron. J. Biotechnol., 8(3): 258-264.
[48]. Al-Qodah, Z., (2006). Biosorption of heavy metal ions from aqueous
solutions by activated sludge. Desalination, 196, 164-176

International Journal of Latest Technology in Engineering, Management & Applied Science (IJLTEMAS)
Volume VI, Issue IV, April 2017 | ISSN 2278-2540
www.ijltemas.in Page 24
[49]. Evans, J.R., Davids, W.G., MacRae, J.D., Amirbahman, A., (2002).Kinetics of cadmium uptake by chitosan-based crab shells.
Water Res., 36, 3219–3226.
[50]. Shen, J., Duvnjak, Z., (2005).Adsorption kinetics of cupric and cadmium ions on corncob particles. Process Biochem., 40, 3446-3454.
[51]. Maurya, N.S., Mittal, A.K., Cornel, P., Rothe, E., (2006). Biosorption of dyes using dead macro fungi: Effect of dye structure, ionic strength and
pH. Bioresour. Technol., 97, 512–521.
[52]. Tsezos, M., Volesky, B., (1982). The Mechanism of Uranium Biosorption by Rhizopus arrhizus. Biotechnol. Bioengin., 24: 385-401.
[53]. Ozer, A., Akkaya, G., Turabik, M., (2005).Biosorption of acid red 274
(AR 274) on Enteromorpha prolifera in a batch system. J. Hazard. Mater., B126, 119–127.
[54]. Sun, D., Zhang, Z., Wang, M., Wu, Y., (2013). Adsorption of reactive
dyes on activated carbon developed from Enteromorpha prolifera. Am. J. Anal. Chem., 4,17-26.
[55]. Namasivayam, C., Kavitha, D., (2002). Removal of Congo Red from
water by adsorption onto activated carbon prepared from coir pith, an
agricultural solid waste. Dyes Pigments, 54, 47–58.
[56]. Wong, S.Y., Tan, Y.P., Abdullah, A.H., Ong, S.T., (2009).Removal of
Basic Blue 3 and Reactive Orange 16 by adsorption onto quartenized sugar cane bagasse. Malaysian J. Anal. Sci., 3(2), 185 – 193.
[57]. O’Mahony, T., Guibal, E., Tobin, J.M., (2002).Reactive dye biosorption
by Rhizopus arrhizus biomass. Enz. Microb. Technol., 31, 456–463. [58]. Kahraman, S., Asma, D., Erdemoglu, S., Yesilada,
O.,(2005).Biosorption of copper by live and dried biomass of
Phanerocheate crysoporium and Funali atrogii. Eng. Life Sci., 5(1),72-77.
[59]. Baral, S.S., Das, S.N., Rath, P., (2006). Hexavalent chromium removal from aqueous solution by adsorption on treated sawdust. Biochem. Eng.
J., 23,185–192.
[60]. Zuorro, A., Fidaleo, M., Lavecchia, R., (2013). Response surface methodology (RSM) analysis of photodegradation of sulfonated diazo
dye Reactive Green 19 by UV/H2O2 process. J. Environ. Manage., 127: 28-35.
[61]. Kaur, S., Rai, S., Mahajan, R. K., (2013). Adsorption kinetics for the
removal of hazardous dye Congo Red by biowaste materials as adsorbents. J. Chem. doi:org/10.1155/2013/628582.
[62]. Kapoor, A., Viraraghavan, T., (1998). Removal of heavy metals from
aqueous solutions using immobilized fungal biomass in continuous mode. Water Res., 32, 1968–1977.
[63]. Park, D., Yun, Y., Park, J. M., (2005).Studies on hexavalent chromium
biosorption by chemically-treated biomass of Ecklonia sp. Chemosphere., 60,1356- 1364.
[64]. Abirami,S., Srisudha, S., Gunasekaran, P., (2013).Comparative study of
chromium biosorption using brown, red and green macro algae. Int. J.
Biol. Pharm. Res., 4(2), 115-129.
[65]. Smith, B., (1999). Infrared spectral interpretation: A systematic
approach. CRC Press, Boca Raton. [66]. Uzun, İ., (2006). Kinetics of the adsorption of reactive dyes by chitosan.
Dyes Pigments, 70, 76-83.
[67]. Chiou, M.S., Li, H.Y., (2002). Equilibrium and kinetic modeling of adsorption of reactive dye on crosslinked chitosan beads. J. Hazard.
Mater. B93, 233–248.