international journal of mainstream social science: vol.1, no
TRANSCRIPT

International Journal of Mainstream Social Science
Volume 1, Number 1: Spring 2011
Honorary Editor Content Prof. J.P. Roos University of Helsinki, Finland 1.Credit in Mathematics in Senior Secondary Certificate E-mail: [email protected] Examinations as a Predictor of Success in Universities in Ondo and
Ekiti: T.O. Adeyemi: 3-14
Associate Editor 2.Employee Engagement: A Canvas of Empirical Studies:
Dr. Gevisa La Rocca D. Pradeep Kumar and G. Swetha: 15-34 Kore University of Enna, Italy 3.Re-Branding And Managing Conflicts among Academic Staff of E-mail: [email protected] Nigerian Universities: Sociological and Psychological Perspective:
C.A. Akinfolarin and Jude M.Akomolafe: 35-41
Series Editor 4.Low skilled labours in India and Role of Education Sector,
Dr. Siddhartha Sarkar Government and Corporate Sector: Vidya Gawali and Santosh
Director, Asian School of Management and Technology, Ghalage: 42-53
India
E-mail: [email protected]
Editorial Board Daniel Bertaux, National Center for Scientific Research, Paris Eduard Bonet Porqueras, University of Barcelona, Spain Goran Therborn, University of Cambridge, United Kingdom Kam C. Wong, Xavier University, USA Krzysztof T. Konecki, Lodz University, Poland Michael Tribe, Bradford Centre for International Development, United Kingdom Sangeun Lee, Soongsil University, Korea Stefania Vicari, University of Leicester, United Kingdom ISSN: 0974-3448 ISBN: 978-1-61233-543-8
Brown Walker Press 23331 Water Circle, Boca Raton, FL 33486-8540, USA
www.brownwalker.com/ASMT-journals.php Published by the Director, Asian School of Management and Technology, India
Asian School of Management and Technology (All Rights Reserved)


3
Credit in Mathematics in Senior Secondary Certificate Examinations as a Predictor of Success in Universities in Ondo and Ekiti
T.O. Adeyemi
Department of Educational Foundations & Management, University of Ado-Ekiti, Ado-Ekiti, Nigeria E-mail: [email protected]
Abstract: This paper investigated the predictive ability of credit grades in Mathematics in senior secondary certifi-cate (SSC) examinations in predicting the success of students in Educational Management in universities in Ekiti and Ondo States, Nigeria. As a descriptive research, the study population comprised all the 3 universities in the two states. Since Educational Management is being taught in only 2 of the universities, only 2 universities were purpo-sively selected for the study, Data were collected through an inventory and analyzed with the use of t-test, correla-tion analysis, analysis of variance and linear regression. The finding revealed that there was a significant relation-ship between the entry grade point of credit in Mathematics and the performance of Educational Management stu-dents measured by the cumulative grade point average (CGPA) in universities in the two States. It was also found that the entry credit grades obtained by Educational Management students in Mathematics in senior secondary cer-tificate examinations on the findings of the study, it is recommended that more emphasis should be given to the teaching of mathematics in secondary schools in the two states to enable better performance of students in the uni-versities. Keyword: Certificate, Examination, University, Relationship, Success, Prediction
Introduction University education in Nigeria has witnessed tremendous development since the country’s in-
dependence in 1960. This is recognition of the fact that the National Policy of Education stipu-lates that university education in Nigeria shall make optimum contribution to national develop-ment by intensifying and diversifying its programmes for the development of high level man-power within the context of the needs of the nation (FGN, 2004). In pursuance of this objective, university education in Ekiti and Ondo States, Nigeria has been geared towards the production of high-level manpower within the context of the needs of the nation (FGN, 2004). In pursuance of this objective, university education in Ekiti and Ondo States, Nigeria has been geared towards the production of high-level manpower. In doing this, examinations have been the main criterion of quality of the educational system (Fafunwa, 1974, Salami, 1992).
The 1887 Education Ordinance made provision for public examinations in schools that have at-tained the requisite percentage of proficiency (Adesina 1977). As such, all secondary schools in the country have geared their programmes to meet the requirements of examinations being con-ducted for the Senior Secondary School Certificate. The pattern of grading candidates’ scores in the examinations was such that the distinction grade was represented by A1 to B3. The credit grade was represented by C4 to C6. The ordinary pass grade was presented by D7 and E8 while the failure grade was represented by F9 (WAEC 2002). The distinction and credit grades referred to in this study are the only requisite qualifications for admission into Universities in Nigeria and candidates must have at least credit (C6) in five subjects including English Language in order to qualify for university admission (JAMB 2002).
In the university setting, performance is being assessed through the grade point average ob-tained by students in all the courses registered for by students. As such a student is considered to have performed well if the grade point average is high. To this end, the grade point average is on a cumulative basis from 100 level to the final year level (UNAD, Hand book, 2004). Hence, the cumulative grade point average would determine the performance level of a university student from one semester to another. The nomenclature of the cumulative grade point average is such

International Journal of Mainstream Social Science 1(1): Spring 2011
4
that 4.50 and above is first class, 3.50 to 4.50 is second class upper division, 2.50 to 3.49 is second class lower division, 1.50 to 2.49 is third class division, 1.00 to 1.49 is ordinary pass de-gree while below 1.00 is ( UNAD Handbook, 2004; Handbook 2006).
Considering the pattern of grading performance in the university system, researchers (Alonge, 1983, Bandele, 1985) have argued that credit in Mathematics is a good requisite qualificat5ion for better performance in degree examinations. Their argument has been based perhaps on the fact that a high credit grade in Mathematics would enhance better performance in certain courses including Educational Management. As such, a credit grade in Mathematics has been a require-ment for admission into courses in Educational Management in many Nigerian universities (UNAD Handbook, 2004; AAU, Handbook 2006), some researchers have also argued that credit in Mathematics may not necessarily enhance better performance in certain courses in the univer-sities (Aghenta, 1981). Their argument were based perhaps on the fact that many courses espe-cially in education may not necessary require a credit in Mathematics.
The term “academic performance” has been described as the scholastic standing of a student at a given moment. It refers to how an individual is able to demonstrate his or her intellectual abili-ties. This scholastic standing could be explained as the grades obtained in a course or groups of courses; and the way in which a student has attained the grades including the time he or she passed examination two after passing examination one (Daniels and Schouten, 1970, Owoyemi, 2000). Daniels and schouten (1970) therefore argued that a prediction of a future exami9onation result could be made with reasonable success on the basis of the result of an earlier examination and that grades may serve as prediction measures and as criterion measures.
As a measure of prediction, Dockery (1986) investigated the effects of intelligence quotient on academic achievement and found that achievement scores increased as the intelligence quotient increased. Eysenck (1995) agreed with this finding and remarked intelligence quotient testing has been extremely successful on the practical level predicting academic success from early childhood to universities degree. Findings made by Al- Shorayye (1995) and Adeyemi (1998) led credence to this point. Findings made Peer & Johnston (1994) confirmed the validity of the num-ber and grades of passes in the Scottish Certificate of Education in predicting first year and final year universities performance. Findings made by Gay (1996) in the USA also confirmed the fact that high school grades could be used to predict college grades.
Ion the same vein, Wankowsi (1973) found high correlations in the number of passes in GCSE examinations with overall performance in first and final year at university while values ranging from 0.14 to 0.73 depending on subject and faculty have been reported. Entwistle and Wilson (1977) too, found that students with three ‘A’ level passes did better than students with two in the university. Likewise, Hunter (1984) found the American College Test (ACT) scores as a good predictor of academic performance. These findings were contrary to O’Rourke, Martin & Hurley’s (1989) findings that the Scholastic Aptitude Test (SAT) is unable to predict examina-tion performance as effectively as the Leaving Certificate Examination (LCE) point scores. They however, reported that the SAT is a significant predictor of third level academic performance as demonstrated in the applicant- group analyses. Ai-Shorayye (1995) too, conducted a study on the effect of the admission policy, socio-economic factors, demographic and personal considerations on students’ performance in Kuwait. He conducted a pilot study with a group of 100 students to whom he gave questionnaires. Although he utilized the chi square test, correlation coefficient and multiple linear regressions to analyse his data, he found that a students’ grades in an exami-nation depends on the cumulative grade point average.

International Journal of Mainstream Social Science 1(1): Spring 2011
5
Other researchers (Ubokobong, 1993; Itsuokor 1994) have also found that the GCE and sec-ondary certificate examination results have provided the best predictor of university perfor-mance. In a study on “predicting educational performance at tertiary level on the basis of sec-ondary level performance in Nigeria’, he found that the good and solid background of the stu-dents boosted their performance at the tertiary level of education. In other developing countries, the index of academic performance varied from one country to another. In Kenya, Othuon & Ki-shor (1994) found that the Certificate of primary Education (CPE) scores had a moderate positive linear relationship with the Certificate of Secondary Education (CSE) grades with a correlation of 0.56 between them.
Researchers have made divergent findings on the predictive validity of some examinations (Alonge, 1998). While some researchers found that performance in a lower level examination to be significantly related to the performance in a higher level examination (Adeyemo, 2001). Other researchers have found no significant relationship between the performance in lower level ex-aminations and performance in higher institutions (Omonijo, 2001).
In view of the divergent findings made by previous researchers on the predictive validity of ex-aminations, this study intended to examine the predictive strength of credit grades in mathemat-ics in predicting success in Educational Management in Universities in Ekiti and Ondo State, Nigeria.
Statement of the Problem Despite the unique position of examinations in the educational system of Ekiti and Ondo
States, Nigeria, there have been conflicting findings on the predictive strength of credit grades in Mathematics in senior secondary certificate (SSC) examinations at predicting performance in Educational Management in the universities (Asaolu, 2002). Some researchers have argued that a credit in Mathematics would produce better university performance (Oluwatayo, 2003). Others were of the opinion that a credit in Mathematics would not give a better performance in Educa-tional Management in the University (Aghenta, 1981). The problem of this study therefore was to determine how significantly credit in Mathematics could predict performance of students in Educational Management in universities in Ekiti and Ondo States, Nigeria. In addressing this problem, the following research questions were raised.
Research Questions 1: What is the level of credit performance of Educational Management students in Mathematics
in the senior secondary certificate (SSC) examinations and their performance in Educational Management in Universities in Ekiti and Ondo States, Nigeria?
2: Is there any significant relationship between the credit performance of Educational Man-agement students in Mathematics in the senior secondary certificate (SSC) examinations and their performance in Educational Management in Universities in Ekiti and Ondo States, Nigeria?
3: Is there any significant difference in the entry grade point of credit in Mathematics for Edu-cational Management students between the universities in Ekiti and Ondo States, Nigeria?
4: Is there any significant difference in the performance of students (CGPA) in Educational Management between the universities in Ekiti and Ondo States, Nigeria?
5: Could the entry credit grades obtained by Educational Management students in Mathematics in senior secondary certificate examinations predict significantly the performance of final year 400 level students in Educational Management in universities in Ekiti and Ondo States, Nigeria?

International Journal of Mainstream Social Science 1(1): Spring 2011
6
Method This study employed the correlational and ex-post facto research design. Anderson (1998) de-
scribed correlational research as one way of describing in quantitative terms the degree to which variables are related. He argued that correlation studies investigate a number of variables be-lieved to be related to an important variable such as academic performance. Gay (1996) de-scribed an ex-post facto research as an after fact study which does not involve the manipulation of variables.
The population for this study comprised all the 3 universities in Ekiti and Ondo States, Nigeria made up of one Federal University and two state universities. Since only two of the university offer Educational Management while the third does not, the sample for the study comprised the 2 universities that offer Educational management, one in Ekiti State and the other in Ondo State. The method of selection was by the purposive sampling technique. A total of 102 respondents made up of 13 deans, 76 heads of departments and 13 faculty officers from the 2 universities was used for the study. These deans, heads of departments and the faculty officers constituted the respondents of the study. The study was delimited to only the second year (200 level) students in two universities for the 2005/2006 academic year.
The instrument used for collecting data for the study was an inventory titled ‘University educa-tional students’ inventory.’ The instrument consisted of three sections. Section 1 was demo-graphic. It requested for information about the university, its location, year of establishment and type of university whether conventional or specialized. Section 2 requested for data on number of students registered in the Faculty of Education in each of the universities, the number of second year (200 level) students who registered for educational management in each university for the 2005/2006 academic year. It also consisted of data on the credit grades obtained by these students in Mathematics in the senior secondary certificate (SSC) examinations before the entry date. Section 3 consisted of data on the grade point average ad the cumulative grade point aver-age obtained by these second year (200 level) educational management students of the two uni-versities in the 2007/2008 academic year.
The content validity of the instrument was determined by experts in tests ad Measurements who matched all the items of the inventory with the research questions to ascertain whether or not the instrument actually measured what it was supposed to measure. Their comments were used to review the items of the instrument before administering them to the respondents. The da-ta collected were analyzed using descriptive statistics such as the mean and the standard devia-tion as well as inferential statistics such as correlation analysis, one-way analysis of variance (ANOVA) and multiple regression. The hypotheses were for significance at 0.05 alpha level.
Data Analysis Question 1: What is the level of credit performance of Educational Management students in
Mathematics in the senior secondary certificate (SSC) examinations and their performance in Educational Management in Universities in Ekiti and Ondo States, Nigeria?
In answering this question, data on the number of Educational Management students who ob-tained different categories of credit grades A1 to C6 in Mathematics in the senior secondary cer-tificate examinations were collected from the respondents using the inventory. Data on the cumu-lative grade point average (CGPA) of Educational Management students were also collected. Table 1 shows the findings.

International Journal of Mainstream Social Science 1(1): Spring 2011
7
Table 1: The average CGPA obtained by students in Educational Management with their
Credit Level Entry Grade Point in Mathematics in the two universities Entry Grade Point Credit
Level in Mathematics N A1 B2 B3 C4 C5 C6
Average CGPA obtained in University in Ekiti State
70
4.26 3.50 3.49 3.51 2.90 2.22
Average CGPA obtained in University in Ondo State
51 3.75 3.20 3.35 3.50 3.90 2.21
In table 1, the grades obtained by final year 400 level education students in the two universities
at entry point in Mathematics and the CGPA obtained in the final year degree examination in educational management revealed that students in universities in Ekiti State outperformed the universities in Ondo State. The findings also revealed that the higher the credit grade point ob-tained by Educational Management students in Mathematics the higher the cumulative grade point average obtained by these students in the university. The graph depicting the credit level entry grade point of Educational Management students in Mathematics and their cumulative grade point Average (CGPA) in the two universities is shown in figure 1.
The graphical representation of the data on the credit Level Entry Grade Point in Mathematics and CGPA of Students in Educational Management in the two universities is shown in figure 1.
Figure 1: Bar Graph on Credit Level Entry Grade Point in Mathematics and CGPA of
Students in Educational Management in the two universities
00.51
1.52
2.53
3.54
4.5
A1 B2 B3 C4 C5 C6
CGPA
University in Ekiti state
University in Ondo
As indicated in figure 1, the graph slopes down from the highest CGPA to the lowest CGPA in
line with the highest entry credit grade point in Mathematics to the lowest credit grade point. This shows that Educational Management students in the two universities for students who had the highest CGPA in Educational management also had the highest credit grade point A1 while students who had the lowest CGPA in Educational Management equally had the lowest credit grade point of C6 in Mathematics. Although the cumulative grade point averages slopes down from the highest grade point average to the lowest, the cumulative grade point average for edu-cational Management students at the university in Ekiti State was higher than that of the univer-sity in Ondo State. This implies that more the number of Educational Management Students who obtained grades between A1 to B3 in Mathematics in the senior secondary certificate examina-tions the more the number of them who obtained higher cumulative grade point average of be-tween 4.0 and 4.50 in educational Management. The graph further shows that Educational Man-agement students who scored high credit grades A1 to B3 in Mathematics also scored high cu-mulative grade point average in Educational Management in the two universities while those who scored lower credit grades in Mathematics also scored lower cumulative grade point aver-

International Journal of Mainstream Social Science 1(1): Spring 2011
8
age in Educational management in the Universities. This suggests that a higher credit grade in Mathematics is a function of better performance in Educational Management in the University.
Question 2: Is there any significant relationship between the credit performance of Educa-tional Management students in Mathematics in the senior secondary certificate (SSC) examina-tions and their performance in Educational Management in Universities in Ekiti and Ondo States, Nigeria?
In answering this question, the following hypothesis was raised. Ho: There is no significant relationship between the credit performance of Educational Man-
agement students in Mathematics in the senior secondary certificate (SSC) examinations and their performance in Educational Management in Universities in Ekiti and Ondo States, Nigeria.
In testing this hypothesis, the Pearson r Product Moment Correlation Analysis was used. The data were tested at 0.05 alpha level. The results are presented in table 2.
Table 2: Correlation Between Credit in Mathematics and Cumulative Grade Point Av-
erage in Educational Management Variables N Mean SD df r-cal r-table University in Ekiti State 70
4.94
1.27
119 .697 .1946
University in Ondo State 51 2.88 8.62 p<0.05
In table 2, the calculated r (.697) was greater than the table r (.1946). Hence, the null hypothe-sis was rejected. This shows that there was a significant relationship between the entry grade point average of credit in Mathematics of Educational Management students and their perfor-mance measured by the cumulative grade point average (CGPA) in Educational Management in the universities in Ekiti and Ondo States, Nigeria. The r-value of 0.697 implies a strong relation-ship between the two variables, entry grade point at credit level and cumulative grade point aver-age (CGPA) in Educational Management.
Question 3: Is there any significant difference in the entry grade point of credit in Mathemat-ics for Educational Management students between the universities in Ekiti and Ondo States, Ni-geria?
In addressing this problem, the question was transformed to the following hypothesis. Ho: There is no significant difference in the entry grade point of credit in Mathematics for
Educational Management students between the universities in Ekiti and Ondo States, Nigeria. In testing the hypothesis, the t-test static was utilized. Data on the umber of the different cate-
gories of credit grades obtained by Educational Management students in universities in the res-pondents using the inventory. He data were processed and subjected to statistical analysis. The findings are presented in table 3.
Table 3: Entry Credit Grade Point in Mathematics for Educational Management
Students in Universities in Ekiti & Ondo State, Nigeria Variables N Mean Std Deviation df t-cal t-table University in Ondo State
70 51
5.03 4.82
1.15
119 .874 1.67
University in Ekiti State 51 4.82 1.42 p>0.05
In table 3, the t-calculated (.874) was less than the t-table (1.67). Hence, the null-hypothesis
was accepted. This indicates that there was no significant difference in the entry grades point of credit in Mathematics for Educational Management students in universities in the two States. The finding was substantiated by the mean value of 5.03 for Educational Management students at the

International Journal of Mainstream Social Science 1(1): Spring 2011
9
university in Ekiti State and 4.82 for educational management students in the university in Ondo State. This implies that the credit entry grade points for Educational Management students in Mathematics in universities in the two States were almost the same.
Question 4: Is there any significant difference in the performance of students (CGPA) in Edu-cational Management between the universities in Ekiti and Ondo States, Nigeria?
In addressing this problem, the question was transformed to the following hypothesis. Ho: There is no significant difference in the performance of students (CGPA) in Educational
Management between the universities in Ekiti and Ondo States, Nigeria. Testing this hypothesis, the t-test statistic was used. Data on the performance of Educational
Management students measured by the cumulative grade point average (CGPA) in Educational Management in the two universities were collected from the respondents using the inventory. The data were processed and subjected to statistical analysis. The findings are presented in table 4.
Table 4: CGPA in Educational Management in Universities in Ekiti & Ondo States, Nigeria
Variables N Mean Std Deviation df t-cal t-table University in Ekiti State
70
2.891
.879
119 .879 1.67
University in Ondo State 51 2.871 .847 p>0.05
In table 4, the t-calculated (.127) was less than the t-table (1.67). Hence, the hypothesis was ac-
cepted. This shows that there was no significant difference in the performance of students in Educational Management measured by the cumulative grade point average (CGPA) between the universities in Ekiti and Ondo States, Nigeria. This implies that the performance of students in Educational Management in the two universities was almost at the same level.
Question 5: Could the entry credit grades obtained by Educational Management students in Mathematics in senior secondary certificate examinations predict significantly the performance of final year 400 level students in Educational Management in universities in Ekiti and Ondo States, Nigeria?
In addressing this problem, the question was transformed into the following hypothesis. Ho: The entry credit grades obtained by Educational Management students in Mathematics in
senior secondary certificate examinations could not significantly predict their performance in Educational Management in universities in Ekiti and Ondo States, Nigeria.
In testing this hypothesis, data on the number of Educational Management students in the two universities who scored credit and above grades in Mathematics in the senior secondary certifi-cate examinations were collected from the respondents using the inventory. Data on the cumula-tive grade point average (CGPA) of Educational Management students in the universities were also collected. Correlation analysis was computed while a correlation matrix was derived show-ing correlation coefficients for the pair of variables. The findings are indicated in table 5.1.

International Journal of Mainstream Social Science 1(1): Spring 2011
10
Table 5.1: Correlation Matrix of Predictor Variable and Criterion Variable Variables N Entry Grade point at Credit level Cumulative Grade Point Aver-
age in Educational management University in
Ekiti State Entry Grade Point
at Credit level 70 1.00 -.78
Cumulative Grade Point Average in Edu-cational Management
70 -.78 1.00
University in Ondo State
Entry Grade Point at Credit level
51 1.00 -.622
Cumulative Grade Point Average in Edu-cational Management
51 -.622 1.00
University in Ekiti and Ondo States
Entry Grade Point at Credit level
121 1.00 -.697
Cumulative Grade point Average in Edu-cational Management
121 -.697 1.00
p<0.05
In table 5.1, the probability was less than 0.05. This shows that there was a significant relation-
ship between the credit grade point in Mathematics obtained by Educational management stu-dents and the cumulative grade point average (CGPA) in Educational Management in the univer-sities. The correlation matrix shows the correlation coefficients between the pair of variables.
Since the larger the value of ‘r’, the stronger the association between the two variables (Beren-son & Levine 1979), therefore, the large correlation coefficients between the pair of variable shows a strong association between the variables. In order to determine the inter-correlation among variables, linear regression analysis was conducted. The predictor variable was the entry credit grade point in mathematics while the criterion variable cumulative grade point average (CGPA) in Educational Management in the universities. The findings of the linear regression in-dicating the summary of the regression model are shown in table 5.2.
Table 5.2: Summary of Regression Model
R R Square Adjusted R
Square F Signif.
University in Ekiti State
.78 .604 .599 103.909 .000
University in Ondo State
.622 .387 .374 30.899 .000
Universities in Ekiti and Ondo States
.697 .488 .481 112.383 .000
In table 5.2, the R Square varied from one university to another. The R square for the universi-
ty in Ekiti was .604 while the R square for the university in Ondo State was .387. The overall R Square for the two universities was .488. Table 5.3 shows the output of the linear regression.

International Journal of Mainstream Social Science 1(1): Spring 2011
11
Table 5.3: Linear Regression Analysis of Predictor Variable with the Criterion Variable Cumulative Grade Point Average (CGPA) in Educational management in Ekiti State
Predictor Va-
riables B SE B Beta t Signf. T
University in Ekiti State
Entry Grade Point at Credit
Level in Ma-
thematics (Con-stant)
-.592 5.867
.058 .299
-.78 -10.194 19.593
.000 .000
University in Ondo State
Entry Grade Point at Credit
Level in Ma-thematics (Con-stant)
-.370 4.655
.067 .355
-.622 -5.559 13.916
.000 .000
University in Ekiti and Ondo States
Entry Grade Point at Credit
Level in Ma-thematics (con-stant)
-.472 5.214
.045 .227
-.697 -10.601 22.961
.000 .000
In table 5.3, the regression equation derivable for the university in Ekiti State is Y = 5.867 + -.592 (Entry Grade Point at Credit Level in
Mathematics) The regression equation derivable for the university in Ondo State is Y = 4.655 + -.370 (Entry Grade Point at Credit Level). The regression equation derivable for the two universities in Ekiti and Ondo States is Y = 5.214 + -.472 (Entry Grade Point at Credit Level). In tables 4.3, the variable entry grade point at credit level in Mathematics entered the regres-
sion equation at 0.05 level of significance indicating that the variable, entry credit grade point in Mathematics, significantly predicted the performance of students in Educational Management in the universities. It contributed 59.2% of the variance to the criterion variable in respect of the university in Ekiti State and 37% of the variance to the criterion variable in respect of the univer-sity in Ondo State. It also contributed 47.2% of the variance to the criterion variable in respect of the universities in the two states put together. This shows that the entry credit grade point in Ma-thematics is a good predictor of performance of students in Educational Management in the uni-versities in the two States.
Discussion The foregoing has shown the analysis of data for this study. The predictive strength of credit
grades in Mathematics in the senior secondary certificate (SSC) examinations in predicting per-formance in Educational Management in universities in Ekiti and Ondo States, Nigeria was ex-amined. The finding of the study revealed that there was a significant relationship between the entry grade point average of credit in Mathematics of Educational Management students and their performance measured by the cumulative grade point average (CGPA) in Educational Man-agement in the universities in Ekiti and Ondo States, Nigeria. This shows that the higher the cre-dit grade point obtained by Educational Management students in Mathematics the higher the cu-mulative grade point average obtained by these students in the University. The high CGPA ob-tained by Educational Management students who obtained the highest credit grade points of A1 and B3 agreed with the findings made by Ubokobong (1993) that students with high number of credits in Nigerian secondary school examinations performed well in higher institutions. The

International Journal of Mainstream Social Science 1(1): Spring 2011
12
findings also agreed with those of other researchers (Ojerinde, 1974; Alonge, 1883; Othuon & Kishor, 1994; Afolabi, 2002). This finding suggests that the higher the credit grade point ob-tained by students in Mathematics, the higher the cumulative grade point average in Educational management.
The finding of no significant difference in the entry grade point of credit in Mathematics for Educational Management students in universities in the two States implies that the entry grade points for Educational Management students in Mathematics in the two universities were almost the same. This finding was consistent with the findings made by other researcher (Asaolu, 2003, Oluwatayo, 2003).
The findings indicating no significant difference in the performance of students in Educational Management as measured by the cumulative grade point average (CGPA) between the universi-ties in Ekiti, and Ondo States, Nigeria implies that the performance of students in Educational Management in the two universities was almost at the same level. This finding suggests that the high entry credit grade point in Mathematics might have perhaps influenced better performance of the students in both universities in Educational Management. This finding agreed with the findings made by previous researchers (Adeyemo, 2001; Adelugba, 2003).
The correlation matrix on the relationship between the credit grade point in Mathematics ob-tained by Educational management students and the cumulative grade point average (CGPA) in Educational Management in the universities tend to buttress earlier findings. It shows large cor-relation coefficient between the pair of variables indicating a strong relationship between the two variables. This finding was consistent with the findings made by other researchers (Adeyemi, 1998; Oderinde, 2003).
The finding indicating that entry credit grades obtained by Educational Management students in Mathematics in senior secondary certificate examinations was a significant predictor of suc-cess in Educational Management in the two universities was in consonance with those of pre-vious researchers (Itsuokor 1994; Peers & Johnston, 1994; Al-Sharayye, 1995; Owoyemi, 2000). The high contribution of the predictor variable, entry credit grade point in Mathematics to signif-icantly predicted their performance in Educational Management in the universities. This finding was in consonance with the findings made by previous researcher. (Durotoluwa, 2000; Omonijo 2001). The findings were however at variance with the findings made by other researchers (O’Rourke, Martin & Hurley, 1989; Afolabi & Adewolu, 1998). This suggests that the further research in this area of study.
Conclusion Considering the findings of this study, it is concluded that the entry credit grades obtained by
Educational Management students in Mathematics in senior secondary certificate examinations was a significant predictor of success in Educational Management in universities in Ekiti and Ondo States, Nigeria. Evidences from the findings also led the researcher to conclude that credit in Mathematics is a critical variable in terms of better performance in Educational Management in the universities.
Based on the findings of the study, it is recommended that more emphasis should be given to the teaching of Mathematics in secondary schools in the two states should endeavour to recruit more specialist teachers in Mathematics into schools. The Ministry of Education in each of the two states should intensify more efforts in conducting regular inspection of schools to ensure that effective teaching mathematics and other subjects in schools’ curriculum in a bid to achieve the

International Journal of Mainstream Social Science 1(1): Spring 2011
13
objectives of the National Policy on Education (FGN, 2004), which include the preparation of students for higher education. References Adekunle Ajasin University (2004) Handbook 2004/2005 Akungba: Adekunle Ajasin University Akungba-Akoko,
Nigeria. Adelugba, O.O. (2003) “Students’ performance in junior secondary school certificate examinations as predictor of
performance in senior school certificate examinations in Ekiti State, Nigeria”. Unpublished M.Ed Thesis, univer-sity of Ado-Ekiti; Nigeria, 68-70.
Adesina, S. (1977): Planning and educational development in Nigeria Lagos: The Academic Press, 24-129. Adeyemi, T.O. (1998): School and teachers variables associated with the performance of students in the senior sec-
ondary certificate examinations in Ondo-State, Nigeria. Unpublished PhD Thesis, University of Hull, UK, 203-208.
Adeyemo, G.A. (2001): Teacher and student variables as correlates of achievement in Integrated Science in Ibadan North Local Government Area of Oyo State Unpublished M.Ed Thesis, Faculty of Education, University of Ado-Ekiti; Nigeria , 40-45.
Afolabi, B.T. (2002): Comparative analysis of continuous assessment in Mathematics among secondary schools in Ekiti State, Nigeria; Unpublished M.Ed Thesis, Faculty of Education, University of Ado-Ekiti; Nigeria, 72-82.
Afolabi, E.R. & Adewolu, B.A.(1998): “The predictive validity of Osun State Junior Secondary School Examina-tion, Nigerian Journal of Social and Educational Research 1 (1); 35-42.
Aghenta, J.A. (1981): The Economics of Teacher Education: The Case of the B.Ed Degree in Nigeria” Journal of Educational Research Association (JNERA), 2, (1) 27-34.
Alonge, M.F. (1983) The predictive validity of mock Mathematics examinations in West African School Certificate examinations in Ondo State, Nigeria, Unpublished M.Ed thesis, Faculty of Education, University of Ile, Ile-Ife.
Alonge, M.F. (1998): Implications of probabilistic models of item analysis to educational evaluation, Journal of Educational Research, (2) 50-56.
Al-Shorayye, S.R. (1995) The effect of admissions policy, socio-economic factors, and demographic and personal considerations on students’ performance at Kuwait University. Unpublished PhD Thesis, University of Hull UK, 142-145.
Anderson G. (1998): With Nancy Arsenaut Fundamentals of educational research, London: Falmer Press Taylor & Francis Inc, 12-13, 110-152.
Asaolu, A.G. (2003): Predictive validity of JSC mathematics examinations on the performance of students in science subjects in Ekiti State secondary schools, unpublished M.Ed Thesis, Faculty of Education, University of Ado-Ekiti; Nigeria, 50-76.
Bandele, S.O. (1985): Predicting success in Mathematics in the JSS of the 6-3-3-4 system in Ijero Local Govern-ment Area of Ondo-State, Nigeria Unpublished M.Ed Thesis, Faculty of Education, University of Ibadan, Nige-ria.
Berenson, M.L. & Levine, D.M. (1979) Basic business statistics: Concepts and applications London: Prentice/Hall International Inc, 325-387, 401-464, 492-515.
Daniels, M. & Schouten, J. (1970): Education in Europe: the screening of students, problems of assessment and pre-diction of academic performance council for cultural cooperation of the council of Europe. London: George Har-rap Co. Ltd, 65.
Dockery, K.A. (1986) The effects of IQ, Sex and School Entrance Age on the Achievement and Self Esteem of Ten-to-Eleven Year old students’ Unpublished Ph.D Thesis, Temple University USA. Dissertation Abstracts on CD Rom. Order No AAC 8611836.
Durotoluwa, J.O. (2000) “Predictive validity of JSS certificate examinations in mathematics: A case study of Owo Local Government Area”. Educational Though, Journal of Faculty of Education, Ondo State University, Akung-ba-Akoko 1 (1) 30-34.
Entwistle N J & Wilson J D (1977): Degrees of Excellence: The Academic Achievement Game London: Hodder and Stoughton, pp. 3; 10-12, 19.
Eysenck, H. (1995): Clever Measures” The times Higher Education Supplement 1160. January 27;15. Fafunwa, B. (1974): History of Education in Nigeria London: George Allen & Unwin, 193. FGN (2004) National Policy on education, NERDC Yaba, Lagos 7, 44-45. Gay, L.R. (1996) Educational research; competencies for analysis and application; Upper Saddle River, New Jersey:
Merrill, Prentice-Hall Inc, 249-305.

International Journal of Mainstream Social Science 1(1): Spring 2011
14
Henry, S.M. & Adams, J.F. (1988): Academic Achievers: Predicting participation in honours programs. Paper pre-sented at the meeting of the Southeastern Psychological Association, New Orleans, LA.
Hunter, J.T. (1984): “Selected Variables as Predictors of Achievement in General Biology Courses at Xavier Uni-versity of Louisiana”. Unpublished PhD Thesis, The University of Southern Mississippi USA. Dissertation Ab-stracts on CD Rom. Order No. AAC 8518324.
Itsuokor, D.E. (1994): “Performance of Nigerian Students in Two Group Intelligence Test with Different Cultural Backgrounds” Studies in Educational Evaluation Vol. 20, p. 199.
JAMB (2002) JAMB Brochure, Abuja: Joint Admission and Matriculation Examinations, 2. O’Rourke, B. Martin, M.O. & Hurley, J.F. (1989): “The scholastic aptitude Test as a Predictor of third-level aca-
demic performance” The Irish Journal of Education XXIII, (1), 22-35. Oderinde, B.B. (2003)” “Examinations and students performance” Vanguard 19 (5167), Thursday, January 16; 30. Ojerinde, A (1974) “Prediction of academic success in school certificate examination from the national common
entrance examination scores” Unpublished M.Ed Dissertation, Faculty of Education, University of Ife, Ile-Ife, Ni-geria.
Oluwatayo, J.A. (2003): “Mode of entry and performance of Nigerian universities undergraduates in science courses”. Unpublished PhD thesis, University of Ado-Ekiti, Nigeria. 63, 147-165.
Omonijo, A.R. (2001): “Junior secondary certificate results in integrated science as a predictor of performance in science and mathematics in the senior secondary certificate examinations”. Unpublished M.Ed Thesis, University of Ado-Ekiti, Nigeria 79-82.
Othuon, L & Kishor, N (1994) Hierarchical linear modeling of predictive validity: The case of Kenya certificate of primary education examination, studies in Educational Evaluation 20, 5-190.
Owoyemi, N. (2000) Moderation and standardization of continuous and terminal assessment scores in junior sec-ondary certificate examination and primary school leaving certificate assessment paper delivered at the senior staff seminar, Ministry of Education, Ado 2nd March, 2.
Peers, I.S. & Johnston, M. (1994): Influence of learning context on the relationship between A – level attainment and final degree performance: A meta analytical review British Journal of Educational Psychology 64, 1-15.
Salami, A. (1992): “Raising the standard of performance in public examination” Paper presented at the WAEC symposium held at the University of Ibadan, Nigeria 24th April, 1-3.
Ubokobong, H.E. (1993) Predicting educational performance at tertiary level on the basis of Ado-Ekiti; Nigeria. WAEC (2002): “Standards in subjects: West African School Certificate” Lagos: West African Examinations Coun-
cil Yaba, Nigeria. December; 2-10. Wankowsiki, J.A. (1973): Temperament, Motivation and Academic Achievement: Studies of Success and Failure of
a Random Sample of Students in One University Birmingham: Educational Survey Unit, University of Birming-ham, 131-132.

International Journal of Mainstream Social Science 1(1): Spring 2011
15
Employee Engagement: A Canvas of Empirical Studies
D. Pradeep Kumar Professor, Madanapalle Institute of Technology & Science, Andhra Pradesh, India
E-mail: [email protected]
G. Swetha Assistant Professor, S.V.College of Engineering, Andhra Pradesh, India
E-mail: [email protected]
Abstract: Engaging employees is one of the top five most important challenges for management, according to a survey of 656 chief executive officers (CEOs) from countries around the world (Wah 1999). Employee engagement has become a hot topic in recent years among consulting firms and in the popular business press. Employee en-gagement is defined as “the extent to which employees commit to something or someone in their organization, how hard they work and how long they stay as a result of that commitment.” Models of employee engagement help in understanding the factors, which have an influence on employee engagement and can predict it, and also to identify the consequences of the phenomenon. Various consultants, researchers, academicians and organizations have stu-dies several factors and their impact on employee engagement. These studies are of great interest who pursue re-search on employee engagement and who want to enhance employee engagement in their respective organiza-tions/institutions. The objective of this paper is to examine the current state of knowledge about engagement at work through a review of the literature. The authors through this paper offer a comprehensive review of the empiri-cal findings that are available to date. Keywords: Employee Engagement, Models, Review of Literature, Empirical Studies, Job Satisfaction, Organiza-tional Commitment, Burnout, Performance
Introduction In today’s competitive economy, a new philosophy has landed on manager’s discussion list -
“Employee Engagement”. Enlightened managers realize that the level of engagement in their or-ganizations is a critical component of their business success. Engagement can affect many as-pects of the Human capital portion of the success equation; such as productivity, turnover and commitment. The concept of ‘employee engagement’ is rapidly gaining popularity and use in the workplace. Employee engagement is also increasingly being examined in the literature, as re-searchers struggle to catch up with its wave of popularity in the corporate world. Engagement may be a global construct as it appears to be a combination of job satisfaction, organizational commitment and intention to stay. Within the U.S workforce, Gallup organization‘s Gallup Workplace Audit (1992-99) estimates this to cost more than $300 billion in lost productivity alone. Gallup‘s engagement ratio is a macro-level indicator of an organization‘s health that al-lows executives to track the proportion of engaged to actively disengaged employees. The aver-age working population ratio of engaged to actively disengaged employees is near 2:1. Engaging employees requires a year-round focus on changing behaviors, processes, and systems to antic-ipate and respond to an organization‘s needs. High levels of employee engagement occur when employees are involved with, committed to, enthusiastic, and passionate about their work
Models of Employee Engagement: It was highlighted that from an employer’s point of view, engagement is often about employees
‘going the extra mile’ or exerting ‘discretionary effort’. It was also found that many of the fac-tors that drive engagement are under the control of the organization. However, employees will place different emphasis on the extent to which they value each of these factors in exchange for

International Journal of Mainstream Social Science 1(1): Spring 2011
16
their discretionary effort. The models of engagement determine what the key drivers of engage-ment are, and the extent to which employees value these, and what employees find connects them to the organization, motivates them to perform above and beyond expectations and compels them to actively promote the interests and objectives of the organization. There are different Models of employee engagement i:e; Kahn’s model of engagement, The Job Demand Resources model of work engagement, The model of the antecedents and consequences of employee en-gagement, Gallup Model of Engagement etc.
Literature Review The literature review has revealed that employee engagement has been conceptualized in many
different ways. There is no single agreed definition and research has shown that, however en-gagement is defined; it is a multi-faceted construct (Kahn, 1990). Research has also suggested a connection between employee engagement and business results, e.g. the Gallup Organization cite numerous examples of increased corporate profitability due to increased employee engagement. There is clear evidence in the psychological literature of the effect of individual differences on work performance. Personal relationships have also been found to impact work engagement. Demographic factors alone cannot predict an individual’s propensity to be engaged. More signif-icant here is the way in which people are managed. Management style, employee voice and job design impact on people’s level of engagement, regardless of demographic variables. Engaged employees were found to be almost three times more likely to feel their work lives positively af-fected their physical health than those employees who were actively disengaged, although the causal relationship between engagement and wellbeing is unclear. It has been argued that em-ployee engagement is only meaningful if there is a more genuine sharing of responsibility be-tween management and employees over issues of substance (Purcell et al 2003)
Review of Empirical Studies The objective of this paper is to examine the current state of knowledge about engagement at
work through a review of the literature. However, this paper offers a comprehensive review of the empirical findings that are available to date. This literature survey examined peer-reviewed journal articles, working papers, textbooks, and other published resources relevant to employee engagement. Articles were found through the search facility of on-line journal databases. Results from research organizations and corporate results have demonstrated there may be a strong link between engagement, employee performance and business outcomes.
Wilmar B.Schaufeli, Marisa Salanova, Vicente Gonzalez-Roma and Arnold.B.Bakker in their study on “The Measurement of Engagement and Burnout: A Two Sample Confirmatory factor analytic Approach1” in the year 2002 examined the factorial structure of a new instrument to measure engagement. The hypothesized ’opposite’ of burnout is conducted in a sample of univer-sity students (N=314) and employees (N=619). In addition, the factorial structure of the Maslach-Burnout Inventory-General Survey (MBI-GS) is assessed and the relationship between engage-ment and burnout is examined. Simultaneous confirmatory factor analyses in both samples con-firmed the original three-factor structure of the MBI-GS (exhaustion, cynicism and professional efficacy) as well as the hypothesized three factor structure of engagement(vigor, dedication, and absorption). Contrary to expectations, a model with two higher-order factors-‘burnout’ and ‘en-gagement’ did not show a superior fit to the data. Instead, the analysis revealed an alternative model with two latent factors including: (1) exhaustion and cynicism (‘core of burnout’); (2) all three engagement scales plus efficacy. Both latent factors are negatively related and share be-

International Journal of Mainstream Social Science 1(1): Spring 2011
17
tween 22% and 38% of their variances in both samples. Despite the fact that slightly different ver-sions of the MBI-GS and the engagement questionnaire had to be used in both samples the results were remarkably similar across samples.
Arnold B. Bakker, Evangelia Demerouti, and Willem Verbeke in their study on “Using The Job Demands-Resources Model to Predict Burnout and Performance2” in the year 2004 identified the job demands-resources (JD-R) model. It was used to examine the relationship between job characteristics, burnout, and (other-ratings of) performance (N_146). It is hypothesized that job demands (e.g., work pressure and emotional demands) would be the most important antecedents of the exhaustion component of burnout, which, in turn, would predict in-role performance (hy-pothesis 1). In contrast, job resources (e.g., autonomy and social support) were hypothesized to be the most important predictors of extra-role performance, through their relationship with the disengagement component of burnout (hypothesis 2). In addition, it is predicted that job re-sources would buffer the relationship between job demands and exhaustion (hypothesis 3), and that exhaustion would be positively related to disengagement (hypothesis 4). The results of struc-tural equation modeling analyses provided strong support for hypotheses 1, 2, and 4, but rejected hypothesis 3. These findings support the JD-R model’s claim that job demands and job resources initiate two psychological processes, which eventually affect organizational outcomes.
Alan M. Saks and Joseph L. in their study on” Antecedents and Consequences of Employee Engagement3” in the year 2006 through a survey which was completed by 102 employees work-ing in a variety of jobs and organizations, presented the following findings. The average age was 34 and 60 percent were female. Participants had been in their current job for an average of four years, in their organization an average of five years, and had on average 12 years of work expe-rience. The survey included measures of job and organization engagement as well as the antece-dents and consequences of engagement. Results indicate that there is a meaningful difference between job and organization engagements and that perceived organizational support predicts both job and organization engagement; job characteristics predicts job engagement; and proce-dural justice predicts organization engagement. In addition, job and organization engagement mediated the relationships between the antecedents and job satisfaction, organizational commit-ment, intentions to quit, and organizational citizenship behavior.
Wilmar B. Schaufeli and Arnold B. Bakker in their study on “ The Measurement of Work Engagement With a Short Questionnaire4” in the year 2006 reports on the development of a short questionnaire to measure work engagement – a positive work-related state of fulfillment that is characterized by vigor, dedication, and absorption. Data were collected in 10 different countries (N = 14,521), and results indicated that the original 17-item Utrecht Work Engagement Scale (UWES) can be shortened to 9 items (UWES-9). The factorial validity of the UWES-9was dem-onstrated using confirmatory factor analyses, and the three scale scores have good internal con-sistency and test-retest reliability. Furthermore, a two-factor model with a reduced Burnout fac-tor (including exhaustion and cynicism) and an expanded Engagement factor (including vigor, dedication, absorption, and professional efficacy) fit best to the data. These results confirm that work engagement may be conceived as the positive antipode of burnout. It is concluded that the UWES-9 scores has acceptable psychometric properties and that the instrument can be used in studies on positive organizational behavior.
Vicente Gonza´lez-Roma´, Wilmar B. Schaufeli , Arnold B. Bakker , Susana Lloret in their study on “Burnout and work engagement: Independent factors or opposite poles?5” in the year 2006 identified that Burnout researchers have proposed that the conceptual opposites of emo-tional exhaustion and cynicism (the core dimensions of burnout) are vigor and dedication (the

International Journal of Mainstream Social Science 1(1): Spring 2011
18
core dimensions of engagement), respectively (Maslach & Leiter6, 1997; Schaufeli, Salanova, Gonza´lez-Roma´, & Bakker7, 2002). It is tested this proposition by ascertaining whether two sets of items, exhaustion–vigor and cynicism–dedication, were scalable on two distinct underly-ing bipolar dimensions (i.e., energy and identification, respectively). The results obtained by means of the non-parametric Mokken scaling method in three different samples (Ns = 477, 507, and 381) supported our proposal: The core burnout and engagement dimensions can be seen as opposites of each other along two distinct bipolar dimensions dubbed energy and identification.
The aim of the study was to ascertain whether items measuring opposite burnout and engage-ment dimensions (i.e., exhaustion–vigor and cynicism–dedication) were scalable on a single un-derlying bipolar dimension. It showed that the bivariate distributions of responses for pairs of exhaustion–vigor and cynicism – dedication items did not show the diagonal form characteristic of a linear relationship. Instead, the observed distributions approached a roughly triangular shape. Thus, the linearity assumption of principal components analysis cannot be maintained, and, consequently, this method is inadequate for analyzing the underlying structure of sets of ex-haustion–vigor and cynicism–dedication items. It showed that when this method is used with this purpose anyway, two components emerge, instead of a single, bipolar one. By using the Mokken scaling method (Mokken8, 1971; Molenaar91982, Molenaar101991), a method that does not as-sume linear relationships among items, it showed that exhaustion and vigor items were scalable on a single underlying bipolar dimension labeled energy, whereas cynicism and dedication items were also scalable on a single, bipolar dimension labeled identification.
The study yields empirical evidence supporting this conceptualization of the core burnout and engagement dimensions as conceptual opposites that define two distinct underlying bipolar di-mensions dubbed energy and identification.
Saar Langelaan , Arnold B. Bakker ,Lorenz J.P. van Doornen, Wilmar B. Schaufeli in their study on “Burnout and work engagement: Do individual differences make a difference?11” in the year 2006 identified that among 572 Dutch employees whether burnout and its positive antipode – work engagement—could be differentiated on the basis of personality and temperament. It ex-pected burnout to be characterized by high neuroticism and low extraversion, and engagement by low neuroticism and high extraversion. Additionally, it predicted that burnout would correlate negatively with the temperament traits (strength of excitation, strength of inhibition, and mobili-ty), whereas work engagement would correlate positively. Discriminant analyses were used to distinguish burned-out and engaged employees from their non-burned-out and non-engaged counterparts, respectively. Results showed that high neuroticism is the core characteristic of bur-nout, whereas work engagement is characterized by low neuroticism in combination with high extraversion and high levels of mobility. Thus, personality and temperament make a difference as far as burnout and work engagement are concerned.
Ulrika E. Hallberg and Wilmar B. Schaufeli in their study on “Same Same” But different? Can work engagement be discriminated from job involvement and organizational commitment12? in the year 2006 investigates whether work engagement (measured by the Utrecht Work Engage-ment Scale; UWES) could be empirically separated from Job Involvement and Organizational Commitment. In addition, psychometric properties of the Swedish UWES were investigated. Dis-criminant validity of the UWES was tested through inspection of latent intercorrelations between the constructs, confirmatory factor analyses, and patterns of correlations with other constructs (health complaints, job and personal factors and turnover intentions). In a sample of Information Communication Technology Consultants (N=186). Work Engagement, Job Involvement, and Or-ganisational Commitment are empirically distinct constructs and, thus, reflect different aspects of

International Journal of Mainstream Social Science 1(1): Spring 2011
19
work engagement. The internal consistency of the Swedish UWES was Satisfactory, but the di-mensionality was somewhat unclear.
Nancy R. Lockwood in her “Leveraging Employee Engagement for Competitive Advan-tage: HR’s Strategic Role13”in the year 2007 identified, according to 2006 report on SHRM Special Expertise Panel trends, demographic changes are leading to increased diversity in the global labor market. The shift from mainstream and emerging markets to a multicultural majority is, in turn, leading to changes in HR business practices, such as the design of recruitment, bene-fits, training, motivation and rewards systems14. The global drivers for engagement are leader-ship, work/life balance, branding and opportunities to use employee talent. A study by Mercer, for example, found that companies with a high profile or good employer brand in China appeared to have more success attracting candidates15.
A recent global workforce study by Towers Perrin considered key success factors of employee engagement, job satisfaction and high performance. It surveyed 86,000 employees at all levels of the organization in mid-size and large companies in 16 countries across four continents about attitudes, needs, work ethic and personal commitment of people to their jobs and companies. The findings reveal that people tend to stay with organizations considered as “talent-friendly” and progressive – that is, organizations that have leading-edge work environments and people prac-tices.16
To illustrate the myriad of different drivers in different countries, for example, consider these top attraction drivers: in Canada-competitive base pay, work/life balance and career advance-ment opportunities; in India– focus on the reputation of the organization as a good employer; in the United States– competitive health benefits; in Germany– the level of autonomy; in Japan– the caliber of co-workers; and in the Netherlands– the collaborative environment. These differences suggest that each country and/or culture has certain factors seen as important in the workplace.17
Research shows that the connection between an employee’s job and organizational strategy, in-cluding understanding how important the job is to the firm’s success, is the most important driver of employee engagement. In fact, employees with the highest levels of commitment perform 20% better and are 87% less likely to leave the organization, which indicates that engagement is linked to organizational performance.17 In contrast, job satisfaction– a term sometimes used in-terchangeably with employee engagement– is defined as how an employee feels about his or her job, work environment, pay, benefits, etc.18
Feeling Good Matters in the Workplace19 According to this Gallup Management Journal study, supervisors play a critical role in worker
well-being and engagement. The survey considers how employee perceptions of happiness and well-being affect job performance. Happy and engaged employees are better equipped to handle stress and change, are much more likely to have a positive relationship with their manager, feel more valued by their employer and are more satisfied with their lives. People with higher levels of engagement appear to substantially enjoy more positive interactions with co-workers than do their less-engaged counterparts. The study suggests that organizations can boost firm productivi-ty if they recognize these issues and help employees improve their well being.
Driving Performance and Retention Through Employee Engagement20 In a global survey of the engagement levels of 50,000 employees in 27 countries, research by
the Corporate Leadership Council emphasizes the link of engagement to business success and its direct impact on employee performance and retention. Organizations that have a highly engaged workforce were found to have almost 10 times as many committed, high-effort workers as those

International Journal of Mainstream Social Science 1(1): Spring 2011
20
with a low-engaged workforce. The findings point to the manager as the most important enabler of employee commitment to the organization, job and work teams.
Employee Engagement Report 200621 Building on research from 2004 and 2005, this study examines how employees in North Amer-
ica, Europe and Asia-Pacific feel about their organizations and jobs. The top reason people stay is for fulfilling work (44%). The findings also reveal that 35% of employees are likely at risk of leaving their organizations. Top reasons include career, the work itself and the manager. Interes-tingly, only 38% of employees had seen visible actions to increase employee engagement. More than 30% are considering leaving, and only 12% of employees intend to stay.
Determined by company mission and culture, proactive and best outcome practices around em-ployee engagement vary for each organization. Below are recommended strategic actions for HR to strengthen engagement.
• Clearly and consistently communicate organizational goals and objectives. • Establish policies and practices that promote a workplace culture that stimulates
employee engagement. • Align organizational goals to day-to-day work. • Maintain an open dialogue among senior management, managers and employees. • Reward managers whose behavior fosters employee engagement. • Listen carefully to what employees want and need. • Provide opportunities and challenges to leverage the respective talents of em-
ployees. • Do a pulse check—are employees engaged? Find out what is working and what is
not. • Hold managers accountable for demonstrating organizational values, development
of team members and results. • Be sure that employees know how they can contribute. • Genuinely thank employees for their contributions.
Scottish Executive Social Research in their study on “Employee Engagement in the Public Sec-tor22” identified the above.
CIPD23 (2006c) in a national survey of 2,000 UK employees found the following: • Hours worked – There are no differences between the public and private sectors
in terms of hours worked. However, public sector workers are more likely to receive some compensation for working extra hours than those in the private sector; • Work-life balance – One would have expected that public sector workers would
be receiving more help from their employer to achieve a good work-life balance, but ac-tually there is no difference; • Employer negatives – public sector employees are more negative about their em-
ployers than their private sector counterparts, reporting that: o They experience more bullying and harassment than those in the private sector o They are less satisfied with the opportunities they have to use their abilities o They are more stressed and under more pressure o They are more critical of their organization o They are less likely to feel their senior managers have a clear vision for the organ-
ization o They have less trust and confidence in their senior managers; and o They are also less likely to believe organizational communication.

International Journal of Mainstream Social Science 1(1): Spring 2011
21
• Job positives – The public sector ethos is reflected in the fact that more public sector workers find their work worthwhile and personally meaningful. • Individual/employee performance outcomes – Public sector workers rate their
own performance lower than private sector employees and are more likely to have taken more sick leaves.
The Ipsos MORI24 (2006) research highlights other areas in which public sector staff is usually more critical than their private sector counterparts:
• Receiving recognition for good performance and providing opportunities for em-ployees to let the organization know how they feel about things that affect them in their work • Having adequate /sufficient facilities or resources to do their work effectively • The belief that their organization puts customers first • Confidence that they are working for a successful organization.
As a consequence, the public sector tends to trail the private sector in core areas that can lead to enhance employee engagement, such as clarity of direction, effective communication and management. The conclusion is that the public sector needs to concentrate more on how it man-ages change and develops leadership capability, to contribute to delivering the Public Sector Reform Agenda effectively.
The British Columbia public service received an engagement rating of 59 percent compared to 79 per cent for the top 50 companies to work for in Canada (Hewitt Associates: The 50 Best Companies to Work for in Canada, as cited in Office of the Auditor General of British Columbia 2002). In comparison to the leading private sector companies, British Columbia’s public service employees are relatively happy with their work, are just as committed to staying with their em-ployer, but due to a climate of distrust, a lack of confidence in their managers, and a feeling that the public hold a negative view of them as workers, they are not as proud of where they work. Only 43 per cent would highly recommend their department to a friend seeking employment, compared to 86 per cent in the comparison group. Again the public sector compares favorably in job content, but is weak in terms of organizational identity and advocacy amongst staff.
In general, public sector employees are more satisfied with their job characteristics, but are significantly less satisfied with key drivers of employee engagement compared to the private sec-tor. These weaknesses include lack of orientation to organizational objectives and lack of advo-cacy.
Results of US Gallup poll of employee engagement
Source: US Gallup results quoted in Meere (2005)25
Results of UK Gallup poll of employee engagement
Source: UK Gallup results quoted in Meere (2005)25

International Journal of Mainstream Social Science 1(1): Spring 2011
22
The survey evidence tells us that the majority of the workforce in leading western economies is not engaged;
• Engaged employees perform 20% better (CLC 2004)26; • Organizations with disengaged employees underperform against organizations
with engaged employees (Meere 2005), with the costs of disengagement through lost productivity costing US businesses up to $343bn annually (Gallup results discussed in Melcrum Publishing27 2005); • 70% of engaged employees have a good understanding of how to meet customer
needs as opposed to only 17% of disengaged employees (Right Management 2006)28; • Organizations not only lose key personnel by failing to engage them but they can
also be harboring a large body of unproductive disengaged staff who have no intention of leaving; • Employers who achieve meaning at work for their employees can expect in-
creased motivation, pride and productivity; • Engaged employees are more likely to advocate the organization as a place to
work and actively promote its products and service S. Rothmann and J.H.M. Joubert in their study on “Job demands, job resources, burnout and
work engagement of managers at a platinum mine in the North West Province29” in the year 2007 investigate the relationships between job demands, job resources, burnout, and engagement of management staff at a platinum mine in the North West Province. A cross-sectional survey design was used. The study population (N = 310) consisted of managers at the platinum mine. The Maslach Burnout Inventory – General Survey, Utrecht Work Engagement Scale, and the Job Demands-Resources Scale were administered and the results revealed that exhaustion was pre-dicted by workload, job insecurity and a lack of resources, while cynicism was predicted by lack of organizational support and advancement opportunities. Vigor was predicted by organizational support. Dedication was predicted by organizational support and high workload. Engagement was predicted by organizational support.
Sandeep Kular, Mark Gatenby, Chris Rees, Emma Soane, Katie Truss in their study on “Em-ployee Engagement30”in the year 2008 identified that, research by the CIPD has repeatedly dem-onstrated the links between the way people are managed, employee attitudes and business per-formance (Purcell31 2006 and Truss et al32 2006). Moreover, engaged employees have been found to outperform their disengaged counterparts. However, recent research in the UK and other countries shows that there are more disengaged employees than there are engaged employ-ees in today’s organizations.
The Gallup Organisation33 (2004) found critical links between employee engagement, custom-er loyalty, business growth and profitability. It compared the scores of these variables among a sample of stores scoring in the top 25 per cent on employee engagement and customer loyalty with those in the bottom 25 per cent. Stores in the bottom 25 per cent significantly under-performed across three productivity measures: sales, customer complaints and turnover. Gallup cites numerous similar examples. The International Survey Research (ISR)34 team has similarly found encouraging evidence that organizations can only reach their full potential through emo-tionally engaging employees and customers (ISR 2005).
In an extension of the Gallup findings, Ott35 (2007) cites Gallup research, which found that higher workplace engagement predicts higher earnings per share (EPS) among publicly traded businesses. When compared with industry competitors at the company level, organizations with more than four engaged employees for every one actively disengaged, experienced 2.6 times
International Journal of Mainstream Social Science 1(1): Spring 2011
23
more growth in EPS than did organizations with a ratio of slightly less than one engaged worker for every one actively disengaged employee.
Gallup’s meta-analyses present strong evidence that highly engaged workgroups within com-panies outperform groups with lower employee engagement levels, and the recent findings rein-force these conclusions at the workgroup level. The meta-analysis study shows that top-quartile business units have 12 percent higher customer advocacy, 18 per cent higher productivity, and 12 per cent higher profitability than bottom-quartile business units. In contrast, bottom-quartile business units experience 31 per cent to 51 per cent more employee turnover and 62 per cent more accidents than those in the top quartile of workplace engagement. This research into EPS provides a degree of proof that employee engagement correlates to crucial business outcomes.
In 2005, a survey conducted in Thailand revealed only 12 per cent of Thailand’s employee population are ‘engaged’, 82 per cent are ‘actively disengaged’ and 6 per cent disengaged. Simi-lar Gallup studies have found the levels of engagement in Australia, China, Japan, New Zealand and Singapore to be 18 per cent, 12 per cent, 9 per cent, 17 per cent and 9 per cent respectively (Gallup 2004).
In 2004, International Survey Research (ISR), the international research consultancy, com-pleted a major survey into the nature and causes of employee engagement and how companies can improve engagement to enhance business performance. The survey was conducted across ten of the world’s largest economies - Australia, Brazil, Canada, France, Germany, Hong Kong, the Netherlands, Singapore, the UK and the USA, involving nearly 160,000 employees from across a broad spectrum of industries. The survey highlights large variations among the 10 countries in terms of employees’ overall commitment to, and involvement with their employers. For exam-ple, in Brazil and in the US, 75 per cent of employees were found to be engaged with their com-panies, whilst only 59 percent of French employees were engaged. The research demonstrates that one size does not fit all when it comes to motivating employees to engage with their compa-ny and work. For example, in Australia, Singapore, and Hong Kong, the extent to which compa-ny management is respected emerged as an influential determinant of engagement. In the UK and US, on the other hand, a more important factor was the degree to which organizations pro-vide long-term employment and career opportunities.
Evidence from the USA (Johnson 200436) indicates roughly half of all Americans in the work-force are not fully engaged or they are disengaged. Furthermore, a Global Workforce Survey conducted in 2005 by consultancy firm Towers Perrin found disconcerting findings, again in the USA (Seijts and Crim37 2006). The survey involved about 85,000 people who worked full-time for large and mid-sized firms; it found only 14 per cent of all employees worldwide were highly engaged in their job. The survey also indicated that on a country-by country basis, the percentag-es of highly engaged, moderately engaged, and actively disengaged employees varied considera-bly. Moreover, the results showed some interesting, perhaps counter-intuitive, findings. For ex-ample, Mexico and Brazil have the highest percentages of engaged employees, while Japan and Italy have the largest percentages of disengaged employees.
A useful comparison between a range of demographic segments, from job level (senior execu-tive, director/manager, supervisor/foreman, specialist/professional, non-management salaried and non-management hourly) to industry category (non-profit, high tech, heavy manufacturing, in-surance, pharmaceuticals, hospital and finance/banking) was carried out by researchers at Tow-ers Perrin (2003), who found a pattern across the segments. Each group had only a small group of highly engaged respondents, a slightly larger disengaged group, with the majority in the ‘moderately engaged group’.

International Journal of Mainstream Social Science 1(1): Spring 2011
24
However, in each case there was one exception to the pattern that is worth noting; senior ex-ecutives were found to be more highly engaged than any other group and were less likely to be disengaged. Cynics might suggest this may be linked to income level and, while this certainly emerged as important in this study, it was not the only contributory factor. More important were role characteristics, such as challenge, authority, autonomy, stimulation, access to information, resources and growth opportunities, that research has shown are linked to high levels of engage-ment. The lowest levels of engagement have been found among hourly workers, who arguably have the least control or influence over their jobs and work experience.
Truss et al (2006) found that group in the public sector had a more negative experience of work, they reported more bullying and harassment than those in the private sector, and were less satisfied with the opportunities they had to use their abilities. This reinforces the findings of pre-vious studies and underlines the scale of the challenge facing public sector managers in particu-lar, and the negative impact that bullying and harassment have on employees and their levels of engagement (Emmott38 2006).
Despoina Xanthopoulou, Arnold B. Bakker, Evangelia Demerouti, Wilmar B. Schaufeli in his study on “Reciprocal relationships between job resources, personal resources, and work engage-ment39” in the year 2008 examined longitudinal relationships between job resources, personal resources, and work engagement. On the basis of Conservation of Resources theory, they hy-pothesized that job resources, personal resources, and work engagement are reciprocal over time. The study was conducted among 163 employees, who were followed-up over a period of 18 months on average. Results of structural equation modeling analyses supported the hypotheses. Specifically, it found that T1 job and personal resources related positively to T2 work engage-ment. Additionally, T1 work engagement related positively to T2 job and personal resources. The model that fit best was the reciprocal model, which showed that not only resources and work engagement but also job and personal resources were mutually related. The findings support the assumption of Conservation of Resources theory that various types of resources and well-being evolve into a cycle that determines employees’ successful adaptation to their work environments.
According to HR Special Survey40 in the year 2008 identified the following. • Engagement by industry: With the exception of the government sector (which has
relatively low engagement levels in all countries), some high-tech industries (pharma, biotech) score low whereas some service-focused industries (retail, consumer products) score high. • Engagement by level: survey shows that people higher up in the organization ex-
perience higher engagement. However, there is a drop in engagement past the vice-president level. Engagement by gender: The survey reveals a large disparity between men and women: Men count 8 percent more fully engaged and 6 percent less disengaged than women. • Engagement by gender: The survey reveals a large disparity between men and
women: Men count 8 per cent more fully engaged and 6 percent less disengaged than women. • Factors influencing satisfaction: In the survey, respondents were asked to pick
one of eight factors that they believed would most influence their satisfaction at work. Career development opportunities and training (30 percent), more challenging work (20 percent), and more opportunities to do what I do best (19 percent) were the three factors at the top of Indian workers’ wish lists, consistent with the top three global demands.

International Journal of Mainstream Social Science 1(1): Spring 2011
25
• Factors influencing contribution: Respondents were asked to pick the single top item they believed would most influence their contribution at work. Again, the top three items for Indian workers match the top three global requests: Development opportunities and training (26 per cent); regular, specific feedback about how I’m doing (25 percent); and greater clarity about what the organization needs me to do and why (22 percent). • Retention: In 2008, HR executives in India continue to struggle with talent man-
agement issues, particularly retention. Yet, when asked the question, “Assuming you have a choice, do you plan to remain with your organization through 2008?”, 65.54 per cent said “yes”. Clearly, Indian employees expect opportunity and a chance to partake in the action • Heights of Engagement: People higher up in the organization expectedly show
higher levels of engagement, as they are closer to the centers of decision-making. • Indians Workers More Satisfied: Taking global figures into account, it can be said
that Indian workers are among the most focused and satisfied in the world. Slightly more than a third (34 per cent) of the employees in India are fully engaged while 13 percent of them are disengaged.
Mark Attridge in his study on “Measuring and Managing Employee Work Engagement: A Re-
view of the Research and Business Literature41” in the year 2009 provides a review of the litera-ture on employee engagement, based on studies from academic and business sources. Areas of focus include defining the concept of employee work engagement, how it is measured, how often it occurs, the costs of disengagement, the business benefits linked to positive engagement, and how workplaces can be changed to encourage engagement. The findings indicate that work en-gagement can be improved through adopting certain workplace behavioral health practices that address supervisory communication, job design, resource support, working conditions, corporate culture, and leadership style. Also featured are several case studies from employers who measure and use employee engagement data to improve their work culture, retain employees, and increase business financial success.
Prevalence of Work Engagement Recent studies by the Gallup Organization have determined that about 20% of U.S. employees
are disengaged, 54% are neutral about their work, and 26% are actively engaged (Fleming, Coffman, & Harter42, 2005). Towers Perrin has found a similar engagement profile in 2003 study, with 19% of U.S. workers categorized as disengaged, 54% as moderately engaged, and only 17% as highly engaged (Towers Perrin43, 2003). Similar findings were found in a more re-

International Journal of Mainstream Social Science 1(1): Spring 2011
26
cent study by consultants BlessingWhite44 (2008). Based on more than 3,000 employees in North America, this survey found that 19% of employees were disengaged, 52% were only moderately engaged, and 29% were fully engaged.
The Corporate Leadership Council45 (2002) conducted a study of the engagement levels of more than 50,000 employees at 59 global organizations. This study found that about 10% of em-ployees globally were fully disengaged and not committed to their organizations’ goals. The most comprehensive studies in this area were done by Towers Perrin in 2003, 200546, and 200747, with the results of this work forming the basis for a new book (Gebauer & Lowman48, 2009). The 2005 Towers Perrin survey used data collected from more than 85,000 employees from 16 countries. This study found that overall, 24% of employees worldwide were disengaged, 62% of employees were moderately engaged, and only 14% of employees were considered to be highly engaged (Towers Perrin, 2006). Other findings from this study showed a wide range be-tween geographic regions in the percentage of their workforce who were highly engaged, with Mexico (40%) and Brazil (31%) being on the high end, the Unites States (21%) and Canada (17%) in the middle, and Europe (11%) and Asia (7%) at the low end.
Another study of more than 10,000 employees in the United Kingdom, revealed that engage-ment levels differed depending on personal and job characteristics and with work experiences (Robinson et al49, 2004). Some of the key findings from the project included managers and ex-ecutives tend to have higher engagement levels than those in supporting roles; educated and highly skilled workers are more engaged but also tend to be more loyal to their profession than to the particular organization in which they practice their craft; engagement levels decline as length of service at the same organization increases; employees who have a personal development plan and who receive annual formal performance appraisals have significantly higher engagement le-vels than those who have not; and having an accident or an injury at work, or experiencing ha-rassment on the job, can significantly reduce engagement.
How Engagement affects Business Success Over the years, Gallup has estimated that disengaged employees cost U.S. companies between
$250 and $350 billion a year (Rath & Conchie50, 2009). Comparing highly engaged employees with less engaged workers provides some insights into how engagement affects business out-comes. The Towers Perrin (2006) study compared groups of highly engaged workers with groups of less engaged employees. Key findings of the comparisons show that: 84% of highly engaged employees believe that they can positively affect the quality of their company’s products, com-pared with 31% of the disengaged; 72% of highly engaged employees believe that they can posi-tively affect customer service, versus 27% of the disengaged; 68% of highly engaged employees believe that they can positively affect costs in their job or unit, versus 19% of the disengaged; 59% of highly engaged employees planned to stay with their current employer, compared with just 24% of the disengaged; and employees who are the most committed to the organization per-form 20% better on the job.
A Conference Board study on retirement issues (2005) found that many employees have work attitudes indicating various aspects of disengagement, including that 66% of workers do not identify with or feel motivated to drive their employer’s business goals, 40% of workers feel dis-connected from their employers, and 25% of employees are just ‘‘showing up to collect a pay-check.’’
According to a survey of almost 5,000 recent retirees conducted by the Employee Benefit Re-search Institute51 (2008), almost two-thirds of those who were dissatisfied with their job at the

International Journal of Mainstream Social Science 1(1): Spring 2011
27
time they made the decision to retire had felt that they were not valued by the company or that their work did not have long-term value as a significant contribution. In other words, employees who chose to retire had not been highly engaged in their work.
Wilmar B. Schaufeli, Arnold B. Bakker and Willem Van Rhenen in their study on “How changes in job demands and resources predict burnout, work engagement, and sickness absentee-ism52”in the year 2009 identified the longitudinal survey among 201 telecom managers supports the Job Demands- Resources (JD-R) model that postulates a health impairment process and a motivational process. As it was hypothesized, results of structural equation modeling analyses revealed that: (1) increases in job demands (i.e., overload, emotional demands, and work-home interference) and decreases in job resources (i.e., social support, autonomy, opportunities to learn, and feedback) predict burnout, (2) increases in job resources predict work engagement, and (3) burnout (positively) and engagement (negatively) predict registered sickness duration (‘‘involuntary’’ absence) and frequency (‘‘involuntary’’ absence), respectively. Finally, consis-tent with predictions results suggest a positive gain spiral: initial work engagement predicts an increase in job resources, which, in its turn, further increases work engagement.
Karen Wilson, Dr. Larry Kreuger in their study on “A Survey on Employee Engagement53” in the year 2009 examined the overall level of engagement for employees of a public rehabilitation service agency, and the extent to which demographic and work life variables such as gender, of-fice location, job title, and years of service contributed to their levels of engagement. Engage-ment was examined as a positive social work construct and was compared to the negative con-cept of burnout (Freeney, Y. & Tiernan, J54. 2006 & Schaufli, W. B. & Bakker, A. B55. 2004). A cross sectional internet survey was done on 308 employees of a state-wide rehabilitation agency located in the Midwest region of the United States, using a purposive non-probability sampling strategy. It queried respondents to collect data on their levels of engagement in aggregate and anonymous form. Analysis was conducted using t-tests and correlations. Results indicate no dif-ferences in engagement scores for males and females, for individuals working in rural versus ur-ban office environments, or for years of service in the agency. Participants who supervised at least one other person scored higher than individuals who did not supervise anyone.
HR Consultants, Inc in their study on “Strategically Align Your 2010 Workforce: Employee Engagement vs. Job Satisfaction56” in the year 2010 identified that Research consistently shows a positive correlation between employee engagement and organizational results. For example:
• J.C. Penney stores with top-quartile engagement scores generate 36% better oper-ating income than similar sized stores with bottom-quartile engagement scores57. • Employee engagement at double-digit growth companies exceeds engagement at
single-digit growth companies by over 20%58. • In a Fortune 100 manufacturing company, a low-engagement group averaged
5,658 quality errors (as measured by parts per million) while a high-engagement group averaged only 5259. • One study showed that in a group of companies with high employee engagement,
operating income improved by 19% over 12 months, while companies with low em-ployee engagement showed a 33% decline60. • Development Dimensions International (DDI) estimates that moving an organiza-
tion with 10,000 employees from low to high engagement can have an impact of over $ 42million.59

International Journal of Mainstream Social Science 1(1): Spring 2011
28
• According to "The State of Employee Engagement 2008," a documentation of over 7,500 survey participants worldwide, 53% of employees trust their organization's senior leaders, while 75% trust their own immediate managers61. • One survey showed that 38% of large organizations have a formal, dedicated en-
gagement program, while only 23% of small organizations do62. Toon W. Taris, Ilona van Beek and Wilmar B. Schaufeli in their study on “Why do perfection-
ists have a higher burnout risk than others? The mediational effect of workaholism”63 in the year 2010 identified that perfectionists have a higher burnout risk than others, but the mechanisms accounting for this association have rarely been examined. The study proposes that workaholism mediates this relation, as previous research revealed that (a) perfectionists are more likely to be workaholics than others, and (b) workaholics have a higher burnout risk than others. Using cross-sectional data from 199 Dutch managers, regression analyses revealed that holding high stan-dards towards oneself (a self-directed indicator of perfectionism) was unrelated to any of the three dimensions of the Maslach Burnout Inventory. However, high concern over making mis-takes in the face of others (representing socially prescribed perfectionism) was systematically associated with high levels of burnout and workaholism. Moreover, workaholism was positively associated with high levels of exhaustion. Subsequent mediation analysis revealed that the asso-ciation between (the socially prescribed aspect of) perfectionism and burnout (emotional exhaus-tion) was mediated by workaholism.
Practical implications As for the practical implications of the study, it is interesting to see that the effects of personal
characteristics (i.e., workaholism and perfectionism - concern over mistakes) on burnout were about as strong or even stronger than that of often-studied concepts such as job demands and job control (cf. De Lange et al64., 2003). Therefore, it would seem fair to say that the role of personal characteristics in the etiology of burnout has received less attention than would be warranted. Especially workaholism was a strong predictor of emotional exhaustion, suggesting that the first concept may be a good starting point for individual and organizational-level interventions. Un-fortunately, relatively little work has been done on the issue of the prevention of workaholism. Although several programs have been developed (see Seybold & Salomone65, 1994; Van Wijhe, Peeters & Schaufeli66, in press, for overviews), as yet the effectiveness of these interventions has not unequivocally been established.
In conclusion, the study provided evidence that the association between perfectionism and burnout is mediated by workaholism: perfectionists tend to be concerned over making mistakes in the face of others, which could lead to high effort expenditure to work (i.e., workaholism) and, in turn, high levels of emotional exhaustion/burnout.
Arnold B. Bakker and P. Matthijs Bal in his study on “Weekly work engagement and perfor-mance: A study among starting teachers67”in the year 2010 among 54 Dutch teachers tested a model of weekly work engagement. On the basis of theories about the motivational potential of job resources, it predicted that teachers’ weekly job resources are positively related to their week-levels of work engagement, and that week-level work engagement is predictive of week-level performance. In addition, it hypothesized that momentary work engagement has a positive, lagged effect on next week’s job resources. Teachers were asked to fill in a weekly questionnaire every Friday during 5 consecutive weeks. Results of multi-level analyses largely confirmed the hypotheses, by showing that week-levels of autonomy, exchange with the supervisor, and oppor-tunities for development (but not social support) were positively related to weekly engagement, which, in turn, was positively related to weekly job performance. Moreover, momentary work

International Journal of Mainstream Social Science 1(1): Spring 2011
29
engagement was positively related to job resources in the subsequent week. The findings show how intra-individual variability in employees’ experiences at work can explain weekly job per-formance.
The weekly study has shown that substantial variability exists in job resources, work engage-ment, and performance. The findings reveal that a resourceful work environment fosters teach-ers’ weekly work engagement, and can indirectly have a positive effect on job performance. Consequently, the mobilization of weekly job resources should be a significant component of individual interventions and HR training programs. This may imply a shift from ‘standard’ job (re)design and training programs to individual job (re)design and coaching. In such interventions, the work environment is optimized at the individual level, and coaching is tailored to individual needs. This can be done by using on-line human resource instruments (Bakker & Demerouti, 2007) that offer real-time and individualized feedback about one’s job resources and engage-ment.
Evangelia Demerouti, Karina Mostert, and Arnold B. Bakker in his study on Burnout and Work Engagement: A Thorough Investigation of the Independency of Both Constructs68” in the year 2010 among 528 South African employees working in the construction industry examined the dimensionality of burnout and work engagement, using the Maslach Burnout Inventory- General Survey, the Oldenburg Burnout Inventory, and the Utrecht Work Engagement Scale. On the basis of the literature, it predicted that cynicism and dedication are opposite ends of one un-derlying attitude dimension (called “identification”), and that exhaustion and vigor are opposite ends of one “energy” dimension. Confirmatory factor analyses showed that while the attitude constructs represent opposite ends of one continuum, the energy constructs do not – although they are highly correlated. The findings also supported by the pattern of relationships between burnout and work engagement on the one hand, and predictors (i.e., work pressure, autonomy) and outcomes (i.e., organizational commitment, mental health) on the other hand.
Oi-ling Siu , Jia-fang Lu , Paula Brough , Chang-qin Lu , Arnold B. Bakker , Thomas Kalliath , Michael O'Driscoll , David R. Phillips , Wei-qing Chen , Danny Lo , Cindy Sit , Kan Shi in their study on “Role resources and work–family enrichment: The role of work engagement69” in the year 2010 proposes a theoretical model of work-family enrichment and tests the mediating role of work engagement. The inclusion of work engagement extends prior research on work family interface, and allows for examination of the effects of role resources (job resources, family sup-port) on work-family enrichment. A two-wave survey was conducted among a matched sample of 786 employees in China. The model was tested with structural equation modeling techniques. The results showed that work engagement was the most proximal predictor of work-family enrichment. Work engagement fully mediated the relationship between family-friendly organiza-tional policies and work-family enrichment, and also between job autonomy and family-work enrichment. Further, work engagement partially mediated the relationships between two job re-sources (supervisor support, job autonomy) and work-family enrichment, and also between fami-ly support and family-work enrichment. No difference was found in gender and marital status in the proposed model.
Andrew J. Wefald, Rebecca J. Reichard, and Shawn A.Serrano in their study on “Fitting En-gagement Into a Nomological Network: The Relationship of Engagement to Leadership and Per-sonality70”in the year 2011 identified, Engagement is an emerging job attitude that has been theoretically linked to both leadership and personality variables as well as important work out-comes. However, given the variations in construct definitions of engagement as well as limited existing empirical research, the authors empirically examined the nomological network of mul-
International Journal of Mainstream Social Science 1(1): Spring 2011
30
tiple measures of engagement based on Schaufeli’s71 three-factor engagement, Shirom’s72 vigor, and Britt’s73 one-factor engagement. Using data from an online survey of 382 working profes-sionals, it conducted a series of hierarchical regression analyses and structural equation modeling to test the hypotheses. Results indicate strong relationships between engagement measures and personality (especially positive affect) and weaker relationships between engagement and leader-ship. Furthermore, multiple measures of engagement demonstrated significant relationships with the important work outcomes of turnover intentions, job satisfaction, and affective commitment. The research contributes to the literature on engagement by simultaneously examining multiple conceptualizations and measurements of work engagement and demonstrating leverage points for leaders to influence the state-like construct of engagement. Results suggested that engagement is related to important organizational outcomes and that engagement mediates the relationship be-tween personality and organizational outcomes.
Maria Tims, Arnold B. Bakker, Despoina Xanthopoulou in their study on “Do transformational leaders enhance their followers' daily work engagement74? in the year 2011, a diary study was investigated whether and how supervisors' leadership style influences followers' daily work en-gagement. On the basis of leadership theories and the job demands–resources model, it predicted that a transformational leadership style enhances employees' work engagement through the med-iation of self-efficacy and optimism, on a day-to-day basis. 42 employees first filled in a general questionnaire, and then a diary survey over five consecutive workdays. The results of multilevel analyses offered partial support for the hypotheses. Daily transformational leadership related po-sitively to employees' daily engagement, and day-levels of optimism fully mediated this relation-ship. However, daily self-efficacy did not act as a mediator. The findings expand theory and pre-vious research by illuminating the role of transformational leaders in fostering employee work engagement.
Padmakumar Ram & Gantasala V. Prabhakar in their study on “The role of employee engage-ment in work-related outcomes75” in the year 2011, it was investigated the antecedents and con-sequences of employee engagement in Jordanian Industry. A snowball sample of 310 respon-dents from the Jordanian hotel industry was interviewed using the research instrument. The sam-ple comprised of employees from different levels of management. The results confirm the rela-tionship between Employee Engagement and Perceived Organizational Support. The effect of Job Characteristics, Intrinsic and Extrinsic Rewards, Perceived Supervisor Support, Perceptions of Procedural Justice, Perceptions of Distributive Justice on Employee Engagement is also con-firmed. The hypotheses considered in the study are supported by the evidence from data col-lected from a sample of respondents drawn from the hotel industry in Jordan.
According to Blessing white 2011 report76, identified that, Similar to 2008 results the following patterns across geographic regions:
1. The higher up in the organization you go, the more likely you are to be Engaged: In some regions, as many senior executives are Engaged than individual contributors. A number of factors may be at play here: Greater authority and control over work, close proximity to organization direction and decisions, and the maturity to know (or to have figured out through trial and error) what’s important to you and how to achieve it. Another possible factor at play: Individuals with the personal clarity and initiative required for en-gagement may be more likely to be promoted consistently.
2. Engagement levels are higher among older employees: Younger workers tend to have lower-level roles, which correlate with lower engagement levels.
3. Gender is a differentiator in some, not all regions: Engagement levels of men and

International Journal of Mainstream Social Science 1(1): Spring 2011
31
women in North and Europe do not differ greatly. The largest gender gaps appear in India (11 points) and China (9 points). In both of these cases, men have higher levels than women.
4. When we look across the organization, from sales to IT and R&D, we find a global pattern whereby departments closest to the clients and most critical to delivering on the short-term strategy are likely to have the most Engaged employees.
5. Two satisfaction drivers stand out: Consistent with our 2008 findings, two factors top the list of satisfaction drivers for employees in nearly every region across every en-gagement level: “career development opportunities and training” and “more opportunities to do what I do best.” And once again, “a better relationship with my manager” was among the least common responses.
6. Engagement levels: With more than a third (37%) of employees Engaged, the In-dian workforce exhibits the highest levels of engagement worldwide. 2010 boasts more Engaged in India than 2008 (37% vs. 34%). In line with the global pattern, younger em-ployees in India are the least Engaged. 16% are actually disengaged and only 30% are en-gaged.
7. Engagement in India by Department/Function: In terms of engagement levels by industry, healthcare and chemicals show the highest levels of engagement in India (47% and 44% respectively). Coming in last? Banking/financial services and technology, both with 28% at full engagement. Employees working at mid-sized organizations (1,000-9,999 employees) appear more likely to be engaged than their counterparts in smaller organiza-tions.
8. Engagement drivers: In India, as in Southeast Asia and China, the top factor iden-tified by respondents as influencing job satisfaction is “career development opportunities and training.” More than a quarter (28%) of Indian respondents selected it. “More oppor-tunities to do what I do best” ranks second (21%) followed by “more challenging work” (15%). These top responses were pretty much consistent across engagement levels, gen-erations, department, and role.
9. Retention: More than half (59%) of Indian employees indicate that they will stay with their organization through the next 12 months if given the chance. The number of In-dian employees determined to leave has increased from 2008 (5%) to 2010 (8%).
10. Reasons to Leave: The top reason Indian employees overall consider leaving is lack of career opportunities (23%). An analysis of the secondary reasons for leaving indi-cates that most employees are looking for increased financial rewards next.
11. Trust in Leadership: In line with 2008 findings, three-quarters (75%) of employees in India report that they trust their organization’s executives. This is the highest percentage globally. Similarly, 8 in 10 Indian employees (82%) trust their immediate managers.
Conclusion Engaging employees is one of the top five most important challenges for management, accord-
ing to a survey of 656 chief executive officers (CEOs) from countries around the world (Wah 1999). Employee engagement has become a hot topic in recent years among consulting firms and in the popular business press. Employee engagement is defined as “the extent to which em-ployees commit to something or someone in their organization, how hard they work and how long they stay as a result of that commitment.” Models of employee engagement help in under-standing the factors, which have an influence on employee engagement and can predict it, and

International Journal of Mainstream Social Science 1(1): Spring 2011
32
also to identify the consequences of the phenomenon. Various consultants, researchers, academi-cians and organizations have studies several factors and their impact on employee engagement. These studies are of great interest who pursue research on employee engagement and who want to enhance employee engagement in their respective organizations/institutions. The objective of this paper is to examine the current state of knowledge about engagement at work through a re-view of the literature. The authors through this paper offer a comprehensive review of the empir-ical findings that are available to date. References
1. Wilmar B.Schaufeli, Marisa Salanova, Vicente Gonzalez-Roma and Arnold .B.Bakker(2002), The Measure-ment of Engagement and Burnout: A Two Sample Confirmatory factor analtic Approach: Journal of Happiness Stu-dies,71-92
2. Arnold B. Bakker, Evangelia Demerouti, and Willem Verbeke(2004), Using The Job Demands-Resources Model To Predict Burnout And Performance: Human Resource Management, Vol. 43, No. 1, Pp. 83–104.
3. Alan M. Saks, Joseph L(2006), Antecedents and Consequences of Employee Engagement: Journal of Mana-gerial Psychology, Vol. 21 No. 7, pp. 600-619.
4.Wilmar B. Schaufeli and Arnold B. Bakker(2006), The Measurement of Work Engagement With a Short Ques-tionnaire: A Cross-National Study: Educational and Psychological Measurement,Vol.66, No. 4,701-716.
5.Vicente Gonza´lez-Roma´, Wilmar B. Schaufeli , Arnold B. Bakker , Susana Lloret(2006), Burnout and work engagement: Independent factors or opposite poles?: Journal of Vocational Behavior, 68, 165–174.
6.Maslach, C., & Leiter, M. P. (1997). The truth about burnout: How organizations cause personal stress and what to do about it. San Francisco, CA: Jossey-Bass.
7.Schaufeli, W., Salanova, M., Gonza´lez-Roma´ , V., & Bakker, A. B. (2002). The measurement of engagement and burnout: A two sample confirmatory factor analytic approach. Journal of Happiness Studies, 3, 71–92.
8.Mokken, R. J. (1971). A theory and procedure of scale analysis. The Hague: Mouton. 9.Molenaar, I. W. (1982). Mokken scaling revisited. Kwantitatieve Methoden, 8, 145–164. 10.Molenaar, I. W. (1991). A weighted Lowvinger H-coefficient extending Mokken scaling to multicategory
items. Kwantitatieve Methoden, 37, 97–117. 11.Saar Langelaan , Arnold B. Bakker ,Lorenz J.P. van Doornen, Wilmar B. Schaufeli(2006) Burnout and work
engagement: Do individual differences make a difference?” Personality and Individual Differences: 40, 521–532 12.Ulrika E. Hallberg and Wilmar B. Schaufeli (2006) “Same Same” But different? Can work engagement be dis-
criminated from job involvement and organizational commitment?:European Psychologist, Vol.11(2), 119-127. 13.Nancy R. Lockwood(2007), Leveraging Employee Engagement for Competitive Advantage: HR’s Strategic
Role: SHRM Research 14.Society for Human Resource Management. (2006). SHRM Special Expertise Panels 2006 trends report. Alex-
andria, VA: Author. 15.Mercer HR Consulting. (2006, July). Managing attraction and retention in China. Retrieved October 26, 2006,
from www.mercer.com. 16.Towers Perrin. (2006, February). Winning strategies for a global workforce. Retrieved October 25, 2006, from
www.towersperrin.com. 17.Ibid. 18.SHRM Glossary of HR Terms, www.shrm.org 19.Feeling good matters in the workplace. (2006, January 12). Gallup Management Journal. 20.Corporate Leadership Council. (2004). Driving performance and retention through employee engagement.
Washington, DC: Corporate Executive Board. 21.BlessingWhite. (2006). Employee engagement report. Princeton, NJ: Author 22.Scottish Executive Social Research (2007) “EMPLOYEE ENGAGEMENT IN THE PUBLIC SECTOR- A re-
view of literature : www.scotland.gov.uk/socialresearch 23.Chartered Institute of Personnel and Development (CIPD) (2006c) Working Life: Employee attitudes and en-
gagement 2006 Research Report. 24.Ipsos – MORI (13 October 2006) Change Management And Leadership: The Challenges For The Public Sec-
tor. London: Ipsos – MORI. Available online at http://www.ipsos mori.com/publications/mis/change-management-andleadership. shtml [retrieved on 6 March 2007]
International Journal of Mainstream Social Science 1(1): Spring 2011
33
25.Meere, Michael (December 2005 ) High cost of disengaged employees Victoria: Swinburne University of Technology. Available online at http://www.swinburne.edu.au/corporate/industrysolutions/ee/reports/Employee%20Engagement%20Industry%20
Briefing%20Paper%20Dec%202005%20.pdf [retrieved on 6 March 2007] 26.Corporate Leadership Council (2004) Driving performance and retention through employee engagement (summary, website extract). 27.Melcrum Publishing (2005) Employee Engagement: How to build a high-performance workforce. An indepen-
dent Melcrum Research Report Executive Summary. 28.Right Management (2006) Measuring True Employee Engagement. Philadelphia: Right Management. 29.S. Rothmann and J.H.M. Joubert(2007) “Job demands, job resources, burnout and work engagement of manag-
ers at a platinum mine in the North West Province” : S.Afr.J.Bus.Manage, 38(3). 30.Sandeep Kular, Mark Gatenby, Chris Rees, Emma Soane, Katie Truss(2008), Employee Engagement:Kingston
University Working Paper Series No 19. 31.Purcell, J. (2006) Change Agenda, Reflections on Employee Engagement. London, CIPD. 32.Truss, C., Soane, E., Edwards, C., Wisdom, K., Croll, A. and Burnett, J. (2006) Working Life: Employee Atti-
tudes and Engagement 2006. London, CIPD. 33.The Gallup Organisation (2004) [online] Available at: www.gallup.com. Accessed 28th June 2007. 34.ISR (2004) International Survey Research. [Online] Available at: www.isrsurveys.com [Accessed 6th July] 35.Ott, B. (2007) ‘Investors take note: Engagement boosts earnings’, The Gallup Management Journal, 14th June.
[online] Available at: http://web.ebscohost.com/ehost/pdf?vid=4&hid=21&sid=8470b965-28f0-4f5a-9522- 6c297e68b789%40sessionmgr8 [accessed 2nd July]
36.Johnson, G. (2004) ‘Otherwise engaged’, Training, Vol 41, No 10, p4. 37.Seijts, G.H and Crim, D. (2006) ‘What engages employees the most or, the ten C’s of employee engagement’,
Ivey Business Journal, March/April, pp1-5. 38.Emmott, M. (2006) ‘Hear me now’, People Management, 23rd November, pp38-39. 39.Despoina Xanthopoulou , Arnold B. Bakker, Evangelia Demerouti, Wilmar B. Schaufeli(2008) “Reciprocal re-
lationships between job resources, personal resources, and work engagement: Journal of Vocational Behavior, 74 ,235–244.
40.HR Special Survey (2008): Business World, 5th May. 41.Mark Attridge (2009), Measuring and Managing Employee Work Engagement: A Review of the Research and
Business Literature”: Journal of Workplace Behavioral Health, 24:383–398. 42.Fleming, J. H., Coffman, C., & Harter, J. K. (2005). Manage your human sigma. Harvard Business Review,
83(7=8), 106–114. 43.Towers Perrin. (2003). 2003 Towers Perrin global engagement workforce study [White Paper]. Stamford, CT:
Author. 44.BlessingWhite. (2008). The state of employment engagement—2008: North American overview [White Pa-
per]. Princeton, NJ: Author. 45.Corporate Leadership Council. (2002). Building the high-performance workforce [White Paper]. Washington,
DC: Author. 46.Towers Perrin. (2006). Ten steps to creating an engaged workforce: Key European findings. Towers Perrin
global workforce survey 2005 [White Paper]. Stamford, CT: Author. 47.Towers Perrin. (2008). 2007–2008 Towers Perrin global engagement workforce study [White Paper]. Stam-
ford, CT: Author. 48.Gebauer, J., & Lowman, D. (2009) Closing the engagement gap: How great companies unlock employee po-
tential for superior results. New York: Portfolio= Penguin. 49.Robinson, D., Perryman, S., & Hayday, S. (2004). The drivers of employee engagement— Report 408 [White
Paper]. London: Institute for Employment Studies. 50.Rath, T., & Conchie, B. (2009). Strengths based leadership: Great leaders, teams and why people follow. New
York: Gallup Press. 51.Employee Benefits Research Institute. (2008). How job satisfaction affects decision to retire: Fast facts from
EBRI #92 (July 23, 2008). Washington, DC: Author. 52.Wilmar B. Schaufeli, Arnold B. Bakker And Willem Van Rhenen(2009) “How changes in job demands and re-
sources predict burnout, work engagement, and sickness absenteeism: Journal of Organizational Behavior J. Orga-niz. Behav.

International Journal of Mainstream Social Science 1(1): Spring 2011
34
53.Karen Wilson, Dr. Larry Kreuger(2009), A Survey on Employee Engagement: A Dissertation Presented to: University of Missouri – Columbia
54.Freeney, Y. & Tiernan, J. (2006). Employee engagement: An overview of the literature on the proposed anti-thesis to burnout. The Irish Journal of Psychology, 27(3-4), 130-141.
55.Schaufeli, W. B., Bakker, A. B. (2004). Job demands, job resources, and their relationship with burnout and engagement: a multi-sample study. Journal of Organizational Behavior, 25, 293-315.
56.HR Consultants, Inc(2010), Strategically Align Your 2010 Workforce: Employee Engagement vs. Job Satisfac-tion: HR Consultants, Inc: Issue XXIII.
57.Engen, John. 2008. Are your employees truly engaged? Chief Executive 232: 42(4) 58.Hewitt Associates, LLC. Research Brief, Employee Engagement Higher at Double-Digit Growth Companies.
Double-Digit Growth and Engagement. 2004. SR-0127-001-EN 4/04 59.Wellins, Richard, Bernthal, Paul, & Phelps, Mark. Employee Engagement: The Key to Realizing Competitive
Advantage. Development Dimensions International, Inc. 60.The ISR Employee Engagement Report. 2006. In Docstoc Digital Library, http://www.docstoc.com/docs/1021257/employee -engagement-model (accessed January 18, 2010). 61.BlessingWhite, Inc. The State of Employee Engagement 2008 North American Overview. Version 04/08.
www.blessingwhite.com/research 62.Melcrum Employee Engagement Survey 2007/08 - Summary of Findings. Melcrum Publishing, 2008 63.Toon W. Taris, Ilona van Beek and Wilmar B. Schaufeli(2010) “Why do perfectionists have a higher burnout
risk than others? The mediational effect of workaholism” : Romanian Journal of Applied Psychology, Vol.12, No.1, 1-7.
64.De Lange, A. H., Taris, T. W., Kompier, M. A., Houtman, I. L. D., & Bongers, P. M. (2003). The very best of the millennium: Longitudinal research and the demand-control(-support) model. Journal of Occupational Health Psychology, 8, 282-305.
65.Seybold, K. C., & Salomone, P. R. (1994). Understanding workaholism: A review of causes and counseling approaches. Journal of Counseling & Development, 73, 4-9.
66.Van Wijhe, C., Schaufeli, W. B., & Peeters, M. C. W. (in press). Understanding and treating workaholism: Set-ting the stage for successful interventions. In C. L. Cooper and R. J. Burke (Eds), Psychological and behavioural risks at work. Chichester: Wiley.
67.Arnold B. Bakker and P. Matthijs Bal(2010),Weekly work engagement and performance: A study among start-ing teachers: Journal of Occupational and Organizational Psychology , 83, 189–206.
68.Evangelia Demerouti, Karina Mostert, and Arnold B. Bakker(2010),Burnout and Work Engagement: A Tho-rough Investigation of the Independency of Both Constructs: Journal of Occupational Health Psychology,Vol. 15, No. 3, 209–222
69.Oi-ling Siu , Jia-fang Lu , Paula Brough , Chang-qin Lu , Arnold B. Bakker , Thomas Kalliath , Michael O'Driscoll , David R. Phillips , Wei-qing Chen , Danny Lo , Cindy Sit ,Kan Shi(2010), Role resources and work–family enrichment: The role of work engagement: Journal of Vocational Behavior,77, 470–480.
70.Andrew J. Wefald, Rebecca J. Reichard, and Shawn A.Serrano (2011) ,Fitting Engagement into a Nomological Network: The Relationship of Engagement to Leadership and Personality: Journal of Leadership & Organizational Studies, XX(X) 1–16.
71.Schaufeli, W. B., & Bakker, A. B. (2004). Job demands, job resources, and their relationship with burnout and engagement: A multi-sample study. Journal of Organizational Behavior, 25, 293-315.
72.Shirom, A. (2003). Feeling vigorous at work? The construct of vigor and the study of positive affect in organi-zations. In D. Ganster & P. L. Perrewe (Eds.), Research in organizational stress and well-being (Vol. 3, pp. 135-165). Greenwich, CN: JAI Press.
73.Britt, T. W. (1999). Engaging the self in the field: Testing the triangle model of responsibility. Personality and Social Psychology Bulletin, 25, 696-706.
74.Maria Tims, Arnold B. Bakker, Despoina Xanthopoulou (2011), Do transformational leaders enhance their fol-lowers' daily work engagement: The Leadership Quarterly, 22, 121–131.
75.Dr. Padmakumar Ram & Dr. Gantasala V. Prabhakar(2011), The role of employee engagement in work-related outcomes: Interdisciplinary Journal of Research in Business, Vol. 1, Issue. 3,(pp.47-61)
76.www.blessingwhite.com/research.

International Journal of Mainstream Social Science 1(1): Spring 2011
35
Re-Branding and Managing Conflicts among Academic Staff of Nigerian Universities: Sociological and Psychological Perspective
C.A. Akinfolarin
Department of Educational Management, Faculty of Education Adekunle Ajasin University, Akungba-Akoko, Ondo State, Nigeria
E-mail: [email protected]
Jude M.Akomolafe Department of Guidance and Counselling, Faculty of Education,
Adekunle Ajasin University, Akungba-Akoko, Ondo State, Nigeria E-mail: [email protected]
Abstract: Re-branding and Managing Conflicts Among academic staff of Nigeria Universities was found to be ne-cessary in developing our Educational institution. This paper discussed the need for re-branding the university edu-cation. In Nigeria, emphasis was stressed on paper publication for promotion exercise. Causes and conflicts resolu-tions were discussed under communications, behavioral and structural approach. Conflict management behavior in organization was related to academic staff of Nigeria Universities. Psychological skills in managing conflicts were identified and explained. Among other suggestions made, the paper concluded that behavioral and psychological skills in managing conflict among the academic staff of Nigerian Universities should be adopted and utilized effec-tively. Keywords: Conflicts, Re-branding, Emotional Intelligence, Communication Management Behavior &Academic staff. Introduction Re-branding has been a slogan in our society, political jingles on media, conferences, workshops and likes discusses “re-branding.” Mal-practices in organization were observed to be the other of the day. Institutions of learning were not left out of these Mal-practices ranging from examina-tion misconducts, pirating of thesis, extorting money from innocent students, sexual harassment politicization and denial of staff promotion, incompetence in the use of some major resources and other abuse of privileges. Organizations were the above mal-practices are noticed, conflicts emerge. In attempt to re-brand the above mentioned malpractices conflicts emerge due to the disagreements in option and interest of individual or group of people in an organization. Educational institutions are collection of individual or/and group of people who systematically work together to attain a common goal. The interaction between these individual or group of people are sometimes and likely to be negative thereby resulting into conflict. When-ever there is interaction or interdependences, conflict is inevitable, in every human grouping. This is largely due to pursuit of diverse and incompatible interests and goals by different indi-viduals that constitute the organization (Edwards, 2000; Onyeonoru, 2004, 2006). Chandan (2005) pointed out that conflict occurs because of competitive but incompatible goals or differ-ences in attitude towards methods of operation, disparity in rewards, break down in communica-tion and other challenges between two or more people In Nigeria universities the goals of different stakeholders, students, labor staff and institution management are often competitive and incompatible which may eventually result into conflict. Among the academic staff of Nigeria University, there is a slogan of “writing paper or perish’. This paper writing has it advantages of been encouraging the lecturers search for current know-ledge on how things are done and possibly boast their knowledge of what to teach and how to teach the students in order to develop the community through the government intervention. This

International Journal of Mainstream Social Science 1(1): Spring 2011
36
competitiveness of paper publications is pronounced in one of the academic slogan that per-meates the thought of all academia that in “academic you either publish or perish.” This paper publication is probably causing a lot of competition and confusion. It was observed that policies on paper publications changes or still better say it causes confusion especially when an individual needs to be promoted ad probably a little academic politics are played such as pa-per not having professional focus, not attaining a required number “on share off shore” that is having paper within and outside the country, non recognition of journal, bias attitude of super-ordinate and subordinate members of staff among others. This is often generated from the “on shore off shore” dichotomy. When this happens conflict become inevitable and desirable, be-cause at this level iota of manipulations, malpractices, bias and favoritism among other becomes the order of the day. These attitude exhibited by the super ordinate to the subordinate could af-fect the social and psychic of the affected individual, and when this happens it affect the smooth running of the educational system. It is thereby patient to note that when this happens it has to be carefully managed so as to promote change of efforts, innovative research, better methods of op-eration, teaching, learning and resourceful ideas for overall effectiveness. This assumption is supported by Draft (2001) who stated that conflict has to be effectively managed or organization may fail completely in achieving its desirable goals and objectives. It is in view of this that this paper canvasses on the need to re-brand the process of managing conflict among academic staff in Nigerian universities from the sociological and psychological perspective. Conflict Management Behavior in Organization The outcome of conflict is determined largely by conflict management behavior demonstrated by the parties involved in the conflict. Hammed and Ayantunji (2002) affirmed that industrial con-flict in many organizations today bothers on conflict management behavior of both labor leaders and the management of the organization. Conflict management behavior as a concept refers to behavioral orientation that an individual holds towards conflict management. Mitchell (2002) quoting Thomas (1976) identified five conflict management behaviors. These include competing, accommodating, avoiding, collaborating and compromising. Competing: It depicts a situation in which one has high concern for self and low concern for oth-ers. Thus a person adopting this behavior pursues his own concern at the expense of others. It is power-oriented behavior with efforts to force and dominate the other party. Accommodating: This is a situation in which a person has high concern for others and low con-cern for self. This conflict management behavior involves an element of self-sacrifice and is a reflection of low self-esteem. Avoiding: This has to do with having low concern for self and for others. It is a process where the individual tries to avoid the other person or pretend that the conflict does not exist even when the individual is hurt and angry. This approach does not solve the problem but postpones the evil day. Thus it leaves the parties more annoyed, resentful and frustrated. Collaborating: This involves high concern for self and for others hence it is a corollary of the previous style (avoiding). This approach attaches great emphasis on satisfying the concern of all parties, that is, to work with the other party cooperatively in order to find an alternative that inte-grates and fully satisfies the concern of all. Compromising: It involves finding an expectant, neutrally acceptable solution that partially satis-fied both parties. It is an integrative approach to conflict handling. For the purpose of managing conflicts among university academic staff in Nigeria we found compromising approach more appropriate. This approach affords both academic staff and uni-

International Journal of Mainstream Social Science 1(1): Spring 2011
37
versity management opportunity to work hand in hand and find practical solutions to any prevail-ing problem. Such solution is expected to integrate and satisfy the concerns of both parties. In finding solutions to the prevailing problem the parties involved would dialogue and they would be ready and willing to shift ground where and when necessary. Re-branding Re-branding is to make new or to renew a messed-up situation or an abused privileged by indi-vidual or group of people having common goal. Re-branding properly conceived by Hornby (2005) is to change the image of a company or an organization or one of its product or services, for example by changing its name or by advertising it in a different way. Academic institution is not left out of this idea of re-branding because education is the bedrock of any developing nation. The polarization of the academic sector both within and without necessitate the need for re-branding. It is believed that when positive re-branding takes shape in academic sector conflict will be effectively and possibly managed. The whole idea of re-branding centers on systemic change. It is believed that when there is systemic change, conflicts could be managed effectively. Causes and Resolution of Conflicts Thee systemic approach could be seen as an aspect of developing individual in an organization. Where there are systematic approaches in carrying out responsibilities, orderliness and certain believed are encouraged. When this is done, conflict is band to be reduced and managed such that the purpose of academic staff members of Nigerian Universities, which centered primarily on teaching and research which if done well contribute to the development of the nation. In the light of the above, the place of communication cannot be over emphasized communication is ob-served to be a major hindrance especially at the interaction level. Some times through the use of inter-net services, the network may disappear, interaction is disrupted, power failure could be another major break down in transmission, interaction level is cut short. Coping with all these distractions individual involved is likely to be stressed up and positive results are difficult to be attained. This could even cause self-conflict. The ability to establish individual potentiality has been one of the goals of Education in Nigeria NPE (2004) stated that the quality of instruction at all levels has to be oriented towards inculcating the value in acquisition of competencies neces-sary for self-reliance Hence academic staff at all level of educational system ought to have and be prepared to be re-branded with the use of modern information communication technology so as to reduce conflicts in our educational system. Communication as a Tool of Reducing Conflicts Communication is as important as individual working in an organization. The people working within an organization need to pass information to one another this could be through verbal mes-sage, sign or writing and use of senses of the body. As individual moves further in to the scientif-ic age, the world is becoming increasingly complex, human needs for information and the quanti-ty of information available continue to expand rapidly. In an organization like the school system communication can be in divert ways. In other to reduce conflict, the following types of commu-nication are likely helpful for school administrator. v Formal and informal communication
The formal communication is usually refers to the official communication that goes through the structured organizational channels. While the informal communication need not to pass through the structured organizational channels. The informal communication can
International Journal of Mainstream Social Science 1(1): Spring 2011
38
easily hinder or save situations in an organization. If the school administrator refuses to have control over prevailing situation conflict is bond to occur.
v Upward, downward and horizontal communication The upward communication is that which flows up the organizational structure. It
main purpose is to supply information to upper levels about the happenings at the lower le-vels. The downward communication is that which flows from the higher level officials to the lower level of organizational structure. This information could be in form of handbooks, memos, bulletin, annual reports and the likes. These downward communications usually as-sist the top managers in taking decisions, little alteration or disregard of information which are not favorable to the lower level officer is likely to aggravate conflict. Horizontal commu-nication is that which flows among people on the same organizational levels. It thus helps in coordinating activities effectively it saves time and efforts, it improves understanding and co-ordinate efforts of the achievement of organizational goals and objective.
v Verbal and Non Verbal Communication The verbal communication can either be spoken or written. Spoken communication al-
lows individuals to receive instant feedback, where there is a face to face communication there is usually audience reactions either negative or positive. Either of the reactions could result into conflict depending on the situation at hand. The written communication provides a permanent record or reference. It helps in documentation of a transmitted message which may be useful later when ever crises occur or resolve conflict. Non verbal communication can be referred to as body gesture or language, feelings, expressed by voice and use of time. Body gesture, sound of the voice, may influence reaction negatively or positively depending on the exposure and level of listeners understanding.
Conflict manifests itself in various forms. It may erupt for various reasons such as breakdown in the communication gap between the institution authority and academic staff of universities. Oth-er factors include inadequate facilities, bureaucratic system of administration and external fac-tors. All these might cause negative reaction of academic union against government or Universi-ty policies that might be affecting the group interest. Mechanic (2002) described the tactics of conflict used by lower level participants such as apathy or rigid adherence to the rules to resist maltreatment by upper levels of the hierarchy. The inert face between perceived and manifest conflicts and between felt and manifest conflict are the pressure points when most conflict resolution intervention are made. Lussier (2005) described the due process or systems used for resolving superior/ subordinate conflict, He further explained that to resolve lateral conflicts among the parties of a functional relationship like the administra-tive and academic staff which are relatively undeveloped. He further suggested avoidance tech-nique rather than programme design Psychological Skills in Managing Conflicts Some psychological skills that could be useful in conflict management among academic staff include emotional intelligence and communication skills. Emotional Intelligence (EI) has drawn significant interest from academic throughout the world. Research shows emotions, properly managed, can drive trust, loyalty, and commitment. Many of the greatest productivity gains, innovations, and accomplishments of individuals, teams, and or-ganizations have occurred within such framework Cooper (1997). Emotional intelligence is a social intelligence that enables people to recognize their own and oth-er people’s emotions. Moreover, emotional intelligence enables people to differentiate those

International Journal of Mainstream Social Science 1(1): Spring 2011
39
emotions, and to make appropriate choices for thinking and actions (Cooper and Sawaf, 1997; Mayer and Salovey, 1993). According to Salovey and Mayer (1990), emotional intelligence in-cludes an “ability to monitor one’s own and others feelings and emotions, to discriminate among them and to use this information to guide ones thinking and actions”. EI has basic components such as self awareness, self-regulation, interpersonal skills (social Skills), adaptability, stress to-lerance and general mood and motivation. Self Awareness: It is the ability to recognize and understand your moods, emotions and drives as well as their impact on others. Emotional self awareness is also about knowing what motivates you, what brings you fulfillment, and what lifts your heart and fill you with energy and aliveness. This also includes one's awareness of the effects of his or her feelings on others. Self-regulation: It refers to the ability to keep one's own emotions and impulses in check, to remain calm in potentially volatile situations, and to maintain composure irrespective of one's emotions. The control and regulations of ones emotions, the ability to stay calm, clear and focus when things do not go as planned. It also means shifting undesirable emotional state to more rea-sonable ones. Interpersonal skills: This includes awareness of others and emotions, feelings and needs as well as the ability to establish and maintain cooperative constructive and mutually satisfying relation-ships. People who are skillful in this area tend to be good listeners and able to understand the feelings of others. It involves being a constructive, cooperative and contributing member of your social group; and establishing and maintaining mutually satisfying relationships. Those who have this skill possess the ability to deal with problems without demeaning those who work with them. Such ones do not have negative feeling and that of other to not allow own or others' negative feelings to inhibit collaboration, and to handle affective conflict with tact and diplomacy. Adaptability: This is the ability to realistically and flexibly cope with immediate situation. Indi-viduals that possess this skill effectively solve problems as they arise. It also involves the capaci-ty to cope with environmental demands by effectively and realistically sizing up and flexibly dealing with problematic situations. Stress Tolerance: stress tolerance is the ability to withstand adverse condition, stressful situa-tions and strong emotions without falling apart but actively coping with stress. General mood and motivation: Two features that facilitate emotionally intelligent behavior are optimism and happiness. Optimism is the ability to look at the brighter side of life and to main-tain a positive attitude even in the face of adversity. Happiness is the ability to feel satisfied with one’s life, to enjoy oneself and others, and to have from and express a positive mood. Thus, He who fight with inevitable situation of life, wastes both time and resources Emmanuel (2011) If the EI skills explain above are adequately demonstrated by the university management and the leadership of academic staff, conflicts between them would be effectively managed. The chal-lenge for a contemporary organization is to enhance the emotional intelligence of their managers. Members of University management may be trained to enhance their emotional intelligence so that their subordinates (academic staff) are encouraged to use more problem solving and less bargaining strategies of handling conflicts. This would help the university management and lea-dership of the university academic staff to work together to attain her goals and objectives Daft (2001) Ivancevich and Matterson (2005) George and Jones (2006) believed that con-flicts are numerous in different organizations but causes of conflict can be restructured into three categories

International Journal of Mainstream Social Science 1(1): Spring 2011
40
§ Communicational; § Behavioral (Psychological Effect) § Structural Communicational Aspect of Conflict Poor Communication can have powerful effect in causing conflict. Misunderstood or partial in-formation during the process of communication can make a difference between the success and the failure of a task. Such failure for which the responsibility becomes difficult to trace can cause conflict between the sender and receiver of the communication. Thus, the problems relate to too little or too much communication, filtering of communication, semantic problems or noise act to retard collaboration and stimulate misunderstanding. For instance, where school management fails to communicate its intentions or aims and objectives of the school to the staff at the appro-priate time or where important information are passed at the wrong time or place; there is likely to be conflict or problem. Behavioral Aspects of conflict Human thoughts, feelings, emotions and values are very important organ or tools to be recog-nized in an organization. A happy and relaxed environment definitely will encourage individuals to put in positive efforts in achieving the goals and objectives of the organization. In spite of conducive environment in an organization, some people’s value and perceptions of situation are likely to generate conflict with other people at work. Chandan (2005) was of the opinion that be-havioral aspect of conflict arises out of human thoughts, feelings emotions, attitudes, values and perception which are reflection of some basic personality traits. This could be likened to an au-thoritarian and dogmatic individual who could be prone to antagonizing staff members by hig-hlighting minor differences that might exist and may over react thereby causing conflict. In an organization like the school system, the top management team sets the tone for the school and plays major role in shaping its culture. The Nigeria university top management teams were observed to have a clear vision of contributing to national development through high level rele-vant manpower training; develop and inculcate proper values from the survival of the individual and society; develop the intellectual capability of individuals, to understand and appreciate their local and external environment; acquire both physical and intellectual skills which will enable individuals to be self-reliant and useful members of the society; promote and encourage scholar-ship and community service; forge and cement national unity; and promote national and interna-tional understanding and interaction. N. P. E (2004). The articulation of this vision is usually car-ried out by this top management team. The top management team usually refers to as “principal officer” cannot achieve the vision alone without passing through the aims and objectives of the institution. Hence the sub-ordinates which are members of their own division, department or fa-culty knew what is expected of them can be presented with an ambiguous, contradictory or vague vision of where they see the institution headed. As a result, other managers in these institutions may be unsure about how to proceed and be unable to communicate effectively with their em-ployees Denise and Griffin (2005) agreed that leadership that emphasize the importance of per-sonal charisma in leaders tend to suggest that effective leaders need both a clear vision and a means of communicating that vision they further stated that if an organization as top managers who are unable to accomplish these goals, the organization is less likely to be successful. In con-clusion Denise and Griffin highlighted the side of human resource (HR) that the top management team in an organization plays a major role in determining it strategies and its culture. When top

International Journal of Mainstream Social Science 1(1): Spring 2011
41
managers clearly respect the firm’s employees feel valued and are likely to become more moti-vated and committed to the firm. But if top managers take a condescending approach to lower-level employees, the results can be disastrous. From the above illustration, the behavior of top management team goes along way in determining success or failure of an organization Nigeria Universities though share a common vision as state in the NPE 2004 but it was observed that there are disparities especially during promotion exercise Conclusion Re-branding Education system in Nigeria especially the universities is a task that must be done. when re-branding is done conflicts will be reduced and more success of conflicts such as com-munication, behavioral and structural approaches should be monitored by making individual more literate through the use of Information Communication Technology, supply of electrical gadgets at a reasonable cost, supply of electricity power and good network system. Inter-personal relationship can be encouraged through dissemination of knowledge through workshop, confe-rences on how behavior can be controlled using conflict management behavior approach in an organization. Psychological skills in managing conflict should also be inculcated in the universi-ty staff through periodical seminars. Management procedures should be adhered to in selection of management team so as to avoid structural deformity. The following are possible suggestions for further studies
- Re-branding and selection of management team in university system in Nigeria - Conflict resolution in the use of ICT in Nigeria Institution of learning.
References Angelo S. Denisi and Ricky W. Griffin (2005) Human Resource Management Second Edition Houghton Mifflin
Company Boston New York Chandan, J.S (2005) Organizational Behavior 3rd Edition. VIKAS Publishing House Put Ltd. Draft, R.L. (2001) Organizational Theory of Design 5th Edition. West Publishing Company. Edwards, P. K. (2000). Industrial conflict. In Poole M and Warner M (Eds). The Handbook of Human Resource
Management. London: International Business Press. Emmanuel, Femi. (2011). Turning Point Today. Daily Devotional Guide. March Edition. Fem-Man Publishing
House Ibadan Nigeria. Famade, O.A (2003) Educational management. An introductory Text. Pumark Nigeria Limited Agege Lagos. George, J.M. & Jones, G.R. (2006) Contemporary Management: Creating value in Organizations Mc Graw-Hill
Higher Education. Hammed, A. (1999). Not reactive but proactive: The influence of assertiveness training in enhancing interpersonal
skills among selected banks workers. Nigerian Journal of Applied Psychology, Vol. 5 (1) 171-184. Hornby, A.S (2005) Oxford Advanced Learners Dictionary 7th Edition. Oxford University Press Oxford University
press Oxford. Lussier, R.N (2005). Human relations in organizations 6th edition. Mc Graw-Hill Mechanic, D. (2000) Sources of Power of Lower Participant in Organization. New Perspectives in Organizational
Research New York; John Wiley & Sons, Inc. Mitchell, R. C (2002). Constructive management of conflict in groups. Retrieved February 25, 2011from
http://www.edu/-infmgt ool/cm-gp.htm Onyeonoru, I.P. (2004). Globalization and trade union resistance in Nigeria. African Journal for the Psychological
Study of Social Issues, 7 (1) 71-98. Onyeonoru, I. P. (2006). Social dialogue and labor standards in the pre-democratic and democratic era in Nigeria.
Nigeria Journal of Industrial Relations, Vol. 9/10, 95-106. Salovey, P and Mayer J. D. (1990). Emotional intelligence. Imagination, Cognition, and Personality. 185 - 211. Thomas, K. W. (1976). Conflict and conflict management. In M. D. Dunnette (Ed.), Handbook of industrial and
organizational psychology (pp. 889–935). Chicago: Rand McNally.
International Journal of Mainstream Social Science 1(1): Spring 2011
42
Low Skilled Labours in India and Role of Education Sector, Government and Corporate Sector
Vidya Gawali
Assistant Professor, Millennium Institute of Management, Aurangabad, India E-mail: [email protected]
Santosh Ghalage
Senior Manager in SabMiller India Ltd., Aurangabad, India E-mail: [email protected]
Abstract: The paper highlights the complete scenario of the low skilled labours in India compared with other coun-tries. The present skill level of the labours in India is not satisfactory, 145 Million Youth Labour Force, out of which 71.4 Million employed labour force required skill repair and 11 million unemployed labour force require skill re-pair. Government of India taking efforts through skill development programmes but not enough. The main reason is that the educational system specially vocational education is not competitive in India compared to other countries. The skill development of the low skilled labours is not only the responsibility of the Government of India but also require involvement of the corporate sector and educational sector. The paper analyzed the need of the development of low skilled labours in India and gives the some suggestions, which will be helpful to make initiatives of the Gov-ernment and Corporate sector effective. Keywords: Low skilled labours, Gross enrolment ratio, , Labour outflow, Labour market information and analysis (LMIA), Public-Private partnership, skills inventory, Skill distribution, Vocational education Introduction Two-thirds of India's population is under 35, which has the potential to make the country the world's human resource kitty. The Government of India has entrusted the National Skill Devel-opment Corporation (NSDC) and a PPP (Public private partnership) initiative to develop the skills of 15 crore workers in 21 sectors by 2022. These initiatives are required as India with 145 Million Youth Labour Force, out of which 71.4 Million employed labour force requires skill re-pair and 11 million unemployed labour force requires skill repair. The Support from education sector is satisfactory as India’s education system produces barely 9-10% of employable gra-duates and gross enrollment in higher education is around 12 %. “A degree-driven Indian society treats education as a proxy for skill levels creating strong supply-demand mismatch,” says Team Lease Services chairman Manish Sabharwal. The statistics shows that percentage of low skilled labours in different sectors is high in India as compare to any other country in the world. The coordinated effort of government, education sys-tem and corporate sector is required to build and develop such a major part of labour force of the country . NSDC is good initiative taken by the Government of India, but also make sure that the coming generations of the country should not be skill deprived. Skill level of Labour in India India's labour transitions (farm to non-farm, rural to urban, unorganized to organized, subsistence self employment to decent wage employment) are a unique opportunity and challenge for India because 25% of the world's new workers will be Indian. Indian labour force is growing in terms of the quantity but quality is still lagging behind as 44 .5% of Indian workforce is illiterate. The Figure 1 depicts the literacy level of the Indian workforce.

International Journal of Mainstream Social Science 1(1): Spring 2011
43
Figure 1: Literacy level of the labour force of India
Primary School23%
Illiterate44%
Middle school and above33%
Source :Indian Labour Report 2009 The skill distribution in the labour force and share of labour in the three major economic sector, namely agriculture, industry and services in Table 1, one finds that advanced countries have large share of labour force in services sector with some in industry and very little in the agricul-ture. In contrast, India have large share of labour force in agriculture sector with the balance distributed evenly between the industry and the services sector. Almost 35.4 % of the labour force in India is unskilled and only 5. 4% is skilled labour. This indicates the poor condition of the skill level of labour force compared to other countries like USA having 34.3 % and Japan 17.2% skilled labour force. Similarly advanced countries have skilled labour more than India.
Table 1: Skill distribution and labour share
Country Percentage of skilled labour (%)
Labour share in economic sectors
Agriculture Industry Services
USA 34.3 2.5 21.6 75.9 UK 26.9 1.4 24.1 74.2 Russia 24.0 10.7 29.7 59.6 Japan 17.2 4.7 29.7 64.8 Brazil 10.8 19.8 21.6 58.4 China 7.5 44.1 17.7 16.1 India 5.4 59.0 17.2 23.8 Indonesia 4.1 44.3 14.1 41.6
Source: Labour data (by skill distribution) from LABOURSTA Database, International Labour Organization (ILO), http://laboursta.ilo.org. Labour share in economic sectors data from World Development Indicators database (year 2006) Reasons for Low Skilled Labours in India The share of low skilled and unskilled labours is high in India as compare to other countries in world. The different factors are responsible for creating low skilled labours in India like high dropouts in school education, low enrollment in higher education and vocational education, in-sufficient vocational educational system etc. Some other factors like child labours situation in India, insufficient in-service training by corporate sector also responsible for the situation. There

International Journal of Mainstream Social Science 1(1): Spring 2011
44
are many other social issues responsible for high growth of low skilled labours, but these issues are not addressed in this paper. a. Low enrollment and high dropout in education. The skill shortage has its roots in the education system. High dropout rates at school level and poor enrolment levels in higher and vocational education lead to a sparsely educated workforce. The gross enrollment of students in different level of education in India is low compare to other countries. The enrollment especially in higher and vocational education is low; Table 2 depicts the gross enrollment in different countries. The gross enrollment in higher education is just around 12 % in India, which is negligible compare to other developed nations. Only 0.8% of the secondary education is enrolled in technical and vocational education, which will not fulfill the future demand of India considering its economical growth. Low enrollment is not only the issue but the dropout rate at school level is also the issue of con-cern in India. Table 3 depicts the dropout at school level; these dropout students are the major part of low skilled labours.
Table 2: Gross Enrollment Ration in education in different countries
Gross Enrol-ment Rate for Primary 2008
Survival rate to grade 5 2007
Transition From primary to lower sec-ondary 2007
Gross enrol-ment rate for Secondary 2008
Gross enrol-ment rate for tertiary
Tech &vocational enrolment ( % of total secondary enrolment)
Brunei Darus-salam
106.7 99.7 99.4 96.7 16.0 7.4
Cambodia 115.9 62.1 79.1 40.4 7.0 2.2 Indonesia 120.9 84.4 88.5 75.8 18.0 12.8 Lao PDR 111.8 66.8 78.8 43.9 13.4 0.6 Malaysia 97.9 91.7 99.0 69.1 29.7 5.9 Myanmar 115.0 71.5 73.8 49.3 10.7 - Philippines 108.2 74.0 99.1 81.4 - - Singapore - - 91.5 -- - 11.7 Thailand - - - - 16.4 Viet Nam 92.1 92.7 - - 6.4 China 112.1 - - 74.0 22.1 16.9 Japan 102.2 100.7 57.9 12.4 Korea, Rep of 103.7 99.3 98.9 97.5 96.1 12.6 India 113.1 65.8 84.0 57.0 13.5 0.8
Source: UNESCO Institute for Statistics, Technical and vocational enrolment data from World Bank
Table 3: Drop out in School education In India in year 2008 (RATES (%)
All SC ST Girls Up to Class 5 25.60 35.91 33.09 26.75 Up to Class 8 45.90 53.05 62.54 45.22 Up to Class 10 59.88 69.01 78.07 61.50
Sources: Official website of department of higher education of India www.education.nic.in/stats/statpub.asp b. Vocational training As far as vocational skills are concerned, the labour force in India compares unfavourably to oth-er countries. A vocational training has been broadly defined as a training, which prepares an in-dividual for a specific vocation or occupation. It aims at imparting training to persons in very specific fields through providing significant 'hands-on' experience in acquiring necessary skills in
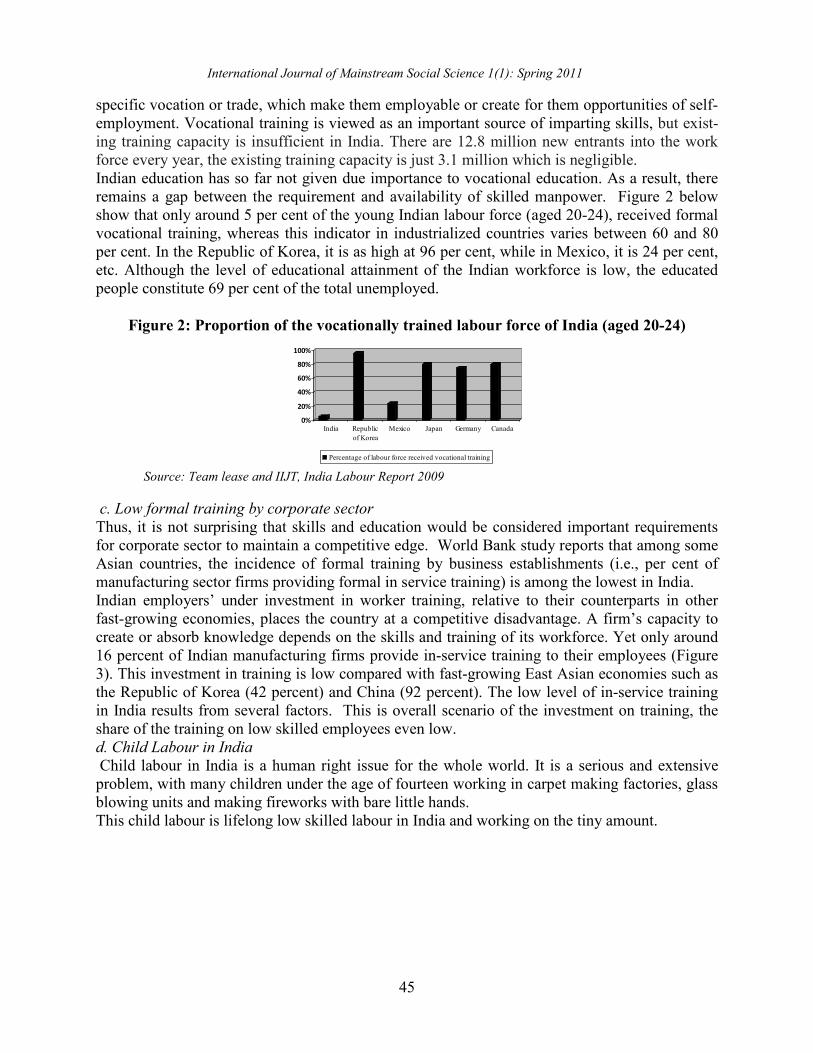
International Journal of Mainstream Social Science 1(1): Spring 2011
45
specific vocation or trade, which make them employable or create for them opportunities of self-employment. Vocational training is viewed as an important source of imparting skills, but exist-ing training capacity is insufficient in India. There are 12.8 million new entrants into the work force every year, the existing training capacity is just 3.1 million which is negligible. Indian education has so far not given due importance to vocational education. As a result, there remains a gap between the requirement and availability of skilled manpower. Figure 2 below show that only around 5 per cent of the young Indian labour force (aged 20-24), received formal vocational training, whereas this indicator in industrialized countries varies between 60 and 80 per cent. In the Republic of Korea, it is as high at 96 per cent, while in Mexico, it is 24 per cent, etc. Although the level of educational attainment of the Indian workforce is low, the educated people constitute 69 per cent of the total unemployed.
Figure 2: Proportion of the vocationally trained labour force of India (aged 20-24)
0%
20%
40%
60%
80%
100%
India Republicof Korea
Mexico Japan Germany Canada
Percentage of labour force received vocational training Source: Team lease and IIJT, India Labour Report 2009
c. Low formal training by corporate sector Thus, it is not surprising that skills and education would be considered important requirements for corporate sector to maintain a competitive edge. World Bank study reports that among some Asian countries, the incidence of formal training by business establishments (i.e., per cent of manufacturing sector firms providing formal in service training) is among the lowest in India. Indian employers’ under investment in worker training, relative to their counterparts in other fast-growing economies, places the country at a competitive disadvantage. A firm’s capacity to create or absorb knowledge depends on the skills and training of its workforce. Yet only around 16 percent of Indian manufacturing firms provide in-service training to their employees (Figure 3). This investment in training is low compared with fast-growing East Asian economies such as the Republic of Korea (42 percent) and China (92 percent). The low level of in-service training in India results from several factors. This is overall scenario of the investment on training, the share of the training on low skilled employees even low. d. Child Labour in India Child labour in India is a human right issue for the whole world. It is a serious and extensive problem, with many children under the age of fourteen working in carpet making factories, glass blowing units and making fireworks with bare little hands. This child labour is lifelong low skilled labour in India and working on the tiny amount.

International Journal of Mainstream Social Science 1(1): Spring 2011
46
Figure 3. Incidence of formal training by country (% of manufacturing sector firms providing formal in-service training)
92.4
67.4
59.1
57.9
42.3
41.4
40.7
37.1
25
16.9
0 10 20 30 40 50 60 70 80 90 100
China
Chile
Brazil
Russia
SouthKorea
Thailand
Germany
Malaysia
SriLanka
India
(Source: Based on Tan, Savchenko, Gimpelson, Kapelyushikov and Lukyanova, “Skill Shortages and Training in Russian Enterprises”, World Bank (2007))
The International Labour Organization estimates that 218 million children ages 5-17 are engaged in child labour the world over. An estimated 14 per cent of children in India between the ages of 5 and 14 are engaged in child labour activities, including carpet production. The Indian Constitu-tion says that child labour is a wrong practice and standards should be set by law to eliminate it. The Child Labour Act of 1986 implemented by the government of India makes child labour il-legal in many regions and sets the minimum age of employment at 14 years. But the Act is not giving the results still child labours increasing the percentage of low skilled labours.
Need to Develop Low Skilled Labours Over the years, highly skilled and knowledge based jobs are increasing while low skilled jobs are decreasing. This calls for future skill mapping through proper HRM initiatives. Therefore many factors which motivates India to think about the low skill labours like: a. Skill obsolescence It is obvious that growing knowledge economies have to face both kinds of obsolescence of hu-man capital. Low-skilled workers form the major group of workers who are at risk of losing their jobs due to technical or economic obsolescence of their human capital. Especially low-skilled labours suffer from technical skill obsolescence, because the physically demanding working conditions in the jobs where they are employed often accelerate the wear of their skills. Due to,

International Journal of Mainstream Social Science 1(1): Spring 2011
47
for instance, persistent back pains they may become unable to do their job properly. This usually makes their vocational skills worthless. On the other hand, in particular low-skilled workers might suffer from economic skill obsolescence due to the upgrading of skill requirements related to technological and organizational change and shifts in the sector structure of employment. Due to skill-biased technological change, low-skilled workers are crowded out of the jobs in which they were traditionally employed. This means that the ‘skill package’ the low-skilled workers can offer loses its value in the labour market. Especially the diffusion of ICT and the related or-ganizational changes are a major cause of skill obsolescence. Due to skill-biased technological and organizational change and the more or less related skill obsolescence, the labour market po-sition of low-skilled workers deteriorates. To sustain in the skilled based job market, the low skilled employees needs to improve their skill base. b. Manpower availability in India largely enough in numbers, but not in skills Most employers feel that they are able to get an adequate number of people to meet their planned requirements. However, getting people with the right skill sets is an issue, especially at supervi-sor levels and technician levels. The brief of KPMG research (figure 4) i.e. interview with indus-try player also give the scenario of the mismatch of the quality and skill of the manpower availa-ble. The perceived shortfall in numbers is largely in lower and middle levels –Technicians and Supervisors.
Figure 4: Percentage of respondents who feel about availability and skill level of manpower
0%
10%
20%
30%
40%
50%
60%
70%
80%
Manager Level Supervisor Level Technician Level
Quantity
Skills
(Source: KPMG Research – Interviews with industry players, 2008) As per the India Labour Report 2007 published by Team Lease, there exists a large disparity be-tween the nature of current jobs in India and level of training imparted. This has been shown with the aid of data from the NSSO 61st round. It is observed that of those working, around 90% is employed in ‘skill-based’ jobs (refer to Figure 5 given). This is in contrast with the figures that show, that more than 90% of our population receive no vocational training. More than 75% of the new job opportunities being created are ‘skill-based, this will gain create the need of more skilled labour force. It is estimated that 90 million jobs will be created over the next five years, of which almost half (45 million) are expected in the services sector. Of these, an estimated 7-10 million are expected to be created in hospitality, healthcare, and modern retail alone. Of these

International Journal of Mainstream Social Science 1(1): Spring 2011
48
new jobs, more than half would require some form of vocational training. Therefore The training and up gradation of the low skilled level employees can solve this issue of the immediate re-quirement of the trained workforce.
Figure 5: 90% of the current 455 million jobs in India are ‘Skill-based’
9%
91%
PredominantlyKnowledge Based
predominantly skillbased
Source: Team lease India Labour Report, 2007.
c. Poor working condition of migrated low skilled labours in other country According to the Ministry of Labour Affair (India)(MOIA), Annual Report 2007-08, about 670,000 workers emigrated from India. Figure 6 depicts the trends of the outflow of labours form Indian in other countries. The twentieth century had also witnessed large-scale migration of un-skilled and semi-skilled Indian labour to the Gulf countries in west Asia, beginning in the wake of the oil-boom of the seventies - a trend still ongoing and now encompassing small but growing numbers of skilled and professional migrants as well. However, a large majority of 70 per cent of the Indian migrants in the Gulf has comprised the semi-skilled and unskilled workers. The work-ers in these countries however do not enjoy the protection of any local labour laws. Women, working as housemaids or governesses face ill treatment in some Gulf countries, sometimes be-ing subjected to even sexual abuse (Government of India, MOIA 2006). Unskilled and se-miskilled workers working in infrastructural and development projects generally live in misera-ble conditions and are accommodated in small cramped rooms in the labour camps. Often toilet and kitchen facilities are inadequate, and working conditions are harsh. Thus, adverse working condition, unfriendly weather, inability to participate in social and cultural activities, and long periods of separation from families and relatives leading to emotional deprivation are known to have wrecked the lives of low skilled Indian workers in the Gulf (Zachariah et al 2002; GOI, MOIA Annual Report 2005-6, 17; GOI, MOIA 2006). The various forms of exploitation of un-educated and unskilled Indian expatriate workers in the other countries at the hands of the re-cruiting agents and prospective employers range from refusal to give promised employment, non-payment of promised wages, non-payment of over-time wages, undue deduction of permit fee and other fees from wages, unsuitable transport arrangements, inadequate medical facilities, denial of legal rights for redressal of complaints. Therefore these unskilled labours should be protected in India only and enough employment opportunity should be given them by retraining them.

International Journal of Mainstream Social Science 1(1): Spring 2011
49
Key Policy Initiatives taken by Government of India Government of India has taken following initiatives to develop low skilled labours like:
Figure 6: Annual Labour Outflows from India
Source: Annual Reports, Ministry of Labour, Government of India, Various Editions Encouraging Public-Private Partnership The Government of India too has realized the importance of industries in the creation of a suita-bly trained workforce for the country’s labour requirement. The DGET (Directorate General of Employment and Training, Ministry of Labour) initiated a pilot programme ‘Formation of Insti-tute Managing Committee (IMC) for ITIs’ in 1998 in collaboration with the Confederation of Indian Industry (CII) to improve cooperation between Industry and ITIs. Under this concept, In-dustry is associated as partners rather than advisors. An IMC is formed at the ITI level, which manages some of the activities of ITIs. An IMC comprises members from State Government, Industry, ITI and others. The chairperson of the committee is a representative of the local indus-try. This committee works under the supervision and control of the Steering Committee, formed at the state level. The concerned State Secretary in charge of the vocational training at state level is the chairperson of the Steering Committee. The IMCs have already been formed in 515 ITIs in 28 states. Major benefits from IMCs are active participation of industry, organizing campus in-terviews, arranging on-the-job training and industrial visits, training and development of faculty, vocational guidance and counseling, better upkeep of equipment, resource generation and utiliza-tion by the ITI itself. Up-gradation of 500 ITIs into Centers of Excellence (CoE) A scheme for upgradation of 500 ITIs into CoE to produce world-class technicians has been launched by DGET. Already, 100 ITIs have been chosen for up gradation from domestic funding while another 400 are proposed to be taken up under a project with the World Bank’s assistance for which negotiations are taking place. Multi-skill modular courses with active participation of

International Journal of Mainstream Social Science 1(1): Spring 2011
50
industry are being introduced for different industrial sectors. The industry would also be in-volved for testing and joint certification. Skill Development Initiative To fulfill the budget announcement of 2005–06, a scheme-‘Skill Development Initiatives’-to train 1 million persons in 5 years and thereafter 1 million every year is being taken up with a Public-Private Partnership model. It is envisaged to utilize available infrastructure with spare ca-pacity to impart skill training to these persons. National Mission for Skills The Prime Minister announced the setting-up of the National Mission on Skill Training in his speech on Independence Day, 2006. The Ministry of Labour and Employment accordingly has undertaken the task of setting up a ‘National Mission for Skills’ under its control for a period of 5 years initially so as to ensure that envisaged targets are met and the workforce is equipped with the necessary skills to be competitive in the world economy. Initiative taken by Corporate Sector in India The corporate have taken up various measures in order to fulfill their requirement of a skilled workforce. These include tie-ups with educational and training institutes, helping them design the curriculum, training faculty in both relevant content and teaching methodologies, offering internships, and setting up their own training schools and finishing institutes. ICICI Bank, India’s largest private-sector bank, has joined hands with Manipal University to create the ICICI Manipal Academy of Banking and Insurance; to offer a one-year residential diploma program to graduates who are selected through an entrance test. The bank and university have jointly de-signed the course content. L&T has set up construction skills training institutes where students who have successfully passed their 10th and 12th class examinations are given training in maso-nry, carpentry, electrical work. India’s biggest real estate developer, DLF brought 20,000 Indian labours from the Middle East back home to work for its projects. DLF plans to match wages and perks the workers currently earn in the Middle East. They would be brought on the rolls of the company, a departure from the current practice where most con-struction companies source labours from labour contractors. Over 5,000 workers are working for DLF-LOR in India but only 300 are directly on the rolls of the company. The company is already in the process of bringing more workers on the rolls. Suggestions Government of India and corporate sector of country has been taken the initiative to upgrade the status of low skilled labour force to become economical super power in coming ten years. The following suggestions will help to make these strategies more result oriented. 1. Demand for labour market information and analysis Labour market information and analysis (LMIA) provides accurate and up-to-date information, which can help labour markets operate more efficiently and improve labour market outcomes, and help identify decent work deficits. Demand for LMIA to inform skills policies will come from a number of different actors and each will benefit from improved information in the follow-ing ways:
• Policy-makers and planners will be able to identify areas where skills are in high demand, and have tools available to help them target resources at these areas. In addition, LMIA will enable planners to monitor progress towards defined objectives, including feedback

International Journal of Mainstream Social Science 1(1): Spring 2011
51
on when difficulties are being experienced during implementation and what action needs to be taken in order to rectify the situation.
• Managers of education and training institutions will find LMIA useful, as they will have an improved understanding of the nature and extent of the demand for skills. This will help institutions determine which programmes of study should be expanded in the near future and which ones should be cut back.
• Employers will likely to have timely and accurate information about the labour market for planning of ongoing operations (including replacement of staff) as well as for invest-ment purposes. For example, the availability of skills in a specific geographical environ-ment, combined with an enabling business environment, is an important factor influen-cing inward investment. In many countries good market intelligence is used as a means of attracting such investment.
• Unions would find LMIA information useful for bargaining purposes. For instance, they would want to know average wage levels and productivity for specific occupations in dif-ferent industrial sectors. Similarly, unions would also want to have information about the number of work permits issued, and the type of skills covered by these work permits. All of this information would be used to improve the working conditions of their members.
• Community groups would also prefer to obtain information about local skill requirements and opportunities, particularly for vulnerable groups and those who have difficulty ac-cessing the labour market, in order to assist their constituencies in improving their situa-tion.
• Students and young people would like to have improved information about career pros-pects. Young people are also interested in knowing what type of careers they could fol-low if they enrolled for a particular programme of study. It is not always possible to pro-vide an exact correlation between subject studied and type of employment, but it is possi-ble to signal which types of programmes of study are likely to lead to successful careers and which are not.
The main producers of LMI in India are: the Labour Bureau of India, The National Council of Educational Research and Training, the National Sample Survey Organization and the Central Statistical Office. But more coordination is required among these data producing agency and centralised labour statistics is required in country to avoid ambiguity 2. The development of a national manpower and skills inventory The major challenge in LMIS development in India is to improve co-ordination in the generation and use of LMI. So many organizations are involved and data generation is largely decentralized. The lack of uniformity in the use of definitions and concepts has often been highlighted by criti-ques as a serious problem, which often makes it difficult to compare survey or other data collec-tion results. Much more still needs to be done to improve the quality and coverage of LMI pre-sently being collected by various agencies in India. Many critiques also have highlighted the problems of delays in publishing survey reports, i.e.; annual and quarterly survey reports are very common in India.. There is also a lack of full coverage of data collection activities mainly due to resource limitations. 3. Improve vocational training system India’s vocational education and training systems have thus far been unsuccessful in preparing graduates to meet market needs, particularly because of a lack of interaction with industry. Aligning these systems with market needs requires restructuring– including private participation – in the management of institutions, curriculum development, and system financing; upgrading

International Journal of Mainstream Social Science 1(1): Spring 2011
52
infrastructure and instructor capabilities; stronger performance incentives for vocational educa-tion and training institutions; and regulatory reform to give training institutions greater autonomy to respond to market skill needs and incentives, to change course offerings, and both charge and retain fees. The abilities of public and private vocational education and training providers should be strengthened to make them more responsive to demand in their offerings. Curricula should be updated to reflect modern technologies and improve flexibility by mapping the supply of and demand for skills and by ensuring that the private sector is involved in curriculum design 4. Training participation Participation in training may be of great relevance to increasing the labour market participation of low-skilled workers in general and of older low-skilled workers in particular. The conse-quence of the low motivation of employers and employees for investing in training for low-skilled employees is that the training incidence increases with qualification .It is found that the training participation of low-skilled workers negligible in overall training function of corporate sector. Although the participation in training does not only increase their firm-internal employa-bility expectations, but it will also increases a worker’s chances of moving to another job in the firm-internal labour market. Therefore the corporate sector needs to design special training pro-grams for their low skilled employees. Conclusion The integration of low-skilled workers into the labour market should become one of the goals in the human resource development in India. Labour markets even in knowledge-based, highly pro-ductive and inventive economies do not necessarily lead to high employment rates of low-skilled individuals. Reduce the overall rate of unskilled and low-skilled workers through better educa-tion and formation. Quality education from primary to higher will play important role in produc-ing skilled man power so that Indian economy will not be known as economy of low skilled em-ployees. The strong reforms in educational sector specially vocational and technical sector are required in India. Indian corporate sector should strengthen strategies for life-long learning assisted by effective measures to stimulate demand and supply of learning activities for their low skilled specially. References Abella, M.( 2006), Global Competition for Skilled Workers and Consequences, in Kuptsch, C. and Pang, E. F., eds.,
Competing for Global Talent, International Institute for Labour Studies, ILO, Geneva, pp. 11-32. Jha, Praveen., Golder , Sakti .(2008), Labour Market Regulation and Economic Performance: A Critical Review of
Arguments and Some Plausible Lessons for India, Economic and Labour Market Papers, International Labour Of-fice, Geneva, pp.25-30.
Jos Sanders, Andries de Grip.(2003) , Training, Task Flexibility and Low-Skilled Workers Employability , Research Centre for Education and the Labour Market .
Khadria , Binod.(2008), India in the Global Labour Market: International Economic Relations, Mobility of the High-ly Skilled and Human Capital Formation, Institute of South Asian Studies, working paper no 32, pp.48-50.
Oesch, Daniel.(2010), What explains high unemployment among low-skilled workers? evidence from 21 OECD countries, European journal of Industrial Relations, 16(I) 2010,pp 39-50
Mitra ,Amit.(2002), InFocus Programme on Skills, Knowledge and employability, International Labour Office Ge-neva.
Shrama, Alakh.(2006), Flexibility, Employment and Labour Market Reforms in India , Economic and Political Weekly May 27, 2006,pp.78-85
Singh , Ajit.(2007) , “, Industrial Revolutions in India, and China and Labour Markets in Advanced Coun-tries:Implications for National and International Economic Policy”, Policy Integration Department, Working Pa-per No. 81,Iternational Labour Office, Geneva

International Journal of Mainstream Social Science 1(1): Spring 2011
53
Sparreboom.,Marcus,Powell.(2009), Labour market information and analysis for skills development ,International Labour Office, Geneva, pp . 17-20.
Indian Labour Report.(2009) , The Geographic Mismatch & A Ranking of Indian States by their Labour Ecosystem (Labour Demand, Labour Supply, Labour Laws), AReport By TeamLease and IIJT
Indian Labour Report.(2008) , The Right to Rise; Making India's Labour Markets Inclusive, By TeamLease Services Industrial Training Institute of India.(2003), The Efficiency study report, Sub regional Office for South Asia, Inter-
national Labour Office, New Delhi. Labour and social trends in ASEAN.(2010) , International labour organizations, Regional office for Asia and the
Pacific.

International Journal of Mainstream Social Science 1(1): Spring 2011
54
GUIDELINES TO AUTHORS FOR SUBMISSION OF ARTICLE
The Genesis
International Journal of Mainstream Social Science (IJMSS) is a multidisciplinary peer-reviewed biannual journal devoted to publishing research papers in all related fields of social sciences. The Journals invites the submission of manuscripts in anthro-pology, sociology, human geography, economics, history, environmental studies, business administration, home science, public health, political science, demography along with their edges. Guidelines to Authors
All articles in IJMSS are published in English biannually in Spring and Autumn. Manuscript must be typed in Microsoft word (Times New Roman with 12 font size, 1.5 line spacing, 1” both sides margin and British spelling throughout). No manuscript should ordinarily exceed twenty typed pages including tables, graphs, figures, notes and references. The title, author(s) including affiliation, correspondence and e-mail address, abstract (not exceeding 250 words), and acknowledgements, if any should be clearly specified in the first page of the manuscript. Notes should be circumvented if possible, but while necessary must be put at the bottom of the text (endnotes) followed by a complete list of references used. The contributors should ensure that they are not infringing copyright. Submission of a manuscript implies that it contains unpublished original work and is not being considered for publication elsewhere. References must be cited in unnumbered alphabetical order as follows: Journals: Sarkar, S. (2004), Extending Social Security Coverage to the Informal Sector in India, Social Change, 34(4): 112-130. Books: Smith, K.R. (1997), Biofuels, Air Pollution and Health, Plenum Press, New York. Edited Books: Sarkar, S. (2005), Natural Resource Environment, Pollution and Women Health, In: T. Sabanna (ed.), WTO and the Agriculture,
Serials Publications, New Delhi. Sarkar, S. (ed.) (2010), Tackling Poverty Challenges: Key Approaches and Policy Implications, Lambert Academic Publishing,
Germany. References in Text: (Sarkar 2004: 112; Smith 1997) Tables/ Figures in Text: Each table/graph/figure should be marked in the text in numerical order with suitable caption. No scanned tables, figures, graphs etc. are acceptable in the article. Electronic submission of manuscript is acceptable. Electronic version of the manuscript must be submitted directly to the Series Editor. All technical queries may be addressed to Dr. Siddhartha Sarkar, Series Editor and Director, Asian School of Management and Technology at [email protected] Published by the Director, Asian School of Management and Technology, India The views articulated in this Journal are those of the authors and do not necessarily correspond to the views of the editors.
Brown Walker Press
23331 Water Circle, Boca Raton, FL 33486-8540, USA www.brownwalker.com/ASMT-journals.php
Asian School of Management and Technology (All Rights Reserved)