international journal of scientific & technology … · undecided on their anxiety level,...
TRANSCRIPT

INTERNATIONAL JOURNAL OF SCIENTIFIC & TECHNOLOGY RESEARCH VOLUME 7, ISSUE 5, MAY 2018 ISSN 2277-8616
90 IJSTR©2018 www.ijstr.org
Concrete-Pictorial-Abstract Approach On Students’ Attitude And Performance In
Mathematics
Nino Richard R. Salingay, Denis A. Tan
Abstract: This study inspected the effectiveness of CPA approach to Grade 8 students of Bukidnon National High School in terms of students’ attitude and performance. Specifically it aimed to a.) describe the attitude of the students when exposed to CPA approach and to those exposed to non-CPA approach before and after the intervention in terms of: attitudes toward success in math, Math anxiety, motivation, usefulness of Math and confidence in learning math, b.) compare the level of performance in Mathematics of the students once exposed to CPA approach and those exposed to non-CPA approach in terms of: pre-test scores, post-test scores and retention test scores, c.) differentiate the students’ attitude as exposed to CPA approach and those exposed to non-CPA approach, and d.) ascertain the significant difference between the performance of the students exposed to CPA approach and those exposed to non-CPA approach in terms of: post-test scores and retention test scores. A quasi-experimental research design was used in this study; it uses two sections of Bukidnon National High School. One is the experimental group and the other was the controlled group. These two (2) group undergone pre-test, post-test and retention test. The materials used to determine the achievement of the students is a teacher-made test. The material used for the attitude is Fennema-Sherman Mathematics Attitude Test. Descriptive statistics and ANCOVA were used for the analysis of the study. It was found out that the attitude of the students during the pre-test and post-test are positive. The level of performance of the two groups in the pre-test is below average level. During the post-test and retention test, the performance of students in non- CPA group is on average level and students in CPA group are on above average level. It was also found out that students have positive attitude towards success and usefulness of Math and undecided on their anxiety level, motivation level and on their confidence in learning Math during the pre-test. During the post-test, all components remain the same instead to the confidence in learning Math of CPA group of student wherein form neutral during the pre-test, it becomes positive during the post-test. The study also found out that the attitude of the students are comparable or has no significant difference. However, the performance in the post-test and retention test of CPA group of students is significantly higher than the performance of non-CPA group of students. This study would benefit the future researchers, mathematics educators, students and administrators and this will give them an idea about CPA approach. Index terms: Attitude, Concrete-Pictorial-Abstract (CPA) approach, Performance in Mathematics
————————————————————
1 INTRODUCTION Mathematics is accepted as the partner of Science in improving one’s knowledge. It plays a great role in any field of knowledge for it solves the numeric problems that may help in acquiring new set of inventions. It is known to be the back bone of science. Even the amazing works of engineers, architects, technologies and in all other fields of knowledge are greatly associated with the concept of Mathematics. A good foundation in Mathematics will lead to a greater performance of the students in their advance Mathematics. Teachers in elementary and secondary schools should ensure strong foundation in Math to provide more chances of the student to acquire another set of knowledge for the tertiary level easily, because if the student was not able to master the basic skills in Math, it will lead to a greater chance of having a low performance in the tertiary level. Basic skills should be developed and mastered by the student in early years in school. Otherwise, a negative attitude and performance will occur.
A part of the vision of the Department of Education is to continuously improve itself to better serve its stakeholders. From traditional way to more effective teaching strategies and approach, and every possible means were used by the institution just to improve the performance of the students. However, despite the dream of the Filipinos to enhance the curriculum; the students still fail to achieve the competencies in the curriculum guide. In fact, the National Achievement test (NAT) result of Bukidnon National High School (BNHS) in Math for School Years 2012-2013, 2013-2014 and 2014-2015 are 52.17, 63.17 and 44.47, respectively (NETRC, 2015). For School Year 2014-2015, Mathematics NAT result in BNHS is the lowest of all the other fields. A low mean percentage score in NAT exam indicates that students have low performance and retention level in Mathematics. One factor that may affect the performance of the students is on how the teacher provides meaningful representations and situations to the students (Kang, 2012). Thus, a challenge given to the teachers is to provide quality experience to help students perform better and even retain the knowledge given to them. The book of Corpus and Salandanan (2013) stated that researchers found out that the most effective approaches-resulting in 75 percent and 90 percent retention rate are learning by doing and learning by teaching others, respectively. This means that students want to be part of their learning and need to be given a meaningful learning experience on the topic given to them. A good learning experience will also improve the attitude level of the student. A positive attitude of the students towards Mathematics is governed by their experiences (Durmus and Karakirik, 2006). The more they appreciated their learning experience, the more that a positive attitude will follow. Thus, students should be given meaningful experience on every topic given to them to ensure a positive response on their attitude. Teachers,
___________________________________
Nino Richard R. Salingay is currently pursuing his doctorate degree in Educational Administration in Central Mindanao University, Philippines. He is a secondary high school teacher at Bukidnon National High School. +639362341063, [email protected]
Denis A. Tan is a faculty of the College of Education, Central Mindanao University (CMU), Philippines. She is currently the School Principal of the CMU Laboratory High School and the Director of the Office of Admissions, Scholarships and Placement in the same university.
+639177103100, [email protected]

INTERNATIONAL JOURNAL OF SCIENTIFIC & TECHNOLOGY RESEARCH VOLUME 7, ISSUE 5, MAY 2018 ISSN 2277-8616
91 IJSTR©2018 www.ijstr.org
researchers and administrators used many possible means to increase the attitude and performance of the students. Nevertheless, a problem was observed by Ojose and Sexton (2009) wherein they found out in their study that in average, students like Mathematics and Science in elementary grades but they dislike both subjects more in junior and senior high school. They also stated that of all subjects, Mathematics is the least liked subject. With the various problems that Mathematics education is facing nowadays, especially with the performance and attitude of the students towards the subject, an approach commonly used in Singapore (Yoong, 1999), named Concrete-Pictorial-Abstract (CPA) approach is the way of teaching that the researcher explored. The researcher checked how it affects the performance and attitude of a student towards Mathematics.
1.1 Statement of the Problem The main purpose of this study was to evaluate the effectiveness of concrete-pictorial-abstract approach in BNHS, Malaybalay City, Bukidnon and on how it affects the attitude of the students. Specifically, it aimed to answer the following questions: 1. What are the attitude of the students when exposed to
CPA approach and to those exposed to non-CPA approach before and after the intervention in terms of: a. attitudes toward success in Math; b. Math anxiety; c. motivation; d. usefulness of Math; and e. confidence in learning Math?
2. What is the level of performance in Mathematics of the students once exposed to CPA approach and those exposed to non-CPA approach in terms of: a. pre-test scores: b. post-test scores; and c. retention-test scores?
3. Is there significant difference on students’ attitude as exposed to CPA approach and those exposed to non-CPA approach?
4. Is there significant difference between the performance of the students exposed to CPA approach and those exposed to non-CPA approach in terms of: a. post-test scores; and b. retention test scores?
2 METHODOLOGY
2.1 Research Design A quasi-experimental research design was used in this study. The two groups are not similar and at the beginning their performance level and attitude level are different. The participants of this study are the students enrolled in Special Program in the Arts (SPA). They are the students that mastered one field in the arts. The study was conducted to two sections, and they were given pre-test, post-test and retention test. One (1) section was the experimental group and the other section served as the control group. The control group utilized the K to 12 module book and thought using traditional way of teaching Math. The experimental group utilized a copy of CPA module and was taught using CPA approach. An attitude checklist and pre-test were administered before the start of the experiment. The study lasted exactly one (1) grading period, from June to August,
2016. After the experiment was done, the students took the post-test which is the same as the pre-test, and an attitude checklist. Two weeks after the post-test, the retention test was conducted to check their retention level of the students.
2.2 Sampling Procedure Among the 22 sections of grade 8 in BNHS, two (2) sections were selected as the respondents. After the two (2) sections were identified, a toss coin was done to be fair, to identify which section will be the experimental and the control group. The experimental group was taught using CPA approach, utilizing CPA approach module developed by the researcher. The control group was taught using the traditional way of teaching Math, utilizing the K to 12 module for Grade 8 Mathematics for the whole duration of the study.
2.3 Locale of the Study The study was conducted in one of the public schools in the Division of Malaybalay City, specifically at Bukidnon National High School (BNHS). This school is located at Fortich St., Brgy. 3, Malaybalay City, Bukidnon. It is he Capital City of the Province of Bukidnon. It is located beside Bukidnon State University. The school has a grade 8 population of 1196. It offers four (4) special programs namely: Special Program of Arts (SPA), Special Program in Sports (SPS), Special Education (SPED) and Enhance Basic Education Program (EBEP).
2.4 Participants of the Study The respondents of the study were the two (2) intact sections of Grade 8 in Bukidnon National High School of School Year 2016-2017. These two sections belong to the Special Program in the Arts (SPA). They specialized one of the following: dance, vocals, strings, theatre arts, creative writing and visuals. There were 40 students in each section, a total of 80 respondents.
2.5 Instrumentation Prior to the conduct of the study the researcher made a 120 item test which includes the following topics: special products, factoring and linear equations. This was conducted to the grade 9 students for reliability testing. After it was subjected to reliability test with the value of Kr21 .896, only 60 reliable items were used by the researcher as an instrument for the conduct of the study. It was then used as the pre-test, post-test and retention-test to measure the performance level of the students. The over-all mean score was interpreted using the data presented below.
Range Level of Proficiency
81%-100% Exemplary
61%-80% Above Average
41%-60% Average
21%-40% Below Average
1%-20% Deficient
Mathematics attitude scale used in this study was that of Fennema and Sherman (1976) and was adapted in the study of Duque (2013) with Cronbach Alpha value of .924. Only 5 sub-components were used in the study namely: attitudes toward success in Math, Math anxiety, Motivation, Usefulness of Math and Confidence in Learning Math. The questionnaire was administered to the two groups before and after the

INTERNATIONAL JOURNAL OF SCIENTIFIC & TECHNOLOGY RESEARCH VOLUME 7, ISSUE 5, MAY 2018 ISSN 2277-8616
92 IJSTR©2018 www.ijstr.org
intervention was given. The mean of each item as well as the over-all mean score was interpreted using the data presented. Rating Scale Descriptive Rating Interpretation
5 4.51-5.00 Strongly Agree Highly Positive 4 3.51-4.50 Agree Positive 3 2.51-3.50 Uncertain Neutral 2 1.51-2.50 Disagree Negative 1 1.00-1.50 Strongly Disagree Highly Negative
The researcher designed a CPA learning guide intended for the Concrete-Pictorial-Abstract Approach Group (CPAAG) that includes the following topics: factoring, special products and linear function. It was subjected to content and construct validity by the Mathematics mentors of the College of Education, Central Mindanao University. It was also evaluated by the Mathematics Department chairperson of BNHS.
2.6 Data Gathering Procedures In the research procedure, the ethical consideration and the data gathering process were discussed. Ethical considerations were deemed necessary to ensure the employment of approved procedures.
2.7 Ethical Procedures The researcher passed an ethics statement to all individuals involved in the study. The distribution of ethical statement was done personally by the researcher together with the attached letter of permission and approval note. The ethics statements and permission to conduct the study were directed to the principal and to the superintendent. The advisers of the two (2) sections being studied were also given a copy of the ethics statement and consent to the respondents. 2.8 Concrete-Pictorial-Abstract (CPA) Approach Class The thing that makes CPA class unique is that topics are presented in three ways. First is in concrete way or using manipulative materials and models. Second is the use of figures, pictures and tables or any two dimensional objects. Lastly is the use of symbols in Math such as letters and numbers. Every topic is presented using these three representations. In every representation the teacher presents the topic to the students and gives a short evaluation before proceeding to the next representation. After the three representations, the teacher will give an evaluation and let the students freely use any of the representations. The lesson will
always end up with a reflection about the representation that they want to use in a certain topic. The evaluation given to the students are the same to the non-CPA approach class. They only differ on the lesson proper. 2.9 Non-CPA approach Class The non-CPA means the ordinary way of teaching Mathematics. The students utilized the Grade 8 Mathematics K to 12 module. The topic was introduced according to the guidelines used by the K to 12 curriculum. The teacher will guide the students to inquire another set of knowledge. Every topic was introduced to the students using guide questions and activities. 2.10 Statistical Technique The data collected were analyzed based on the problems of the study. The students’ performance scores including their attitude scores were analyzed using descriptive statistics such as mean and standard deviation. To determine the significant difference between the two groups in terms of their performance and attitude level, the Analysis of Co-Variance (ANCOVA) was applied. This statistical tool determines the significant difference of increase or decrease of the two groups. The pre-test serves as the covariate.
3 RESULTS AND DISCUSSIONS
This section presents the analysis and interpretation of data gathered from the respondents of the study. The order of presentation follows the sequence of the problems identified in the study.
3.1 Attitude of the Students towards Success in Math Table 1 shows the attitude of the students toward success in Math before the intervention was given. The three (3) higher mean scores of students under the CPAAG are: “I am happy to get good grades in Math” 4.83 (strongly agree), “Being first in a Math competition would make me happy” 4.55 (strongly agree) and “It would be great to win a prize in Math” 4.30 (agree). For the students under non-CPAAG the three higher mean scores are the following statements: “I am happy to get good grades in Math” 4.68 (strongly agree), “Being first in a Math competition would make me happy” 4.20 (agree) and “If I get good grades in Math, I would try to hide it” 4.10 (agree).
Table 1. CPAAG and non-CPAAG attitude towards success in Math before intervention
ATTITUDES TOWARDS MATHEMATICS CPAAG Non-CPAAG
Attitudes toward success in Math Mean DR QI Mean DR QI
1. I like Math. 3.85 Agree Positive 3.50 Agree Positive
2. I’d be proud to be the outstanding Math student.
4.00 Agree Positive 3.98 Agree Positive
3. I am happy to get good grades in Math. 4.83 Strongly Agree
Highly Positive 4.68 Strongly Agree Highly Positive
4. It would be great to win a prize in Math. 4.30 Agree Positive 4.08 Agree Positive
5. Being first in a math competition would make me happy.
4.55 Strongly Agree
Highly Positive 4.20 Agree Positive
6. Being thought of as smart in Math would be a great thing.
4.25 Agree Positive 3.90 Agree Positive

INTERNATIONAL JOURNAL OF SCIENTIFIC & TECHNOLOGY RESEARCH VOLUME 7, ISSUE 5, MAY 2018 ISSN 2277-8616
93 IJSTR©2018 www.ijstr.org
Note: indicators with * symbols are stated negatively, thus, scoring is reversed.
Legend: Range Descriptive Rating (DR) Qualitative Interpretation (QI)
4.51-5.00 Strongly Agree Highly Positive (HP) 3.51-4.50 Agree Positive (P) 2.51-3.50 Uncertain Moderately Positive (MP) 1.51-2.50 Disagree Negative (N) 1.00-1.50 Strongly Disagree Highly Negative (HN)
With this result it follows that before the conduct of the study, the students under the CPAAG would be very happy if they can get good grades in Math. Being first in Math competition also would make them happy because of having a positive response on this statement. They also look into a chance of winning a prize in Math. The students under the non-CPAAG highly positively believe that they will be happy if they can get good grades in Math. They also have a positive response on becoming first in a Math competition and whenever they have good grades in Math they will never try to hide it. These imply that whenever they have done well in Math, it would bring happiness to them. The lower three (3) mean scores of the students under CPAAG are the following statements: “I don’t like people to think I’m smart in Math” 3.03 (uncertain), “It would make kids like me less if I were a really good math student” 3.43 (uncertain) and “Other kids will think I’m weird if I get good grades in Math” 3.58 (agree). The three (3) statements where the students under the non-CPAAG have lower mean scores are: “I don’t like people to think I’m smart in Math” 3.15 (uncertain), “It would make kids like me less if I were a really good Math student” 3.38 (uncertain) and “I like Math” 3.50 (agree). These implies that prior to the conduct of the study, students under CPAAG are undecided if other people will like them the same way if they are smart in Math. They cannot determine also if kids will still like them if they are good in Math. However, they don’t believe that kids will think that they are weird if they will like Math. The students under the non-CPAAG cannot decide whether other people will still like them if they are good in Math. They cannot figure out also if kids are less likely to like them if they are good in Math. Nonetheless, they positively accept that they like Math. The over-all mean score of the students under the CPAAG for attitude towards success in Math before the conduct of the study is 3.93 (agree). This denotes that they have positive attitude towards success in Math. The students under the non-CPAAG have an over-all mean score of 3.86 (agree) which also signify that they positively believe in the given statements. It follows that prior to the conduct of the study, the two (2) groups have moderately positive attitude towards
success in Math. This negates the result of the study of Nambatac (2015) where it was found out in her study that the respondents are neutral or undecided about their attitude towards success in Math. However, the finding that the highest mean score of the student is that the respondents want to have good grades in Math is parallel to the findings of this study. Table 2 presents the attitude of the students towards success in Math after the intervention. It shows that after the conduct of the study in “attitudes toward success in Math” the three (3) statements where the students under the CPAAG have higher mean scores are: “I am happy to get good grades in Math”, “Being first in a Math competition would make me happy” and “I’d be proud to be the outstanding Math student” where they have mean scores of 4.95 (strongly agree), 4.48 (strongly agree) and 4.35 (agree), respectively. The respondents under non-CPAAG have higher mean scores in the following statements: “I am happy to get good grades in Math”, “I’d be proud to be the outstanding Math student” and “It would be great to win a prize in Math”, where their mean scores are 4.93 (strongly agree), 4.53 (strongly agree) and 4.50 (agree), respectively. This signifies that the CPAAG vibrantly wants to get good grades in Math. Moreover, it would make them happy if they would be first in any math competition. They also feel very proud if they become outstanding in Math. Same with non-CPAAG, it would bring happiness to them if they can get good grades in Math. To become an outstanding student in Math also would make them feel proud that is why they responded positively in this statement. In addition, winning a prize in Math would make them feel great. It means that whenever they become successful in any Math competition or activity it would make them feel awesome. The lower three mean scores of the students under CPAAG are in the following statements: “attitude towards success in Math” are the statements “I don’t like people to think I’m smart in Math”, “It would make kids like me less if I were a really good Math student” and “Other kids will think I’m weird if I get good grades in Math” with mean scores of 3.25 (uncertain), 3.43 (uncertain) and 3.58 (agree), respectively. The respondents under the non-CPAAG are
7. Winning a prize in Math would make me feel embarrassed.*
3.80 Agree Positive 3.60 Agree Positive
8. Other kids will think I’m weird if I get good grades in Math.*
3.58 Agree Positive 3.78 Agree Positive
9. If I get good grades in Math, I would try to hide it.*
3.88 Agree Positive 4.10 Agree Positive
10. If I got the highest grade in Math, I’d prefer no one knew.*
3.68 Agree Positive 4.00 Agree Positive
11. It would make kids like me less if I were a really good Math student.*
3.43 Uncertain Moderately Positive
3.38 Uncertain Moderately Positive
12. I don’t like people to think I’m smart in Math.*
3.03 Uncertain Moderately Positive
3.15 Uncertain Moderately Positive
Mean 3.93 Agree Positive 3.86 Agree Positive

INTERNATIONAL JOURNAL OF SCIENTIFIC & TECHNOLOGY RESEARCH VOLUME 7, ISSUE 5, MAY 2018 ISSN 2277-8616
94 IJSTR©2018 www.ijstr.org
uncertain in these three (3) statements: “I don’t like people to think I’m smart in Math”, “It would make kids like me less if I were a really good Math student” and “Winning a prize in Math would make me feel embarrassed” with mean scores of 3.25, 3.33 and 3.38, respectively. It follows that students under CPAAG after the intervention was done are still doubtful if other people would still like them if they are smart in Math. They don’t also believe that kids will think that they are weird if they have good grades in math. The same with non-CPA group of students they were undecided if they like other people to think that they are smart in Math or not. They were also undecided if they will feel embarrassed if they can win a prize in Math. This implies that in some point they are neutral or uncertain on how other people think about them if they are good in Math. The level of the attitude of the students
under CPAAG during the post-test was represented by their over-all mean score of 3.97 (agree). This means that in general they have a positive attitude towards success in Math. The students in non-CPAAG have their over-all mean score of 4.03 (agree). This simply expresses a positive attitude towards success in Math. This is parallel to the findings of Duque (2013) in his study about metacognitive process wherein he found out that students have positive attitude towards success in Math. He also noticed that students are likely to have good grades in Math but they don’t want that other people would think that they like Math. This finding is the same as the findings in this study where students want to have good grades in Math but they don’t like to get pressured that is why they don’t like that other people would think that they are good in Math.
Table 2. CPAAG and non-CPAAG attitude towards success in Math after the intervention
Note: indicators with * symbols are stated negatively, thus, scoring is reversed.
Legend: Range Descriptive Rating (DR) Qualitative Interpretation (QI) 4.51-5.00 Strongly Agree Highly Positive (HP) 3.51-4.50 Agree Positive (P) 2.51-3.50 Uncertain Moderately Positive (MP) 1.51-2.50 Disagree Negative (N) 1.00-1.50 Strongly Disagree Highly Negative (HN)
3.2 Math Anxiety Table 3 presents the students’ Math anxiety level before the intervention. Students under the CPAAG have higher mean value in the following statements: “I get a sick feeling when I
think of trying to do math problems” 3.40 (uncertain), “Math makes me feel uncomfortable, restless, irritable, and impatient” 3.25 (uncertain) and “My mind goes blank and I am unable to think clearly when working math problems” 3.15
CPAAG Non-CPAAG
Attitudes toward success in Math Mean DR QI Mean DR QI
1. I like Math. 4.23 Agree Positive 4.15 Agree Positive
2. I’d be proud to be the outstanding Math student.
4.35 Agree Positive 4.53 Strongly Agree Highly Positive
3. I am happy to get good grades in Math. 4.95 Strongly Agree Highly Positive 4.93 Strongly Agree Highly Positive
4. It would be great to win a prize in Math. 4.28 Agree Positive 4.50 Agree Positive
5. Being first in a Math competition would make me happy.
4.48 Strongly Agree Highly Positive 4.40 Agree Positive
6. Being thought of as smart in Math would be a great thing.
3.95 Agree Positive 4.43 Agree Positive
7. Winning a prize in Math would make me feel embarrassed.*
3.75 Agree Positive 3.38 Uncertain Moderately Positive
8. Other kids will think I’m weird if I get good grades in Math.*
3.58 Agree Positive 3.53 Agree Positive
9. If I get good grades in Math, I would try to hide it.*
3.83 Agree Positive 4.03 Agree Positive
10. If I got the highest grade in Math, I’d prefer no one knew.*
3.60 Agree Positive 3.93 Agree Positive
11. It would make kids like me less if I were a really good Math student.*
3.43 Uncertain Moderately Positive
3.33 Uncertain Moderately Positive
12. I don’t like people to think I’m smart in Math.*
3.25 Uncertain Moderately Positive
3.25 Uncertain Moderately Positive
Mean 3.97 Agree Positive 4.03 Agree Positive

INTERNATIONAL JOURNAL OF SCIENTIFIC & TECHNOLOGY RESEARCH VOLUME 7, ISSUE 5, MAY 2018 ISSN 2277-8616
95 IJSTR©2018 www.ijstr.org
(uncertain). The students under the non-CPAAG have higher mean value in the following statements: “I get a sick feeling when I think of trying to do math problems” 3.53 (agree), “Math makes me feel uncomfortable, restless, irritable, and impatient” 3.45 (uncertain) and “A math test would scare me” 3.20 (uncertain). Students tend to have high anxiety level that is why most of their responses are uncertain and disagree. For students under CPAAG, they are doubtful of what they feel whenever they encounter math problems. This indicates that they feel ill whenever they encounter problems in Math. For students under the non-CPAAG, they are neutral or they are uncertain of what they feel whenever Math time comes and when solving problems in Math. Prior to the conduct of
the study, the two groups of students show that they were anxious in dealing math problems. The table also shows that in Math anxiety the three statements where the students under CPAAG have lower mean scores are: “I am almost never get nervous during a math test” 2.03 (disagree), “I don’t usually worry about being able to solve math problems” 2.48 (disagree) and “I am usually calm during math tests” 2.58 (uncertain). The students under the non-CPAAG have lower mean scores in the following statements: “I don’t usually worry about being able to solve math problems”, “Math does not scare me at all” and “I am almost never get nervous during a math test” with mean scores of 2.40 (disagree), 2.53 (uncertain) and 2.65 (uncertain), respectively.
Note: indicators with * symbols are stated negatively, thus, scoring is reversed. Legend:
Descriptive Rating (DR) Qualitative Interpretation (QI) Strongly Agree Highly Positive (HP) Agree Positive (P) Uncertain Moderately Positive (MP) Disagree Negative (N) Strongly Disagree Highly Negative (HN)
Students under CPAAG have shown that they get nervous during math test, solving math problems makes them feel worry and during math test they can’t explain what they feel. Students under the Non-CPAAG also feel worry in solving
math problems and cannot explain what they feel during math test. They cannot decide also if they were scared in Math or not. The over-all mean score of the students under CPAAG in Math anxiety is 2.86 (uncertain) and that of students under
Table 3. CPAAG and non-CPAAG level of Math anxiety before intervention
CPAAG Non-CPAAG
Math anxiety Mean DR QI Mean DR QI
13. Math does not scare me at all 2.85 Uncertain Moderately
Positive 2.53 Uncertain
Moderately Positive
14. It wouldn’t bother me at all to take more math courses
2.60 Uncertain Moderately
Positive 2.68 Uncertain
Moderately Positive
15. I don’t usually worry about being able to solve math problems.
2.48 Disagree Negative 2.40 Disagree Negative
16. I am almost never get nervous during a math test.
2.03 Disagree Negative 2.65 Uncertain Moderately Positive
17. I am usually calm during math tests 2.58 Uncertain Moderately
Positive 2.88 Uncertain
Moderately Positive
18. I am usually calm in math class. 3.03 Uncertain Moderately
Positive 3.20 Uncertain
Moderately Positive
19. Math usually makes me feel uncomfortable and nervous.*
3.08 Uncertain Moderately
Positive 2.70 Uncertain
Moderately Positive
20. Math makes me feel uncomfortable, restless, irritable, and impatient.*
3.25 Uncertain Moderately
Positive 3.45 Uncertain
Moderately Positive
21. I get a sick feeling when I think of trying to do math problems.*
3.40 Uncertain Moderately
Positive 3.53 Agree Positive
22. My mind goes blank and I am unable to think clearly when working math problems.*
3.15 Uncertain Moderately
Positive 3.20 Uncertain
Moderately Positive
23. A math test would scare me.* 3.03 Uncertain Moderately
Positive 3.23 Uncertain
Moderately Positive
24. Math makes me feel uneasy, confused, and nervous.*
2.83 Uncertain Moderately
Positive 2.90 Uncertain
Moderately Positive
Mean 2.86 Uncertain Moderately
Positive 2.94 Uncertain
Moderately Positive

INTERNATIONAL JOURNAL OF SCIENTIFIC & TECHNOLOGY RESEARCH VOLUME 7, ISSUE 5, MAY 2018 ISSN 2277-8616
96 IJSTR©2018 www.ijstr.org
non-CPAAG is 2.94 (uncertain). Both groups disagreed on statement that they won’t worry in solving math problems. It means that they feel worried in solving Math problems. Thus, prior to the conduct of the study the anxiety level of the students are neutral. It conforms to the study of Bersano (2016) wherein her study found out that during the pre-test the respondents have moderate level of anxiety or neutral. Table 4 display the anxiety level of the students after the intervention. The four (4) higher mean scores of the students under the CPAAG are in the following statements “I am usually calm in math class” 3.28 (uncertain), “Math makes me feel uncomfortable, restless, irritable, and impatient” 3.25 (uncertain), “My mind goes blank and I am unable to think clearly when working math problems” 3.15 (uncertain) and “I get a sick feeling when I think of trying to do math problems” 3.15(uncertain). The respondents under non-CPAAG have higher mean scores in the statements “I am usually calm in math class” 3.75 (agree) and “Math does not scare me at all” 3.43 (uncertain). Students under CPAAG are neutral in all of the statements. They can’t explain what they feel during math
class and every time they are solving math problems. They simply can’t decide if they were anxious or not. Respondents belong to Non-CPAAG are undecided if they were scared in Math or not but they feel calm during their math class.The three (3) lower mean scores of the students under CPAAG in their Math anxiety are in the following statements: “I am almost never get nervous during a math test”, “I am usually calm during math tests”, and “I don’t usually worry about being able to solve math problems” with mean scores of 2.58 (uncertain), 2.65 (uncertain) and 2.78 (uncertain) respectively. The respondents under non-CPAAG have their lower mean scores in the following statements: “I don’t usually worry about being able to solve math problems”, “Math makes me feel uneasy, confused, and nervous”, and “Math usually makes me feel uncomfortable and nervous” with mean score of 2.88 (uncertain), 3.03 (uncertain) and 3.05 (uncertain), respectively. Students under the CPAAG and non CPAAG were undecided of their feelings during math test. They also feel nervous and uncomfortable during math time.
Note: indicators with * symbols are stated negatively, thus, scoring is reversed. Legend:
Range Descriptive Rating (DR) Qualitative Interpretation (QI) 4.51-5.00 Strongly Agree Highly Positive (HP)
3.51-4.50 Agree Positive (P) 2.51-3.50 Uncertain Moderately Positive (MP) 1.51-2.50 Disagree Negative (N) 1.00-1.50 Strongly Disagree Highly Negative (HN)
Table 4. CPAAG and non-CPAAG level of Math anxiety after intervention
CPAAG Non-CPAAG
Math anxiety Mean DR QI Mean DR QI
13. Math does not scare me at all 2.95 Uncertain Moderately
Positive 3.43 Uncertain
Moderately Positive
14. It wouldn’t bother me at all to take more math courses
2.80 Uncertain Moderately
Positive 3.38 Uncertain
Moderately Positive
15. I don’t usually worry about being able to solve math problems.
2.78 Uncertain Moderately
Positive 2.88 Uncertain
Moderately Positive
16. I am almost never get nervous during a math test.
2.58 Uncertain Moderately
Positive 3.13 Uncertain
Moderately Positive
17. I am usually calm during math tests 2.65 Uncertain Moderately
Positive 3.25 Uncertain
Moderately Positive
18. I am usually calm in math class. 3.28 Uncertain Moderately
Positive 3.75 Agree Positive
19. Math usually makes me feel uncomfortable and nervous.*
3.03 Uncertain Moderately
Positive 3.05 Uncertain
Moderately Positive
20. Math makes me feel uncomfortable, restless, irritable, and impatient.*
3.25 Uncertain Moderately
Positive 3.38 Uncertain
Moderately Positive
21. I get a sick feeling when I think of trying to do math problems.*
3.15 Uncertain Moderately
Positive 3.38 Uncertain
Moderately Positive
22. My mind goes blank and I am unable to think clearly when working math problems.*
3.15 Uncertain Moderately
Positive 3.38 Uncertain
Moderately Positive
23. A math test would scare me.* 3.03 Uncertain Moderately
Positive 3.23 Uncertain
Moderately Positive
24. Math makes me feel uneasy, confused, and nervous.*
3.13 Uncertain Moderately
Positive 3.03 Uncertain
Moderately Positive
Mean 2.98 Uncertain Moderately
Positive 3.27 Uncertain
Moderately Positive

INTERNATIONAL JOURNAL OF SCIENTIFIC & TECHNOLOGY RESEARCH VOLUME 7, ISSUE 5, MAY 2018 ISSN 2277-8616
97 IJSTR©2018 www.ijstr.org
The over-all mean score of students under CPAAG in math anxiety is 2.98 (uncertain) and for students under the non-CPAAG is 3.27 (uncertain). Both groups were uncertain of their anxiety level in Math. This means that the some students feel ill in solving math problems or during math time. This negates the study of Orongan (2007) wherein his study found out that the respondents were anxious, unlike in this study where the respondents were undecided about their anxiety level. It also negates with the study of Bersano (2016) wherein she found out in her study that the respondents have low anxiety level during the post-test. This means that her respondents were not-anxious, unlike this study where the students cannot decide about their anxiety level in Math.
3.3 Motivation The 5 presents the motivation level of students before the intervention. Students under the CPAAG have higher mean scores in the following statements: “I am challenged by math problems I cannot understand right away” 3.65 (agree), “When I have a question that doesn’t get answered in math class, I keep thinking about it” 3.65 (agree) and “Math puzzles are boring” 3.53 (agree). The three higher mean values of students under the non-CPAAG are in the following statements: “When I have a question that doesn’t get answered in math class, I keep thinking about it” 3.60 (agree), “Math puzzles are boring” 3.53 (agree) and “I am challenged by math problems I cannot understand right away” 3.38 (uncertain).
Note: indicators with * symbols are stated negatively, thus, scoring is reversed. Legend:
Range Descriptive Rating Qualitative Interpretation (QI) 4.51-5.00 Strongly Agree Highly Positive (HP) 3.51-4.50 Agree Positive (P) 2.51-3.50 Uncertain Moderately Positive (MP) 1.51-2.50 Disagree Negative (N) 1.00-1.50 Strongly Disagree Highly Negative (HN)
Table 5. Motivation level of CPAAG and non-CPAAG before intervention
CPAAG Non-CPAAG
Motivation Mean DR QI Mean DR QI
25. I like math puzzles. 3.23 Uncertain Moderately
Positive 3.28 Uncertain Moderately Positive
26. Math is enjoyable to me. 3.25 Uncertain Moderately
Positive 3.18 Uncertain Moderately Positive
27. When a math problem comes up that I cannot solve right away, I stick with it until I find the solution.
3.35 Uncertain Moderately
Positive 3.25 Uncertain Moderately Positive
28. Once I start working on a math puzzle, it is hard to stop.
3.13 Uncertain Moderately
Positive 3.20 Uncertain Moderately Positive
29. When I have a question that doesn’t get answered in math class, I keep thinking about it.
3.65 Agree Positive 3.60 Agree Positive
30. I am challenged by math problems I cannot understand right away.
3.65 Agree Positive 3.38 Uncertain Moderately Positive
31. Figuring out math problems is not something I like to do.*
3.03 Uncertain Moderately
Positive 2.83 Uncertain Moderately Positive
32. The challenge of math problems does not appeal to me.*
3.35 Uncertain Moderately
Positive 3.20 Uncertain Moderately Positive
33. Math puzzles are boring.* 3.53 Agree Positive 3.53 Agree Positive
34. I do not understand how some people can spend so much time on Math and seem to like it.*
2.93 Uncertain Moderately
Positive 3.03 Uncertain Moderately Positive
35. I would rather have someone else figure out a tough math problem than have to work it out myself.*
3.05 Uncertain Moderately
Positive 2.80 Uncertain Moderately Positive
36. I do as a little work in math as possible.* 2.53 Uncertain Moderately
Positive 2.65 Uncertain Moderately Positive
Mean 3.22 Uncertain Moderately
Positive 3.16 Uncertain Moderately Positive

INTERNATIONAL JOURNAL OF SCIENTIFIC & TECHNOLOGY RESEARCH VOLUME 7, ISSUE 5, MAY 2018 ISSN 2277-8616
98 IJSTR©2018 www.ijstr.org
Students under the CPAAG agreed only in three statements, the rest they were uncertain. They were challenged by math problems given to them and if they have questions that were not answered in the class they keep on thinking about it. They were also motivated to answer challenging question, in fact they don’t get bored in answering math puzzles. Respondents under the Non-CPAAG agreed only in two statements, the rest they were uncertain. They stock questions in their mind that were not clearly answered during class discussion. They also have positive attitude in dealing math puzzles. However, they were neutral whether they were challenged by math problems or not. The three (3) statements where students under the CPAAG have lower mean scores are the following: “I do as a little work in Math as possible”, “I do not understand how some people can spend so much time on Math and seem to like it” and “Figuring out math problems is not something I like to do” with mean ratings of 2.53 (uncertain), 2.93 (uncertain) and 3.03 (uncertain), respectively. The three (3) lower mean scores of students under the non-CPAAG are the following statements: “I do as a little work in Math as possible”, “I would rather have someone else figure out a tough math problem than have to work it out myself” and “Figuring out math problems is not something I like to do” with mean scores of 2.65 (uncertain), 2.80 (uncertain) and 2.83 (uncertain), respectively. This reveals that students under the CPAAG prior to the conduct of the study were uncertain on how much effort they will exert for Math, they are neutral on how other people like to spend more time in Math and they are doubtful on how to figure out math problems. For the respondents under the non-CPAAG, they were uncertain also about the level of effort they have to exert for Math. They are doubtful if they can figure out math problems or they will need some assistance from other people. Thus, before the conduct of the study the two groups have problems in dealing with math problems and on how they will figure out the given problems. The over-all mean score of students under the CPAAG and non-CPAAG are 3.22 (uncertain) and 3.16 (uncertain) respectively. This simply means that prior to the conduct of the study the students have problems in dealing with Math problems. They don’t have sufficient strategy in dealing with Math problems. This finding is parallel to the study of Duque (2013), wherein his study found out that the motivation level of his respondents are neutral. Meaning the students cannot decide if they are motivated or not, the same with this study where the respondents are uncertain of their motivational level. However, this finding opposes the findings of Yunus and Ali (2009) in their study, wherein they found out that the motivation level of the respondents is high. It means that the respondents have positive motivation level in learning Math; unlike in this study where the respondents are undecided about their motivation level in learning Math. Table
6 displays the motivation level of the students after the intervention. Students under CPAAG have higher mean scores in the following statements: “Math is enjoyable to me”, “When I have a question that doesn’t get answered in math class, I keep thinking about it” and “Math puzzles are boring” with mean ratings 4.15 (agree), 3.80 (agree) and 3.70 (agree), respectively. For the respondents under the non-CPAAG their higher mean scores are in the following statements: “Math is enjoyable to me” 3.88 (agree), “I like math puzzles” 3.78 (agree), “Math puzzles are boring” 3.53 (agree) and “When I have a question that doesn’t get answered in math class, I keep thinking about it” 3.53 (agree). The table shows that students under CPAAG positively find Math as an enjoyable subject, they can’t get over the question that was not answered clearly during the class and they enjoy solving math puzzles. The students under the non-CPAAG also find Math as an enjoyable subject. They have positive response on the math puzzles and they want that questions in their mind about Math should be given an answer. The table also shows that in “motivation” the three lower mean scores of students under the CPAAG are in the following statements: “I do as a little work in Math as possible”, “Figuring out math problems is not something I like to do”, and “Once I start working on a math puzzle, it is hard to stop” with mean scores of 2.80 (uncertain), 2.88 (uncertain), and 3.00 (uncertain), respectively. The students under the non-CPAAG have lower mean scores in the following statements: “I do as a little work in math as possible”, “I would rather have someone else figure out a tough math problem than have to work it out myself”, “Figuring out math problems is not something I like to do”, with mean ratings of 2.70 (uncertain), 2.88 (uncertain), 3.18 (uncertain), respectively. This means that the students under the CPAAG are doubtful to extend their efforts in Math. They were also doubtful whether they can figure out the math problems or they need assistance from other students. Moreover they were undecided if they give up easily in solving math problems. The respondents under the non-CPAAG are also doubtful to extend their efforts in Math. They are also not sure if they can solve difficult problems, instead they need support from their classmates to solve it. The over-all mean score of respondents under the CPAAG and non-CPAAG in motivation are 3.38 (uncertain) and 3.36 (uncertain), respectively. This means that they were not sure whether they were motivated to do math problems or not. This result coincide with the findings of Nambatac (2015), where it was found out that students are undecided about their motivation level in learning Math. Students cannot find means to be motivated in learning math, the same in this study in which the students are uncertain of their motivation level in learning Math.
Table 6. Motivation level of CPAAG and non-CPAAG after intervention
CPAAG Non-CPAAG
Motivation Mean DR QI Mean DR QI
25. I like math puzzles. 3.60 Agree Positive 3.78 Agree Positive
26. Math is enjoyable to me. 4.15 Agree Positive 3.88 Agree Positive
27. When a math problem comes up that I cannot solve right away, I stick with it until I find the solution.
3.33 Uncertain Moderately Positive
3.38 Uncertain Moderately Positive

INTERNATIONAL JOURNAL OF SCIENTIFIC & TECHNOLOGY RESEARCH VOLUME 7, ISSUE 5, MAY 2018 ISSN 2277-8616
99 IJSTR©2018 www.ijstr.org
Note: indicators with * symbols are stated negatively, thus, scoring is reversed. Legend:
Range Descriptive Rating (DR) Qualitative Interpretation (QI) 4.51-5.00 Strongly Agree Highly Positive (HP) 3.51-4.50 Agree Positive (P) 2.51-3.50 Uncertain Moderately Positive (MP) 1.51-2.50 Disagree Negative (N) 1.00-1.50 Strongly Disagree Highly Negative (HN)
3.4 Usefulness of Mathematics Table 7 presents the students’ attitude towards usefulness of Math before the intervention. Students under the CPAAG have higher mean scores in the following statements: “Math will not be important in my life’s work” 4.48 (agree), “Math is an important and useful subject” 4.43 (agree) and “I’ll need Math for my career” 4.43 (agree). The students under the non-CPAAG have their four (4) higher mean scores in the following statements: “Math is an important and useful subject” 4.35 (agree), “Math will not be important in my life’s work” 4.33 (agree), “It’s not important for me to do well in math as an adult” 4.30 (agree) and “Taking Math is a waste of time” 4.30 (agree). This tells us that respondents under CPAAG positively believed that Math is a useful subject for their work and for their career. The students under the non-CPAAG also positively believe that Math is important not only as a subject but also in their work and even when they become older. They also don’t find Math as a waste of time. Thus, prior to the conduct of the study the respondents appreciated the importance of Math. The three lower mean scores of students under the CPAAG are in the following statements: “I expect to have little use for math when I get out of school”, “I see math as a subject that I won’t use very much in daily life as an adult”, “I will use math in many ways as an adult” with mean ratings of 2.83 (uncertain), 4.05 (agree) and
4.05 (agree) respectively. The three (3) lower mean scores of the respondents under the non-CPAAG are in the following statements: “I expect to have little use for Math when I get out of school”, “I’ll need Math for my career” and “I study Math because I know how useful it is” with mean scores of 3.15 (uncertain), 3.70 (agree) and 3.85 (agree), respectively.
28. Once I start working on a math puzzle, it is hard to stop.
3.00 Agree Positive 3.48 Agree Positive
29. When I have a question that doesn’t get answered in math class, I keep thinking about it.
3.80 Agree Positive 3.53 Agree Positive
30. I am challenged by math problems I cannot understand right away.
3.55 Agree Positive 3.43 Uncertain Moderately Positive
31. Figuring out math problems is not something I like to do.*
2.88 Uncertain Moderately Positive
3.18 Uncertain Moderately Positive
32. The challenge of math problems does not appeal to me.*
3.65 Agree Positive 3.38 Agree Positive
33. Math puzzles are boring.* 3.70 Agree Positive 3.53 Agree Positive
34. I do not understand how some people can spend so much time on math and seem to like it.*
3.05 Uncertain Moderately Positive
3.20 Uncertain Moderately Positive
35. I would rather have someone else figure out a tough math problem than have to work it out myself.*
3.10 Uncertain Moderately Positive
2.88 Uncertain Moderately Positive
36. I do as a little work in math as possible.*
2.80 Uncertain Moderately Positive
2.70 Uncertain Moderately Positive
Mean 3.38 Uncertain Moderately Positive
3.36 Uncertain Moderately Positive

INTERNATIONAL JOURNAL OF SCIENTIFIC & TECHNOLOGY RESEARCH VOLUME 7, ISSUE 5, MAY 2018 ISSN 2277-8616
100 IJSTR©2018 www.ijstr.org
Note: indicators with * symbols are stated negatively, thus, scoring is reversed. Legend:
Range Descriptive Rating (DR) Qualitative Interpretation (QI) 4.51-5.00 Strongly Agree Highly Positive (HP) 3.51-4.50 Agree Positive (P) 2.51-3.50 Uncertain Moderately Positive (MP) 1.51-2.50 Disagree Negative (N) 1.00-1.50 Strongly Disagree Highly Negative (HN)
For the two (2) groups, they were only neutral in the use of Math outside the school, but they believe that Math is useful; they know that it can help them even when they become older. However, they just can’t see specifically how Math works outside the school that is why they were undecided on how it works outside. The over-all mean scores of students under the CPAAG and non-CPAAG are 4.18 (agree) and 4.02 (agree), respectively. This implies that they positively recognize the importance of Math. This conforms to the study of Duque (2013) and Cordova and Tan (2018) where they found out that students positively believe that Math is a useful subject. They have recognized the importance of Math, the same as the findings of this study in which students showed a positive attitude towards the usefulness of Math. Table 8 presents the students’ attitude towards usefulness of Math after intervention. It can be seen from the table that students under the CPAAG have higher mean scores in the following statements: “I study Math because I know how useful it is”, “Math is an important and useful subject” and “Knowing Math will help me earn a living”, with mean scores of 4.68 (strongly agree), 4.65 (strongly agree) and 4.55 (strongly agree), respectively. Students under the non-CPAAG have their higher mean values in the following statements “I study Math
because I know how useful it is”, “I’ll need Math for my career”, “Math is an important and useful subject” with mean values 4.40 (agree), 4.30 (agree) and 4.25 (agree), respectively. This means that respondents under CPAAG highly believe that Math is an important subject and it is useful. Respondents from the Non-CPAAG also find Math as a useful subject not only for their work but also for their future career.
Table 7. CPAAG and non-CPAAG attitude towards usefulness of Math before intervention
CPAAG Non-CPAAG
Usefulness on Math Mean DR QI Mean DR QI
37. I’ll need Math for my career. 4.43 Agree Positive 3.70 Agree Positive
38. I study Math because I know how useful it is.
4.38 Agree Positive 3.85 Agree Positive
39. Knowing Math will help me learn a living.
4.30 Agree Positive 4.20 Agree Positive
40. Math is an important and useful subject. 4.43 Agree Positive 4.35 Agree Positive
41. I need to master Math for my future work.
4.25 Agree Positive 4.23 Agree Positive
42. I will use Math in many ways as an adult.
4.05 Agree Positive 3.93 Agree Positive
43. Math is not important in my life.* 4.35 Agree Positive 3.93 Agree Positive
44. Math will not be important in my life’s work.*
4.48 Agree Positive 4.33 Agree Positive
45. I see Math as a subject that I won’t use very much in daily life as an adult.*
4.05 Agree Positive 4.03 Agree Positive
46. Taking Math is a waste of time.* 4.40 Agree Positive 4.30 Agree Positive
47. It’s not important for me to do well in Math as an adult.*
4.25 Agree Positive 4.30 Agree Positive
48. I expect to have little use for Math when I get out of school.*
2.83 Uncertain Moderately Positive
3.15 Uncertain Moderately Positive
Mean 4.18 Agree Positive 4.02 Agree Positive

INTERNATIONAL JOURNAL OF SCIENTIFIC & TECHNOLOGY RESEARCH VOLUME 7, ISSUE 5, MAY 2018 ISSN 2277-8616
101 IJSTR©2018 www.ijstr.org
Note: indicators with * symbols are stated negatively, thus, scoring is reversed. Legend:
Range Descriptive Rating (DR) Qualitative Interpretation (QI) 4.51-5.00 Strongly Agree Highly Positive (HP) 3.51-4.50 Agree Positive (P) 2.51-3.50 Uncertain Moderately Positive (MP) 1.51-2.50 Disagree Negative (N) 1.00-1.50 Strongly Disagree Highly Negative (HN)
The students under the CPAAG have three lower mean scores in the following statements: “I expect to have little use for Math when I get out of school”, “I see Math as a subject that I won’t use very much in daily life as an adult”, and “It’s not important for me to do well in Math as an adult” with mean scores of 2.90 (uncertain), 3.98 (agree) and 4.03 (agree), respectively. The respondents under the non-CPAAG have lower mean scores in the following statements: “I expect to have little use for Math when I get out of school”, “It’s not important for me to do well in Math as an adult” and “Math will not be important in my life’s work” with mean ratings of 3.08 (uncertain), 3.85 (agree) and 3.93 (agree), respectively. The table also tells us that students were only uncertain in the statement about the importance of Math outside the classroom. Students under CPAAG have positive response on the importance of Math in their daily lives and for their future career. The students under the non-CPAAG also responded positively about the importance of Math in their life and for their future work. The over-all mean score of students under CPAAG and non-CPAAG in the usefulness of Math are 4.25 (agree) and 4.02 (agree), respectively. This implies that the students positively believed that Math is a useful subject that may help them in their work and for their future career.
This contradicts with the result of the study of Nambatac (2015) where her study found out those students was undecided about the usefulness of Math. Students were uncertain about the usefulness of Math, unlike in this study where the respondents were found to have positive attitude towards the usefulness of Math. 3.5 Confidence in Learning Math Table 9 shows the students’ confidence in learning Math before the intervention. The students under the CPAAG have higher mean scores in the following statements: “I am sure that I can learn Math” 4.13 (agree), “Math is my worst subject” 4.00 (agree), “I feel confident trying Math” 3.48 (uncertain) and “I can get good grades in Math” 3.48 (uncertain).
Table 8. CPAAG and non-CPAAG attitude towards usefulness of Math after intervention
CPAAG Non-CPAAG
Usefulness on Math Mean DR QI Mean DR QI
37. I’ll need Math for my career. 4.50 Strongly Agree Highly Positive 4.30 Agree Positive
38. I study Math because I know how useful it is. 4.68 Strongly Agree Highly Positive 4.40 Agree Positive
39. Knowing Math will help me learn a living. 4.55 Strongly Agree Highly Positive 4.18 Agree Positive
40. Math is an important and useful subject. 4.65 Strongly Agree Highly Positive 4.25 Agree Positive
41. I need to master math for my future work. 4.40 Agree Positive 4.08 Agree Positive
42. I will use Math in many ways as an adult. 4.35 Agree Positive 3.98 Agree Positive
43. Math is not important in my life.* 4.25 Agree Positive 3.95 Agree Positive
44. Math will not be important in my life’s work.* 4.30 Agree Positive 3.93 Agree Positive
45. I see Math as a subject that I won’t use very much in daily life as an adult.*
3.98 Agree Positive 4.05 Agree Positive
46. Taking Math is a waste of time.* 4.40 Agree Positive 4.18 Agree Positive
47. It’s not important for me to do well in Math as an adult.*
4.03 Agree Positive 3.85 Agree Positive
48. I expect to have little use for Math when I get out of school.*
2.90 Uncertain Moderately Positive
3.08 Uncertain Moderately Positive
Mean 4.25 Agree Positive 4.02 Agree Positive

INTERNATIONAL JOURNAL OF SCIENTIFIC & TECHNOLOGY RESEARCH VOLUME 7, ISSUE 5, MAY 2018 ISSN 2277-8616
102 IJSTR©2018 www.ijstr.org
Table 9. CPAAG and non-CPAAG confidence in learning Math before intervention
Note: indicators with * symbols are stated negatively, thus, scoring is reversed.
Legend: Range Descriptive Rating (DR) Qualitative Interpretation (QI)
4.51-5.00 Strongly Agree Highly Positive (HP) 3.51-4.50 Agree Positive (P) 2.51-3.50 Uncertain Moderately Positive (MP) 1.51-2.50 Disagree Negative (N) 1.00-1.50 Strongly Disagree Highly Negative (HN)
The three higher mean scores of students under the non-CPAAG are the following statements: “I am sure that I can learn Math”, “I can get good grades in Math” and “I am sure that I could do advanced work in Math” with mean ratings 4.03 (agree), 3.80 (agree) and 3.48 (uncertain), respectively. This indicates that students under the CPAAG have a moderately positive confidence in learning Math and they like Math. However, they are doubtful if they can do better in Math. Students under the Non-CPAAG were also certain that they can learn Math and get good grades in it. However, they are doubtful whether they can do advance work in Math. The table also shows that students under the CPAAG have lower mean scores in the following statements: “For some reason, even though I study, Math is really hard for me”, “I do fine in most subjects, but when it comes to Math I really mess up” and “I have a lot of self- confidence when it comes to math” with mean ratings 2.83 (uncertain), 2.95 (uncertain) and 3.03 (uncertain), respectively. The respondents under the non-CPAAG have lower mean scores in the following statements “For some reason, even though I study, Math is really hard for
me”, “I do fine in most subjects, but when it comes to Math I really mess up” and “I am not the type to do well in Math” with mean scores of 2.63 (uncertain), 2.83 (uncertain) and 2.85 (uncertain), respectively. This implies that students under the CPAAG are neutral about their confidence when it comes to Math. They were also uncertain to find Math easier even if they have studied their lesson in advance. The respondents under the non-CPAAG are not sure to have good grades even though they have given their best. The over-all mean scores of students under the CPAAG and non-CPAAG are 3.39 (uncertain) and 3.30 (uncertain), respectively. This signifies that the confidence level of the students in math is neutral. This supports the findings of the study of Bermejo (2009) in which he found out that during the pre-test his respondents have neutral response or undecided about their confidence level in learning Math. Similarly, in this study the students are uncertain of their confidence level in learning Math. This negates the pre-test result of Jose (2015) wherein he found out that the respondents have negative confidence level in learning Math. Thus, the students don’t have confidence to
CPAAG Non-CPAAG
Usefulness on Math Mean DR QI Mean DR QI
49. I feel confident trying Math. 3.48 Uncertain Moderately
Positive 3.18 Uncertain
Moderately Positive
50. I am sure that I could do advanced work in Math.
3.43 Uncertain Moderately
Positive 3.48 Uncertain
Moderately Positive
51. I am sure that I can learn Math. 4.13 Agree Positive 4.03 Agree Positive
52. I think I could handle more difficult math. 3.35 Uncertain Moderately
Positive 3.23 Uncertain
Moderately Positive
53. I can get good grades in Math. 3.48 Uncertain Moderately
Positive 3.80 Agree Positive
54. I have a lot of self- confidence when it comes to Math.
3.03 Uncertain Moderately
Positive 3.38 Uncertain
Moderately Positive
55. I am not good in Math.* 3.43 Uncertain Moderately
Positive 3.20 Uncertain
Moderately Positive
56. I do not think I could do advanced Math.* 3.30 Uncertain Moderately
Positive 3.08 Uncertain
Moderately Positive
57. I am not the type to do well in Math.* 3.25 Uncertain Moderately
Positive 2.85 Uncertain
Moderately Positive
58. For some reason, even though I study, Math is really hard for me.*
2.83 Uncertain Moderately
Positive 2.63 Uncertain
Moderately Positive
59. I do fine in most subjects, but when it comes to Math I really mess up.*
2.95 Uncertain Moderately
Positive 2.83 Uncertain
Moderately Positive
60. Math is my worst subject.* 4.00 Agree Positive 3.20 Uncertain Moderately Positive
Mean 3.39 Uncertain Moderately
Positive 3.30 Uncertain
Moderately Positive

INTERNATIONAL JOURNAL OF SCIENTIFIC & TECHNOLOGY RESEARCH VOLUME 7, ISSUE 5, MAY 2018 ISSN 2277-8616
103 IJSTR©2018 www.ijstr.org
learn Math. Table 10 shows that in the confidence of the students in learning Math, after the intervention. Respondents under the CPAAG have three higher mean scores in the following statements: “Math is my worst subject”, “. I feel confident trying Math” and “I can get good grades in Math” with mean scores 4.15 (agree), 3.80 (agree) and 3.80 (agree),
respectively. The three higher mean scores of students under the non-CPAAG are in the following statements: “I am sure that I can learn Math”, “I feel confident trying Math”, and “I am sure that I could do advanced work in Math” with mean ratings 4.20 (agree), 4.05 (agree) and 3.70 (agree), respectively.
Table 10. CPAAG and non-CPAAG confidence in learning Math after intervention
Note: indicators with * symbols are stated negatively, thus, scoring is reversed. Legend:
Range Descriptive Rating (DR) Qualitative Interpretation (QI) 4.51-5.00 Strongly Agree Highly Positive (HP) 3.51-4.50 Agree Positive (P) 2.51-3.50 Uncertain Moderately Positive (MP) 1.51-2.50 Disagree Negative (N) 1.00-1.50 Strongly Disagree Highly Negative (HN)
This implies that students under the CPAAG don’t believe that Math is the worst subject. They also have the confidence to try math problems and they really want to have higher grades in Math. Respondents under Non-CPAAG also have positive attitude of learning Math and can work in advance Math as well. It can also be seen from the table that students under CPAAG have lower mean scores in the following statements: “For some reason, even though I study, Math is really hard for me”, “I am not the type to do well in Math” and “I think I could handle more difficult Math” with mean ratings 2.98 (uncertain), 3.13 (uncertain) and 3.13 (uncertain), respectively. Respondents under the non-CPAAG have lower mean scores in the following statements: “For some reason, even though I study, Math is really hard for me”, “I do not think I could do advanced Math” and “I am not good in Math” with mean ratings 2.70 (uncertain), 2.90 (uncertain) and 3.08 (uncertain), respectively. This signifies that after the conduct of the study students under the CPAAG was neutral about the difficulty of Math even in the times that they have studied their lessons very well. They were uncertain if they can handle difficult
problems in Math. Students under the Non-CPAAG were uncertain whether they can do better in advance Math. They were also undecided if they are good in Math or not. The over-all mean score of students under CPAAG is 3.52 (agree) and for Non-CPAAG is 3.47 (uncertain). This means that respondents under CPAAG have positive confidence in learning Math and those under the non-CPAAG remains neutral. This supports the findings of Jose (2015) wherein he found out that the experimental group have positive confidence in learning Math. This also supports the study of Bermejo (2009) in which he also found out that during the post-test students have positive confidence in learning Math. 3.6 Summary of Students’ Attitude towards Mathematics Table 11 shows the summary of students’ attitude in Math. During the pre-test, students under the CPAAG have higher mean values in “usefulness of Math” with mean score of 4.18 (agree) and “attitudes toward success in Math” with mean 3.93 (agree). During the post-test they have higher mean
CPAAG Non-CPAAG
Usefulness on Math Mean DR QI Mean DR QI
49. I feel confident trying Math. 3.80 Agree Positive 4.05 Agree Positive
50. I am sure that I could do advanced work in Math.
3.53 Agree Positive 3.70 Agree Positive
51. I am sure that I can learn Math. 4.50 Agree Positive 4.20 Agree Positive
52. I think I could handle more difficult Math. 3.13 Uncertain Moderately
Positive 3.70 Agree Positive
53. I can get good grades in Math. 3.80 Agree Positive 3.68 Agree Positive
54. I have a lot of self- confidence when it comes to Math.
3.55 Agree Positive 3.45 Uncertain Moderately
Positive
55. I am not good in Math.* 3.18 Uncertain Moderately
Positive 3.08 Uncertain
Moderately Positive
56. I do not think I could do advanced Math.* 3.30 Uncertain Moderately
Positive 2.90 Uncertain
Moderately Positive
57. I am not the type to do well in Math.* 3.13 Uncertain Moderately
Positive 3.20 Uncertain
Moderately Positive
58. For some reason, even though I study, Math is really hard for me.*
2.98 Uncertain Moderately
Positive 2.70 Uncertain
Moderately Positive
59. I do fine in most subjects, but when it comes to Math I really mess up.*
3.20 Uncertain Moderately
Positive 3.35 Uncertain
Moderately Positive
60. Math is my worst subject.* 4.15 Agree Positive 3.63 Agree Positive
Mean 3.52 Agree Positive 3.47 Uncertain Moderately
Positive

INTERNATIONAL JOURNAL OF SCIENTIFIC & TECHNOLOGY RESEARCH VOLUME 7, ISSUE 5, MAY 2018 ISSN 2277-8616
104 IJSTR©2018 www.ijstr.org
values in “usefulness of Math” with mean score of 4.25 (agree). Students under the non-CPAAG have higher mean scores in “usefulness of Math” with mean value of 4.02 (agree) and “attitudes toward success in Math” with mean
value of 3.86 (agree). During the post-test they have a high mean value in “usefulness of Math” with mean value of 4.02 (agree). This means that the students recognize the importance of Math and they want to be successful in Math.
Table 11. Summary of Students Attitude in Math
CPAAG Non-CPAAG
Pre-test Post-test Pre-test Post-test
Mean DR Mean DR Mean DR Mean DR
Attitudes Toward Success in Math.
3.93 Agree 3.97 Agree 3.86 Agree 4.03 Agree
Math Anxiety 2.86 Uncertain 2.98 Uncertain 2.94 Uncertain 3.27 Uncertain
Motivation 3.22 Uncertain 3.38 Uncertain 3.16 Uncertain 3.36 Uncertain
Usefulness of Math 4.18 Agree 4.25 Agree 4.02 Agree 4.02 Agree
Confidence in Learning Math
3.39 Uncertain 3.52 Agree 3.30 Uncertain 3.47 Uncertain
Mean 3.51 Agree 3.62 Agree 3.46 Uncertain 3.63 Agree
Note: indicators with * symbols are stated negatively, thus, scoring is reversed. Legend:
Range Descriptive Rating (DR) Qualitative Interpretation (QI) 4.51-5.00 Strongly Agree Highly Positive (HP) 3.51-4.50 Agree Moderately Positive(MP) 2.51-3.50 Uncertain Averagely Positive (AP) 1.51-2.50 Disagree Moderately Negative(MN) 1.00-1.50 Strongly Disagree Highly Negative (HN)
The table also reveals that during the pre-test students under the CPAAG have lower mean values in “math anxiety” with mean value of 2.89 (uncertain) and in “motivation” with a mean score of 3.22 (uncertain). During the post-test they have lower mean scores in “math anxiety” with a mean score of 2.98 (uncertain) and “motivation” with mean a score value of 3.38 (uncertain). During the pre-test the students in non-CPAAG have lower mean score in “math anxiety” and “motivation” with mean scores 2.94 (uncertain) and 3.16 (uncertain), respectively. During the post-test they have lower mean score in “math anxiety” and “motivation” with mean ratings 3.27 (uncertain) and 3.36 (uncertain), respectively. This means that some students were anxious during Math time and some have low motivation level to do their best in Math. The over-all mean score of students under CPAAG during the pre-test is 3.51 (agree) and during the post-test is 3.62 (agree). For respondents under non-CPAAG their over-all mean score during the pre-test is 3.46 (agree) and 3.63 (agree) during the post-test. This means that the students have positive attitude towards Mathematics. This result is similar to the study of Duque (2013), and Ciubal-Fulgencio and Tan (2018), wherein they found out that after the conduct
of the study the attitude level of the students is positive. Duque (2013) also found out that the students recognize the importance of Mathematics and they want to succeed in Math but some were anxious during math time and some have low motivation level. Similarly, in this study it was found out that the students want to succeed in Math and they recognize the importance of Math in their lives. However, some were also anxious during math time and some also have a low motivation level.
3.7 Level of Students’ Performance in Mathematics Table 12 displays the level of performance of the students exposed to CPA approach and to those exposed to non-CPA approach. The table shows that 3 or 7.5% students of CPA group have very low performance, 36 or 90% have low performance and only 1 or 2.5% of the students have an average score. This leads to a mean score of 16.63 or MPS value of 27.71%. For non-CPA 14 or 35% of the students have very low performance and 26 or 65% of the students have low performance. This yields to a mean score of 14.38 or MPS value of 23.96%.
Table 12. Level of performance of students in Mathematics during the pre-test
Range Level of Proficiency CPAAG Non-CPAAG
f `% f % Qualitative Interpretation
81%-100% Exemplary 0 0% 0 0% Very High Performance
61%-80% Above Average 0 0% 0 0% High Performance
41%-60% Average 1 2.5% 0 0% Moderate Performance
21%-40% Below Average 36 90% 26 65% Low Performance
1%-20% Deficient 3 7.5% 14 35% Very Low Performance
MEAN 16.63 14.38
MPS 27.71% (Below Average)
23.96% (Below Average)

INTERNATIONAL JOURNAL OF SCIENTIFIC & TECHNOLOGY RESEARCH VOLUME 7, ISSUE 5, MAY 2018 ISSN 2277-8616
105 IJSTR©2018 www.ijstr.org
The mean score of students under the CPAAG is 16.63 with MPS of 27.71%. This falls on the range below average. The mean score of students under non-CPAAG is 14. 38 with MPS value of 23.96 %. This also falls on the range below average. This implies that prior to the conduct of the study the performance level of the students is below average or it means that prior to the conduct of the study the performance level of the students is low. This is similar to the study of Calfoforo (2013) where she found out that during the pre-test students has low level of performance. Table 13 presents the level of performance of the students during the post-test. For students under the CPAAG during the post-test, 18 students or 45% have moderate performance, 20 or 50% have high performance and 2 or 5% have very high performance. For students under the non-CPA, during the post-test only one (1)
or 2.5% of the students have very low performance, 12 or 30% have low performance, 25 or 62.5% have moderate performance and 2 or 5% got a high performance. Students under the CPAAG have a mean score of 37.8 or an MPS of 63.00% (above average). They have a high performance level during the post-test. Students under the non-CPAAG have a mean score of 28.63 or 47.71% (Average). They have a moderate performance level. This finding is parallel to the study of Ciubal-Fulgencio and Tan (2018). They found out that experimental group performed above average during the post test, while the control group performed in the average level. Similarly, in this study, during the post-test, the experimental group performed above average and the control group performed in the average level.
Table 13. Level of performance of students in Mathematics in the post-test
Range Level of Proficiency CPAAG Non-CPAAG Qualitative Interpretation
f % f %
81%-100% Exemplary 2 5% 0 0% Very High Performance
61%-80% Above Average 20 50% 2 5% High Performance
41%-60% Average 18 45% 25 62.5% Moderate Performance
21%-40% Below Average 0 0% 12 30% Low Performance
1%-20% Deficient 0 0% 1 2.5% Very Low Performance
MEAN 37.8 28.63
MPS 63.00%
(Above average) 47.71%
(Average)
Table 14 shows the level of performance of students’ in the retention test. Under the CPAAG, 2 or 5% of the students have low performance, 13 or 32.5% have moderate level of performance, 18 or 45% have high performance and 7 or 17.5% have very high performance. Under the non-CPAAG, 1 or 2.5% of the students have very low performance, 12 or 30 % have low performance, 21 or 52.5% have moderate performance, 4 or 10% of the students have high performance and 2 or 5% have very high performance. During the retention test students under the CPAAG have a mean score value of 38.93 or MPS value of 64.88%. This indicates a high
performance level during the retention test. On the other hand, students under the non-CPAAG have a mean score of 29.15 or equivalent to MPS value of 48.58%. This shows a moderate performance level in the retention test. This partially supports the study of Ciubal-Fulgencio and Tan (2018) wherein they found out that during the retention test, her control group performed in the average level which is similar to this study. However, for the experimental group they found out that student performed in the average level. In this study it was found out that the student under the experimental group performed in the above average level.
Table 14. Level of performance of students in Mathematics in the retention test
Range Level of Proficiency CPAAG Non-CPAAG Qualitative Interpretation
f % f %
81%-100% Exemplary 7 17.5% 2 5% Very High Performance
61%-80% Above Average 18 45% 4 10% High Performance
41%-60% Average 13 32.5% 21 52.5% Moderate Performance
21%-40% Below Average 2 5% 12 30% Low Performance
1%-20% Deficient 0 0% 1 2.5% Very Low Performance
MEAN 38.93 29.15
MPS 64.88%
(Above average) 48.58%
(Average)
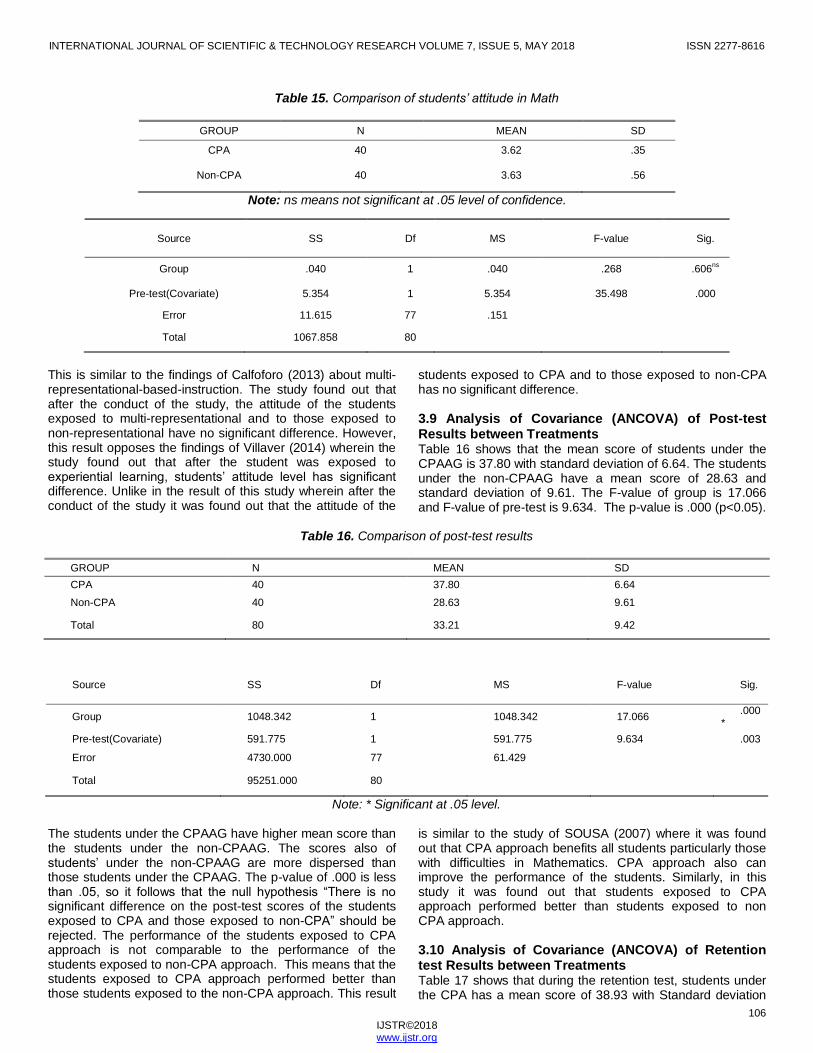
3.8 Analysis of Covariance (ANCOVA) of Students Attitude in Math Table 15 shows that the mean score of students under the CPAAG is 3.62 with standard deviation .35 and the mean score of Students under the non-CPA is 3.63 with standard deviation .56. The F-value of group is .268 and the F- value of pre-test is 35.498. The p-value is .606 (p> .05). The mean scores of the two groups during the post-test are closer to each other. However, the distribution of the data of students under the non-CPAAG is more spread than those under the
CPAAG. The p-value is greater than .05. This implies that there is no sufficient evidence to warrant rejection the null hypothesis which states “there is no significant difference on the attitude of the students’ when exposed to CPA approach and those exposed to non-CPA approach”. Thus, the null hypothesis failed to be rejected. This means that in spite the increase of the attitude of the students from the pre-test to the post-test, it is not enough to show that the attitude of the two groups has a significant difference.
INTERNATIONAL JOURNAL OF SCIENTIFIC & TECHNOLOGY RESEARCH VOLUME 7, ISSUE 5, MAY 2018 ISSN 2277-8616
106 IJSTR©2018 www.ijstr.org
Table 15. Comparison of students’ attitude in Math
GROUP N MEAN SD
CPA 40 3.62 .35
Non-CPA 40 3.63 .56
Note: ns means not significant at .05 level of confidence.
This is similar to the findings of Calfoforo (2013) about multi-representational-based-instruction. The study found out that after the conduct of the study, the attitude of the students exposed to multi-representational and to those exposed to non-representational have no significant difference. However, this result opposes the findings of Villaver (2014) wherein the study found out that after the student was exposed to experiential learning, students’ attitude level has significant difference. Unlike in the result of this study wherein after the conduct of the study it was found out that the attitude of the
students exposed to CPA and to those exposed to non-CPA has no significant difference. 3.9 Analysis of Covariance (ANCOVA) of Post-test Results between Treatments Table 16 shows that the mean score of students under the CPAAG is 37.80 with standard deviation of 6.64. The students under the non-CPAAG have a mean score of 28.63 and standard deviation of 9.61. The F-value of group is 17.066 and F-value of pre-test is 9.634. The p-value is .000 (p<0.05).
Table 16. Comparison of post-test results
GROUP N MEAN SD
CPA 40 37.80 6.64
Non-CPA 40 28.63 9.61
Total 80 33.21 9.42
Note: * Significant at .05 level.
The students under the CPAAG have higher mean score than the students under the non-CPAAG. The scores also of students’ under the non-CPAAG are more dispersed than those students under the CPAAG. The p-value of .000 is less than .05, so it follows that the null hypothesis “There is no significant difference on the post-test scores of the students exposed to CPA and those exposed to non-CPA” should be rejected. The performance of the students exposed to CPA approach is not comparable to the performance of the students exposed to non-CPA approach. This means that the students exposed to CPA approach performed better than those students exposed to the non-CPA approach. This result
is similar to the study of SOUSA (2007) where it was found out that CPA approach benefits all students particularly those with difficulties in Mathematics. CPA approach also can improve the performance of the students. Similarly, in this study it was found out that students exposed to CPA approach performed better than students exposed to non CPA approach. 3.10 Analysis of Covariance (ANCOVA) of Retention test Results between Treatments Table 17 shows that during the retention test, students under the CPA has a mean score of 38.93 with Standard deviation
Source SS Df MS F-value Sig.
Group .040 1 .040 .268 .606ns
Pre-test(Covariate) 5.354 1 5.354 35.498 .000
Error 11.615 77 .151
Total 1067.858 80
Source SS Df MS F-value Sig.
Group 1048.342 1 1048.342 17.066 .000
*
Pre-test(Covariate) 591.775 1 591.775 9.634 .003
Error 4730.000 77 61.429
Total 95251.000 80

INTERNATIONAL JOURNAL OF SCIENTIFIC & TECHNOLOGY RESEARCH VOLUME 7, ISSUE 5, MAY 2018 ISSN 2277-8616
107 IJSTR©2018 www.ijstr.org
of 8.13, while those under the Non-CPA has a mean score of 29.15 with standard deviation of 8.63. The p-value is .000 (p<.05). The retention test scores of the students increased in compared to their scores in the post-test. CPA has higher mean score than non-CPA and has closer scores than the
other group. The p-value is less than .05 which means that there is sufficient evidence to warrant rejection of the null hypothesis which states “there is no significant difference on the retention test scores of the students exposed to CPA and those exposed to non-CPA”.
Table 17. Comparison of retention test results
GROUP N MEAN SD
CPA 40 38.93 8.13
Non-CPA 40 29.15 8.63
Total 80 34.04 9.67
Note: * Significant at .05 level.
This implies that students under the CPA significantly performed higher than those under the non-CPA. This confirms the study of Calfoforo (2013) about multiple representation-based instructions. The study found out that the performance of the students exposed to multiple representation-based instructions is significantly higher than the control group. Furthermore, this result is similar to the findings of Bersano (2016) wherein the study found out that though the performance of the students increase, still their score failed to reach the 75% standard level of Department of Education.
4 CONCLUSIONS AND RECOMMENDATIONS
This section presents the conclusions and recommendations of concrete-pictorial-abstract approach on students’ attitude and performance in grade 8 Mathematics. 4.1 Conclusions Based on the findings of the study, the following conclusions were drawn: Prior to the conduct of the study, the CPAAG have positive attitude towards success in Math and usefulness of Math. They are doubtful in Math anxiety, motivation and confidence in learning Math. After the conduct of the study CPAAG agreed on three sub scales except Math anxiety and motivation in learning Math. The pre-test and post-test of non-CPAAG falls on the same descriptive rating, they have positive response in attitude towards success in Math and usefulness of Math. However they are doubtful in Math anxiety, motivation and confidence in learning Math. In general, before and after the study was conducted, students under the CPAAG have positive attitude towards Math. On the other hand, before the conduct of the study students in non-CPAAG are undecided about their attitude towards Math and it became positive during the post-test. Thus, it was found out in this study that students have positive attitude towards success in Math, they appreciate the importance of Math in
their lives and they have confidence to learn more about Math. However, this study found out that students have low motivation level and high anxiety level. Meaning students have perceived the importance of Math, they want to learn math to experience success towards the subject, but they feel ill during Math time and they don’t have high motivation level to learn more about the subject. The attitudes of the students when exposed to CPA and when exposed to non-CPA are comparable. The attitude of the students under CPAAG is almost the same with the attitude of students in non-CPAAG. The level of performance of CPA and non-CPA during pre-test are both below average. The performance level of CPA and non-CPA during the post-test were above average and average, respectively. The level of performance of CPA and non-CPA on the retention test are also above average and average respectively. The mean scores result of CPA and non-CPA during the post-test has significant difference where CPA performs better than non-CPA. During the retention test, the mean score of CPA is significantly higher than non-CPA.
4.2 Recommendations Regular monitoring of attitude of the students is highly encouraged to have immediate solution if there is a problem with their attitude. It is recommended also to address the anxiety problem of the students in Math. Future researchers should study the different factors that affect the anxiety level of the students to resolve this kind of problem that was found in this study. Aside from traditional way of teaching Math, it is also recommended to use CPA approach to improve the attitude of the students. It is suggested to monitor the attitude of the students every after the quarterly examinations. In using CPA approach, it is encouraged to monitor the performance of the students regularly to see whether or not it has a positive impact to the students. If scores increase, the continual use of the approach is recommended. Otherwise, an alternative approach is recommended. Aside from using the traditional approach, it is also recommended to use CPA approach to enhance the learning of the students. For the
Source SS Df MS F-value Sig.
Group 1117.435 1 1117.435 18.703 .000
*
Pre-test(Covariate) 879.468 1 879.468 14.720 .000
Error 4600.407 77 59.746
Total 100075.00 80

INTERNATIONAL JOURNAL OF SCIENTIFIC & TECHNOLOGY RESEARCH VOLUME 7, ISSUE 5, MAY 2018 ISSN 2277-8616
108 IJSTR©2018 www.ijstr.org
future researchers it is recommended to focus on how to improve the anxiety level and motivation level of the students. It was found out in this study that students tend to appreciate the importance of Math and they have positive attitude towards success in Math, but they are uncertain with their anxiety level and also motivation level.
5 BIBLIOGRAPHY
[1]. Acero, V., Javier, E. & Castro, H. (2004). Human Growth Development and Learning. Rex Book Store.
[2]. Acero, V., Javier, E. & Castro, H. (2000). Principles
and Strategies of Teaching. Rex Book Store.
[3]. Alder, M. (2001). An Introduction to Mathematical Modelling. Heavenforbooks.com.
[4]. Allen, C. (2007). An Action Based Research Study on
How Using Manipulatives will Increase Students’ Achievement in Mathematics. Marygrove College.
[5]. Ali,W & Yunus, A. (2009). Motivation in the Learning
of Mathematics. Univirsiti Putra Malaysia, Selangur Malaysia.
[6]. Amelink, C. & Tech, V. (2012). Research Overview:
female Interest in Mathematics. Retrieved from www.AWEonline.org.
[7]. Andamon, J. (2015). Conceptual, understanding,
Attitude and Performance in Mathematics of Grade 7 Students. Central Mindanao University.
[8]. Ang, K. (2010). Teaching and Learning Mathematical
Modelling with Technology. Nanyang Technological University. [email protected]
[9]. Anhalt, C. & Cortez, R. (2015). Developing
Understanding of Mathematical Modelling in Secondary Teacher Preparation. Tulane University, USA.
[10]. Anstrom, C, Dicerbo, P., Butler, F., Katz, A., Millet, J.
& Rivera, C. (2010). A Review of the Literature on Academic English: Implications for K-12 English Language Learners.
[11]. Ärlebäck, J. (2009). Mathematical Modeling in Upper
Mathematics Education in Sweden (A Curricula and Design Study).Lincöping, Sweden.
[12]. Asparin, A. (2013). Problem Solving Abilities and
Psychological Attributes of Sophomore Students: A Causal Model on Mathematics Achievement. Central Mindanao University. Unpublished Masters’ Thesis. Central Mindanao University
[13]. Bajan, E. (2005). Problem Solving and Number
Exercise Combination in a Process Standards-Designed Instruction: it’s Effect on Students’ Achievement and Attitudes. Central Mindanao University. Unpublished Masters’ Thesis. Central Mindanao University
[14]. Bandura, A. (1997). Social Learning Theory. Retrieved from http://tip. Psychology.org/bandura html
[15]. Barmby, P., Bolden, D. Raine, S. & Thompson, L.
(2012). Developing the Use of Visual Representations in the Primary Classroom. Durham University.
[16]. Bautista, A., Jerde, M., Tobin, R. & Brizuela, B.
(2014). Mathematical Teachers’ Ideas About Mathematical Models: A Diverse Landscape. Tufts University, USA.
[17]. Bermejo, E. ( March 2009). Mathematics Journal
Writing: Its Effect on Students’ Learning Competencies and Attitude in Advanced Algebra of Bocboc National High School. Central Mindanao University. Unpublished Masters’ Thesis. Central Mindanao University
[18]. Bersano, M. (2016). Game-Aided-Instruction in
Mathematics: Effects on Grade 9 Students’ Performance and Anxiety Level.
[19]. Boggan, M., Harpek, S. & Whitmire, A.(2010). Using
Manipulatives to Teach Elementary Mathematics. Mississippi State University.
[20]. Breiteig, T., Grevholm, B. & Kislenko, K. (2004).
Beliefs and Attitude in Mathematics Teaching and Learning.Research Council of Norway.
[21]. Cockett, A. & Kilgour, P. (2015). Mathematical
Manipulatives: Creating an environment for understanding, Efficacy, Engagement and Enjoyment. Avondale College of higher education.
[22]. Calfoforo, A. (2013). Multiple Representation-Based
Instruction: Effects on the Performance and Attitudes of Students in High School Algebra. Unpublished Masters’ Thesis. Central Mindanao University
[23]. Childs, K. (2004). A Comparison of Students’ and
Parents’ Mathematics Attitude and Achievement at a Private Historically Black University.University of Central Florida.
[24]. Ciubal-Fulgencio, NR, Tan, DA. (2018).” Mathematics
Communication Strategies: Effects on Attitudes and Performance of Grade 8 Students”. Asian Academic Research Journal of Multidisciplinary, vol.5, no. 2, February 2018.
[25]. Cockett A, & Kilgour P. (2015). Mathematical
Manipulatives: Creating an Environment for Understanding, Efficacy, Engagement, and Enjoyment. Avondale College.
[26]. Cope, L. (2015). Math Manipulatives: Making the
Abstract Tangible. Delta State University.

INTERNATIONAL JOURNAL OF SCIENTIFIC & TECHNOLOGY RESEARCH VOLUME 7, ISSUE 5, MAY 2018 ISSN 2277-8616
109 IJSTR©2018 www.ijstr.org
[27]. Corpuz, B. & Lucas, M. R. (2014). Facilitating Learning: A Metaconitive Process. Lorimar Publishing Inc.
[28]. Corpuz, B. & Lucido, P. (2012). Educational
Technology 1 (Second Edition). Lorimar Publishing Inc.
[29]. Corpuz, B., Lucas, M., Borabo, H. & Lucido, P.
(2015). Child and Adolescent Development. Lorimar Publishing, Inc.
[30]. Corpuz, B. & Salandanan, G.(2003). Principles and
Strategies of Teaching.Lorimar Publishing Company Inc.
[31]. Cordova, C., Tan, DA. (2018). “Mathematics
Proficiency, Attitude and Performance of Grade 9 Students in Private High School in Bukidnon, Philippines”. Asian Academic Research Journal of Social Sciences and Humanities, vol. 5, issue 2, pp. 103-116, February 2018.
[32]. Culaste, I. (2011). Metacognitive Dimension On
Cognitive Skills in Mathematical Problem Solving Among the Grade VI Pupils in District I Quezon, Bukidnon. Central Mindanao University. Unpublished Masters’ Thesis. Central Mindanao University
[33]. Doosti, A. & Ashtiani, A. (2005). Mathematical
Modelling: A New Approach for Mathematics Teaching in Different levels. Islamic Azad University.
[34]. Drickey, N. (2006). Learning Technologies for
Enhancing Students Understanding of Mathematics. International Journal of Learning.
[35]. Duque, C.(2013). Students’ Mathematics Attitudes
and Metacognitive Processes in Mathematics Problem Solving. Central Mindanao University. Unpublished Masters’ Thesis. Central Mindanao University
[36]. Durmus, S. & Karakirik, E. (2006). Virtual
Manipulatives in Mathematics Education: A Theoretical Framework. Abant Izzet Baysal University.
[37]. Elona, L. (2011). Students Mathematical
Understanding Though Writing-Based UbD Instruction in Central Bukidnon Institute. Central Mindanao University. Unpublished Masters’ Thesis. Central Mindanao University
[38]. Escarlos, GS., Tan, D. (2017). “Motives, Attitudes
and Performance of Teacher Education Students”. International Journal of Scientific & Technology Research, vol. 6, issue 10, pp. 20-25, October 2017
[39]. Farooq, M. and SHAH, S. (2008). Students’ Attitude
Towards Mathematics. University of Punjab. Pakistan
[40]. Flóres, L. (2009). Teacher Variables and Students Mathematics Learning Related to Manipulative Use. Virginia Polytechnic Institute and State University.
[41]. Frejd, P. (2014). Modes of Mathematical Modelling(
An Analysis of How Modelling is used and Interpreted in and out of School Settings. Linköping University.
[42]. Galafshani, N. (2013). Teachers’ Beliefs and
Teaching Mathematics with Manipulatives. Laurentian University.
[43]. Gines, A. (1998). Educational Psychology (A
textbook for college students in psychology and teacher education. Rex Printing Company.
[44]. Generalao, V. (2012). Investigating Mathematical
Skills and Attitude Towards the Performance of Freshmen High School Students. Unpublished Masters’ Thesis. Central Mindanao University
[45]. Gould, H., Murray, D. & Sanfratello, A. (2012).
Mathematical Modelling Handbook. Comap Inc.
[46]. Hackathorn, J., Solomon, E., Blankmeyer, K., Tennial, R. & Garczynsici, A. (2011). Learning by Doing: An Empirical Study of Active Teaching Techniques. Murray State University.
[47]. He, H. (2007). Adolescents’ Perception of Parental
and Peer Mathematics Anxiety and Attitude Towards Mathematics: A Comparative Study of European-American and Mainland-Chinese Students. Washinton States Universitty.
[48]. Heidema, C. & Barton, M. (2002). Teaching Reading
in Mathematics 2nd
Edition. Mcrel, Aurora Colorado.
[49]. Heiland, H. (1999). Friedrich Fröbel. International Bureau of Education.
[50]. Herr, T. & Johnson, K. (1994). Problem Solving
Strategies. Key Curriculum Press.
[51]. Hirstein, J. (2007). The Impact of Zoltan Dienes on Mathematics Teaching in the United States. University of Montana.
[52]. Honor, M. (Integration of Faith and Learning in a
Standard-Based Instruction in High School Geometry at Mindanao Mission Academy Manticao, Misamis Oriental Philippines. Central Mindanao University. Unpublished Masters’ Thesis. Central Mindanao University
[53]. Hoong, L., Kin, H. & Pien, C.(2015). Concrete-
Pictorial-Abstract: Surveying its Origin and Charting its Future.
[54]. iang, X. (2014). The Effect of Parental Involvement
on Math Achievement of Children with Asian Mothers. Georgetown University.

INTERNATIONAL JOURNAL OF SCIENTIFIC & TECHNOLOGY RESEARCH VOLUME 7, ISSUE 5, MAY 2018 ISSN 2277-8616
110 IJSTR©2018 www.ijstr.org
[55]. Jose, A. (2015). Students’ Efficacy and Mathematics Performance in an Information and Communication Technology Guided-Discovery Learning Environment. Unpublished Masters’ ThesisCentral Mindanao University. Unpublished Masters’ Thesis. Central Mindanao University
[56]. Kang, O. (2012). Teaching Mathematical Modeling in
School Mathematics. University of Southern Iowa, USA
[57]. Kelly, C. (2006). Using Manipulatives in Mathematical
Problem Solving: A Performance- Based Analysis. University of Colorado.
[58]. LArdizabal, A. (1998). Foundations of Education
(Psychological, Sociological and Anthropological). Rex Book Store.
[59]. Lizano, M. (2015). Students’ Mathematics
Performance with Quiz Buddy in a Cooperative Learning Environment.
[60]. Lo, M. (2012). Variation Theory and Improvement of
Teaching and Learning. Acta Univesitatis GothoBurgensis.
[61]. Macabecha, J. (2016). Metacognitive Strategies
Effects on Students Performance and Attitude in Mathematics. Unpublished Master’s Thesis. Central Mindanao University.
[62]. Mahanta, S. & Islam, M (2006). Attitude of Secondary
Students Towards Mathematics and its Relationship to Achievement in Mathematics. Handique Girls College.
[63]. Marcia, A. (2007). Teachers Performance Indicators
and Pupils’ Achievement in Mathematics of Sixth-Grades of Valencia City Central Elementary School, SY 2006-2007.
[64]. Marion, G & Lawson D. (2008). An Introduction to
Mathematics Modelling.
[65]. Memnum, D. and Akkaya, R. (2012). Pre-service Teachers’ Attitude Towards Mathematics in Turkey. Georgia State University.
[66]. Mensah, J.K, Okyere, M., Kuranchie, A.(2013).
Students Attitude Towards Mathematics and Performance: Does the Teacher Attitude Matters?. Retrieved from http//www.iiste.org.
[67]. Middleton, J. & Spanias, P.(1999). Motivation for
Achievement in Mathematics: Finding, Generalizations and Criticism of the Research. Arizona State University.
[68]. Miñao, R. (2013). Multiple Intelligence-Based
Instructions: Effects on Students Academic Performance and Attitudes Towards Intermediate Algebra
[69]. Mohamed, L & Waheed, H. (2011). Secondary
Students’ Attitudes Towards Mathematics in a Selected School of Maldives. International Islamic University Malaysia.
[70]. Mohd, M. & Mohd, B. (2010). The Effects of Using
Manipulatives on the Mathematical Achievement of the First Grade Students. Damascus University Journal.
[71]. Montessori, M. Edited by Gutek, G. (2004). The
Montessori Method ( The Origins of an Educational Innovation: Including an Abridged and Annotated Edition of Maria Montessori’s The Montessori Method. Rowman &Little Field Publishers, Inc.
[72]. Mutai, J. (2010). Attitude Towards Learning and
Performance in Mathematics Among Students in Selected Secondary Schools in Bureti District, Kenya. Kenyatta University.
[73]. Mutawa, M. (2014). The Influence of Mathematics
Anxiety in Middle and High School Students Math Achievement
[74]. Nambatac, F. (2011). Conceptual Understanding on
Systems of Linear Equations Among High School Students in Don Carlos National High School. Central Mindanao University. Unpublished Masters’ Thesis. Central Mindanao University
[75]. National Education Testing and Research Center.
(2012). 2012 National Achievement Test Certificate of Rating.
[76]. National Education Testing and Research Center.
(2015). 2015 National Achievement Test Certificate of Rating.
[77]. Nanta, S. (2012). Teaching Standards and Self-
efficacy of Senior Students in Valencia National High School: A Causal Model for Mathematics Achievement. Unpublished Master’s Thesis. Central Mindanao University.
[78]. Nietes, M. (2011). Reflective Teaching:Effects on
Students’ Perfomance in Integrated Science Class. Unpublished Master’s Thesis. Central Mindanao University.
[79]. Ojose, B. & SextoN, L. (2009). The Effect of
Manipulative Materials on Mathematics Achievement of First Grade Students. University of Redlands, California USA.
[80]. Oswalt, S. (2012). Mathematical Modelling in the
High School Classroom. Mississippi State University.
[81]. Paglinawan, J. (2011). Effects of Interactive Computer Assisted Instruction on Students’ Attitude and Performance in High School Geometry.

INTERNATIONAL JOURNAL OF SCIENTIFIC & TECHNOLOGY RESEARCH VOLUME 7, ISSUE 5, MAY 2018 ISSN 2277-8616
111 IJSTR©2018 www.ijstr.org
Unpublished Masters’ Thesis. Central Mindanao University
[82]. Pham, S. (2015). Teachers’ Perceptions on the Use
of Math Manipulatives in Elementary Classroom. University of Toronto.
[83]. Poligrates, T. (2011). Mozart Effect on Students’
Attitude and Achievement in High School Geometry of Lake View Academy. Central Mindanao University.
[84]. Ponsica, D. (2011). Lesson Planning Under
Understanding by Design Environment on Students’ Achievement and Attitudes in Elementary Algebra. Unpublished Masters’ thesis. Central Mindanao University.
[85]. Provenzo, E. Jr. (2009). Friedrich Froebel’s Gifts
(Connecting the Spiritual and Aesthetic to the Real World of Play and Learning. University of Illinois.
[86]. Ross, C. (2008). The Effect of Mathematical
Manipulative Materials on third Grade Students’ Participation, Engagement, and Academic Performance. University of Central Florida.
[87]. Ruzic, R. & O’connell, K. (2011). Manipulative
Enhancement Literature Review. Retrieved from: www. Cast.org/ncae/manipulative1666.cfn.
[88]. Salandanan, G. (2000). Teaching Approaches and
Strategies. Katha Publishing Co.,Inc.
[89]. Sandoval, E. (2009). Effectiveness of Prototype and Standard-Based Lesson Plans on Students’ Mathematical Fluency in Geometry. Central Mindanao University. Unpublished Masters’ Thesis. Central Mindanao University
[90]. Shaw, J. (2002). Manipulatives Enhance the Learning
of Mathematics. University of Mississippi.
[91]. Sousa, D. (2007). How the Brain learns Mathematics. Corwin Press.
[92]. Storm, J. (2009). Manipulatives in Mathematics
Instruction. Bemidji State Uneversity.
[93]. Tano, E. (2011). A Causal Model of Global Self-Concept of Pre-Service Secondary School Mathematics Teachers in Northern Mindanao. Central Mindanao University. Unpublished Masters’ Thesis. Central Mindanao University
[94]. Thompson, P. (1994). Concrete Materials and
Teaching for Mathematical understanding. San Diego State University.
[95]. Taylaran, R. (2015). Participatory Teaching Methods:
Effects on Students Anxiety Level and Performance in Mathematics. Unpublished Masters’ Thesis. Central Mindanao University
[96]. Villaver,L.G. (2014). Experiential Learning Approach: Effects on Mathematics Performance and Attitude. Central Mindanao University. Unpublished Masters’ Thesis. Central Mindanao University
[97]. Wilson, S. & Peterson, P. (2016). Theories of
Learning and Teaching: What do they Mean for Educators. National Education Association.
[98]. Yee, D. & Eccles, J. (1988). Parent Perceptions and
Attributions for Children's Math Achievement. University of Michigan.
[99]. Yeo, C. (2005). Concrete-Pictorial-Abstract(CPA)
Approach for teaching Volume of Revolution in Advance Level Mathematics. Temasek Junior College, Singapore
[100]. Yoong, W. (1999). Multi-Modal Approach of Teaching
Mathematics in a Technological Stage. Universiti Brunei Darussalam.
[101]. Yunus, A. & Ali,W. (2009). Motivation in the Learning
of Mathematics. Univertii Putra Malaysia.