international journal of social sciences and...
TRANSCRIPT
M. Bhatia and B. Agarwal (2015) Int. J. Soc. Sci. Manage. Vol-2, issue-1: 40-51
Full text of this paper can be downloaded online at www.ijssm.org/ & http://nepjol.info/index.php/IJSSM/issue/archive
International Journal of Social
Sciences and Management A Rapid Publishing Journal
Available online at: http://www.ijssm.org
&
http://www.nepjol.info/index.php/IJSSM/index
For any type of query or feedback kindly contact at email ID: [email protected]
ISSN 2091-2986
Impact factor*: 3.389
*Impact factor is issued by SJIF INNO SPACE. Kindly note that this is not the IF of Journal Citation Report (JCR).
Vol-2(1) January, 2015
CrossRef, Google Scholar, International Society of Universal Research in Sciences
(EyeSource), Journal TOCs, New Jour, Scientific Indexing Services, InfoBase Index,
Open Academic Journals Index (OAJI), Scholarsteer, Jour Informatics, Directory
of Research Journals Indexing (DRJI), International Society for Research Activity
(ISRA): Journal Impact Factor (JIF), Simon Fraser University Library, etc.
M. Bhatia and B. Agarwal (2015) Int. J. Soc. Sci. Manage. Vol-2, issue-1: 40-51
DOI: 10.3126/ijssm.v2i1.11685
Full text of this paper can be downloaded online at www.ijssm.org/ & http://nepjol.info/index.php/IJSSM/issue/archive
INTELLECTUAL CAPITAL DISCLOSURES IN IPO PROSPECTUSES OF INDIAN
COMPANIES
Meena Bhatia1* and Bhawna Agarwal2 1*Birla Institute of Management Technology Greater Noida India
2ABES Institute of Technology Ghaziabad-201009 India
*corresponding author’s email: [email protected]
Abstract The study is based on companies that went through IPO on the Bombay Stock Exchange (BSE) and/or National Stock Exchange in the period
2011-2012. The paper applied a disclosure index comprising of 78 items to quantify the amount of information regarding intellectual capital
included in the IPO prospectuses of Indian companies. The sum of disclosed score is divided by 78 to arrive at the index. For disclosure index
content analysis is used. Multiple regression model and Correlation is used to examine the significance and association between disclosure
index with independent variables. The main objective of this paper is to study the extent of intellectual capital disclosures in Initial Public
offering (IPO) prospectus of Indian companies and also to examine the factors that influence the intellectual capital disclosure. The regression
results reveal that of all the independent variables studied i.e. Board size Board independence Size Age Leverage Managerial ownership and
Industry differences; Intellectual capital disclosure is influenced by industry differences. India is considered as knowledge economy and has
highest contribution in gross domestic product from services sector wherein intellectual capital plays the most important role. As regards
intellectual capital the studies have been insufficient. To our knowledge this is the first research on intellectual capital disclosures in IPO
prospectuses of Indian companies.
Keywords: Initial public offering; intellectual capital disclosure; content analysis; multiple regression and correlation analysis;
India
Introduction
Intellectual capital is almost impossible to measure but its
returns can be nearly infinite (Stewart, 1991). The global
market place of 21st century will reward firms that value
entrepreneurial risk-taking invest heavily in developing
their IC promote individual growth and adopt policies that
are environmentally friendly (Shaker, 1999). It is often said
that the value of a company is based more on IC-
organizational culture customer loyalty and brand equity
than on traditional financial measures (like price/earnings
ratios revenue and market share) (Barsky and Garry, 2000).
The traditional financial statement model based on
historical pricing concentrating mainly on the measurement
of material measurable values and the financial effects of
executed transactions omit certain key factors for
determining the value of an enterprise such as the
significance of intellectual capital and the capacity for
creating future value (earnings driver). The result of this is
a gap in the disclosed information between the value of the
company estimated by the capital market and its adequate
balance sheet value. (Helin, 2001)
Due to globalization and integration of financial markets
disclosure of information to stake holders has gained
increased attention. More so there has been transformation
towards knowledge based economy. This impacted the kind
of information that is now reflected in the prospectuses
reports and communication by companies to stake holders.
In addition to physical and financial capital intellectual
capital (IC) resources such as knowledge workers brands
corporate culture research and development technological
advancements and business strategies are equally important
for companies to remain competitive and sustain their
growth. The value of companies is driven by the unique
blend between IC and tangible resources (Ashton, 2005)
which results in securing a sustainable competitive
advantage.
In an ever increasing competitive world IC disclosures are
an important and useful means to keep investors well
informed (Abeysekera, 2008). Chartered Institute of
Management Accountants CIMA defines Intellectual
Capital as the possession of knowledge and experience
professional knowledge and skill good relationships and
Research Article

M. Bhatia and B. Agarwal (2015) Int. J. Soc. Sci. Manage. Vol-2, issue-1: 40-51
Full text of this paper can be downloaded online at www.ijssm.org/ & http://nepjol.info/index.php/IJSSM/issue/archive
technological capacities which when applied will give
organizations competitive advantage.
IC is recognised as an important topic for further research
in the fields of financial and external reporting (Parker,
2007). There have been various studies conducted on
developed economies on IC disclosures (Cordazzo and
Vergauwen, 2012; Abeysekera, 2007) and reasons of these
disclosures there have been very few on developing
economies (Rashid et al., 2012; Kamath, 2007). The
implications of IC are more prominent in these economies
as they have abundant human capital at their disposal.
There are many firms that have started measuring managing
and reporting their intellectual capital. However the
complete disclosure of intellectual capital (IC) is still at its
embryonic stage.
The present study is based on intellectual capital disclosures
in IPO prospectuses of Indian companies. To our
knowledge this is the first research on intellectual capital
disclosures in IPO prospectuses of Indian companies.
The objective of this study is summarized below
To examine the extent of intellectual capital
disclosures in IPO prospectuses companies during
2011-2012
To examine whether there is any association
between the intellectual capital disclosures and
Board size Board independence Size Age
Leverage Managerial ownership and Industry
differences.
For meeting the above objectives seven hypothesis are
proposed and then tested using multivariate analysis.
The rest of the sections are organized as follows: Section 2
presents the review of literature; Section 3 discussed the
variables affecting disclosures and describes the
development of hypothesis Section 4 presents Methodology
of study; Section 5 presents the results and discussions of
the study and Section 6 summarizes the findings and draws
conclusions.
Review of Literature
According to (Stewart, 2002) - It has become standard to
say that a corporation‘s IC is the sum of its human capital
(talent) structural capital (intellectual property
methodologies software documents and other knowledge
artefacts’) and customer capital (client relationships).
The purpose of any disclosure system is to ‘provide
information that is useful to present and potential investors
and creditors and others in making rational investment
credit and similar decisions’ (FASB, 1978).
Intellectual Capital disclosure studies conducted are either
based on annual reports or prospectus. Literature is
reviewed under these two categories.
A. Intellectual Capital disclosure in annual reports
(Bontis, 2003) studied the IC disclosure level in the annual
reports of Canadian Corporations using the content analysis
approach. His research involved electronic search for 39
individual items which represented the intellectual capital
index. He observed that only eight terms were disclosed
from the total set of 39 intellectual capital terms. These
terms were intellectual capital, knowledge management,
human capital, employee value, employee productivity,
economic value added, intellectual capital and intellectual
assets.
(Vandemaele et al., 2005) based on the IC disclosure index
developed by (Bozzolan et al., 2003) compared ICD level
of some companies (including banks) across countries like
Netherlands Sweden and UK. He deployed manual way of
investigation using content analysis of the annual reports.
His observation was that the Swedish sample companies
disclose more on average about IC than Dutch and UK ones.
In the research conducted by (Abdolmohammadi, 2005) on
a sample of Fortune 500 USA companies he extended the
categories of (Guthrie et al., 2006) IC disclosure index into
ten categories named Brand (5 items) Competence (11
items) Corporate culture (4 items) Customer base (8 items)
Information technology (7 items) Intellectual property (7
items) Partnership (2 items) Personnel (7 items) Proprietary
process (6 items) and R&D (1 item). His results show that
the disclosure of information about brand and proprietary
processes increased over the study period.
Another model developed by (Vergauwen et al., 2007) used
three categories named Structural capital (46 items)
Relational capital (29 items) and Human capital (22 items)
in a study of IC disclosure index conducted electronically
content analysis on the annual reports of a sample of firms
from Sweden The UK and Denmark. The results show that
there is a strong significant positive relationship between
the level of structural capital possession of a firm and the
firm’s IC disclosure level. The study found no such
significant association between human and relational
capital in firms and the IC disclosure level regarding these
issues.
B. Intellectual Capital Disclosure in IPO prospectuses
Annual reports are highly useful sources of information
because managers of companies commonly signal what is
important through the reporting mechanism. (Guthrie et al.
2004) Most of the research pertaining to Intellectual capital
disclosure has been carried out on annual reports. The IPO
prospectus deserves equal interest as it is a crucial corporate
communication document at an equally crucial time for the
company i.e. the moment the company tries to fund its
future by inviting the capital markets to join (Cordazzo and
Vergauwen, 2012).
The first study on measuring intellectual capital disclosure
in IPO prospectuses through an index of disclosure was
conducted by (Bukh et al. (2005). They developed a
framework of 78 items for disclosure indexed. This study
was conducted on Danish IPOs. In this study it was
examined what factors can explain the amount of disclosure
in the prospectus. The findings of this study was that the
M. Bhatia and B. Agarwal (2015) Int. J. Soc. Sci. Manage. Vol-2, issue-1: 40-51
Full text of this paper can be downloaded online at www.ijssm.org/ & http://nepjol.info/index.php/IJSSM/issue/archive
ICD is affected by two factors namely extent of managerial
ownership prior to the ownership and industry type.
(Cordazzo, 2007) investigated intangibles disclosure in
Italian initial public offerings (IPO) prospectuses. This
study examined the correlation between identified firm
specific variables namely firm’s size age pre-IPO
managerial ownership and level of technology and level of
intellectual capital disclosure. Study concluded that age and
level of technology are not related with the ICD firm’s size
and pre-IPO managerial ownership are associated with
intangibles disclosure.
Rimmel et al. (2009) studied the quantity of intellectual
capital information in Japanese initial public offering (IPO)
prospectuses. Variables studied were similar to above
mentioned studies; the variable influencing the level of icd
in this study is age of the company.
Ho et al. (2012) performed a study on Hong Kong
companies; they studied whether icd has an impact on
subscription rate of initial public offering. The study
concluded that ICD has a significant influence on the level
of investor confidence in the IPO.
Rashid et al. (2012) conducted a study on Malaysian public
offering to investigate the factors influencing the disclosure
of intellectual capital (IC) information; the factors studied
are age board size underwriter board independence leverage
listing board size of the company board diversity and
auditor. Of these variables board diversity size and auditor
are not significant.
Cordazzo and Vergauwen (2012) investigated the extent of
intellectual capital (IC) disclosure on the UK biotechnology
initial public offering (IPO) prospectuses; the findings of
the study was that the age and independence of the board
are associated with IC disclosure while size and age do not
influence the extent of ICD.
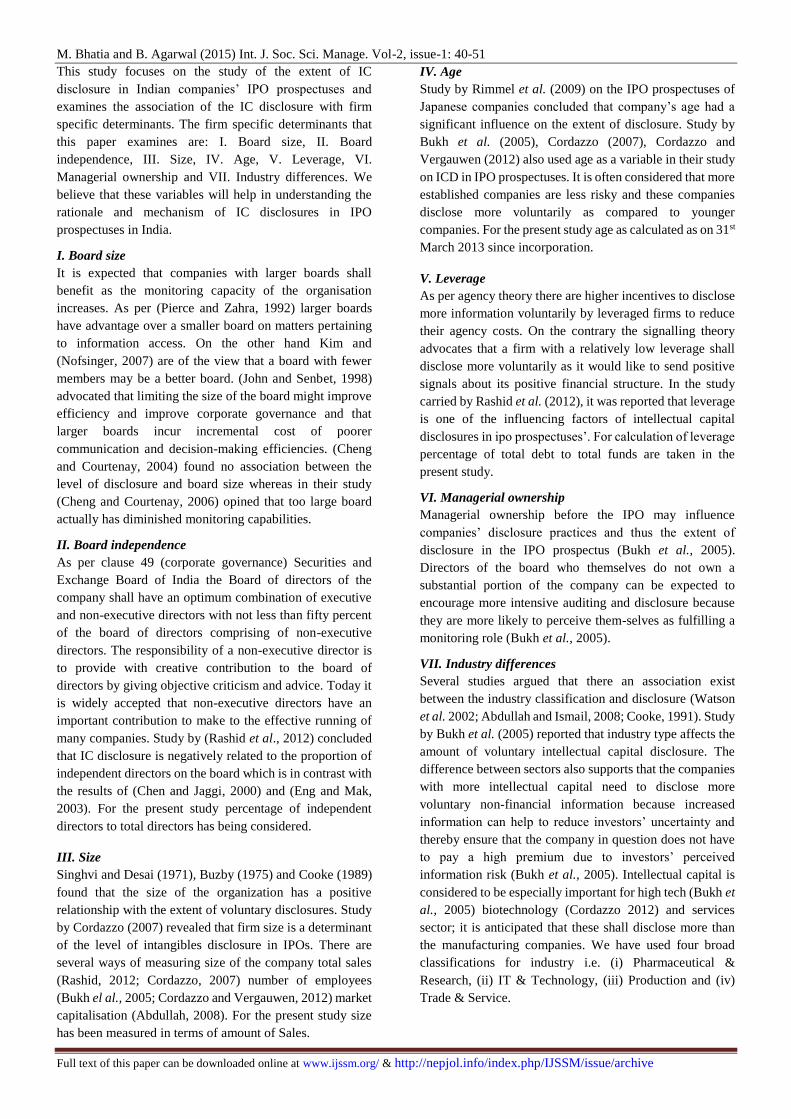
Variables affecting disclosures and Hypothesis
development
There have been various studies in recent past on
intellectual capital disclosures and these studies associated
the ICD index with various variables as given in Table 1
Table 1: Studies on IC disclosures in IPO prospectus and the variables studied
Study conducted by Country of study Variables studied
Bukh et al., 2005 Denmark
i. Company type
ii. Managerial ownership before the IPO
iii. Size of the company
iv. Age of the firm
Cordazzo, 2007 Italy
i. Firm size
ii. Pre-IPO managerial ownership
iii. Firm age
iv. Level of technology
Rimmel et al., 2009 Japan
i. Industry differences
ii. Managerial ownership before the IPO
iii. Company size
iv. Company age
Ho et al., 2012 Hongkong
i. Industry difference
ii. Managerial ownership before the IPO
iii. Size of the company
iv. age of the firm
Rashid et al., 2012 Malaysia
i. Board size
ii. Board independence
iii. Age
iv. Leverage
v. Underwriter
vi. Listing board
vii. Board diversity
viii. Size
ix. Auditor
Cordazzo and Vergauwen, 2012 UK
i. Size
ii. Maturity
iii. Age
iv. Independence of the board
M. Bhatia and B. Agarwal (2015) Int. J. Soc. Sci. Manage. Vol-2, issue-1: 40-51
Full text of this paper can be downloaded online at www.ijssm.org/ & http://nepjol.info/index.php/IJSSM/issue/archive
This study focuses on the study of the extent of IC
disclosure in Indian companies’ IPO prospectuses and
examines the association of the IC disclosure with firm
specific determinants. The firm specific determinants that
this paper examines are: I. Board size, II. Board
independence, III. Size, IV. Age, V. Leverage, VI.
Managerial ownership and VII. Industry differences. We
believe that these variables will help in understanding the
rationale and mechanism of IC disclosures in IPO
prospectuses in India.
I. Board size
It is expected that companies with larger boards shall
benefit as the monitoring capacity of the organisation
increases. As per (Pierce and Zahra, 1992) larger boards
have advantage over a smaller board on matters pertaining
to information access. On the other hand Kim and
(Nofsinger, 2007) are of the view that a board with fewer
members may be a better board. (John and Senbet, 1998)
advocated that limiting the size of the board might improve
efficiency and improve corporate governance and that
larger boards incur incremental cost of poorer
communication and decision-making efficiencies. (Cheng
and Courtenay, 2004) found no association between the
level of disclosure and board size whereas in their study
(Cheng and Courtenay, 2006) opined that too large board
actually has diminished monitoring capabilities.
II. Board independence
As per clause 49 (corporate governance) Securities and
Exchange Board of India the Board of directors of the
company shall have an optimum combination of executive
and non-executive directors with not less than fifty percent
of the board of directors comprising of non-executive
directors. The responsibility of a non-executive director is
to provide with creative contribution to the board of
directors by giving objective criticism and advice. Today it
is widely accepted that non-executive directors have an
important contribution to make to the effective running of
many companies. Study by (Rashid et al., 2012) concluded
that IC disclosure is negatively related to the proportion of
independent directors on the board which is in contrast with
the results of (Chen and Jaggi, 2000) and (Eng and Mak,
2003). For the present study percentage of independent
directors to total directors has being considered.
III. Size
Singhvi and Desai (1971), Buzby (1975) and Cooke (1989)
found that the size of the organization has a positive
relationship with the extent of voluntary disclosures. Study
by Cordazzo (2007) revealed that firm size is a determinant
of the level of intangibles disclosure in IPOs. There are
several ways of measuring size of the company total sales
(Rashid, 2012; Cordazzo, 2007) number of employees
(Bukh el al., 2005; Cordazzo and Vergauwen, 2012) market
capitalisation (Abdullah, 2008). For the present study size
has been measured in terms of amount of Sales.
IV. Age
Study by Rimmel et al. (2009) on the IPO prospectuses of
Japanese companies concluded that company’s age had a
significant influence on the extent of disclosure. Study by
Bukh et al. (2005), Cordazzo (2007), Cordazzo and
Vergauwen (2012) also used age as a variable in their study
on ICD in IPO prospectuses. It is often considered that more
established companies are less risky and these companies
disclose more voluntarily as compared to younger
companies. For the present study age as calculated as on 31st
March 2013 since incorporation.
V. Leverage
As per agency theory there are higher incentives to disclose
more information voluntarily by leveraged firms to reduce
their agency costs. On the contrary the signalling theory
advocates that a firm with a relatively low leverage shall
disclose more voluntarily as it would like to send positive
signals about its positive financial structure. In the study
carried by Rashid et al. (2012), it was reported that leverage
is one of the influencing factors of intellectual capital
disclosures in ipo prospectuses’. For calculation of leverage
percentage of total debt to total funds are taken in the
present study.
VI. Managerial ownership
Managerial ownership before the IPO may influence
companies’ disclosure practices and thus the extent of
disclosure in the IPO prospectus (Bukh et al., 2005).
Directors of the board who themselves do not own a
substantial portion of the company can be expected to
encourage more intensive auditing and disclosure because
they are more likely to perceive them-selves as fulfilling a
monitoring role (Bukh et al., 2005).
VII. Industry differences
Several studies argued that there an association exist
between the industry classification and disclosure (Watson
et al. 2002; Abdullah and Ismail, 2008; Cooke, 1991). Study
by Bukh et al. (2005) reported that industry type affects the
amount of voluntary intellectual capital disclosure. The
difference between sectors also supports that the companies
with more intellectual capital need to disclose more
voluntary non-financial information because increased
information can help to reduce investors’ uncertainty and
thereby ensure that the company in question does not have
to pay a high premium due to investors’ perceived
information risk (Bukh et al., 2005). Intellectual capital is
considered to be especially important for high tech (Bukh et
al., 2005) biotechnology (Cordazzo 2012) and services
sector; it is anticipated that these shall disclose more than
the manufacturing companies. We have used four broad
classifications for industry i.e. (i) Pharmaceutical &
Research, (ii) IT & Technology, (iii) Production and (iv)
Trade & Service.

M. Bhatia and B. Agarwal (2015) Int. J. Soc. Sci. Manage. Vol-2, issue-1: 40-51
Full text of this paper can be downloaded online at www.ijssm.org/ & http://nepjol.info/index.php/IJSSM/issue/archive
From the discussions outlined above seven hypotheses are
developed and are mentioned below. Going by the review
of literature these hypotheses are stated in the null form:
H1: Board size- There is no association between extent of
intellectual capital disclosure and Board size of the
firm.
H2: Board independence- There is no association between
extent of intellectual capital disclosure and board
independence of the firm
H3: Size- There is no association between extent of
intellectual capital disclosure and size of the company.
H4: Age- There is no association between extent of
intellectual capital disclosure and age of the company.
H5: Leverage- There is no association between extent of
intellectual capital disclosure and leverage of the firm.
H6: Managerial ownership- There is no association
between extent of intellectual capital disclosure and
managerial ownership of the firm.
H7: Industry differences- There is no association between
intellectual capital disclosure and type of industry.
Methodology
This section discusses the sample selection method and data
collection process using content analysis methodology.
Sample selection
The companies selected for the study are those which came
up with IPO offering in the year 2011-12. There were 34
companies which came up with the IPO offerings in year
2011-12 we could get prospectus of 33 companies from
SEBI’s website and our study is based on these 33
companies. These companies are listed either on Bombay
stock Exchange BSE and/or National Stock Exchange NSE.
Apart from these IPOs funds were raised through equity on
Small and Medium Enterprise (SME) platform and through
follow on public offering (FPO). The constituents of the
sample are shown in Table 2.
Table 2: Constituents of Sample
S. N. Industry Number
of IPO Percentage
1 Pharmaceutical and
Research 3 9.09%
2 IT and Technology 3 9.09%
3 Production 15 45.45%
4 Trade and Service 12 36.36%
Total 33
Content Analysis
Content Analysis is a research technique for the objective
systematic and quantitative description of manifest content
of communications (Berelson 74). The main research
method used in this study is content analysis. Content
analysis is conducted on IPO prospectuses.
Scoring of items and construction of index
Companies’ IPO prospectuses for the period 2011-12 are
downloaded from Securities Exchange Board of India
SEBI’s website for scoring purposes.
This study uses a 78 items disclosure index developed by
Bukh et al. (2005). For constructing the disclosure index
each company is given a score of 1 for item disclosed and a
score of zero for item not disclosed. Disclosure index is
made by dividing the total number of items disclosed by the
the denominator of total items measured i.e. 78. Intellectual
Capital disclosure is divided into six categories and total of
items is 78. These six categories, 1. Employee (27
individual items), 2. Customer (14 individual items), 3.
Information technology (4 individual items), 4. Processes (8
individual items), 5. Research and development (9
individual items) and 6. Strategic statement (15 individual
items) are given in Table 3.
The extent of the IC disclosure index is quantified using
the following formula:
1
( ) / 100%n
i
i
ICDisclosureScore ICDS d M
Where, di expresses item i when the item’s value is 1 with
disclosure and 0 when there was no disclosure and M is 78
(the total number of items being measured).
Regression Analysis
In the IC disclosures literature the associations among the
IC disclosure level and its potential indicators are
commonly estimated using multiple regression analysis.
The following OLS regression model is used to evaluate the
association between IC disclosure and potential explanatory
variables:
YICDS = α + β1XBSIZE + β2 XBIND + β3XCSIZE + β4XCAGE +
β5XLEV + β6XMOWN + Σ β7XPHARMA + β8XIT&TECH +
β9XPROD + β10XTRA&SER + ɛ
Where, ICDS = Represents the percentage of the number
of IC items disclosed by IPOs to the total number of IC
items.
BSIZE = Represents the total number of directors.
BIND = Represents the percentage of independent
directors on the board.
CSIZE = Represents the total sales as a proxy for company
size.
CAGE = Represents the duration between the founding
date and the IPO date.
LEV = Represents the percentage of book value of total
debt to value of total assets.
MOWN = Pre issue ownership of the mangers.
PHARMA = It is a dummy variable equal to one if the IPO
engaged of the Pharmaceuticals and Research companies
in the year of its listing and zero otherwise.
IT&TECH= It is a dummy variable equal to one if the IPO
engaged of the IT & Technology companies in the year of
its listing and zero otherwise.
M. Bhatia and B. Agarwal (2015) Int. J. Soc. Sci. Manage. Vol-2, issue-1: 40-51
Full text of this paper can be downloaded online at www.ijssm.org/ & http://nepjol.info/index.php/IJSSM/issue/archive
PROD = It is a dummy variable equal to one if the IPO
engaged of the Production companies in the year of its
listing and zero otherwise.
TRA&SER = It is a dummy variable equal to one if the
IPO engaged of the Trade & Service companies in the
year of its listing and zero otherwise.
ɛ = Represents the residual error.
Results and discussions
This section presents the results of the study. In the first part
of the analysis information pertaining with each item on
disclosure index in discussed and analysed. Analysis is also
carried out with respect to six categories and industry wise.
Second part deals with multivariate analysis wherein results
with respect to correlation and regression is presented and
discussed.
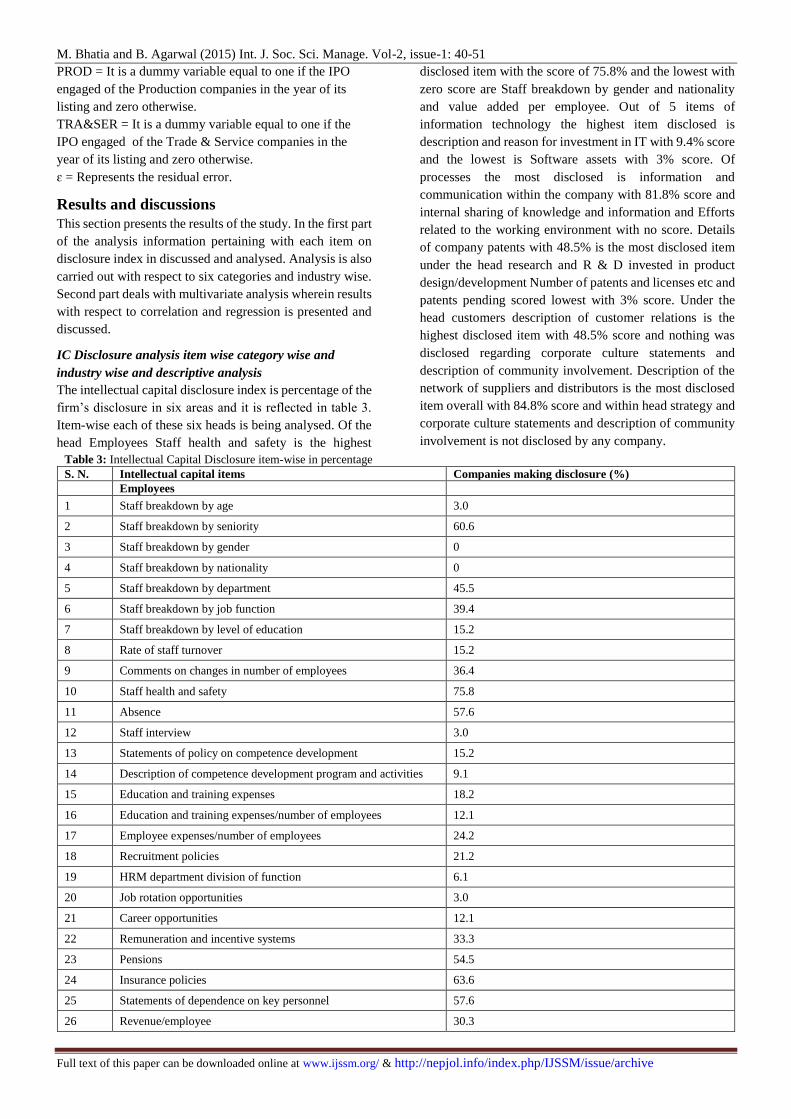
IC Disclosure analysis item wise category wise and
industry wise and descriptive analysis
The intellectual capital disclosure index is percentage of the
firm’s disclosure in six areas and it is reflected in table 3.
Item-wise each of these six heads is being analysed. Of the
head Employees Staff health and safety is the highest
disclosed item with the score of 75.8% and the lowest with
zero score are Staff breakdown by gender and nationality
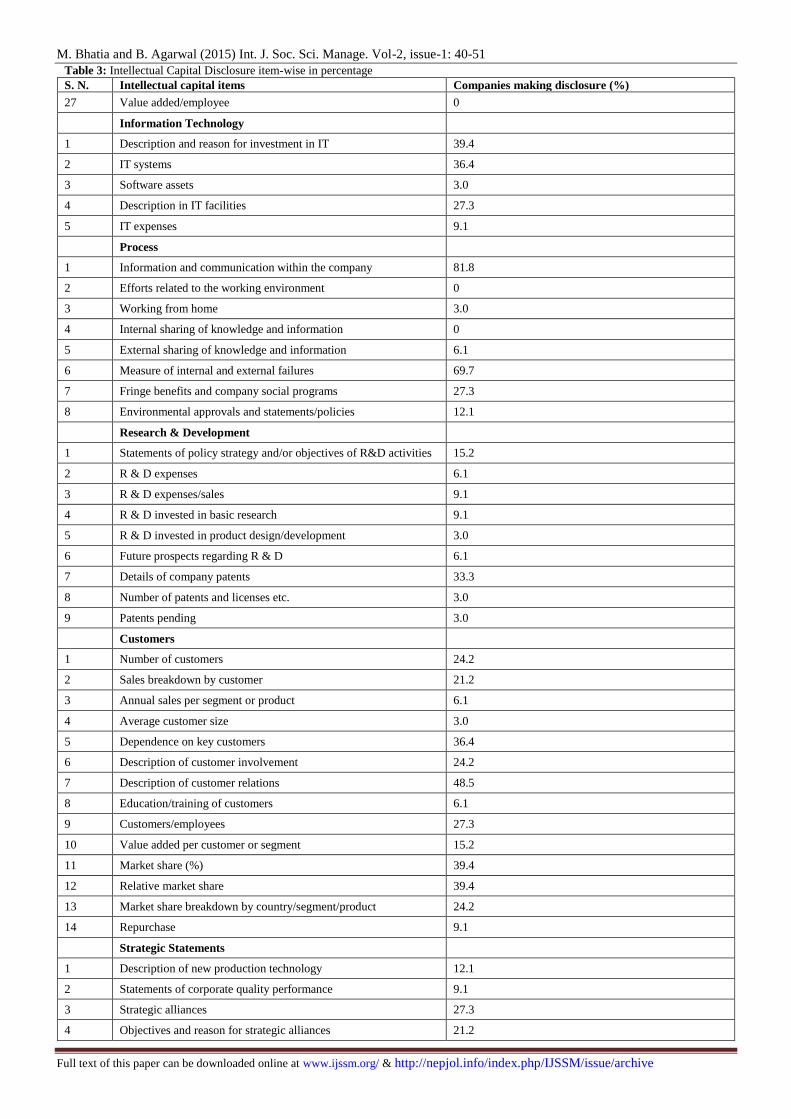
and value added per employee. Out of 5 items of
information technology the highest item disclosed is
description and reason for investment in IT with 9.4% score
and the lowest is Software assets with 3% score. Of
processes the most disclosed is information and
communication within the company with 81.8% score and
internal sharing of knowledge and information and Efforts
related to the working environment with no score. Details
of company patents with 48.5% is the most disclosed item
under the head research and R & D invested in product
design/development Number of patents and licenses etc and
patents pending scored lowest with 3% score. Under the
head customers description of customer relations is the
highest disclosed item with 48.5% score and nothing was
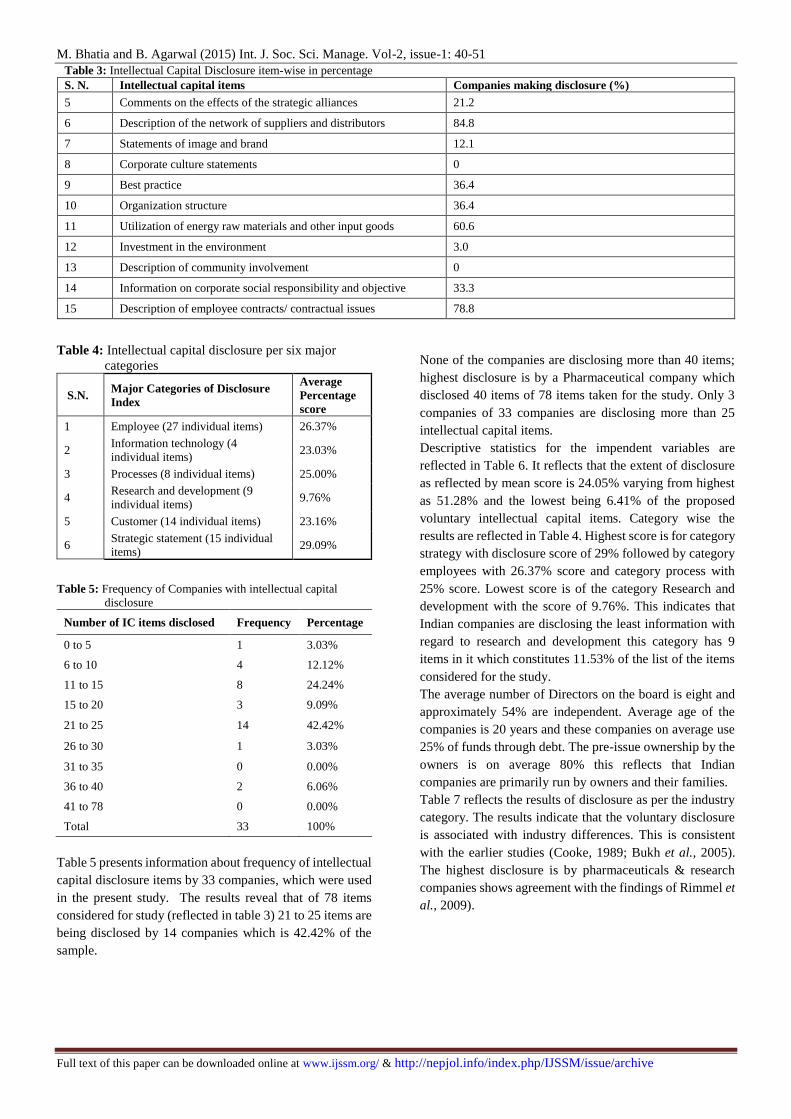
disclosed regarding corporate culture statements and
description of community involvement. Description of the
network of suppliers and distributors is the most disclosed
item overall with 84.8% score and within head strategy and
corporate culture statements and description of community
involvement is not disclosed by any company.
Table 3: Intellectual Capital Disclosure item-wise in percentage
S. N. Intellectual capital items Companies making disclosure (%)
Employees
1 Staff breakdown by age 3.0
2 Staff breakdown by seniority 60.6
3 Staff breakdown by gender 0
4 Staff breakdown by nationality 0
5 Staff breakdown by department 45.5
6 Staff breakdown by job function 39.4
7 Staff breakdown by level of education 15.2
8 Rate of staff turnover 15.2
9 Comments on changes in number of employees 36.4
10 Staff health and safety 75.8
11 Absence 57.6
12 Staff interview 3.0
13 Statements of policy on competence development 15.2
14 Description of competence development program and activities 9.1
15 Education and training expenses 18.2
16 Education and training expenses/number of employees 12.1
17 Employee expenses/number of employees 24.2
18 Recruitment policies 21.2
19 HRM department division of function 6.1
20 Job rotation opportunities 3.0
21 Career opportunities 12.1
22 Remuneration and incentive systems 33.3
23 Pensions 54.5
24 Insurance policies 63.6
25 Statements of dependence on key personnel 57.6
26 Revenue/employee 30.3
M. Bhatia and B. Agarwal (2015) Int. J. Soc. Sci. Manage. Vol-2, issue-1: 40-51
Full text of this paper can be downloaded online at www.ijssm.org/ & http://nepjol.info/index.php/IJSSM/issue/archive
Table 3: Intellectual Capital Disclosure item-wise in percentage
S. N. Intellectual capital items Companies making disclosure (%)
27 Value added/employee 0
Information Technology
1 Description and reason for investment in IT 39.4
2 IT systems 36.4
3 Software assets 3.0
4 Description in IT facilities 27.3
5 IT expenses 9.1
Process
1 Information and communication within the company 81.8
2 Efforts related to the working environment 0
3 Working from home 3.0
4 Internal sharing of knowledge and information 0
5 External sharing of knowledge and information 6.1
6 Measure of internal and external failures 69.7
7 Fringe benefits and company social programs 27.3
8 Environmental approvals and statements/policies 12.1
Research & Development
1 Statements of policy strategy and/or objectives of R&D activities 15.2
2 R & D expenses 6.1
3 R & D expenses/sales 9.1
4 R & D invested in basic research 9.1
5 R & D invested in product design/development 3.0
6 Future prospects regarding R & D 6.1
7 Details of company patents 33.3
8 Number of patents and licenses etc. 3.0
9 Patents pending 3.0
Customers
1 Number of customers 24.2
2 Sales breakdown by customer 21.2
3 Annual sales per segment or product 6.1
4 Average customer size 3.0
5 Dependence on key customers 36.4
6 Description of customer involvement 24.2
7 Description of customer relations 48.5
8 Education/training of customers 6.1
9 Customers/employees 27.3
10 Value added per customer or segment 15.2
11 Market share (%) 39.4
12 Relative market share 39.4
13 Market share breakdown by country/segment/product 24.2
14 Repurchase 9.1
Strategic Statements
1 Description of new production technology 12.1
2 Statements of corporate quality performance 9.1
3 Strategic alliances 27.3
4 Objectives and reason for strategic alliances 21.2
M. Bhatia and B. Agarwal (2015) Int. J. Soc. Sci. Manage. Vol-2, issue-1: 40-51
Full text of this paper can be downloaded online at www.ijssm.org/ & http://nepjol.info/index.php/IJSSM/issue/archive
Table 3: Intellectual Capital Disclosure item-wise in percentage
S. N. Intellectual capital items Companies making disclosure (%)
5 Comments on the effects of the strategic alliances 21.2
6 Description of the network of suppliers and distributors 84.8
7 Statements of image and brand 12.1
8 Corporate culture statements 0
9 Best practice 36.4
10 Organization structure 36.4
11 Utilization of energy raw materials and other input goods 60.6
12 Investment in the environment 3.0
13 Description of community involvement 0
14 Information on corporate social responsibility and objective 33.3
15 Description of employee contracts/ contractual issues 78.8
Table 4: Intellectual capital disclosure per six major
categories
S.N. Major Categories of Disclosure
Index
Average
Percentage
score
1 Employee (27 individual items) 26.37%
2 Information technology (4
individual items) 23.03%
3 Processes (8 individual items) 25.00%
4 Research and development (9
individual items) 9.76%
5 Customer (14 individual items) 23.16%
6 Strategic statement (15 individual
items) 29.09%
Table 5: Frequency of Companies with intellectual capital
disclosure
Number of IC items disclosed Frequency Percentage
0 to 5 1 3.03%
6 to 10 4 12.12%
11 to 15 8 24.24%
15 to 20 3 9.09%
21 to 25 14 42.42%
26 to 30 1 3.03%
31 to 35 0 0.00%
36 to 40 2 6.06%
41 to 78 0 0.00%
Total 33 100%
Table 5 presents information about frequency of intellectual
capital disclosure items by 33 companies, which were used
in the present study. The results reveal that of 78 items
considered for study (reflected in table 3) 21 to 25 items are
being disclosed by 14 companies which is 42.42% of the
sample.
None of the companies are disclosing more than 40 items;
highest disclosure is by a Pharmaceutical company which
disclosed 40 items of 78 items taken for the study. Only 3
companies of 33 companies are disclosing more than 25
intellectual capital items.
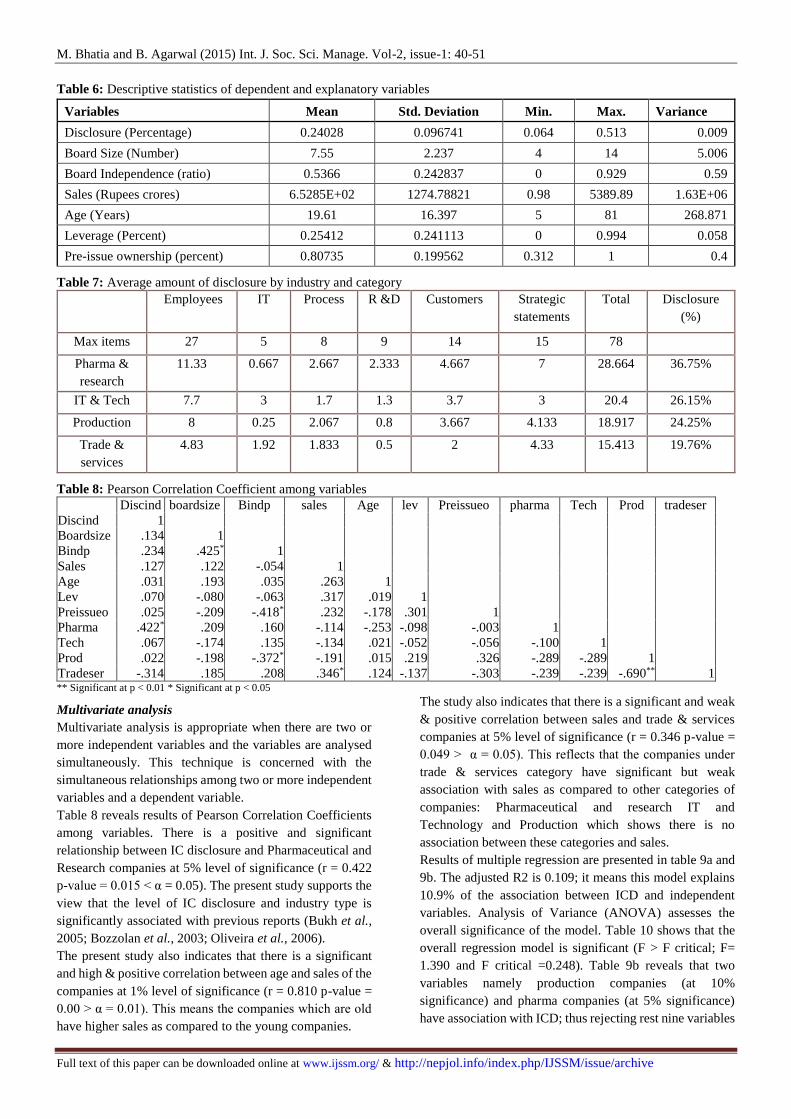
Descriptive statistics for the impendent variables are
reflected in Table 6. It reflects that the extent of disclosure
as reflected by mean score is 24.05% varying from highest
as 51.28% and the lowest being 6.41% of the proposed
voluntary intellectual capital items. Category wise the
results are reflected in Table 4. Highest score is for category
strategy with disclosure score of 29% followed by category
employees with 26.37% score and category process with
25% score. Lowest score is of the category Research and
development with the score of 9.76%. This indicates that
Indian companies are disclosing the least information with
regard to research and development this category has 9
items in it which constitutes 11.53% of the list of the items
considered for the study.
The average number of Directors on the board is eight and
approximately 54% are independent. Average age of the
companies is 20 years and these companies on average use
25% of funds through debt. The pre-issue ownership by the
owners is on average 80% this reflects that Indian
companies are primarily run by owners and their families.
Table 7 reflects the results of disclosure as per the industry
category. The results indicate that the voluntary disclosure
is associated with industry differences. This is consistent
with the earlier studies (Cooke, 1989; Bukh et al., 2005).
The highest disclosure is by pharmaceuticals & research
companies shows agreement with the findings of Rimmel et
al., 2009).
M. Bhatia and B. Agarwal (2015) Int. J. Soc. Sci. Manage. Vol-2, issue-1: 40-51
Full text of this paper can be downloaded online at www.ijssm.org/ & http://nepjol.info/index.php/IJSSM/issue/archive
Table 6: Descriptive statistics of dependent and explanatory variables
Variables Mean Std. Deviation Min. Max. Variance
Disclosure (Percentage) 0.24028 0.096741 0.064 0.513 0.009
Board Size (Number) 7.55 2.237 4 14 5.006
Board Independence (ratio) 0.5366 0.242837 0 0.929 0.59
Sales (Rupees crores) 6.5285E+02 1274.78821 0.98 5389.89 1.63E+06
Age (Years) 19.61 16.397 5 81 268.871
Leverage (Percent) 0.25412 0.241113 0 0.994 0.058
Pre-issue ownership (percent) 0.80735 0.199562 0.312 1 0.4
Table 7: Average amount of disclosure by industry and category
Employees IT Process R &D Customers Strategic
statements
Total Disclosure
(%)
Max items 27 5 8 9 14 15 78
Pharma &
research
11.33 0.667 2.667 2.333 4.667 7 28.664 36.75%
IT & Tech 7.7 3 1.7 1.3 3.7 3 20.4 26.15%
Production 8 0.25 2.067 0.8 3.667 4.133 18.917 24.25%
Trade &
services
4.83 1.92 1.833 0.5 2 4.33 15.413 19.76%
Table 8: Pearson Correlation Coefficient among variables
Discind boardsize Bindp sales Age lev Preissueo pharma Tech Prod tradeser
Discind 1
Boardsize .134 1
Bindp .234 .425* 1
Sales .127 .122 -.054 1
Age .031 .193 .035 .263 1
Lev .070 -.080 -.063 .317 .019 1
Preissueo .025 -.209 -.418* .232 -.178 .301 1
Pharma .422* .209 .160 -.114 -.253 -.098 -.003 1
Tech .067 -.174 .135 -.134 .021 -.052 -.056 -.100 1
Prod .022 -.198 -.372* -.191 .015 .219 .326 -.289 -.289 1
Tradeser -.314 .185 .208 .346* .124 -.137 -.303 -.239 -.239 -.690** 1 ** Significant at p < 0.01 * Significant at p < 0.05
Multivariate analysis
Multivariate analysis is appropriate when there are two or
more independent variables and the variables are analysed
simultaneously. This technique is concerned with the
simultaneous relationships among two or more independent
variables and a dependent variable.
Table 8 reveals results of Pearson Correlation Coefficients
among variables. There is a positive and significant
relationship between IC disclosure and Pharmaceutical and
Research companies at 5% level of significance (r = 0.422
p-value = 0.015 < α = 0.05). The present study supports the
view that the level of IC disclosure and industry type is
significantly associated with previous reports (Bukh et al.,
2005; Bozzolan et al., 2003; Oliveira et al., 2006).
The present study also indicates that there is a significant
and high & positive correlation between age and sales of the
companies at 1% level of significance (r = 0.810 p-value =
0.00 > α = 0.01). This means the companies which are old
have higher sales as compared to the young companies.
The study also indicates that there is a significant and weak
& positive correlation between sales and trade & services
companies at 5% level of significance (r = 0.346 p-value =
0.049 > α = 0.05). This reflects that the companies under
trade & services category have significant but weak
association with sales as compared to other categories of
companies: Pharmaceutical and research IT and
Technology and Production which shows there is no
association between these categories and sales.
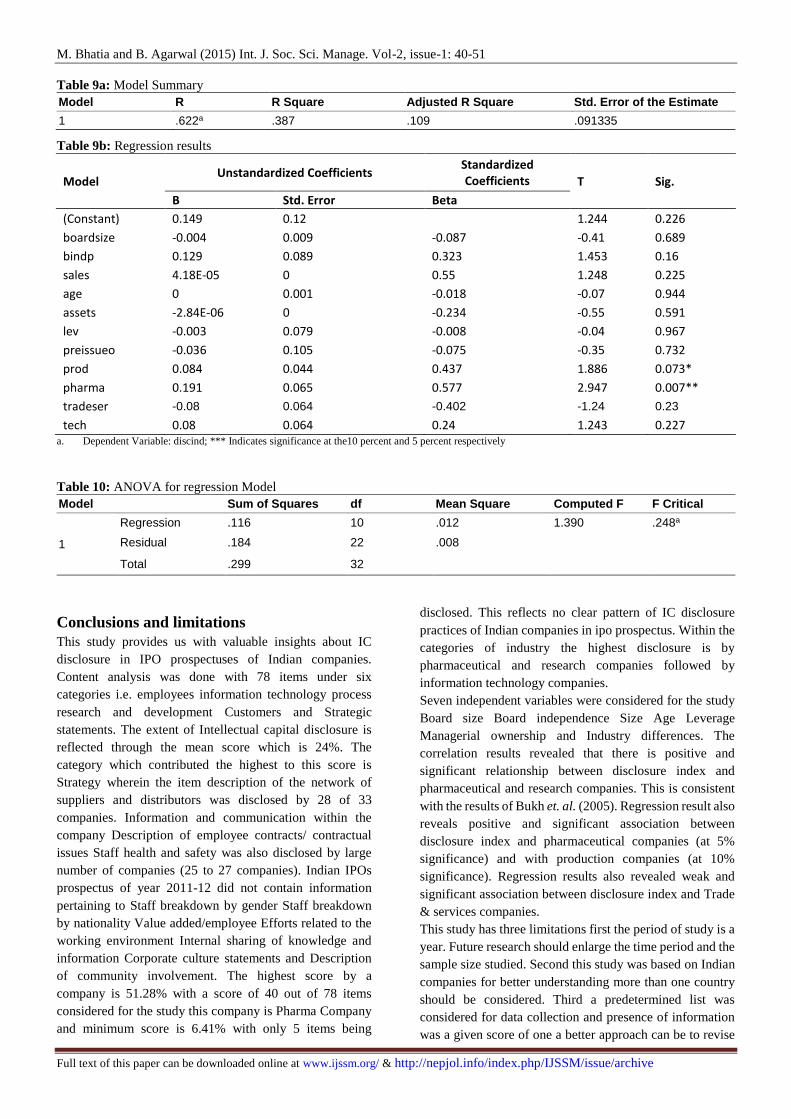
Results of multiple regression are presented in table 9a and
9b. The adjusted R2 is 0.109; it means this model explains
10.9% of the association between ICD and independent
variables. Analysis of Variance (ANOVA) assesses the
overall significance of the model. Table 10 shows that the
overall regression model is significant (F > F critical; F=
1.390 and F critical =0.248). Table 9b reveals that two
variables namely production companies (at 10%
significance) and pharma companies (at 5% significance)
have association with ICD; thus rejecting rest nine variables
M. Bhatia and B. Agarwal (2015) Int. J. Soc. Sci. Manage. Vol-2, issue-1: 40-51
Full text of this paper can be downloaded online at www.ijssm.org/ & http://nepjol.info/index.php/IJSSM/issue/archive
Table 9a: Model Summary
Model R R Square Adjusted R Square Std. Error of the Estimate
1 .622a .387 .109 .091335
Table 9b: Regression results
Model Unstandardized Coefficients
Standardized Coefficients T Sig.
B Std. Error Beta
(Constant) 0.149 0.12 1.244 0.226
boardsize -0.004 0.009 -0.087 -0.41 0.689
bindp 0.129 0.089 0.323 1.453 0.16
sales 4.18E-05 0 0.55 1.248 0.225
age 0 0.001 -0.018 -0.07 0.944
assets -2.84E-06 0 -0.234 -0.55 0.591
lev -0.003 0.079 -0.008 -0.04 0.967
preissueo -0.036 0.105 -0.075 -0.35 0.732
prod 0.084 0.044 0.437 1.886 0.073*
pharma 0.191 0.065 0.577 2.947 0.007**
tradeser -0.08 0.064 -0.402 -1.24 0.23
tech 0.08 0.064 0.24 1.243 0.227 a. Dependent Variable: discind; *** Indicates significance at the10 percent and 5 percent respectively
Table 10: ANOVA for regression Model
Model Sum of Squares df Mean Square Computed F F Critical
1
Regression .116 10 .012 1.390 .248a
Residual .184 22 .008
Total .299 32
Conclusions and limitations
This study provides us with valuable insights about IC
disclosure in IPO prospectuses of Indian companies.
Content analysis was done with 78 items under six
categories i.e. employees information technology process
research and development Customers and Strategic
statements. The extent of Intellectual capital disclosure is
reflected through the mean score which is 24%. The
category which contributed the highest to this score is
Strategy wherein the item description of the network of
suppliers and distributors was disclosed by 28 of 33
companies. Information and communication within the
company Description of employee contracts/ contractual
issues Staff health and safety was also disclosed by large
number of companies (25 to 27 companies). Indian IPOs
prospectus of year 2011-12 did not contain information
pertaining to Staff breakdown by gender Staff breakdown
by nationality Value added/employee Efforts related to the
working environment Internal sharing of knowledge and
information Corporate culture statements and Description
of community involvement. The highest score by a
company is 51.28% with a score of 40 out of 78 items
considered for the study this company is Pharma Company
and minimum score is 6.41% with only 5 items being
disclosed. This reflects no clear pattern of IC disclosure
practices of Indian companies in ipo prospectus. Within the
categories of industry the highest disclosure is by
pharmaceutical and research companies followed by
information technology companies.
Seven independent variables were considered for the study
Board size Board independence Size Age Leverage
Managerial ownership and Industry differences. The
correlation results revealed that there is positive and
significant relationship between disclosure index and
pharmaceutical and research companies. This is consistent
with the results of Bukh et. al. (2005). Regression result also
reveals positive and significant association between
disclosure index and pharmaceutical companies (at 5%
significance) and with production companies (at 10%
significance). Regression results also revealed weak and
significant association between disclosure index and Trade
& services companies.
This study has three limitations first the period of study is a
year. Future research should enlarge the time period and the
sample size studied. Second this study was based on Indian
companies for better understanding more than one country
should be considered. Third a predetermined list was
considered for data collection and presence of information
was a given score of one a better approach can be to revise
M. Bhatia and B. Agarwal (2015) Int. J. Soc. Sci. Manage. Vol-2, issue-1: 40-51
Full text of this paper can be downloaded online at www.ijssm.org/ & http://nepjol.info/index.php/IJSSM/issue/archive
and update the list to suit Indian conditions after taking
views of practitioners and researchers.
References Abdolmohammadi MJ (2005) Intellectual capital disclosure and
market capitalization. Journal of Intellectual Capital 6:
397 – 416.
Abdullah AB and Ismail KNIK (2008) Disclosure of Voluntary
Accounting Ratios by Malaysian Listed Companies.
Journal of Financial Reporting and Accounting 6: 1 – 20.
Abeysekera I (2007) Intellectual capital reporting between a
developing and developed nation. Journal of Intellectual
Capital 8: 329-45.
Abeysekera I (2008) Intellectual capital accounting: Practices in a
developing country. Routledge: New York.
Abeysekera I and Guthrie J (2005) An empirical investigation of
annual reporting trends of intellectual capital in Sri Lanka.
Journal of Critical Perspectives on Accounting 16: 151-
63.
Ahmed K and Courtis JK (1999) Associations between corporate
characteristics and disclosure levels in annual reports: a
meta-analysis. British Accounting Review 31: 35-61.
Ashton RH (2005) Intellectual capital and value creation: a review.
Journal of Accounting Literature 24: 53-134.
Barsky NP and Garry M (2000) The Most Valuable Resource:
Measuring and Managing Intellectual Capital. Strategic
Finance: 58-62.
Bontis N (2003) Intellectual capital disclosure in Canadian
corporations. Journal of Human Resource Costing and
Accounting 7: 9-20.
Bozzolan S, Favotto F and Ricceri F (2003) Italian annual
intellectual capital disclosure an empirical analysis.
Journal of Intellectual Capital 4: 543-558.
Bukh PN, Nielsen C, Gormsen P and Mouritsen J (2005)
Disclosure of information on intellectual capital in Danish
IPO prospectuses. Journal of Accounting Auditing &
Accountability 18: 713-732.
Buzby SL (1974) Selected items of information and their
disclosure in annual reports. The Accounting Review 49:
423-435.
Buzby SL (1975) Company size listed versus unlisted stocks and
the extent of financial disclosure. Journal of Accounting
Research 13: 16-37.
Chen CJP and Jaggi B (2000) Association between independent
non-executive directors’ family control and financial
disclosures in Hong Kong. Journal of Accounting and
Public Policy 19: 285-310.
Cheng ECM and Courtenay SM (2004) Board composition
Regulatory regime and voluntary disclosure 1st Edition.
Cheng ECM and Courtenay SM (2006) Board composition
Regulatory regime and voluntary disclosure. International
Journal of Accounting 41: 262-289.
Cooke TE (1989) Voluntary corporate disclosure by Swedish
companies. Journal of International Financial
Management and Accounting 1: 171-195.
Cordazzo M (2007) Intangibles and Italian IPO prospectuses: a
disclosure analysis. Journal of Intellectual Capital 8: 288-
305.
Cordazzo M and Vergauwen PGMC (2012) Intellectual capital
disclosure in the UK biotechnology IPO prospectuses.
Journal of Human Resource Costing & Accounting 16: 4
– 19.
Eng LL and Mak YT (2003) Corporate governance and voluntary
disclosure. Journal of Accounting and Public Policy 22:
325-45.
Guthrie J and Petty R (2000) Intellectual capital: Australian annual
reporting practices. Journal of Intellectual Capital 1: 241-
50.
Guthrie J Petty R and Ricceri F (2006) The voluntary reporting of
intellectual capital: comparing evidence from Hong Kong
and Australia. Journal of Intellectual Capital 7: 254-71.
Guthrie J, Petty R, Yongvanich K and Ricceri F (2004) Using
content analysis as a research method to inquire into
intellectual capital reporting. Journal of Intellectual
Capital 5: 282-93.
Helin A (2001) Quality and Measurement of Intellectual Capital at
an Accounting Firm supplying an Intellectual Product
Intellectual Product and Intellectual Capital. Leon
Kozminski. Academy of Entrepreneurship and
Management Warschau: 237–271.
Ho H, Chau K, and Cheung P (2012) Intellectual Capital
Disclosure and Initial Public Offerings: Evidence from
Hong Kong. Journal of Applied Economics and Business
Research 2: 56-68.
John K and Senbet L (1998) Corporate governance and board
effectives. Journal of Banking and Finance 22: 371-403
Kamath GB (2007) The intellectual capital performance of the
Indian banking sector. Journal of Intellectual Capital 8:
96 – 123.
Kim AK, Kitsabunnarat-Chatjuthamard P and Noftsinger JR
(2007) Large shareholders board independence and
minority shareholders rights; Evidence from Europe.
Journal of Corporate Finance 13: 859-80.
Oliveira L, Rodrigues L and Craig R (2006) Firm-specific
Determinants of Intangibles Reporting: Evidence from the
Portuguese Stock Market. Journal of Human Resource
Costing and Accounting 10: 11-33.
Parker LD (2007) Financial and external reporting research: the
broadening corporate governance challenge. Journal of
Accounting and Business Research 37: 39-54.
Pierce J and Zahra S (1992) Board composition from a strategic
contingency perspective. Journal of Management Studies
29: 411-38.
Rashid AA, Ibrahim M K, Othman R and See KF (2012) IC
disclosures in IPO prospectuses: evidence from Malaysia.
Journal of Intellectual Capital 13: 57 – 80.

M. Bhatia and B. Agarwal (2015) Int. J. Soc. Sci. Manage. Vol-2, issue-1: 40-51
Full text of this paper can be downloaded online at www.ijssm.org/ & http://nepjol.info/index.php/IJSSM/issue/archive
Rimmel G, Nielsen C and Yosano T (2009) Intellectual capital
disclosures in Japanese IPO prospectuses. Journal of
Human Resource Costing and Accounting 13: 316-37.
Shaker AZ (1999) The Academy of Management Executive
(1993-2005). Global Competitiveness Part II 13: 36-42
Singhvi S and Desai HB (1971) An empirical analysis of the
quality of corporate financial disclosure. The Accounting
Review 46: 129-13
Stewart TA (1991) Now capital means brains not just bucks
(intellectual capitalism ideas for 1991). Fortune 93: 31-
31.
Vandemaele SN, Vergauwen PGMC and Smits AJ (2005)
Intellectual capital disclosure in The Netherlands Sweden
and the UK a longitudinal and comparative study. Journal
of Intellectual Capital 6: 417-26.
Vergauwen P, Bollen L and Oirbans E (2007) Intellectual capital
disclosure and intangible value drivers: an empirical study.
Management Decision 45: 1163-1180.