international maritime organization · of maritime security and law enforcement challenges in order...
TRANSCRIPT

International Maritime Organization
Financial report and audited financial statements for the year ended 31 December 2017
Report of the External Auditors

TABLE OF CONTENTS Page
Financial report for the year ended 31 December 2017 1
Introduction 2
Highlights of maritime activities in 2017 3
Strategic plan for 2018 – 2023 6
Financial management 6
Financial and budget performance highlights 8
Letter of Transmittal 14 Statement on Internal Control for the year ended 31 December 2017 16 Report of the External Auditors: Opinion 18 Financial statements for the year ended 31 December 2017 20
Statement I Statement of Financial Position 21
Statement II Statement of Financial Performance 22
Statement III Statement of Changes in Net Assets 23
Statement IV Statement of Cash Flow 24
Statement V Statement of Comparison of Budget and Actual Amounts 25
Notes to the Financial Statements 27

FINANCIAL REPORT AND AUDITED FINANCIAL STATEMENTS FOR THE YEAR ENDED 31 DECEMBER 2017
1
INTERNATIONAL MARITIME ORGANIZATION
FINANCIAL REPORT
FOR THE YEAR ENDED 31 DECEMBER 2017

FINANCIAL REPORT AND AUDITED FINANCIAL STATEMENTS FOR THE YEAR ENDED 31 DECEMBER 2017
2
SECRETARY-GENERAL'S STATEMENT
INTRODUCTION 1 In accordance with financial regulation 12.10, I have the honour to submit to the Council, for its examination and onward transmission to the Assembly, the financial statements of the International Maritime Organization (IMO) for the year ended 31 December 2017. 2 The Report of the External Auditor on the audit of the 2017 financial statements, together with his opinion thereon, are also submitted to the Council as prescribed under financial regulation 12.10. 3 The financial statements have been prepared in accordance with the International Public Sector Accounting Standards (IPSAS), as prescribed by financial regulation 11.1, adopted by the Assembly through resolution A.1017(26) effective 1 January 2010, and in line with the United Nations policy that IPSAS be used as the accounting standards by United Nations system organizations. 4 In 1948, an international conference in Geneva adopted a convention formally establishing the Intergovernmental Maritime Consultative Organization (IMCO). The Convention entered into force in 1958 and the Organization came into being in 1959. In 1982, the original name was changed to the International Maritime Organization. The Headquarters of the Organization are in London and its complement is approximately 322 staff members, including project staff and Junior Professional Officers. IMO's principal place of business, as well as the names and addresses of its General Counsel, actuary, principal bankers and external auditor are indicated in annex 1 to these financial statements. 5 Within the meaning of IPSAS, IMO also controls the World Maritime University (WMU) and the IMO International Maritime Law Institute (IMLI), the financial records of which are presented within these financial statements. IMO is not a controlled entity within the meaning of IPSAS, its ultimate decision-making body being it`s Assembly of 173 Member States, with an elected Council of 40 Member States performing, in accordance with Article 26 of its constitutive Convention, all functions of the Assembly, with the exception of some technical matters, between sessions of the Assembly. 6 The purposes of the Organization, as summarized in Article 1(a) of its Convention, are "to provide machinery for cooperation among Governments in the field of governmental regulation and practices relating to technical matters of all kinds affecting shipping engaged in international trade; to encourage and facilitate the general adoption of the highest practicable standards in matters concerning maritime safety, efficiency of navigation and prevention and control of marine pollution from ships; and to deal with administrative and legal matters related to the purposes set out in this Article".

FINANCIAL REPORT AND AUDITED FINANCIAL STATEMENTS FOR THE YEAR ENDED 31 DECEMBER 2017
3
HIGHLIGHTS OF MARITIME ACTIVITIES IN 2017 7 2017 saw IMO actively pursuing its targets and objectives in a wide range of subject areas. Some of the highlights of the year for the Organization are summarized below.
Maritime safety 8 The Maritime Safety Committee (MSC), at its 98th session in June 2017, agreed to include in its agenda for MSC 99 a scoping exercise to determine how the safe, secure and environmentally sound operation of Maritime Autonomous Surface Ships (MASS) may be introduced in IMO instruments, recognizing that the Organization should take a proactive and leading role, given the rapid technological developments relating to the introduction of commercially operated ships in autonomous/unmanned mode. The scoping exercise is seen as a starting point and is expected to touch on an extensive range of issues, including the human element, safety, security, interactions with ports, pilotage, responses to incidents and protection of the marine environment. 9 The MSC adopted resolution MSC.428(98) on Maritime cyber risk management in safety management systems, reminding stakeholders that the mandatory International Safety Management (ISM) Code includes a requirement for all identified risks to ships, personnel and the environment to be assessed and for appropriate safeguards to be established. The resolution encourages Administrations to ensure that cyber risks are appropriately addressed in safety management systems no later than the first annual verification of the company's Document of Compliance after 1 January 2021. The MSC also approved a joint MSC-FAL circular on Guidelines on maritime cyber risk management, providing high-level recommendations for maritime cyber risk management and including background information, functional elements and best practices for effective cyber risk management. 10 The MSC confirmed that the initial verification audit of ship construction rules for oil tankers and bulk carriers submitted by 12 classification societies had been successfully completed, following rectification of the non-conformities reported, as instructed by MSC 96, made progress in developing amendments to the GBS (goal-based standards) Verification Guidelines, and agreed an updated timetable and schedule of activities for the implementation of the GBS verification scheme, including the maintenance of verification. 11 Concerning the implementation of the E-navigation strategy and operational safety, the MSC adopted and approved a number of new and revised performance standards and guidelines related to operational safety, including an MSC circular on Guidelines for shipborne position, navigation and timing (PNT) data processing, which provides guidance on enhancing the safety and efficiency of navigation by improved provision of position, navigation and timing (PNT) data to bridge teams (including pilots) and shipboard applications (e.g. AIS, ECDIS, etc.). Consequential amendments to the Performance standards for multi-system shipborne radio navigation receivers (resolution MSC.401(95)) as well as the Revised guidelines and criteria for ship reporting systems (resolution MSC.43(64)), addressing mandatory ship reporting systems established in accordance with SOLAS regulation V/11, were also adopted. 12 The MSC approved the Modernization Plan of the Global Maritime Distress and Safety System (GMDSS), prepared by the Sub-Committee on Navigation, Communications and Search and Rescue (NCSR). The plan envisages the development of amendments to SOLAS and related instruments for approval in 2021 and their adoption in 2022, with entry into force in 2024.
Environmental protection 13 The International Convention for the Control and Management of Ships' Ballast Water and Sediments (BWM Convention) entered into force on 8 September 2017. The Marine Environment Protection Committee (MEPC) adopted a resolution on a practical and pragmatic implementation schedule for ships to comply with the Convention.
FINANCIAL REPORT AND AUDITED FINANCIAL STATEMENTS FOR THE YEAR ENDED 31 DECEMBER 2017
4
14 The MEPC agreed the scope of work needed to achieve consistent implementation of the 0.50% m/m global limit of the sulphur content of ships’ fuel oil, which will come into effect from 1 January 2020. Amendments to MARPOL Annex VI were adopted to designate the North Sea and the Baltic Sea as emission control areas (ECAs) for nitrogen oxides (NOX). Both ECAs will take effect on 1 January 2021, thereby considerably lowering emissions of NOx from international shipping in those areas. 15 The MEPC continued to build on the solid work the Organization has undertaken to address greenhouse gas (GHG) emissions from international shipping, with work on track for the adoption of an initial IMO strategy on the reduction of GHG emissions from ships at MEPC 72 in April 2018, in accordance with a Roadmap approved at MEPC 70. Following the agreement on a draft outline for the structure of the initial IMO Strategy, two intersessional meetings were held to further develop the text of the draft Strategy, with a view to its finalization at the third intersessional meeting scheduled for the week before MEPC 72. 16 The Tubbataha Reefs Natural Park, situated in the Sulu Sea, Philippines was designated as a Particularly Sensitive Sea Area (PSSA). 17 The Governing Bodies of London Convention / Protocol commenced its work on the development of methods to enable routine, reliable monitoring, assessment and reporting of microplastic contaminant levels in waste streams, such as dredged material and sewage sludge.
Facilitation and security 18 IMO has focussed on assisting States to implement a multi-agency and multi-disciplinary approach to maritime security and facilitation, with a particular focus on national organization and inter-agency cooperation, including the establishment of national maritime security and facilitation committees. Capacity building activities in ports, pursuant to the 2017 World Maritime Day theme “Connecting ships ports and people”, have promoted better implementation of SOLAS chapter XI-2, the ISPS Code, the SUA Treaties and the FAL Convention, including the reduction of stowaway incidents. Regional initiatives to counter piracy and armed robbery against ships continue to bear fruit with GISIS recording for 2017 the lowest number of attacks for over 20 years (203 attacks as against an annual average of 339 between 1998 and 2017). Fourteen signatory States to the counter piracy-focussed Djibouti Code of Conduct have signed the 2017 Jeddah Amendment to the Djibouti Code of Conduct, aligning it with the Yaoundé Code of Conduct in west and central Africa, and widening its scope to address a range of maritime security and law enforcement challenges in order to promote sustainable maritime development and better achieve sustainable development goals. Ongoing maritime security and facilitation related issues under discussion in the MSC and FAL Committees included cyber security, autonomous ships, maritime single windows and electronic data interchange, as well as adoption of amendments to the FAL Convention which enter into force from 2018.
Legal matters 19 The training programme on the implementation of IMO's instruments into domestic legislation continues and is expanding. It provides participants from IMO Member States with the opportunity to familiarize themselves with the Organization, its structure and the treaty making process at IMO. Treaties covered by the IMO Member State Audit Scheme as well as the civil liability conventions are presented and analysed. The main focus of the programme is on the implementation of those treaties into national legislation. The participants learn drafting techniques and best practices in the implementation process. Special attention is paid to the implementation of those amendments to IMO treaties which are adopted through the tacit acceptance procedure. The ultimate goal of the programme is to furnish participants with the knowledge that is necessary to develop national legislation and to keep it up to date to ensure compliance with IMO standards. 20 A workshop on the benefits of ratification of the 2010 Hazardous and Noxious Substances (HNS) Convention has been developed and will be delivered. The workshop provides a comprehensive overview of the

FINANCIAL REPORT AND AUDITED FINANCIAL STATEMENTS FOR THE YEAR ENDED 31 DECEMBER 2017
5
Convention, with an in depth analysis of the history of its development, principles, and need. It is delivered in collaboration with the IOPC Funds Secretariat, the International Group of P&I Clubs and Member States.
Outreach 21 IMO's public facing visibility continues to improve. Engagement with a consulting firm to better integrate IMO issues into the mainstream media is underway and showing promising results. IMO engagement through social media is at an all-time high and continues to grow. The IMO Twitter feed for the Day of the Seafarer celebration on 25 June 2017 was that day's most read "tweet", with over 13 million impressions worldwide. Views and original content in the French and Spanish languages derived from the IMO multilingual website launched in May 2015 continue to grow. The IMO Maritime Ambassador (IMOMA) Scheme now has 49 IMOMAs from Member States and NGOs in consultative status with the Organization. IMOMAs conducted 356 outreach activities in 2017, primarily targeting students to attract them to a maritime career. The IMOMA Scheme is the subject of a comprehensive review by the Secretariat.
Technical Cooperation 22 The Organization continues to provide assistance to Member States to enhance the implementation and enforcement of IMO instruments. In 2017, the number of activities delivered decreased slightly compared to the number delivered in 2016, although the delivery rate and the number of persons trained increased. Overall, however, the figures show consistency with previous years in terms of both total numbers and percentage of delivery. 23 In 2017, 215 activities were delivered out of a total of 258 activities programmed, for a delivery rate of 83%. This represents an increase in delivery rate of 4 percentage points from 2016, when 79% of activities programmed were delivered. An additional 5 activities were ongoing at the end of 2017, which, when added to those completed by the end of the year, brings the total delivery to 220 out of 258, or 85%. Of the activities delivered in 2017, 8 were advisory and needs assessment missions, which was a decrease from 18 in 2016, while 119 were national and regional training courses, just one more than in 2016. A total of 87 other events were delivered, as compared to 101 similar activities carried out during 2016. These other activities included maritime legislation, review and updating of training packages, meetings of heads of maritime administrations and conferences. 24 A total of 64 fellows completed fellowships in the maritime field in 2017, compared with 72 fellows recorded in 2016. The 2017 total includes 26 fellows who qualified through the IMO global maritime training institutions, WMU and IMLI, compared with the 22 who did so in 2016. Additionally, some 3,500 individuals worldwide were trained through attendance at national and regional training workshops and seminars, compared with the 2,921 recorded in 2016. A further 500 senior officials attended events in 2017 aimed at developing and harmonizing regional strategies on maritime technical issues, a decrease from the 1,124 recorded in 2016. This figure is in addition to the number of persons trained through the regular training courses listed above. 25 The breadth of activities delivered under the ITCP underscores the importance of the active engagement of the Secretariat in providing the assistance requested by Member States in support of the regulatory work of the Organization

FINANCIAL REPORT AND AUDITED FINANCIAL STATEMENTS FOR THE YEAR ENDED 31 DECEMBER 2017
6
STRATEGIC PLAN FOR 2018 – 2023 26 In 2017, the work on the development of a new Strategic Plan has been finalized with the adoption of the Strategic Plan for the six-year period 2018 to 2023 by the Assembly in December 2017 (A.1110(29)), including the first-ever Vision Statement for the Organization, 7 new focused Strategic Directions with corresponding performance indicators, as well overarching principles that should be taken into account in all of the Organization’s work. 27 The vision of IMO for the period 2018 to 2023 is as follows:
IMO will uphold its leadership role as the global regulator of shipping, promote greater recognition of the sector's importance and enable the advancement of shipping, while addressing the challenges of continuing developments in technology and world trade and the need to meet the 2030 Agenda for Sustainable Development.
To achieve this, IMO will focus on the review, development and implementation of and compliance with IMO instruments in its pursuit to proactively identify, analyse and address emerging issues and support Member States in their implementation of the 2030 Agenda for Sustainable Development.
28 As IMO continues to carry out its work, the following strategic directions set out the areas of particular focus for the period 2018 to 2023:
SD 1: Improve implementation
SD 2: Integrate new and advancing technologies in the regulatory framework
SD 3: Respond to climate change
SD 4: Engage in ocean governance
SD 5: Enhance global facilitation and security of international trade
SD 6: Ensure regulatory effectiveness
SD 7: Ensure organizational effectiveness
FINANCIAL MANAGEMENT
Risk 29 At its 100th session in June 2008, the Council approved the Organization's Risk Management Framework (RMF), consisting of a Risk Management Policy, Risk Management Definitions and a Risk Management Process. It requested the Secretariat to apply the RMF to the strategic directions and high-level actions falling under the Secretary-General's responsibility as well as to the Secretariat-related key objectives for 2009. A similar exercise has been conducted periodically since that time, the results being reported to the Council and its Risk Review, Management and Reporting Working Group (CWGRM). 30 In addition to the RMF, IMO has an established framework of internal controls, including internal oversight, designed to maximize the effective and efficient use of its resources and safeguard its assets.

FINANCIAL REPORT AND AUDITED FINANCIAL STATEMENTS FOR THE YEAR ENDED 31 DECEMBER 2017
7
Governance
31 The Organization's governance is provided through the Assembly and the Council and is defined in the IMO Convention. The key management personnel of IMO consists of the Secretary-General and seven Divisional/Departmental Directors. The key management personnel of WMU and IMLI consists of the President and Director, respectively. Related party disclosures in line with IPSAS requirements are accordingly included in the notes to the financial statements. The Council is responsible for providing intergovernmental support and specific policy direction to, and supervision of, the activities of IMO. In view of its State-membership composition, the Council is not considered a related party as defined by IPSAS.
Funding 32 IMO's activities are mainly funded by assessed contributions on its Member States and Associate Members. Voluntary contributions from Member States, governmental agencies, intergovernmental bodies and other public, private and non-governmental sources may support financially certain activities of the Organization, the finances of which may receive further support through commercial activities (including the sale of publications and catering and conference services); and through miscellaneous revenue (including interest on financial assets). Indirect support cost income, earned through third party agreements with donors, is also used to fund activities provided for in the regular budget. IMO is in good financial health with adequate resources to meets it mandated activities.
Sustainability 33 In considering the Organization's financial sustainability, an evaluation of the consequences of any significant delays or defaults in payments from Member States or any reductions in contributions from donors in the context of the recent known market volatility has been made, and a review was also made to determine whether there could be a consequential reduction in the scale of operations and/or the delivery of the Strategic Plan, the High-level Action Plan and the Divisional Business Objectives. Having considered IMO's projected activities and the corresponding risks, a determination has been made to note that the Organization has adequate resources to continue to operate in the medium term. Overall, based on operating assumptions and known risks and mitigations, the Organization will continue as a "going concern" in the context of preparing IMO's financial statements. 34 The assertion above is supported by: i) the budget approved by the Assembly for the 2018-2019 biennium; ii) the scope and content of the Strategic Plan prepared for the period 2018-2023; iii) the net assets held at the end of the 2017 financial period; iv) the high level of collections of the assessed contribution of over 95% for the past 10 years; and v) the trend in donor support that has been sustaining IMO's mandate, including delivery of technical cooperation work, as determined by the Council and Assembly.

FINANCIAL REPORT AND AUDITED FINANCIAL STATEMENTS FOR THE YEAR ENDED 31 DECEMBER 2017
8
FINANCIAL AND BUDGET PERFORMANCE HIGHLIGHTS
Financial analysis 35 The closing net asset position presented in Statement I amounted to £9,472,704 (2016: £15,938,256), as shown in the chart below. Although this represents a decrease of £6,465,552 (2016: a decrease of £4,267,918) from the opening balance on 1 January 2017, the net asset position still shows a healthy financial situation for the Organization as a whole. The net operating deficit of £3,266,759 and the actuarial loss of £3,198,793 accounted for the decrease of £6,465,552. 36 The decrease in cash and cash equivalents during 2017 reflects in part an increase in expenses in 2017, and a decrease in the GBP value of the Organization's holdings of US dollars of some £719,320, due to changes in foreign exchange rates between the two currencies during the year. The majority of the Organization's US dollar holdings are in respect of Multi-donor Trust Funds and other donor funds, which are budgeted, managed and reported in US dollars rather than GBP and, consequently, movements in the GBP value of such funds typically do not directly impact on the ability to deliver planned activities. A further factor contributing to the decrease is as a result of the purchase of IT assets required to enable improvements in business processes. The collection rate for Member States’ assessments remains strong, at 99.5% (2016: 98.9%). Of the total contribution due from Member States of £1,075,918, as at 31 December 2017, £149,080 relates to 2017 assessments and the remaining £926,838 relates to prior years’ assessments.
Net asset and cash position
37 Looking, again, at the closing net assets position, it should be noted that the reserves available to the Organization for future use are not without restrictions. Note 2.13 in the financial statements breaks down the overall reserve picture into the Organization's major funds, and it may be seen that, of the overall £9,472,704 (2016: £15,938,256) closing balance, £10,918,726 (2016: £13,240,200) relates to Multi-donor Trust Funds or the net position under bilateral agreements with individual donors, as shown in the below chart. Such funds can only be applied in accordance with the Terms of Reference of the Fund concerned or the appropriate contractual agreement with the donor, respectively, and, as such, there are significant restrictions over their future use.

FINANCIAL REPORT AND AUDITED FINANCIAL STATEMENTS FOR THE YEAR ENDED 31 DECEMBER 2017
9
38 It can also be seen from the chart below that the Working Capital Fund, the Headquarters Capital Fund, the Training and Development Fund and the Technical Cooperation Fund are all in a relatively strong financial position at present – noting that much of the surplus on the Trading Fund will, in due course, be transferred to the Technical Cooperation Fund in accordance with Assembly resolution A.1112(30). The Termination Benefit Fund reflects the fact that the Organization's long-term After Service Health Insurance (ASHI) liability stands at £40,303,417 (2016: £35,507,753). While the Assembly set aside funds of £6,000,000 to meet these liabilities by means of resolution A.1100(29), effective 1 January 2016 and £1,400,000 in 2017 as per resolution A.1112(30), the majority of these liabilities are presently unfunded and are reflected in the Termination Benefit Fund deficit as at 31 December 2017 of £34,598,607 (2016: £29,920,650). Further funding proposals will be considered by the Council during 2018.
Fund balances and reserves
39 Inventories, reflecting our stock of publications held for re-sale has increased by 35% to £1,118,521 when compared with prior year’s balance of £830,705 due to new editions of GMDSS Manual, STCW and Marpol (Consolidated Edition 2017), which were published at the end of the reporting year.
40 There has been an increase in other receivables as at 31 December 2017, to £3,190,309 (2016: 2,413,844). The increase is largely due to 2017 rent and other services invoices (£371,625) which remained outstanding at the year-end and a prepayment made by IMO of £375,059 for the period 2018. 41 The total value of property, plant and equipment held by the Organization as at 31 December 2017 slightly increased to £2,120,191(2016:£2,007,253). The increase of £112,938 is the net effect of additions to assets with a total value of £604,626 and the depreciation for the year of £490,761, and the loss on disposal of an asset of £927. The total additions were mainly attributable to the cost of replacing and refreshing the Organization’s Local Area Network and wireless network – WIFI (£461,768). During the year, assets with a total cost of £935,729 were disposed of, consisting mainly of simultaneous interpretation system (SIMS) in the main conference hall and two Committee Rooms and IT equipment. The cost of intangible assets has reduced by £104,578 to £872,850 (2016: 977,428), resulting from the net effect of the amortization charge for the year, offset to some extent by new intangible assets, particularly work on IMO’s SAP system to meet the demands of the ICSC remuneration reforms.

FINANCIAL REPORT AND AUDITED FINANCIAL STATEMENTS FOR THE YEAR ENDED 31 DECEMBER 2017
10
42 We continue to seek to carefully balance our obligations to suppliers with the need to effectively manage the Organization's cash flow, and there has been little change in the overall balance of payables and accruals relating to exchange transactions. The most significant portion of the accruals balance relates to services provided by UNDP under the Service Clearing Account arrangement, but which have not yet been billed by UNDP and have not been cleared through their monthly expenditure reporting. UNDP local offices worldwide provide IMO with a range and volume of services in the field which we would otherwise be unable to deliver in such an efficient manner, and are thereby key facilitators of the delivery of the Organization's Integrated Technical Cooperation Programme (ITCP). There has been an increase in payables relating to non-exchange transactions, in large part as a result of 2nd pre-financing received from the European Commission for the Global MTCC Network (GMN) project.
43 Liabilities relating to employee benefits are mainly for post-employment obligations to current staff and retirees for After Service Health Insurance (ASHI), repatriation benefits and accrued annual leave. These liabilities were subjected to actuarial valuation as at 31 December 2017, which resulted in an increase in liabilities to £45,998,294 (2016: £41,094,497). The increase in liability was mainly attributable to the actuarial loss of £3,198,793 (2016: £5,004,505). The actuarial loss decreased in 2017 as a result of changes in assumptions applied in the actuarial valuation of the liability due to the following main contributory factors: decrease in the discount rate from 3.6% in 2016 to 2.8% in 2017; decrease in inflation rate from 3.4% in 2016 to 2.0% in 2017; and adoption of the appropriate demographic assumptions affecting mortality, withdrawal and early retirement. A further increase in the liability of £1,705,004 represents the net effect of service and interest costs incurred and benefits paid during the year. This imbalance between the amounts being paid on a "pay as you go" basis for current retirees and the actual costs to the Organization for current staff and retirees, is likely to result in an increasing obligation in the future, and will continue to require careful monitoring and appropriate action, a matter considered by the Assembly as per resolution A.1112(30), in setting aside the £1,400,000 in addition to the £6,000,000 already transferred during 2016 by means of resolution A.1100(29). 44 The financial performance for 2017 reported a deficit of £3,266,759 (revenue minus expenses, including currency exchange loss) compared to a surplus of £736,587 in 2016. The currency exchange loss of £1,714,673 in 2017 is due to the strengthening of GBP against the USD currency, thereby decreasing the GBP value of cash holdings in USD currency. The amount of total expenses in excess of total revenue (£1,532,086) accounted for less than half of the deficit in 2017.
45 The change in the result of financial performance for 2017 in comparison with 2016 (excluding the effect of currency exchange) is attributed to an increase in total revenue and an increase in total expenses, the net effect of which amounts to £815,033. 46 The total revenue for 2017 was £49,663,557, an increase of £1,686,840 from 2016 when the total was £47,976,717. Voluntary contributions from donors accounted for almost 85% of the total increase in revenue in 2017 when compared to 2016. Revenue from assessed contributions (63%) and commercial activities (28%) continued to share the same percentage of total revenue in both years 2017 and 2016.
47 The total expenses for 2017 amounted to £51,215,643 compared with £50,343,836 in 2016, an increase of £871,807. The change is mainly driven by: an increase in staff and other personnel costs as a result of external factors (ICSC new remuneration package) and ASHI current service cost; an increase in supplies, consumables and other running costs attributable to disbursements made for implementation of projects funded from donor contributions.
48 It should be noted that the financial performance of revenue and expenses reflected in Statement II (Statement of Financial Performance) is presented on an IPSAS accrual basis and thus is different in its measurement and accounting from the budgetary performance of receipts and payments reflected in Statement Va (IMO Only Statement of Comparison of Budget and Actual Amounts) which is prepared on a modified cash/accrual basis. For example, the budget is prepared to reflect the purchase of new property, plant and

FINANCIAL REPORT AND AUDITED FINANCIAL STATEMENTS FOR THE YEAR ENDED 31 DECEMBER 2017
11
equipment rather than the depreciation charge over their useful life. Similarly, the budget approved by the Assembly does not cover the extra-budgetary or donor funds while the financial statements cover the entirety of the Organization’s financial position and performance. The difference in amounts between the two statements is reconciled, in detail in Note 5 to the Financial Statements, to the cash flow statement (Statement IV). For instance, the assessed contribution (i.e., invoiced amounts of £30,131,469) for the year is recognized in full as revenue in Statement II, whereas only receipted amounts (£30,450,082) are shown as Actual in Statement Va. Likewise, while expense in Statement II includes £941,218 for depreciation and amortization on an accrual basis, that amount, as it is not a cash payment during the year, is not included in Statement Va which instead includes the cost of purchased assets.
Budget performance
49 The 29th session of the Assembly held in December 2015 adopted resolution A.1100(29) on the Results-Based budget for the 2016-2017 biennium, in which it approved the budget for the financial periods 2016 and 2017 for the IMO’s core funds, including an appropriation for 2017 of £45,835,000 to be funded in part through projected income of £44,329,000. 50 The Organization’s major sources of income are shown in the chart below, which shows actual performance in 2017 compared to the final budget figure.
Budget income against actual Income by type (in £’000)
51 The Assessment contributions of £30,450,082 represents just over two-thirds of the total income. In 2017, the increased receipt of £334,082 over the budgeted amount was due to the settlement of assessments due from prior years and also due to income from new members.
52 The Trading income of £12,860,596 is the next largest income stream representing 28% of the Organization’s income. The sales performance which exceeded the budget by £840,596 was a result in particular of higher level of sales relating to new releases including MARPOL and SHIPS’ ROUTEING 2017 publications and external catering functions.
53 There were no significant variances in the support costs and other income of the Organization. 54 The actual expenditure for each Fund against the final 2017 budget in shown in the chart below:
30,116
1,448
12,020
150
30,450
1,396
12,861
126
Assessed contributions Support cost income Trading fund income Other income
Budget Actual

FINANCIAL REPORT AND AUDITED FINANCIAL STATEMENTS FOR THE YEAR ENDED 31 DECEMBER 2017
12
Budget expenditure against actual expenditure by Fund (in £’000)
55 The overall expenditure for 2017, as shown in Statement V was £44,071,454. The key highlights are set out in the following paragraphs. 56 For the regular budget, the variance primarily related to staff costs, where actual vacancy levels varied from the budgetary assumptions made. In 2017, due to staff retirement, separation or transfer/recruitment to other posts, a total of 490 work-months (equivalent to 41 full time equivalent posts) were vacant, comprising 170 professional work-months (equivalent to 14 full time equivalent posts) and 320 General Service work-months (equivalent to 27 full time equivalent posts). Addressing the vacancy situation has been a priority for the Secretary-General and the Council have been updated on the situation regularly during 2017. 57 The remaining variance in the regular budget was spread across a variety of cost categories, including official mission travel, where the main driver was a lower level of Member State audits being completed under the IMSAS scheme as the scheme ramps up to full operation during 2018; and efficiencies delivered on a range of General Operating Expenditure items. A further £106,926 represents unliquidated obligations (ULO’s), contractual commitments made during the year and carried forward for delivery in 2018 in accordance with Financial Regulations 4.3 and 4.4. 58 The Trading Fund variance of £453,672 (7.5%) during 2017 is largely due to Staff Costs and Other Personnel where actual vacancy rates varied from budgetary assumptions. The remaining variance was attributable to the operating expenditure, primarily as purchases of inventory were lower than anticipated reflecting in part a continued shift towards Print on Demand (POD) of IMO publications. 59 In 2017, the Headquarters Capital Fund expenditure was £886,669, representing 71% of the final budget for the year. Savings were made in two areas in particular – the project to make SAP changes relating to the ICSC salary reforms was delivered under budget by £83,000, while a solution was found to extend the life of the Organization’s publications sales ecommerce site rather than require the full replacement which had been expected. In addition, a refresh of IT hardware is now expected in 2018 rather than 2017 as had been planned.
33,198
6,071
1,241 1,541 118
5,097
31,353
5,617 887 1,541
91
4,583
Regular Budget Trading Fund Headquarters CapitalFund
Termination BenefitFund
Training andDevelopment Fund
TechnicalCooperation Fund
Budget Actual

FINANCIAL REPORT AND AUDITED FINANCIAL STATEMENTS FOR THE YEAR ENDED 31 DECEMBER 2017
13
60 The Training and Development Fund expenditure in 2017 totalled of £91,088, representing budget utilisation of 77%, with a further £20,999 (17.8%) of commitments for transfer to 2018 for delivery in early 2018. The primary expenditure related to the roll out of the first year of a three-year management training programme across the Secretariat. 61 The final budget for technical cooperation (TC) activities financed from the Technical Cooperation Fund comprised the originally approved appropriation for 2017 of £4,850,000 and the budget brought forward from 2016 of £246,786 to finance some postponed activities. The TC expenditure for 2017 amounted to £4,582,571, accounting for 90% implementation. The variance of 10% is due to delays as a result of unforeseen events with the host countries or partners, thereby delaying implementation of the planned activities. In addition, funds were received through resource mobilisation efforts, and as a result, the need for TC funds to fund certain activities was reduced.
FINANCIAL REPORT AND AUDITED FINANCIAL STATEMENTS FOR THE YEAR ENDED 31 DECEMBER 2017
14
LETTER OF TRANSMITTAL
Pursuant to the financial regulation 11.2, we have the honour to submit the financial statements for the year ended 31 December 2017 of the International Maritime Organization, certified and approved in accordance with financial regulation 11.1, along with the Statement on Internal Control for the financial period 2017, which does not form a part of the financial statements. We confirm, to the best of our knowledge and belief, and having made appropriate enquiries with other officials of the organization, the following representations in connection with your audit of the financial statements of the International Maritime Organization for the year ended 31 December 2017: We are responsible for preparing financial statements that properly present the activities of the organization, and for making accurate representations to you. All of the accounting records and related information have been made available for the purposed of your audit, and all of transactions that occurred in the financial period have been, properly reflected in the financial statements and recorded by the organization in the accounting and other records.
1 The financial statements have been prepared and presented in accordance with: a. The International Public Sector Accounting Standards; b. The Financial Regulations and Financial Rules of the Organization; and c. The accounting policies of the Organization, as summarized in note 1 to the financial statements.
2 The accounting policies used by the organization as stated in the financial statements are consistent with
those of the previous year. 3 Within the meaning of IPSAS 25, IMO also controls WMU and IMLI for financial reporting purposes, the
financial records of which are presented in the consolidated financial statements. 4 The value of cash, cash equivalents and investments recorded is not impaired and, in our opinion, is fairly
stated. 5 All material accounts receivable have been included in financial statements and represent valid claims
against debtors. Apart from the estimated uncollectable contributions receivable as presented in note 2.2, we expect all significant accounts receivable at 31 December 2017 to be collected.
6 The property, plant and equipment, the intangible assets and the inventories disclosed in notes 2.3, 2. 7 and
2.8 to the financial statements, respectively, are owned by the organization and are free from any charge. 7 All known accounts payable and accruals have been included in the financial statements. 8 The commitments of the organization for the acquisition of goods and services, as well as the capital
commitments contracted but not delivered as at 31 December 2017, have been disclosed in note 2.9 and note 7.1 to the financial statements. Commitments for future expenses have not been recognized as liabilities.
9 All known legal or contingent liabilities as at 31 December 2017 have been disclosed in note.7.2 to the
financial statements. 10 All expenses reported during the period were incurred in accordance with the financial regulations and

FINANCIAL REPORT AND AUDITED FINANCIAL STATEMENTS FOR THE YEAR ENDED 31 DECEMBER 2017
15
financial rules of the organization and any specific donor requirements. 11 All losses of cash or receivables, ex gratia payments, presumptive frauds and frauds, wherever incurred,
were communicated to the External Auditors and reported in note 8. 12 Disclosure was made, in the financial statements, of all matters necessary to enable them to present fairly
the results of transactions during the period. 13 There have been no events since the IMO reporting date of 31 December 2017 that necessitate revision of
the information presented in the financial statements thereto.

FINANCIAL REPORT AND AUDITED FINANCIAL STATEMENTS FOR THE YEAR ENDED 31 DECEMBER 2017
16
STATEMENT ON INTERNAL CONTROL FOR THE YEAR ENDED 31 DECEMBER 2017
Scope of responsibility
1. As Secretary-General and Director of Administration Division of the International Maritime Organization (IMO), we are accountable, in accordance with the responsibilities assigned in Article X of the Financial Regulations, for establishing financial rules and procedures to ensure effective financial administration and the exercise of economy, and for maintaining internal financial control.
Purpose of the system of internal control
2. The system of internal control is designed to reduce and manage rather than eliminate the risk of failure to achieve the Organization's policies, aims and objectives. Therefore it can only provide a reasonable and not absolute assurance of effectiveness. It is based on an ongoing process designed to identify the principal risks, to evaluate the nature and extent of those risks and to manage them efficiently, effectively and economically. Internal control is a process effected by the Council, the Secretary-General, senior management and other members of the Secretariat, and designed to provide reasonable assurance on the achievement of the following internal control objectives:
the regularity of the receipt, custody, and disposal of all funds and other financial resources of the Organization;
the conformity of obligations and expenditures with the appropriations or other financial provision voted by the Assembly, or with the purposes and rules relating to trust and other special funds; and
the economic use of the resources of the Organization. 3. Thus, on an operational level, IMO's internal control system is not solely a policy or procedure that is performed at certain points in time, but rather continually operated at all levels within the Organization through internal control processes to ensure the above objectives.
4. The current statement on IMO's internal control processes, as described above, applies for the year ended 31 December 2017, and is up to the date of the approval of the Organization's 2017 financial statements.
Risk management and internal control
5. The Organization operates a Risk Management Framework, developed and approved by the Council, and is required to have an annual risk assessment exercise to identify and analyse risks to the delivery of those aspects of the Strategic Plan and High-level Action Plan which are the responsibility of the Secretariat, and to develop and implement mitigation plans where those risks are considered to be unacceptably high. While there is an annual exercise of risk assessment and evaluation, the application of the principles of risk management and the mitigation of risk to the extent practically possible is an ongoing process. The outcome of both the annual risk review exercise and the ongoing monitoring of risk inform assessments of the effectiveness of the established system of internal control.

FINANCIAL REPORT AND AUDITED FINANCIAL STATEMENTS FOR THE YEAR ENDED 31 DECEMBER 2017
17
Review of effectiveness
6. The review of the effectiveness of the system of internal control is also informed by:
senior managers, each of whom has a role to play in the system of internal control and has been assigned specific delegations within the framework provided by the Financial Regulations and Financial Rules, Procurement Manual and Budget Manual. Each staff member assigned such delegated responsibility has provided me with an individual attestation on internal control for the year ended 31 December 2017 which acknowledges the scope of their responsibility, reports any significant weaknesses identified in internal controls along with steps being taken to address them, and confirms that internal controls are operating effectively within their area of responsibility;
the work of the Internal Oversight and Ethics Office (IOEO), which has a dual function, both as internal oversight to provide me with reports on internal audits conducted during the year to provide independent and objective information on the adequacy and effectiveness of the Organization's system of internal controls, and as the ethics office to provide confidential advice and counsel to the Organization and its staff on ethics and standards of conduct, promote ethical awareness and responsible behaviour and handle referrals of allegations of unethical behaviour or conflicts of interest;
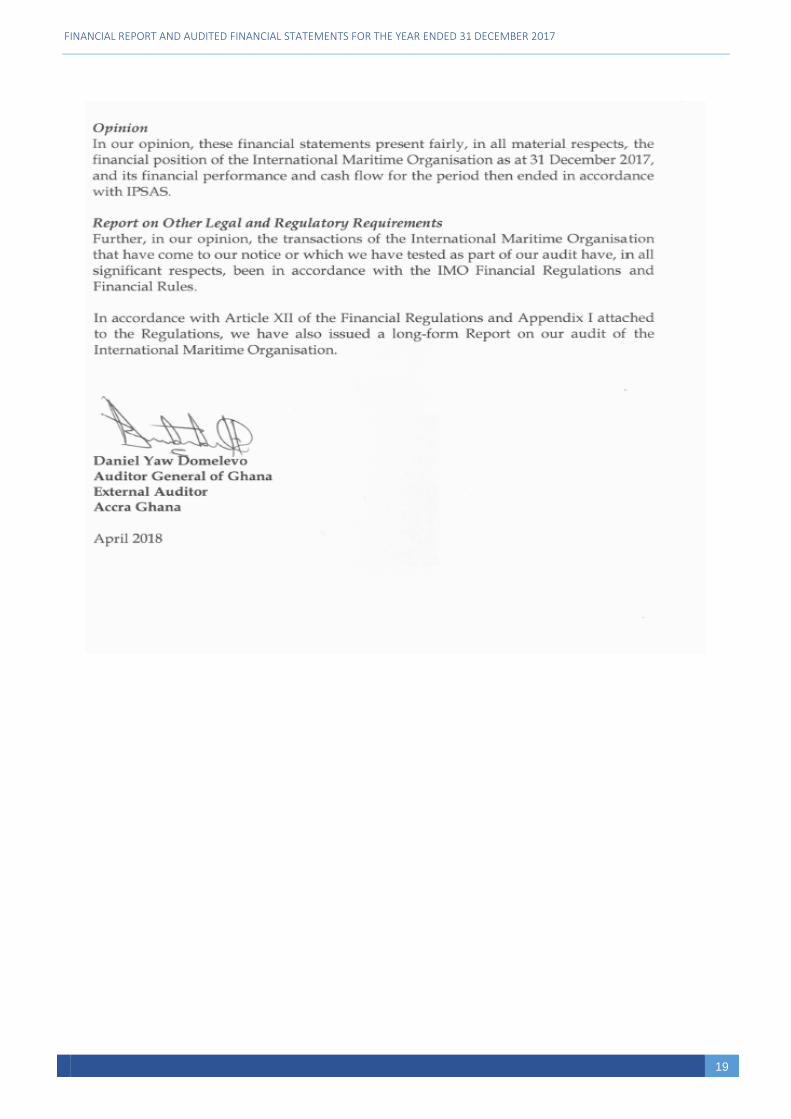
the External Auditor, the Auditor General of Ghana, who provides me with a management letter identifying any issues of control identified during the course of their annual audit and provides the Council and Assembly with an opinion on the accuracy of the Organization's financial statements; and
the Council and, specifically, its Council Working Group on Risk Management, which reviews the outcomes of the annual risk assessment exercise and identifies any action which it believes is necessary to address the findings thereof.
7. For the year 2017 there have been no significant issues to report in the operation of internal controls.
Conclusion
8. Effective internal control, no matter how well designed, has inherent limitations -including the possibility of circumvention -and therefore can only provide reasonable assurance. Furthermore, because of changes in conditions, the effectiveness of internal control may vary over time. In recognizing this, however, concludes that, to the best of our knowledge and information, the IMO Secretariat had an effective system of internal control for the year ended 31 December 2017, and up to the date of the approval of the financial statements for that year.

FINANCIAL REPORT AND AUDITED FINANCIAL STATEMENTS FOR THE YEAR ENDED 31 DECEMBER 2017
18
REPORT OF THE EXTERNAL AUDITOR: OPINION ON THE ORGANIZATION'S FINANCIAL STATEMENTS FOR THE
FINANCIAL YEAR ENDED 31 DECEMBER 2017
FINANCIAL REPORT AND AUDITED FINANCIAL STATEMENTS FOR THE YEAR ENDED 31 DECEMBER 2017
19

FINANCIAL REPORT AND AUDITED FINANCIAL STATEMENTS FOR THE YEAR ENDED 31 DECEMBER 2017
20
INTERNATIONAL MARITIME ORGANIZATION
FINANCIAL STATEMENTS
FOR THE YEAR ENDED 31 DECEMBER 2017

FINANCIAL REPORT AND AUDITED FINANCIAL STATEMENTS FOR THE YEAR ENDED 31 DECEMBER 2017
21
INTERNATIONAL MARITIME ORGANIZATION STATEMENT I
STATEMENT OF FINANCIAL POSITION as at 31 December 2017
(GBP)
IMO Consolidated Note 2017 2016 2017 2016
ASSETS
Current assets
Cash and cash equivalents 2.1 56,576,398 58,656,100 70,512,213 73,651,283
Contributions receivable 2.2 325,009 286,218 338,311 291,512
Inventories 2.3 1,118,521 830,705 1,146,482 862,339
Advances to sub-contractors 2.4 530,386 928,422 530,386 928,422
Other receivables – exchange transactions 2.5 3,190,309 2,413,844 3,860,739 3,398,968
Other receivables – non-exchange transactions 2.5 - - 16,564 58,927
Total current assets 61,740,623 63,115,289 76,404,695 79,191,451
Non-current assets
Investment in bonds 2.6 - - 886,500 -
Property, plant and equipment 2.7 2,120,191 2,007,253 2,424,342 2,344,864
Intangible assets 2.8 872,850 977,428 873,239 979,724
Total non-current assets 2,993,041 2,984,681 4,184,081 3,324,588
TOTAL ASSETS 64,733,664 66,099,970 80,588,776 82,516,039
LIABILITIES
Current liabilities
Payables and accruals – exchange transactions 2.9 (3,139,799) (3,721,015) (3,114,592) (3,903,287)
Payables and accruals – non-exchange transactions 2.9 (5,561,004) (5,080,457) (10,277,406) (10,757,268)
Provisions and warranties –exchange transactions 2.10 (66,981) (70,266) (66,981) (70,266)
Employee benefits 2.11 (63,076) (97,171) (119,737) (155,911)
Finance lease liabilities 2.12 (115,469) (17,952) (115,469) (17,952)
Total current liabilities (8,946,329) (8,986,861) (13,694,185) (14,904,684)
Non-current liabilities
Employee benefits 2.11 (45,998,294) (41,094,497) (46,924,324) (41,667,518)
Finance lease liabilities 2.12 (316,337) (80,356) (316,337) (80,356)
Total non-current liabilities (46,314,631) (41,174,853) (47,240,661) (41,747,874)
TOTAL LIABILITIES (55,260,960) (50,161,714) (60,934,846) (56,652,558)
NET ASSETS 9,472,704 15,938,256 19,653,930 25,863,481
Fund balances and reserves 2.13 12,739,463 15,201,669 23,284,861 22,823,860
Surplus/(Deficit) for the year (3,266,759) 736,587 (3,630,931) 3,039,621
TOTAL FUND BALANCES AND RESERVES 2.13 9,472,704 15,938,256 19,653,930 25,863,481
The accompanying notes form an integral part of these financial statement

FINANCIAL REPORT AND AUDITED FINANCIAL STATEMENTS FOR THE YEAR ENDED 31 DECEMBER 2017
22
INTERNATIONAL MARITIME ORGANIZATION STATEMENT II
STATEMENT OF FINANCIAL PERFORMANCE for the year ended 31 December 2017
(GBP)
IMO Consolidated
REVENUE Note 2017 2016 2017 2016
Assessed contributions 3.1 30,131,469 30,116,000 30,131,469 30,116,000
Donor voluntary contributions 3.2 5,561,729 4,127,997 10,604,548 8,181,417
Commercial activities 3.3 13,733,842 13,446,932 14,984,145 14,605,924
Fellowships 3.4 - - 5,409,289 4,639,082
Other revenue 3.5 236,517 285,788 508,378 696,750
TOTAL REVENUE 49,663,557 47,976,717 61,637,829 58,239,173
EXPENSES
Staff and other personnel costs 4.1 (33,929,387) (32,424,814) (40,834,056) (38,656,249)
Travel expenses 4.2 (2,061,830) (2,145,237) (2,609,118) (2,610,923)
Supplies, consumables and other running costs
4.3 (6,998,548) (5,814,251)
(8,030,260) (6,714,832)
Costs related to trading activities 4.4 (1,802,465) (1,908,221) (1,810,979) (1,914,964)
Outsourced services 4.5 (1,071,485) (1,050,879) (1,374,743) (1,343,800)
Training and development 4.6 (3,285,853) (4,278,376) (5,249,797) (4,928,219)
Depreciation, amortization and impairment 4.8 (941,218) (789,208) (1,123,914) (964,268)
Return of unspent funds 4.9 (317,872) (326,840) (317,872) (326,840)
Other expenses 4.10 (806,985) (1,606,010) (1,004,573) (1,645,111)
TOTAL EXPENSES (51,215,643) (50,343,836) (62,355,312) (59,105,206)
Currency exchange gains/(loss) 4.7 (1,714,673) 3,103,706 (2,913,448) 3,905,654
NET (DEFICIT)/SURPLUS FOR THE YEAR (3,266,759) 736,587 (3,630,931) 3,039,621
The accompanying notes form an integral part of these financial statements

FINANCIAL REPORT AND AUDITED FINANCIAL STATEMENTS FOR THE YEAR ENDED 31 DECEMBER 2017
23
INTERNATIONAL MARITIME ORGANIZATION STATEMENT III
STATEMENT OF CHANGES IN NET ASSETS for the year ended 31 December 2017
(GBP)
Note Accumulated Surpluses/ Fund
Balances Accumulated Surpluses/ Fund
Balances IMO Consolidated
2017 2016 2017 2016
Opening balance 1 January 15,938,256 20,206,174 25,863,481 26,971,524
Surplus/Deficit for the year 6.2 (3,266,759) 736,587 (3,630,931) 3,039,621
Other movements on reserves
Transfers - - 134,177 (320)
Actuarial loss for the year 2.11 (3,198,793) (5,004,505) (3,198,793) (5,004,505)
Exchange rate effect 10 - - 485,996 857,161
Total movement for the year (6,465,552) (4,267,918) (6,209,551) (1,108,043)
TOTAL NET ASSETS 9,472,704 15,938,256 19,653,930 25,863,481
The accompanying notes form an integral part of these financial statements.

FINANCIAL REPORT AND AUDITED FINANCIAL STATEMENTS FOR THE YEAR ENDED 31 DECEMBER 2017
24
INTERNATIONAL MARITIME ORGANIZATION STATEMENT IV
STATEMENT OF CASH FLOW for the year ended 31 December 2017
(GBP)
Note IMO Consolidated
2017 2016 2017 2016
Cash flow from operating activities:
Deficit for the period1 (2,757,069) (2,024,229)
(1,786,089) (405,738)
Interest earned 3.5 209,630 231,749
288,399 269,504
(Increase)/decrease in contributions receivable 2.2 (38,791) 2,553,712
(46,799) 2,551,781
(Increase)/decrease in inventories 2.3 (287,816) 2,988
(284,143) (258)
Decrease/(increase) in advances to sub-contractors 2.4 398,036 (137,455)
398,036 (137,455)
(Increase) in other receivables 2.5 (776,465) (461,936)
(419,408) (464,510)
Loss/(Gain) on disposal of investments - - 49 -
Depreciation of property, plant and equipment2 2.7 490,761 516,276
678,984 773,289
Loss on disposal of property, plant and equipment 2.7 927 38,576 927 39,640
Amortization of intangible assets2 2.8 404,283 213,008
406,190 227,912
(Decrease)/increase in payables and accruals 2.9 (100,669) 2,152,797
(1,268,557) 3,851,335
(Decrease)/increase in provisions and warranties 2.9 (3,285) 2,041
(3,285) 2,041
Increase in employee benefit liabilities 2.11 4,869,702 6,588,504
5,220,632 6,696,566
Net cash flows from operating activities 2,409,244 9,676,031 3,184,936 13,404,106
Cash flows from investing activities:
Investment in term deposit and bonds - - (886,500) -
Purchases of property, plant and equipment2 2.7 (604,626) (1,341,007) (760,258) (1,543,812)
Purchases of intangible assets2 2.8 (299,705) (681,144) (299,705) (688,179)
Proceeds from sale of property, plant and equipment 2.7 - 20,000 869 24,129
Disposal of investment - - (1,362) -
Proceeds from sale of investments - - 1,313 -
Net cash flows from investing activities (904,331) (2,002,151) (1,945,643) (2,207,862)
Cash flows from financing activities:
Increase in finance lease liabilities 2.12 333,498 64,206 333,498 64,206
Net cash flows from financing activities 333,498 64,206 333,498 64,206
Other movements in net assets 2.13 (3,198,793) (5,004,505)
(3,064,616) (5,004,825)
(Loss)/gain on exchange on consolidation - - 485,996 857,161
Effect of exchange rate changes on cash and cash equivalents 4.7 (719,320) 2,529,067 (2,133,241) 3,175,855
Net (decrease)/increase in cash and cash equivalents (2,079,702) 5,262,648 (3,139,070) 10,288,641
Cash and cash equivalents at beginning of the year 2.1 58,656,100 53,393,452 73,651,283 63,362,642
Cash and cash equivalents at end of the year 2.1 56,576,398 58,656,100 70,512,213 73,651,283
The accompanying notes form an integral part of these financial statements
1 IMO - deficit of £3,266,759 (2016: surplus of £736,587), excluding interest earned of £209,630 (2016: £231,749) and loss on exchange of cash and cash equivalents held of £719,320 (2016: gains of £2,529,067) and Consolidated Group – deficit of £3,630,931 (2016: surplus of £3,039,621), excluding interest earned of £288,399 (2016: £269,504) and loss on exchange of cash and cash equivalents held of £2,133,241 (2016: gain of £3,175,855). 2 Depreciation of property, plant and equipment, amortization of intangible assets, purchases of property, plant and equipment and purchases of intangible assets include the effect of the exchange rate adjustment for exchange rate movements in the year. Notes 2.7 and 2.8 show additions and foreign exchange adjustments separately rather than in aggregate.

FINANCIAL REPORT AND AUDITED FINANCIAL STATEMENTS FOR THE YEAR ENDED 31 DECEMBER 2017
25
INTERNATIONAL MARITIME ORGANIZATION
STATEMENT Va STATEMENT OF COMPARISON OF BUDGET AND ACTUAL AMOUNTS – IMO
for the year ended 31 December 2017 (GBP)
Budget Amounts² Actual Amounts on Comparable Basis²
Variances: Final Budget and
Actual Amounts
Original Original Final Final
2017 2016 2017 2016 2017 2016 2017 2016
Receipts1
Assessed contributions 30,116,000 30,116,000 30,116,000 30,116,000 30,450,082 29,914,107 334,082 (201,893)
Support costs income 1,448,000 1,438,000 1,448,000 1,438,000 1,395,948 1,410,096 (52,052) (27,904)
Trading income 12,020,000 12,625,000 12,020,000 12,625,000 12,860,596 12,968,932 840,596 343,932
Other income 150,000 150,000 150,000 150,000 125,699 175,584 (24,301) 25,584
Funds Transfer3 879,900 - 1,237,724 - 1,237,724 - - -
Total receipts 44,613,900 44,329,000 44,971,724 44,329,000 46,070,049 44,468,719 1,098,325 139,719
Payments 1
Regular budget strategic results 33,154,000 32,618,000 33,197,819 32,765,611 31,352,891 30,618,803 1,844,928 2,146,808
Trading 6,067,000 5,983,000 6,070,936 5,990,433 5,617,264 5,495,499 453,672 494,934
Headquarters capital 990,000 950,000 1,241,360 2,561,411 886,699 2,486,864 354,661 74,547
Termination/separation 1,103,000 1,019,000 1,541,000 1,019,000 1,540,941 1,015,235 59 3,765
Training and development 117,000 115,000 117,923 118,335 91,088 87,029 26,835 31,306
Technical cooperation (TC Fund)
4,850,000 5,150,000 5,096,786 5,874,734 4,582,571 5,542,589 514,215 332,145
Total payments 46,281,000 45,835,000 47,265,824 48,329,524 44,071,454 45,246,019 3,194,370 3,083,505
Net4 (1,667,100) (1,506,000) (2,294,100) (4,000,524) 1,998,595 (777,300) 4,292,695 3,223,224
1 Classification of receipts or payments follows the same basis as the approved budget and is different from the classification shown in Statement II which presents it by nature/function. 2 Budget amounts are the modified accrual basis (IMO and IMLI) and the accrual basis (IMLI) as approved by the respective governing bodies (IMO, WMU and IMLI) and the actual amounts are on the same basis as the budget amounts. 3 Funds Transfer in the Original Budget includes transfers of funds from the General Fund to the Headquarters Capital fund (£120,000) and Termination Benefits Fund (£759,900). The Final Budget for 2017 includes additional budget transfers for commitments made in prior years discharged in 2017 totalling £357,824 as detailed in Note 7.1. 4 The funding source of the Original Budget deficit of (£1,667,100) is as per A/29Res.1100, with £672,000 funded from the prior year’s Trading Fund Surplus distribution and £768,000 funded from the regular budget expenditure savings arising in 2014 and 2015. A further £227,100 is utilised from the reserves of
the Organization’s Funds.

FINANCIAL REPORT AND AUDITED FINANCIAL STATEMENTS FOR THE YEAR ENDED 31 DECEMBER 2017
26
INTERNATIONAL MARITIME ORGANIZATION STATEMENT Vb STATEMENT OF COMPARISON OF BUDGET AND ACTUAL AMOUNTS – Consolidated for the year ended 31 December 2017 (GBP) Budget Amounts² Actual Amounts on Variances: Final Budget
Comparable Basis² and Actual Amounts
Original Original Final Final
2017 2016 2017 2016 2017 2016 2017 2016
Receipts1
Assessed contributions 30,116,000 30,116,000 30,116,000 30,116,000 30,450,082 29,914,107 334,082 (201,893)
Support costs income 1,448,000 1,438,000 1,448,000 1,438,000 1,395,948 1,410,096 (52,052) (27,904)
Trading income 12,020,000 12,625,000 12,020,000 12,625,000 12,860,596 12,968,932 840,596 343,932
Other income 150,000 150,000 150,000 150,000 125,699 175,584 (24,301) 25,584
Funds Transfer3 879,900 0 1,237,724 0 1,237,724 0 0 0
Education and research 13,298,581 10,744,195 13,169,781 10,518,395 12,574,650 11,577,147 (595,131) 1,058,752
Total receipts 57,912,481 55,073,195 58,141,505 54,847,395 58,644,699 56,045,866 503,194 1,198,471
Payments 1
Regular budget strategic results 33,154,000 32,618,000 33,197,819 32,765,611 31,352,891 30,618,803 1,844,928 2,146,808
Trading 6,067,000 5,983,000 6,070,936 5,990,433 5,617,264 5,495,499 453,672 494,934
Headquarters capital 990,000 950,000 1,241,360 2,561,411 886,699 2,486,864 354,661 74,547
Termination/separation 1,103,000 1,019,000 1,541,000 1,019,000 1,540,941 1,015,235 59 3,765
Training and development 117,000 115,000 117,923 118,335 91,088 87,029 26,835 31,306
Technical cooperation (TC Fund) 4,850,000 5,150,000 5,096,786 5,874,734 4,582,571 5,542,589 514,215 332,145
Education and research 12,162,242 9,938,744 12,493,142 9,732,544 11,753,163 9,531,911 739,979 200,633
Total payments 58,443,242 55,773,744 59,758,966 58,062,068 55,824,617 54,777,930 3,934,349 3,284,138
Net (530,761) (700,549) (1,617,461) (3,214,673) 2,820,082 1,267,936 4,437,543 4,482,609
1 Classification of receipts or payments follows the same basis as the approved budget and is different from the classification shown in Statement II which presents it by nature/function. 2 Budget amounts are the modified accrual basis (IMO and IMLI) and the accrual basis (IMLI) as approved by the respective governing bodies (IMO, WMU and IMLI) and the actual amounts are on the same basis as the budget amounts. 3 Funds Transfer in the Original Budget includes transfers of funds from the General Fund to the Headquarters Capital fund (£120,000) and Termination Benefits Fund (£759,900). The Final Budget for 2017 includes additional budget transfers for commitments made in prior years discharged in 2017 totalling £357,824 as detailed in Note 7.1.

FINANCIAL REPORT AND AUDITED FINANCIAL STATEMENTS FOR THE YEAR ENDED 31 DECEMBER 2017
27
NOTES TO THE FINANCIAL STATEMENTS AS AT 31 DECEMBER 2017
NOTE 1: ACCOUNTING POLICIES
Basis of Preparation 1 The financial statements of the International Maritime Organization (IMO) have been prepared on the accrual basis of accounting in accordance with the International Public Sector Accounting Standards (IPSAS) using the historic cost convention. The appropriate International Financial Reporting Standard (IFRS) has been applied where an IPSAS does not address a particular issue. No Standards have been adopted prior to their required implementation date, and no transitional provisions are in operation. 2 The Cash Flow Statement is prepared using the indirect method. 3 Within the meaning of IPSAS 35 – "Consolidated Financial Statements" the Organization is a controlling entity with two controlled entities, the World Maritime University (WMU) and the IMO International Maritime Law Institute (IMLI) based in Sweden and Malta, respectively. Neither WMU nor IMLI has equity and the Organization's control is not by means of shareholding; however, their Charter and Statute, respectively, provide for the ’power’ and 'benefit' criteria necessary for establishing control under IPSAS 35, the key factors being:
the Secretary-General's ability to appoint key staff, both management and academic, and also to appoint the respective governing boards;
the alignment of the objectives of WMU and IMLI with the goals of IMO through the Charter and the Statute, respectively;
the requirement for changes to the Charter and Statute to be approved by IMO organs; and
In the event of dissolution of IMLI, the funds and assets remaining shall be used as directed by IMO Council.
4 Consolidated statements have therefore been prepared and are shown alongside those of IMO alone for ease of reference. 5 The functional and reporting currency of IMO is GBP. Transactions in currencies other than GBP are converted into GBP at the prevailing United Nations Operational Rates of Exchange (UNORE) at the time of transaction. Assets and liabilities held at the year-end in currencies other than GBP are converted into GBP at the prevailing UNORE year-end closing rate. Resulting gains or losses are accounted for in the Statement of Financial Performance.
Cash and Cash Equivalents
6 Cash and cash equivalents comprise cash on hand, cash at banks and investments held to maturity. Fixed-term deposits placed with counterparties are considered to be receivables within the meaning of IPSAS 29 – "Financial Instruments: Recognition and Measurement", and consequently are initially measured at their fair value, and subsequently at amortized cost using the effective interest method.
Contributions and Receivables
7 Assessed income on Member States is recognized as revenue when it falls due, normally on 1 January of the financial year for which the assessment is made. 8 Contributions are recognized as an asset when confirmed in writing by donors, with revenue normally being recognized at the same point. However, in some cases a donor agreement may contain sufficiently strict conditions over the application of funds to a specific activity that a liability is recognized along with the asset when

FINANCIAL REPORT AND AUDITED FINANCIAL STATEMENTS FOR THE YEAR ENDED 31 DECEMBER 2017
28
the agreement is confirmed in writing and revenue is only recognized as the activity is delivered. The accounting treatment of donor contributions is determined on a case-by-case basis following the provisions of IPSAS 23 – "Revenue from Non-Exchange Transactions". 9 Even in the absence of conditions as defined in IPSAS 23, contributions from donors are typically received with restrictions over their use and are not available for the Organization's use entirely at its own discretion. Balances of reserves by fund are disclosed in Note 2.12, with all balances held under Bilateral Operations and Multi-Donor Trust Funds (MDTF) being subject to restrictions imposed either through the terms of the bilateral agreement or the Terms of Reference of the MDTF, respectively, and such reserves may only be used in accordance with these restrictions. 10 Receivables are stated at nominal value less allowance for estimated irrecoverable amounts and discounted, where appropriate, if cash flows are not expected within 12 months of the reporting date. 11 In-kind contributions of goods are valued at fair market value and are recognized as revenue and as assets when received. In-kind contributions of services are not recognized in the financial statements.
Revenue
12 The Organization's commercial sales operations, conducted through the Trading Fund, and the fees charged to those submitting products and substances for technical assessment in order for the Organization to fully recover costs associated with conducting those assessments, are considered to be exchange transactions within the meaning of IPSAS 9 –"Revenue from Exchange Transactions". All other revenue is on a non-exchange basis and is accounted for in accordance with IPSAS 23. 13 Revenue from the sale of publications is recognized upon shipment to the customer, with the exception of consignment stock held on the Organization's behalf by distributors under agreements where the Organization retains the risks and rewards of ownership. Sales of such consignment stock are recognized as sales when made by the distributor to the end customer.
Inventories
14 Publications held for sale on hand at the end of the financial period are recorded as inventories and are valued at the lower of cost or net realizable value. 15 The cost of publications includes purchase cost, transportation and delivery costs, determined on a weighted average basis. Publications held by distributors under a consignment stock arrangement continue to be shown as the Organization's asset until their sale by the distributor. 16 Publications are shown as a cost of sales at the time at which the sale is recognized, and the inventory is reviewed at the end of each financial year for obsolescence. 17 Obsolete books are held at nil value until their disposal.
18 Slow-moving titles, with an excess of three years' stock on hand, are considered to be impaired, with a 50% reduction in value. 19 No publications are held solely for distribution on a free of charge basis. Such distributions typically represent less than 5% of all publications distributed. Consequently, no provision is made in this regard.

FINANCIAL REPORT AND AUDITED FINANCIAL STATEMENTS FOR THE YEAR ENDED 31 DECEMBER 2017
29
Property, Plant and Equipment
20 Property, Plant and Equipment (PP&E) are stated at historical cost less accumulated depreciation and any impairment losses. Depreciation is provided for PP&E over their estimated useful life using the straight line method. The estimated useful life for PP&E classes are as follows:
21 Leasehold improvements are recognized as assets and valued at cost, and depreciated over the lesser of the remaining useful life of the improvements or the lease term. 22 While the Organization uses an operational threshold for recognizing property, plant and equipment of £500, this threshold is not applied to library collections. Where a library collection is deemed to be in excess of 10% reference in nature, all purchases of reference material are capitalized and depreciated over three years on a straight line basis. Where a library collection holds less than 10% reference books, all items will be expensed as purchased. 23 Impairment reviews are undertaken for all assets at least annually.
Intangible Assets 24 Intangible assets are stated at historical cost less accumulated amortization and any impairment losses. 25 Publication titles are not considered to be intangible assets as they do not meet the provisions of IPSAS 31 - 'Intangible Assets'. Consequently, development costs for new titles are expensed as they are incurred. 26 Amortization is provided over the estimated useful life using the straight line method. The estimated useful life for intangible asset classes are as follows:
Class Estimated useful life (years)
Software acquired externally 3
Internally developed software 3 – 6
Leases Finance Leases 27 Leases under which substantially all of the risk and reward of ownership have been transferred to the Organization through the lease agreement are treated as finance leases. 28 Assets purchased under a finance lease are shown as assets at the lower of the fair value of the asset and the present value of the minimum lease payments. An associated lease obligation is recognized at the same value.
Class Estimated useful life (years)
Communication and IT equipment 3 – 5
Vehicles 4 – 7
Furniture & fixtures 5
Conference equipment 7
Miscellaneous 5

FINANCIAL REPORT AND AUDITED FINANCIAL STATEMENTS FOR THE YEAR ENDED 31 DECEMBER 2017
30
29 Lease payments made under a finance lease are apportioned between payment of finance charges and reduction of the balance of the liability. 30 Assets acquired through a finance lease are depreciated over the shorter of the lease term or the useful life of the asset, except where such assets become the property of the Organization on completion of the lease term. In such cases, the asset is depreciated over its useful life. The finance charge will be calculated so as to produce a constant periodic rate of interest on the remaining balance of the liability.
Operating Leases 31 Leases which are not categorized as finance leases, with a balance of risk and reward remaining with the lessor, are considered to be operating leases. 32 Expenditure incurred under an operating lease is charged on a straight-line basis over the life of the lease.
Employee Benefits Liabilities 33 IMO recognizes the following categories of employee benefits:
short-term employee benefits due to be settled within 12 months of the end of the accounting period in which employees render the related service;
post-employment benefits;
other long-term employee benefits; and
termination benefits. 34 IMO is a member organization participating in the United Nations Joint Staff Pension Fund (the UNJSPF or the Fund), which was established by the United Nations General Assembly to provide retirement, death, disability and related benefits to employees. The Fund is a funded, multi-employer defined benefit plan. As specified by Article 3(b) of the Regulations of the Fund, membership in the Fund shall be open to the specialized agencies and to any other international, intergovernmental organization which participates in the common system of salaries, allowances and other conditions of service of the United Nations and the specialized agencies. Certain categories of employees of IMO are members of the UNJSPF. 35 The Fund exposes participating organizations to actuarial risks associated with the current and former employees of other organizations participating in the Fund, with the result that there is no consistent and reliable basis for allocating the obligation, plan assets, and costs to individual organizations participating in the plan. IMO and the UNJSPF, in line with the other participating organizations in the Fund, are not in a position to identify IMO's proportionate share of the defined benefit obligation, the plan assets and the costs associated with the plan with sufficient reliability for accounting purposes. Hence, IMO has treated this plan as if it were a defined contribution plan in line with the requirements of IPSAS 25. IMO's contributions to the Fund during the financial period are recognized as expenses in the statement of financial performance. 36 Actuarial gains and losses which may arise from experience adjustments and changes in actuarial assumptions are recognized in the period in which they occur as a separate item directly in net assets/equity. Past service costs from amendments to the benefits provided by the plans are recognized in surplus or deficit over the average remaining service lives of the related employees if they are not vested, and immediately when they arise if the benefits are already vested. None of the benefits of the Organization's defined benefits plans have been amended during the reporting period. 37 Termination benefits include indemnities for dismissal before retirement or voluntary redundancy. Where, at the reporting date, there is a formal plan, without realistic possibility of withdrawal, to finish the
FINANCIAL REPORT AND AUDITED FINANCIAL STATEMENTS FOR THE YEAR ENDED 31 DECEMBER 2017
31
employment of a staff member and at that date the staff member has not yet separated from the Organization, an accrual is recognized in the financial statements.
Provisions and Contingent Liabilities 38 Provisions are made for future liabilities and charges where IMO has a present legal or constructive obligation as a result of past events and it is probable that IMO will be required to settle the obligation. 39 A high proportion of the Organization's sales of publications are made through distributors rather than directly to the end user. It is the Organization's established business practice to refund distributors for unsold copies held by them, which may become obsolete through the issuance of a new edition. A provision is established to reflect an approximation of the funds expected to be reimbursed to distributors for the copies sold to them during the financial year which may be returned during future financial years. This liability is estimated using a percentage of the previous financial year sales based on the historical levels of returns. 40 Other commitments, which do not meet the recognition criteria for liabilities, are disclosed in the notes to the financial statements as contingent liabilities when their existence will be confirmed only by the occurrence or non-occurrence of one or more uncertain future events which are not wholly within the control of IMO.
Fund Accounting and Segment Reporting 41 The financial statements are prepared on a fund accounting basis, showing, at the end of the period, the consolidated position of all IMO funds. A fund is a self-balancing accounting entity established to account for the transactions of a specified purpose or objective. Fund balances represent the accumulated residual of revenue and expenses. 42 IMO classifies all projects, operations and fund activities into four segments: i) Core Programme Management; ii) Technical Cooperation and Extra-budgetary Activities; iii) Trading and Business Activities; and iv) Education and Research. IMO reports on the transactions of each segment during the financial period, and the balances held at the end of the period.
43 Under Core Programme Management, the Organization provides services to support Member States' decision making, including the development of treaties, regulations and policies. These activities are funded by assessed contributions and transfers from surpluses from such contributions. The Organization's General Fund, Working Capital Fund, Headquarters Capital Fund, Training and Development Fund and Termination Benefit Fund are grouped under this segment. 44 Under Technical Cooperation and Extra-budgetary Activities, the Organization provides Member States with technical cooperation and extra-budgetary planning and implementation services. Such activities are primarily funded through the surplus of the Organization's commercial activities and through contributions from donors or through a cost recovery model such as the fees charged for assessments of products and substances. In this context, the Organization's Technical Cooperation Fund and all donor trust Funds are grouped under this segment. 45 Activities conducted by WMU and IMLI are categorized under the Education and Research segment. The funding is primarily derived from donations to and fees charged by WMU and IMLI, and partly through the surplus of the Organization's commercial activities. 46 As the Organization undertakes commercial business activities, in particular, of publishing and catering, through the Trading Fund, those activities are segmented under Trading and Business Activities. Funding comes from the sale of publications and catering.

FINANCIAL REPORT AND AUDITED FINANCIAL STATEMENTS FOR THE YEAR ENDED 31 DECEMBER 2017
32
Budget Comparison 47 The Assembly approves the biennial budgets of the Organization which include the regular budget and the budgets of the Trading Fund, the Headquarters Capital Fund, the Training and Development Fund, the Termination Benefit Fund and the Technical Cooperation Fund. These budgets may be subsequently amended by the Council or through the exercise of delegated authority. Statement V: Comparison of Budget and Actual Amounts compares the final budget to actual amounts calculated on the same basis as the corresponding budgetary amounts. As the bases used to prepare the budget and financial statements differ, Note 5 provides a reconciliation between the actual amounts presented in Statement V and the actual amounts presented in Statement IV: Cash Flow.
NOTE 2: ASSETS AND LIABILITIES
Note 2.1: Cash and Cash Equivalents
IMO Consolidated 2017 2016 2017 2016 GBP GBP
Cash and Cash Equivalents Bank and cash on hand 14,234,755 18,118,014 26,264,942 30,609,389 Short-term deposits 42,338,591 40,534,967 44,240,462 43,035,045 Other cash and cash equivalents 3,052 3,119 6,809 6,849
Total Cash and Cash Equivalents 56,576,398 58,656,100 70,512,213 73,651,283
48 Cash required for immediate disbursement is maintained in cash and bank accounts. Balances in the money market and deposit accounts are available at short notice. 49 The Organization does not place long-term investments in bonds or shares, nor does it make use of money market facilities such as hedging. Short-term deposits are investments held to maturity invested for a maximum of twelve months with an approved list of counterparties. Those deposits held at year end are measured at amortised cost that is discounted, using the effective interest method. The Organization's Investment Policy, established in accordance with Article IX of the Financial Regulations, focuses on capital retention rather than maximization of return on investment. 50 The Investment Policy establishes limits on the maximum amounts and time period for deposits with any counterparty, on the basis of a range of factors designed to assess their financial stability, in order to diversify and manage investment risk. 51 Effective implementation of the Investment Policy is the responsibility of the Treasury Committee, comprising senior administrative and financial staff, along with an external expert financial adviser. The Committee meets on a regular basis and considers an investment proposal, along with information on the current cash position, cash flow projections and surplus funds available to invest together with the proposed counterparties and their credit ratings. 52 The table below shows the value of IMO's short-term deposit placements at 31 December 2017 split by maturity date:

FINANCIAL REPORT AND AUDITED FINANCIAL STATEMENTS FOR THE YEAR ENDED 31 DECEMBER 2017
33
IMO GBP USD Total GBP
Maturity January 18,385,855 1,117,058 19,215,826 February 13,881,341 - 13,881,341 March 2,776,794 8,700,745 9,241,424
Total short term deposits 35,043,990 9,817,803 42,338,591
53 There was no impairment of short-term deposits as at 31 December 2017. 54 The consolidated figure for other cash and cash equivalents includes £37,071, which accounted for the amount of $50,000 invested with Nordea Bank by WMU in fixed term deposit for one year from 14 June 2017 to 15 June 2018 with a yield of 1.58%.
Note 2.2: Contributions Receivable
IMO Consolidated 2017 2016 2017 2016 GBP GBP
Composition: Member States assessments 90,551 158,621 90,551 158,621 Donor voluntary contributions 234,458 127,597 247,760 132,891
Total Contributions Receivable 325,009 286,218 338,311 291,512
55 Contributions receivable for Member States' assessments and donor voluntary contributions relate to non-exchange transactions.
IMO Consolidated 2017 2016 2017 2016 GBP GBP
Member States assessments due 1,075,918 1,411,040 1,075,918 1,411,040
Total Contributions Receivable before allowance
1,075,918 1,411,040 1,075,918 1,411,040
Fair value adjustments (630,303) (897,355) (630,303) (897,355)
Allowance for doubtful accounts (355,064) (355,064) (355,064) (355,064)
Net Contributions Receivable 90,551 158,621 90,551 158,621
56 The following table illustrates the composition of Member States' receivables. IMO Consolidated 2017 2016 2017 2016 GBP % GBP % GBP % GBP %
Year of assessment:
2017 149,080 14 - 149,080 14 -
2016 71,935 7 320,380 23 71,935 7 320,380 23
2015 67,971 6 180,637 13 67,971 6 180,637 13
2014 and earlier 786,932 73 910,023 64 786,932 73 910,023 64
Nominal value of assessments receivable
1,075,918 100 1,411,040 100 1,075,918 100 1,411,040 100

FINANCIAL REPORT AND AUDITED FINANCIAL STATEMENTS FOR THE YEAR ENDED 31 DECEMBER 2017
34
57 Historical experience has shown that assessments due from Member States are highly likely to be settled in full at some point in the future, with no write-offs having been authorised in this regard since the inception of the Organization. However, because there is significant uncertainty surrounding the timing of future cash flows from such receivables, an adjustment is required to show these amounts at fair value. 58 The movements of the allowance for fair value adjustment and doubtful accounts during 2017 are as follows:
Opening Balance 1.1.2017
Increase/ (Decrease)
GBP
Closing Balance
31.12.2017
Fair value adjustment for Member States' arrears - IMO 897,355 (267,052) 630,303
Fair value adjustment for Member States' arrears – Consolidated 897,355 (267,052) 630,303
Total allowance for doubtful accounts - IMO 355,064 - 355,064
Total allowance for doubtful accounts - Consolidated 355,064 - 355,064
59 As at 31 December 2017 there were a total of 35 Member States with outstanding balances. Of these, 25 had current year and prior year balances only. The remaining 10 had arrears prior to 2016. Two Member States had an agreed payment plan in place for outstanding arrears as at 31 December 2017. For the Member States in arrears and without such an agreement, an approximation is made based on historical experience – for those Member States which had arrears extending only to the current year and prior year, no fair value adjustment is made. For the remaining Member States with arrears for 2016 and earlier, it was assumed that the eventual cash flows will be sufficiently far in the future that the present value of those cash flows after discounting is approximately zero. 60 In addition to the balances due from those 35 Member States, the settlement of the former Socialist Federal Republic of Yugoslavia (SFRY) arrears of £355,064 continues to depend on the results of ongoing negotiations at the United Nations regarding succession issues. The Governments of the successor States of the former SFRY have requested the United Nations to write off all debts of the former SFRY relating to their contributions to the United Nations and its specialized agencies and programmes. The United Nations had taken the view that, in accordance with the general rules of international law regarding the succession of States in respect of State debts, the United Nations has the right to seek payment of all or part of the pre-dissolution arrears from the five successor States of the former Yugoslavia. Despite requests for the debt to be written off, the United Nations has refused to do so. The precise amount owing by each of SFRY's five successor States has not as yet been determined by the United Nations. Until this issue is settled by the United Nations, the Secretariat is not in a position to pursue the recovery of the outstanding amount, and the Secretariat's policy in this regard is consistent with prior years and the approach taken by the United Nations. 61 Contributions receivable from donors include: amounts due but not yet received under signed donor agreements, other than those amounts for future periods dependent on the successful completion of earlier phases of work. 62 Contributions receivable from donors are shown net of contributions adjustments related to allowance for doubtful accounts based on an individual review of each receivable. Amounts due beyond 2018 are discounted based on likely timings of such future cash flows. A review of amounts due as at 31 December 2017 indicated that no such adjustments were required on outstanding balances. 63 In the case of both Member State assessments and donor voluntary contributions due, adjustments are made to better reflect the fair value of the receivables in the financial statements but constitute neither a formal write-off of the receivable nor a releasing of the third party from their obligation.
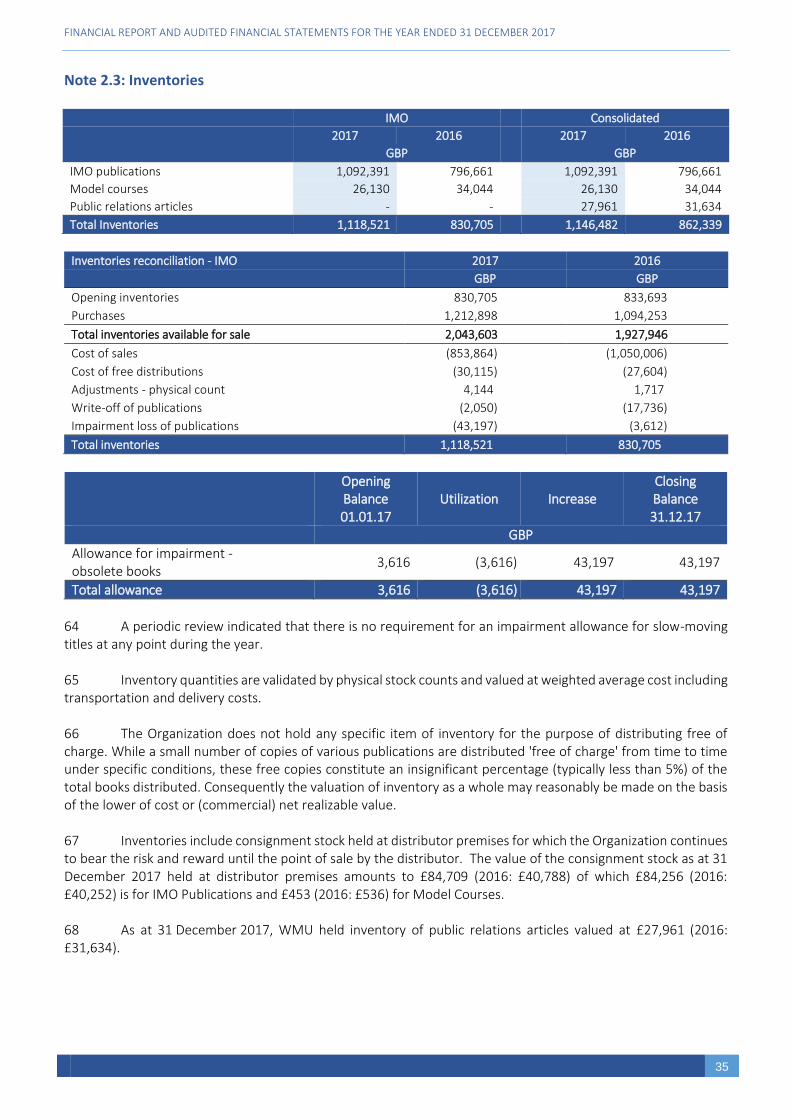
FINANCIAL REPORT AND AUDITED FINANCIAL STATEMENTS FOR THE YEAR ENDED 31 DECEMBER 2017
35
Note 2.3: Inventories IMO Consolidated
2017 2016 2017 2016
GBP GBP
IMO publications 1,092,391 796,661 1,092,391 796,661
Model courses 26,130 34,044 26,130 34,044
Public relations articles - - 27,961 31,634
Total Inventories 1,118,521 830,705 1,146,482 862,339
Inventories reconciliation - IMO 2017 2016
GBP GBP
Opening inventories 830,705 833,693
Purchases 1,212,898 1,094,253
Total inventories available for sale 2,043,603 1,927,946
Cost of sales (853,864) (1,050,006)
Cost of free distributions (30,115) (27,604)
Adjustments - physical count 4,144 1,717
Write-off of publications (2,050) (17,736)
Impairment loss of publications (43,197) (3,612)
Total inventories 1,118,521 830,705
Opening Balance 01.01.17
Utilization Increase Closing Balance 31.12.17
GBP
Allowance for impairment - obsolete books
3,616 (3,616) 43,197 43,197
Total allowance 3,616 (3,616) 43,197 43,197
64 A periodic review indicated that there is no requirement for an impairment allowance for slow-moving titles at any point during the year. 65 Inventory quantities are validated by physical stock counts and valued at weighted average cost including transportation and delivery costs. 66 The Organization does not hold any specific item of inventory for the purpose of distributing free of charge. While a small number of copies of various publications are distributed 'free of charge' from time to time under specific conditions, these free copies constitute an insignificant percentage (typically less than 5%) of the total books distributed. Consequently the valuation of inventory as a whole may reasonably be made on the basis of the lower of cost or (commercial) net realizable value. 67 Inventories include consignment stock held at distributor premises for which the Organization continues to bear the risk and reward until the point of sale by the distributor. The value of the consignment stock as at 31 December 2017 held at distributor premises amounts to £84,709 (2016: £40,788) of which £84,256 (2016: £40,252) is for IMO Publications and £453 (2016: £536) for Model Courses. 68 As at 31 December 2017, WMU held inventory of public relations articles valued at £27,961 (2016: £31,634).

FINANCIAL REPORT AND AUDITED FINANCIAL STATEMENTS FOR THE YEAR ENDED 31 DECEMBER 2017
36
Note 2.4: Advances to Sub-Contractors 69 Advances to sub-contractors are payments made under contract with regional bodies and similar organizations which, acting as implementing agents, deliver technical cooperation programmes on the Organization's behalf. These advances are then offset against approved expenditure reports as the contract is delivered. In addition, advances made to UNDP to deliver regional services on the Organization's behalf, through the Service Clearing Account arrangement, are also considered to be advances to sub-contractors. The outstanding advances at the end of the period were to: IMO 2017 2016 Sub-Contractors GBP
UNDP SCA 203,452 461,071 COCATRAM 113,166 84,087 REMPEITC-CARIB 79,742 44,285
DIRECTEMAR 58,504
- SPREP 30,586 46,502 SPC 20,509 134,119 Other 24,427 158,358
Total advances to sub-contractors 530,386 928,422
Note 2.5: Other Receivables
IMO Consolidated 2017 2016 2017 2016 GBP GBP
Relating to exchange transactions Advances to staff 974,672 1,103,618 1,009,010 1,143,023 Taxes recoverable 853,921 898,578 920,191 947,709 Advances to vendors 565,217 163,224 593,785 451,798 Fellowships - - 127,180 84,676 Miscellaneous 796,499 248,424 1,210,573 771,762
3,190,309 2,413,844 3,860,739 3,398,968 Relating to non-exchange transactions Fellowships - - - 38,112 Taxes recoverable - - 15,794 6,740 Other - - 770 14,075
- - 16,564 58,927
Total Other Receivables 3,190,309 2,413,844 3,877,303 3,457,895

FINANCIAL REPORT AND AUDITED FINANCIAL STATEMENTS FOR THE YEAR ENDED 31 DECEMBER 2017
37
70 Advances to staff are for Education Grants, travel and other staff entitlements made in accordance with the Staff Regulations and Staff Rules. The most significant are shown below: IMO Consolidated 2017 2016 2017 2016 GBP GBP
Advances to staff Education Grant advance 716,936 829,089 716,936 863,428 Home leave prepayment 99,734 70,423 99,734 74,308 Season ticket loan 45,500 47,113 45,500 47,113 Others 112,502 156,993 146,840 158,174
Total 974,672 1,103,618 1,009,010 1,143,023
71 Education Grant advances are paid annually to eligible staff and are amortized over the academic year for expenditure recognition purposes. 72 Eligible staff receive one home leave travel entitlement in a two year period, the costs of which are spread over that two year period, which may result in a prepayment where staff travel in the first year of their entitlement or an accrual where travel is primarily to be taken in the second year of entitlement. 73 Season ticket loans to staff are typically recovered through eleven equal deductions from the payroll. 74 Taxes recoverable are VAT, airport tax, insurance premium tax and environment tax, which are recoverable from the government of the host country under the terms of the relevant host country agreement.
75 Advances to vendors are for payments in advance of goods and service delivery. 76 Fellowships are due at the start of the school term upon arrival and confirmation of physical presence of the student. 77 The miscellaneous category includes, inter alia, amounts due under sub-letting agreements (where IMO manages the office space and recovers from third parties), cafeteria functions recoverable and travel recoverable from sponsors.
Note 2.6: Investment in Bonds
78 The consolidated figure for investment in bonds as at 31 December 2017 represents the €1,000,000 contributed to the Endowment Fund of the World Maritime Univerity, which was invested through Nordea Bank consistent with the long-term objective of growing capital base of the fund and with the article 13, paragraph 3 of the Interim Statute of the Endowment Fund. The total amount was placed in June 2017 by Nodea Bank in low risk assets, i.e. fixed income investment in a portfolio consisting of corporate and hybrid bonds with six counterparties (ratings - AAA, AA and BBB) for a total nominal value of €1,000,000 with four counterparties at €200,000 and two counterparties at €100,000. The investment in bonds are with maturity dates ranging from 2.24 years to 8.93 years (average of 6.3 years). The yields ranged from 0.40% to 3.31% per anum (average of 1.14%) with yearly interest payments from six counterparties on anniversary date until the date of maturity estimated for a total of €100,586 Based on the latest information available, the portfolio was estimated with an indicative market value of €1,003,821 and average market yield of 1.02% per annum. As at 31 December 2017, the €1,000,000 investment was translated and reported at SEK 9,850,000 based on the reporting UNORE at the end of the year.

FINANCIAL REPORT AND AUDITED FINANCIAL STATEMENTS FOR THE YEAR ENDED 31 DECEMBER 2017
38
Note 2.7: Property, Plant and Equipment
Asset category – IMO
Assets Under Construction
Communication & IT equipment
Conference equipment
Vehicles Furniture & fixtures
Leased equipment
Miscellaneous Total
Cost GBP
Opening Balance 01.01.2017
67,738 2,633,975 2,212,400 122,637 592,346 327,407 66,409 6,022,912
Adjustments -
Additions 67,564 23,735 30,722 - 15,159 461,768 5,678 604,626
Transfers -
Disposals - (187,558) (654,709) - - (93,462) - (935,729)
Impairment -
Closing Balance 31.12.2017 135,302 2,470,152 1,588,413 122,637 607,505 695,713 72,087 5,691,809
Accumulated Depreciation
Opening Balance 01.01.2017
- (2,275,308) (815,089) (85,938) (564,278) (229,824) (45,222) (4,015,659)
Adjustments -
Disposals - 186,631 654,709 - - 93,462 - 934,802
Depreciation charge for the year
- (205,657) (224,132) (14,323) (13,947) (24,503) (8,199) (490,761)
Closing Balance 31.12.2017 - (2,294,334) (384,512) (100,261) (578,225) (160,865) (53,421) (3,571,618)
Net Book Value
Opening Balance 01.01.2017
67,738 358,667 1,397,311 36,699 28,068 97,583 21,187 2,007,253
Closing Balance 31.12.2017 135,302 175,818 1,203,901 22,376 29,280 534,848 18,666 2,120,191
79 Property, plant and equipment are capitalized if their cost is greater than or equal to the threshold limit set at £500. The asset's value, less any estimated disposal price, is depreciated over the asset's estimated useful life using the straight line method. The threshold level is reviewed periodically. 80 Assets are reviewed annually to determine if there is any impairment in their value. During 2017, eighty three items of property, plant and equipment were disposed of as follows; fifty three were obsolete, and had no value to the Organization; twenty three were multi-functional canon copiers printers which had reached the end of their finance lease term; five were reported missing and presumed lost; and two were stolen laptops. The two stolen laptops had a net book value of £927. All other items were fully depreciated. 81 The IMO Headquarters building is not part of property, plant and equipment as the IMO is a tenant in the building under a lease which is deemed to be an operating lease under the provisions of IPSAS 13. Further disclosures on the treatment of this lease are provided in Note 2.12.2.
82 During 2017, the Organization replaced and refreshed its Local Area Network (LAN) and wireless network (WiFi) at its headquarters building at a cost of £461,768, which is funded through a finance lease and was accounted for in accordance with IPSAS 13, and the relevant disclosures are provided in Note 2.12.2. 83 The Assets Under Construction with a total value of £135,302 consist of assets in the field: Marine Simulator Training Room at the Djibouti Regional Training Centre of £112,549 (2017:£67,564 and 2016:£44,985) and Search and Rescue (SAR) equipment in the Republic of the Congo, which is developed as part of an ongoing programme to support the region of £22,753 (2016:£22,753. The SAR project is expected to be completed by the second quarter of 2018, after which the control is transferred to the relevant third party. Both assets still remain under the Organization's control as at the end of reporting year.
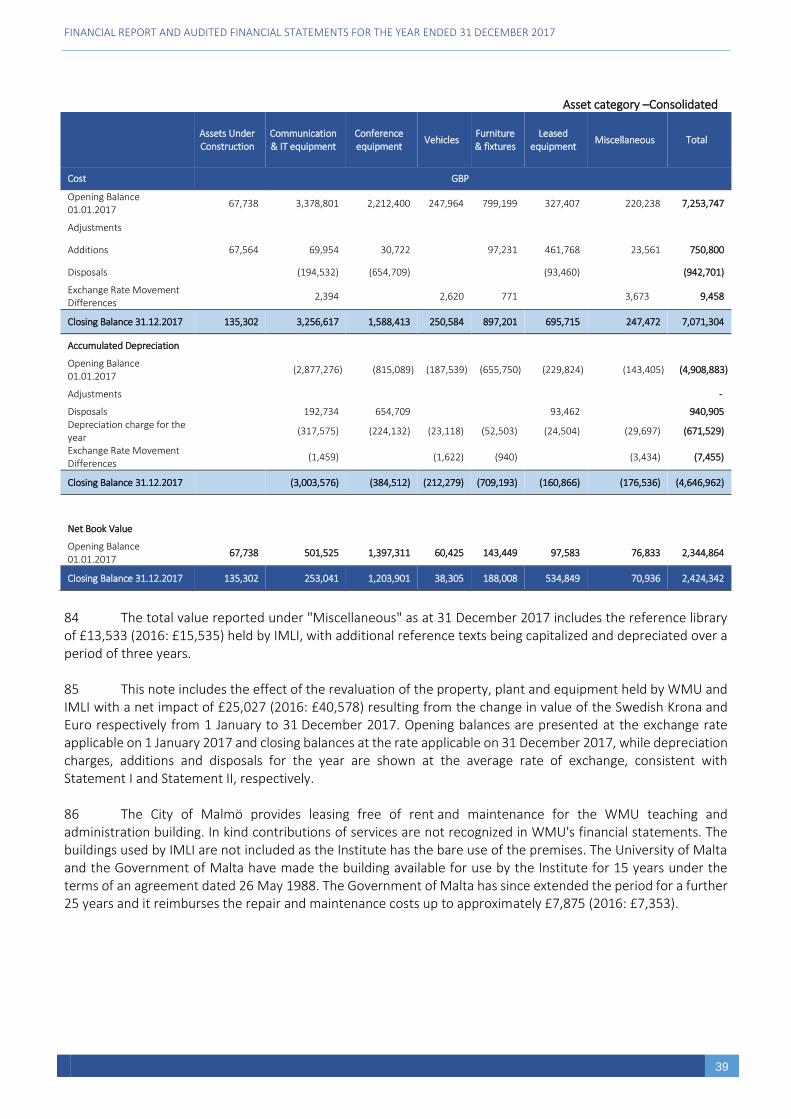
FINANCIAL REPORT AND AUDITED FINANCIAL STATEMENTS FOR THE YEAR ENDED 31 DECEMBER 2017
39
Asset category –Consolidated
Assets Under Construction
Communication & IT equipment
Conference equipment
Vehicles Furniture & fixtures
Leased equipment
Miscellaneous Total
Cost GBP
Opening Balance 01.01.2017
67,738 3,378,801 2,212,400 247,964 799,199 327,407 220,238 7,253,747
Adjustments
Additions 67,564 69,954 30,722 97,231 461,768 23,561 750,800
Disposals (194,532) (654,709) (93,460) (942,701)
Exchange Rate Movement Differences
2,394 2,620 771 3,673 9,458
Closing Balance 31.12.2017 135,302 3,256,617 1,588,413 250,584 897,201 695,715 247,472 7,071,304
Accumulated Depreciation
Opening Balance 01.01.2017
(2,877,276) (815,089) (187,539) (655,750) (229,824) (143,405) (4,908,883)
Adjustments -
Disposals 192,734 654,709 93,462 940,905 Depreciation charge for the year
(317,575) (224,132) (23,118) (52,503) (24,504) (29,697) (671,529)
Exchange Rate Movement Differences
(1,459) (1,622) (940) (3,434) (7,455)
Closing Balance 31.12.2017 (3,003,576) (384,512) (212,279) (709,193) (160,866) (176,536) (4,646,962)
Net Book Value
Opening Balance 01.01.2017
67,738 501,525 1,397,311 60,425 143,449 97,583 76,833 2,344,864
Closing Balance 31.12.2017 135,302 253,041 1,203,901 38,305 188,008 534,849 70,936 2,424,342
84 The total value reported under "Miscellaneous" as at 31 December 2017 includes the reference library of £13,533 (2016: £15,535) held by IMLI, with additional reference texts being capitalized and depreciated over a period of three years. 85 This note includes the effect of the revaluation of the property, plant and equipment held by WMU and IMLI with a net impact of £25,027 (2016: £40,578) resulting from the change in value of the Swedish Krona and Euro respectively from 1 January to 31 December 2017. Opening balances are presented at the exchange rate applicable on 1 January 2017 and closing balances at the rate applicable on 31 December 2017, while depreciation charges, additions and disposals for the year are shown at the average rate of exchange, consistent with Statement I and Statement II, respectively. 86 The City of Malmö provides leasing free of rent and maintenance for the WMU teaching and administration building. In kind contributions of services are not recognized in WMU's financial statements. The buildings used by IMLI are not included as the Institute has the bare use of the premises. The University of Malta and the Government of Malta have made the building available for use by the Institute for 15 years under the terms of an agreement dated 26 May 1988. The Government of Malta has since extended the period for a further 25 years and it reimburses the repair and maintenance costs up to approximately £7,875 (2016: £7,353).

FINANCIAL REPORT AND AUDITED FINANCIAL STATEMENTS FOR THE YEAR ENDED 31 DECEMBER 2017
40
Note 2.8: Intangible Assets
Asset category – IMO
Assets Under Construction
Externally purchased software
Total
Cost GBP
Opening Balance 01.01.2017 438,241 2,773,706 3,211,947 Additions 216,655 83,050 299,705 Transfers (640,655) 640,655 -
Closing Balance 31.12.2017 14,241 3,497,411 3,511,652
Accumulated Amortization Opening Balance 01.01.2017 - (2,234,519) (2,234,519) Amortization charge for the year - (404,283) (404,283)
Closing Balance 31.12.2017 - (2,638,802) (2,638,802)
Net Book Value Opening Balance 01.01.2017 438,241 539,187 977,428
Closing Balance 31.12.2017 14,241 858,609 872,850
87 Purchased intangible assets are capitalised if their cost is greater than or equal to the threshold of £500, with the exception of internally developed software where the threshold is £50,000 in view of the complexity in accurately assigning costs for development projects below this amount. The capitalized value of the internally developed software excludes those costs related to research and maintenance. 88 Transfers totalling £640,655 (2017:£216,655 and 2016:£424,000) were made from Asset Under Construction to Acquired Software during 2017. Of this total, £544,329 relates to completed SAP projects on the new compensation package, UNJSPF pension interface, and other system developments, and the remaining £96,326 relates to the completed Skype for Business system. 89 The Assets Under Construction at year end relates to £14,241 in respect of the Shire Maintenance Management software, purchased in 2016 to replace the old software, which is expected to be completed during the first quarter of 2018.
90 To the extent that the development work for these projects is undertaken by external resource, the identification and assignment of such costs can be readily identified from payment schedules and project milestones, with the completed Assets Under Construction being transferred to Externally Purchased Software at the point of go-live.

FINANCIAL REPORT AND AUDITED FINANCIAL STATEMENTS FOR THE YEAR ENDED 31 DECEMBER 2017
41
Asset category – Consolidated
Assets Under Construction
Externally purchased software
Total Group
Cost GBP
Opening Balance 01.01.2017 438,241 2,844,055 3,282,296 Additions 216,655 83,050 299,705 Transfers (640,655) 640,655 -
Closing Balance 31.12.2017 14,241 3,567,760 3,582,001
Accumulated Amortization Opening Balance 01.01.2017 - (2,302,572) (2,302,572) Amortization charge for the year (406,211) (406,211) Movements as a result of exchange rate difference 21 21
Closing Balance 31.12.2017 (2,708,762) (2,708,762)
Net Book Value Opening Balance 01.01.2017 438,241 541,483 979,724
Closing Balance 31.12.2017 14,241 858,998 873,239
91 This note includes the effect of the revaluation of the Intangible Assets held by WMU with a net impact of £21 (2016: £730) resulting from the change in value of the Swedish Krona from 1 January to 31 December 2017. Opening balances are presented at the exchange rate applicable on 1 January 2017 and closing balances at the rate applicable on 31 December 2017, while depreciation charges and additions for the year are shown at the average rate of exchange, consistent with Statement I and Statement II, respectively. 92 Neither IMO nor the consolidated group has made any disposals of externally purchased software during 2017.
Note 2.9: Payables and Accruals IMO Consolidated 2017 2016 2017 2016 GBP GBP
Relating to exchange transactions
Accruals 1,939,039 1,998,824 1,603,053 2,042,297
Payable to vendors 671,106 1,441,376 756,076 1,274,324
Advances from customers 456,241 181,036 456,211 181,036
Payable to staff 43,693 67,099 43,693 67,099
Fellowships - - 225,206 305,241
Deferred revenue 29,720 32,680 29,720 32,680
Other - - 633 610 3,139,799 3,721,015 3,114,592 3,903,287
Relating to non-exchange transactions
Fellowships - - 3,446,130 4,662,983
Condition on donor contributions 4,483,469 2,729,651 4,483,469 2,729,651
Advance contributions 202,930 1,816,206 1,174,255 2,109,429
Contributions Incentive Scheme 103,500 89,622 103,500 89,622
Deferred revenue 458,140 142,110 458,140 142,110
Funds held in trust 223,280 204,250 223,280 204,250
Payable to donors 89,685 98,618 321,381 615,652
Other - - 67,251 203,571 5,561,004 5,080,457 10,277,406 10,757,268
Total Payables and Accruals 8,700,803 8,801,472 13,391,998 14,660,555

FINANCIAL REPORT AND AUDITED FINANCIAL STATEMENTS FOR THE YEAR ENDED 31 DECEMBER 2017
42
93 Accruals represent estimates for the value of goods or services received, which have not yet been invoiced and for which the cost is not yet certain, most notably the provision of utilities and services delivered through the UNDP Service Clearing Account (SCA), and liabilities for goods and services received or provided to IMO during the period under agreed contracts but which have not yet been invoiced. 94 Payables to vendors relate to amounts due for goods and services for which invoices have been received. 95 Advances from customers reflect payments received prior to delivery of goods and services. 96 Fellowships and donations received and accrued for the academic year 2017/2018 relating to WMU and IMLI are apportioned over the period of the academic year. The amounts received or accrued in respect of that part of the academic year falling in 2018 are disclosed as advance receipts.
97 Deferred revenue relates to amounts received in the year for which the services have not been provided, as at the reporting date. 98 Funds held in trust are contributions made to third party organizations through IMO for administrative purposes only. The Organization has no control over the application of those funds. 99 The Organization recognizes as a liability conditions attached to certain voluntary contributions. Conditions may be imposed by donors on the use of contributions, and include both a performance obligation to use the donation in a specified manner, and an enforceable return obligation to return the donation, if it is not used in the specified manner. The amount recognized as a liability is the best estimate of the amount that would be required to settle the obligation at the reporting date. As IMO satisfies the conditions on voluntary contributions through performance in the specified manner, the carrying amount of the liability is reduced and an amount of revenue equal to that reduction is recognized. The breakdown of the total value of the condition on donor contributions, as at 31 December, 2017, is shown below.
IMO Consolidated 2017 2016 2017 2016 Condition on donor contributions GBP GBP
European Commission – Capacity Building for Climate Mitigation in the Maritime Shipping Industry
4,470,804 2,054,942
4,470,804 2,054,942
European Commission – Support FSI on PSC in Africa
- 627,958
- 627,958
European Commission – Preparedness for Oil-polluted Shoreline clean up and Oiled Wildlife interventions Project (POSOW II)
- 34,558
- 34,558
European Commission – Mediterranean Decision Support System for Marine Safety (MEDESS-4MS)
12,665 12,193
12,665 12,193
Total 4,483,469 2,729,651 4,483,469 2,729,651
100 Advance contributions reflect balances received from Member States during 2017 towards the 2018 assessed contributions. 101 Under the Contributions Incentive Scheme (CIS), a part of the interest earned on the General Fund is returned to Member States, the allocation being based on a points system reflecting the timing and amount of the receipt of their current year assessments. The accumulated CIS earnings up to 2017 totalled £103,500 of which

FINANCIAL REPORT AND AUDITED FINANCIAL STATEMENTS FOR THE YEAR ENDED 31 DECEMBER 2017
43
£53,072 relates to CIS earned during 2016-2017 biennium, to be distributed during 2018. A residual balance for prior years amounting to £50,428 remains awaiting instruction from one Member State. 102 Payables to donors represent the balance of unspent contributions for projects pending refund.
Note 2.10: Provisions and Warranties
IMO Consolidated
2017 2016 2017 2016
GBP GBP
Publication sales warranties 66,981 70,266 66,981 70,266
Total provisions and warranties 66,981 70,266 66,981 70,266
Opening Balance 01.01.17
Utilization Increase Closing Balance 31.12.17
GBP
IMO Publications 68,580 (76,159) 72,476 64,897
Model Courses 1,686 (2,215) 2,613 2,084
Total allowance 70,266 (78,374) 75,089 66,981
103 The Organization's sales of publications are primarily made through a network of distributors rather than directly to end users. The Organization has an established practice that, on publication of a new version of any title, distributors may return unsold copies of the previous version with the credit being set against purchases of the new title. A warranty provision has been established to reflect possible future returns of sales made during the year, the level of provision being based on the level of sales in the year and past experience of return levels.
Note 2.11: Employee Benefits IMO 2017 2016
Actuarial Valuation
IMO Estimates
Total Total
GBP GBP
Short-term employee benefits 63,076 63,076 97,171 Post-employment benefits 43,708,831 43,708,831 38,881,697 Other long-term employee benefits 2,289,463 2,289,463 2,212,800 Termination benefits -
Total Employee Benefits Liabilities 45,998,294 63,076 46,061,370 41,191,668
Short Term Employee Benefits
Post-Employment Benefits
Other Long-Term Employee
Benefits
Termination Benefits
Total Total
GBP GBP
Composition: Current 63,076 - 63,076 97,171 Non-current 43,708,831 2,289,463 45,998,294 41,094,497
Total Employee Benefits Liabilities 63,076 43,708,831 2,289,463 - 46,061,370
41,191,668

FINANCIAL REPORT AND AUDITED FINANCIAL STATEMENTS FOR THE YEAR ENDED 31 DECEMBER 2017
44
Consolidated 2017 2016
Actuarial Valuation
Group Estimates Total Total
GBP GBP
Short-term employee benefits 119,737 119,737 155,911 Post-employment benefits 44,634,861 44,634,861 39,180,234 Other long-term employee benefits 2,289,463 2,289,463 2,487,284 Termination benefits -
Total Employee Benefits Liabilities 46,924,324 119,737 47,044,061 41,823,429
104 In determining its post-employment liabilities, WMU used an estimate of the travel and shipment costs based on the prevailing market prices from the duty station to the home country to which the staff member and eligible dependants, if any, are entitled to return. The amount of the liability for the unused annual leave as at the reporting date was calculated based on the balance of unused annual leave days (up to a maximum of 60 days) and the current salary rate of the staff member. The employee benefits for home leave represents the amounts accrued for the year with the cost spread over two years. 2.11.1: Valuation of Employee Benefits Liabilities 105 Employee benefits liabilities are determined by professional actuaries or calculated by IMO based on personnel data and past payment experience. At 31 December 2017, total employee benefits liabilities amounted to £46,061,370 (2016: £41,191,668), of which £45,998,294 (2016: £41,094,497) was calculated by the actuaries and £63,076 (2016: £97,171) was calculated by IMO. Actuarial valuations are typically undertaken every two years. 2.11.2: Short-Term Employee Benefits 106 Short-term employee benefits comprise mainly wages and payroll related allowances, first time employee benefits, education grant related benefits and other benefits such as paid annual leave and sick leave. 107 Short-term employee benefits are expected to be settled within 12 months after the end of the period in which the employees render the related service and are measured at their nominal values based on past payment experience. 2.11.3: Post-Employment Benefits 108 Post-employment benefits are defined benefit plans consisting of United Nations Joint Staff Pension Fund (UNJSPF), After-Service Health Insurance Plan (ASHI) and repatriation grant and related benefits. 109 Arrangements relating to the UNJSPF are set out in Note 2.11.7.
2017 Consolidated 2016
Short Term Employee Benefits
Post-Employment
Benefits
Other Long-Term
Employee Benefits
Termination Benefits
Total Total
GBP GBP
Current 119,737 119,737 155,911
Non-current 44,344,786 2,579,538 46,924,324 41,667,518
Total Employee Benefits Liabilities
119,737 44,344,786 2,579,538 47,044,061
41,823,429

FINANCIAL REPORT AND AUDITED FINANCIAL STATEMENTS FOR THE YEAR ENDED 31 DECEMBER 2017
45
110 ASHI is a plan that allows eligible retirees and their eligible family members to participate in the Cigna Medical Scheme (formerly Van Breda) for 50% of the cost of the contribution of active staff members for the defined type of coverage. The Organization subsidizes the remaining amount of the premium to be paid to the third party insurer. Membership of Cigna is compulsory for all new employees, although participation in the ASHI scheme after retirement is voluntary. Cigna is the main third party insurance provider for ASHI benefits; however, there are still a small number of retirees covered by the former insurer, BUPA. 111 Repatriation benefits consist of a repatriation grant lump sum, travel of the staff member and eligible dependants and shipment of their personal effects. As of 1 July 2016, the repatriation benefit relating to shipment of personal effects may be taken as a lump sum payment. The Organization pays the amounts due for repatriation grant, travel and relocation expenses for the entitled staff members. 112 The liabilities include the current service costs and the interest costs for 2017, less benefit payments made and, where applicable, plan participants' contributions. 2.11.4: Other Long-Term Employee Benefits 113 Other long-term employee benefits include accrued unused annual leave and, where applicable, compensation payments in the case of death, injury or illness attributable to performance of duties. 114 Although annual leave is a short-term employee benefit, the right to receive payment for unused annual leave and, consequently, the Organization's liability for this balance, is shown as a long-term employee benefit as that right only crystallizes on separation, typically more than twelve months from the reporting date. 2.11.5: Termination Employee Benefits 115 Termination benefits include the expected costs the Organization will bear for the termination of the contract of an employee, as per the detailed formal plan in place at the reporting date. 116 As at 31 December 2017, there are no formal plans, without reasonable possibility of withdrawal, to finish the employment of staff members who have not yet separated from the Organization. 2.11.6: Actuarial Valuations of Post-Employment and Other Separation Related Benefits 117 Liabilities arising from post-employment benefits and other long-term employee benefits (i.e. accrued unused annual leave) are determined by consulting actuaries using the Projected Unit Credit Method. These employee benefits are established for those staff members who are entitled to such benefits under the IMO Staff Regulations and Staff Rules. Actuarial valuations are typically undertaken every two years. 2.11.6.1: Actuarial Assumptions and Methods 118 During each actuarial study, IMO, in conjunction with the actuary, reviews and selects assumptions that will be used by the actuaries in the year-end valuation to determine the expense and contribution requirements for IMO's after-service benefit plans (post-employment benefits and unused accrued annual leave). For the 2017 valuation, the assumptions used are as described in the table below. 119 Actuarial assumptions are required to be disclosed in the financial statements in accordance with IPSAS 25. In addition, each actuarial assumption is required to be disclosed in absolute terms. 120 The following assumptions have been used to estimate the value of the post-employment and accrued unused annual leave employee liabilities for IMO, as at 31 December 2017, based on the expenditure projections for the reporting period.

FINANCIAL REPORT AND AUDITED FINANCIAL STATEMENTS FOR THE YEAR ENDED 31 DECEMBER 2017
46
General
Discount rate 2.8% pa as of 31 December 2017 3.6% pa as of 31 December 2016
General inflation 2.0% pa as of 31 December 2017 3.4% pa as of 31 December 2016
Mortality 31 December 2017 90% of Continuous Mortality Investigation (CMI) future mortality improvement
31 December 2016 Mortality rates adopted for the UNJSPF valuation as at 31 December 2013 were used.
Mortality improvements
CMI_2016 projections with a long term improvement rate of 1.25%.
Withdrawal rates 3.25% pa fixed for all ages.
Vary according to age, gender and length of service, with different rates applying to professional and general service staff, in line with the assumptions used for the valuation of the UN Joint Staff Pension Fund as at 31 December 2013.
Retirement All members retire at their Normal Retirement Age.
Vary according to age, gender and length of service, with different rates applying to professional and general service staff and staff joining before 1 January 1990, between 1 January 1990 and 1 January 2014 and after 1 January 2014, in line with the assumptions used for the valuation of the UN Joint Staff Pension Fund as at 31 December 2013.
Assumptions used to value ASHI benefits
Participation after retirement 95% of eligible members are assumed to continue coverage after retirement. It is assumed that coverage will not be dropped once elected.
Spouses For current employees it is assumed that 60% will elect for coverage for their spouse at retirement. Males are assumed to be three years older than their spouse.
Healthcare trend increases 4% pa fixed as of 31 December 2017 5% pa fixed as of 31 December 2016
Ageing increases 3.5% pa for those under 65, 2.5% pa for those between 65 and 70 reducing in five-year age bands to nil for those over age 90.
Assumptions used to value repatriation benefits
Participation All eligible employees will receive the benefit on separation from service subject to completing five years’ service.
Age-related salary scale
31 December 2017 General inflation plus an age related scale of 6.1% pa at age 20 reducing on a straight line basis to 1.0% pa at age 60 for professional staff, and from 3.9% pa at 20 to 1.0% pa at age 65 for general staff.
31 December 2016 General inflation plus 0.5% pa to allow for productivity growth, plus an age related scale of 6.1% pa at age 20 reducing on a straight line basis to 1.0% pa at age 60 for professional staff, and from 3.9% pa at 20 to 1.0% pa at age 65 for general staff.
Repatriation travel costs Assumed to be £7,000 and to increase in line with general inflation.
Assumed to be £6,000 and to increase at a rate of 2.5% pa.
Assumptions used to value annual leave plan
Participation All eligible employees will receive the benefit on separation from service.
Age-related salary scale As for repatriation benefit.
Increases in annual leave balance
31 December 2017 Based on completed service – 10.9% pa in years 1 to 3, 1.0% pa for years 4 to 8 of service and 0.5% pa thereafter.
31 December 2016 Based on completed service – 15% pa in year 1, 6.5% pa for years 2 to 6 and 0.1% pa thereafter.

FINANCIAL REPORT AND AUDITED FINANCIAL STATEMENTS FOR THE YEAR ENDED 31 DECEMBER 2017
47
121 The following tables provide additional information and analysis on employee benefits liabilities calculated by actuaries. 2.11.6.2: Reconciliation of Defined Benefit Obligation
IMO After-Service
Health Insurance Plan
Repatriation Benefit Plan
Accrued Annual Leave Plan
Total
GBP
Defined Benefit Obligation as at 01.01.2017
35,507,753 3,373,944 2,212,800 41,094,497
Service cost for 2017 1,289,630 193,760 34,948 1,518,338 Interest cost for 2017 1,264,555 117,382 74,608 1,456,545 Actuarial loss/(gain) 3,003,938 (52,987) 247,842 3,198,793 Actual gross benefit payments for 2017 (762,459) (226,685) (280,735) (1,269,879)
Defined Benefit Obligation as at 31/12/2017
40,303,417 3,405,414 2,289,463 45,998,294
2.11.6.3: Annual Expense and Changes in Net Assets for Calendar Year 2017
IMO After-Service
Health Insurance Plan
Repatriation Benefit Plan
Accrued Annual Leave Plan
Total
GBP
Service cost 1,289,630 193,760 34,948 1,518,338 Interest cost 1,264,555 117,382 74,608 1,456,545 Actuarial loss/(gain) 3,003,938 (52,987) 247,842 3,198,793
Total Expense recognized in 2017 5,558,123 258,155 357,398 6,173,676
122 Actuarial gains and losses are recognised through the statement on Changes in Net Assets while service costs and interest costs are included as part of “Staff and Other Personnel Costs” in the Statement of Financial Performance. 123 None of the employee benefits liabilities associated with WMU and IMLI have been subject to actuarial estimate, and consequently the table above reflects both the IMO and consolidated positions. 2.11.6.4: Summary of Prior Year Amounts 124 The cumulative amount presented in the statement of changes in net assets/equity is that generated as a result of the actuarial valuation carried out in 2017.
IMO After-Service
Health Insurance Plan
Repatriation Benefit Plan
Accrued Annual Leave Plan Total
GBP
Actuarial Losses/(Gains) as at 01.01.2017 8,598,377 (77,260) 1,335,448 9,856,565 Actuarial Losses in 2017 3,003,938 (52,987) 247,842 3,198,793
Actuarial Losses/(Gains) as at 31.12.2017 11,602,315 (130,247) 1,583,290 13,055,358

FINANCIAL REPORT AND AUDITED FINANCIAL STATEMENTS FOR THE YEAR ENDED 31 DECEMBER 2017
48
125 Actuarial gains and losses comprise experience adjustments for the difference between the previous actuarial assumptions and what actually happened; and the effects of changes in actuarial assumptions. 126 The net actuarial loss for 2017 of £3,198,793 (2016: actuarial loss of £5,004,505) was the result of the changes in assumptions applied in the actuarial valuation of the liability due to the following main contributory factors: decrease in the discount rate from 3.6% in 2016 to 2.8% in 2017; decrease in inflation rate from 3.4% in 2016 to 2.0% in 2017; and adoption of the appropriate demographic assumptions affecting mortality and withdrawal and retirement decrements.
IMO
31.12.2017 31.12.2016 31.12.2015 31.12.2014 31.12.2013
ASHI GBP
Present Value of Defined Benefit Obligation
40,303,417 35,507,753 29,302,323 30,633,564 28,868,716
Experience loss / (gains) on Scheme Liabilities
1,701,085 - (5,217,624) - (1,079,154)
Loss on changes in assumptions used to value Scheme liabilities
1,302,853 4,575,862 2,088,192 - 2,805,279
IMO 31.12.2017 31.12.2016 31.12.2015 31.12.2014 31.12.2013
Repatriation GBP
Present Value of Defined Benefit Obligation
3,405,414 3,373,944 3,033,973 2,615,211 2,829,918
Experience loss on Scheme Liabilities
139,894 - 425,585 - 18,337
(Gain)/loss on changes in assumptions used to value Scheme liabilities
(192,881) 243,836 (27,974) - (20,929)
IMO 31.12.2017 31.12.2016 31.12.2015 31.12.2014 31.12.2013
Annual Leave GBP
Present Value of Defined Benefit Obligation
2,289,463 2,212,800 2,153,069 1,364,362 1,394,030
Experience loss on Scheme Liabilities
436,460 - 991,945 - 134,775
(Gain)/loss on changes in assumptions used to value Scheme liabilities
(188,618) 184,807 1,322 - (4,807)
IMO 31.12.2017 31.12.2016 31.12.2015 31.12.2014 31.12.2013
Total GBP
Present Value of Defined Benefit Obligation 45,998,295 41,094,497 34,489,366 34,613,137 33,092,757 Experience loss/(gains) on Scheme Liabilities
2,277,439 - (3,800,094)
- (926,042)
Loss on changes in assumptions used to value Scheme liabilities
921,354 5,004,505 2,061,540 - 2,779,543

FINANCIAL REPORT AND AUDITED FINANCIAL STATEMENTS FOR THE YEAR ENDED 31 DECEMBER 2017
49
2.11.6.5: Sensitivity Analysis 127 Two of the principal assumptions in the valuation of the long-term employee benefit plans are: i) the discount rate used to determine the present value of benefits that will be paid from the plan in the future; and ii) for the ASHI plan, the rate at which medical costs are expected to increase in the future. 128 The obligations were valued based on a discount rate of 2.8% pa, as of 31 December 2017. The table below shows the effect of a one per cent change in the discount rate, as of 31 December 2017.
After Service Health Insurance
Plan
Repatriation Benefit Plan
Accrued Annual Leave Plan
%
%+1 (9,300,000) (300,000) (200,000)
%-1 13,300,000 300,000 200,000
129 Similarly, a sensitive analysis was undertaken to determine the impact of changes in assumptions on future healthcare cost. The change in the ASHI obligation due to a one per cent change in the medical cost inflation is presented below. 1% increase 1% decrease 2017 2017
Effect on the aggregate of the service cost and interest cost 1,020,000 (720,000) Effect on defined benefit obligation 12,400,000 (9,000,000) 2.11.6.6: Expected Costs during 2018 130 The expected contribution of IMO in 2018 to the defined benefits plans is £1,280,028 (2017 estimate: £1,047,427). This has been derived from the 2017 paid figures with the ASHI payments unchanged for 2017 and the repatriation and annual leave payments increasing in line with general inflation. 2.11.7: United Nations Joint Staff Pension Fund 131 The Pension Fund’s Regulations state that the Pension Board shall have an actuarial valuation made of the Fund at least once every three years by the Consulting Actuary. The practice of the Pension Board has been to carry out an actuarial valuation every two years using the Open Group Aggregate Method. The primary purpose of the actuarial valuation is to determine whether the current and estimated future assets of the Pension Fund will be sufficient to meet its liabilities. 132 IMO's financial obligation to the UNJSPF consists of its mandated contribution, at the rate established by the United Nations General Assembly (currently at 7.9% for participants and 15.8% for member organizations) together with any share of any actuarial deficiency payments under Article 26 of the Regulations of the Fund. Such deficiency payments are only payable if and when the United Nations General Assembly has invoked the provision of Article 26, following determination that there is a requirement for deficiency payments based on an assessment of the actuarial sufficiency of the Fund as of the valuation date. Each member organization shall contribute to this deficiency an amount proportionate to the total contributions which each paid during the three years preceding the valuation date. 133 During 2017, the Fund identified that there were anomalies in the census data utilized in the actuarial valuation performed as of 31 December 2015. As such, as an exception to the normal biannual cycle, a roll forward of the participation data as of 31 December 2013 to 31 December 2016 was used by the Fund for their 2016 financial statements. An actuarial valuation as of 31 December 2017 is currently being performed

FINANCIAL REPORT AND AUDITED FINANCIAL STATEMENTS FOR THE YEAR ENDED 31 DECEMBER 2017
50
134 The roll forward of the participation data as of 31 December 2013 to 31 December 2016 resulted in a funded ratio of actuarial assets to actuarial liabilities, assuming no future pension adjustments, of 150.1% (127.5% in the 2013 valuation). The funded ratio was 101.4% (91.2% in the 2013 valuation) when the current system of pension adjustments was taken into account.
135 After assessing the actuarial sufficiency of the Fund, the Consulting Actuary concluded that there was no requirement, as of 31 December 2016, for deficiency payments under Article 26 of the Regulations of the Fund as the actuarial value of assets exceeded the actuarial value of all accrued liabilities under the Fund. In addition, the market value of assets also exceeded the actuarial value of all accrued liabilities as of the valuation date. At the time of this report, the General Assembly has not invoked the provision of Article 26. 136 During 2017, IMO’s contributions paid to UNJSPF amounted to £5,896,903 (2016: £5,654,995). Expected contributions due in 2018 are £5,736,457.80. 137 The United Nations Board of Auditors carries out an annual audit of the UNJSPF and reports to the UNJSPF Pension Board on the audit every year. The UNJSPF publishes quarterly reports on its investments and these can be viewed by visiting the UNJSPF at www.unjspf.org.
Note 2.12: Leases 2.12.1: Finance Leases 138 The Organization has finance leases in place for provision of general office, high-volume photocopiers and Wi-Fi network equipment for its Headquarters building. The present values of future payments due under this lease agreement are shown below.
IMO Consolidated
2017 2016 2017 2016
GBP GBP
Current 115,469 17,952 115,469 17,952
Non-current 316,337 80,356 316,337 80,356
Total Finance Lease Liabilities 431,806 98,308 431,806 98,308
139 The difference between the minimum lease payments due and the present value of such payments is analysed in the following table:
IMO Consolidated
Minimum payments
due
Finance charges
Present value of
minimum payments
Minimum payments
due
Finance charges
Present value of
minimum payments
GBP GBP
Less than one year 129,738 14,269 115,469 129,738 14,269 115,469 One to four years 332,700 16,363 316,337 332,700 16,363 316,337
Total Finance Lease liabilities
462,438 30,632 431,806 462,438 30,632 431,806
There are no sublease payments to be received on these leased assets. Ownership does not transfer to the Organization on conclusion of the lease, nor are there any options in place to purchase the equipment at that time. The lease agreement does not impose any restrictive covenants on the Organization. Neither WMU nor IMLI holds assets under finance leases.

FINANCIAL REPORT AND AUDITED FINANCIAL STATEMENTS FOR THE YEAR ENDED 31 DECEMBER 2017
51
2.12.2: Operating Leases 140 The Organization has a single operating lease with the United Kingdom government for the use of its Headquarters building. The minimum lease payments under this lease are set out in the table below:
IMO Consolidated 2017 2016 2017 2016 GBP GBP
Future minimum lease payments due under operating leases:
Not later than one year 1,195,751 1,195,751 1,195,751 1,195,751 Later than one year and not later than five years
5,978,755 5,978,757
5,978,755 5,978,757
Later than five years 10,761,759 11,957,515 10,761,759 11,957,515
Total future minimum lease payments - operating leases
17,936,265 19,132,023
17,936,265 19,132,023
141 The lease costs will be spread over the term of the lease on a straight-line basis, an amount of £1,195,751 having been recognized as annual expenditure in the period. 142 There are no non-cancellable sublease payments to be received on the Headquarters building. 143 The lease expires on 28 October 2032 and does not contain a break clause, nor does it contain renewal or purchase options. 144 The significant lease arrangements are highlighted below:
Alterations: The Organization is not entitled to make alterations or additions affecting the structure or the main services of the premises without written approval of the Landlord, the United Kingdom (UK) government;
Under-letting: When under-letting the building, the Organization must first offer to underlet to the landlord;
Letting out of conference facilities: When letting out conference facilities for commercial purposes, the Organization is required to "consider as a priority any request given with adequate prior notice by the Landlord"; and
Sharing of income and expenses: The lease agreement requires the sharing of all income from 'Net Rental' and all costs of "Major Repairs" on an 80:20 basis between the Government of the United Kingdom and the Organization.

FINANCIAL REPORT AND AUDITED FINANCIAL STATEMENTS FOR THE YEAR ENDED 31 DECEMBER 2017
52
Note 2.13: Fund Balances and Reserves
Organization Only Opening Balance
Operating Surplus (Deficit) for the Period
Other Movements in Reserves
Closing Balance
01.01.2017 31.12.2017 GBP
General Fund 10,638,739 (51,433) - 10,587,306 Working Capital Fund 1,238,331 (32,934) - 1,205,397 Trading Fund 9,417,494 (132,204) - 9,285,290 Termination Benefit Fund (29,920,650) (1,479,164) (3,198,793) (34,598,607) HQ Capital Fund 3,167,148 (151,825) - 3,015,323 Training and Development Fund 222,407 27,706 - 250,113 Technical Cooperation Fund 7,934,587 874,569 - 8,809,156 Bilateral Operations and Multi-Donor Trust Funds3:
Voyage Together Trust Fund 1,559,973 1,060,051 - 2,620,024 Model Courses Development Trust Fund 1,377,436 3,327 - 1,380,763 International Maritime Security Trust (IMST) Fund
1,480,026 (122,175) - 1,357,851
Djibouti Code of Conduct Trust Fund 1,707,034 (963,211) - 743,823 GESAMP Trust Fund 977,127 (256,195) - 720,932 Government of United Kingdom 685,138 (59,014) - 626,124 Government of Norway 183,143 345,317 - 528,460 Other Bilateral Operations and Multi-Donor Trust Funds4
5,270,323 (2,329,574) - 2,940,749
Total 15,938,256 (3,266,759) (3,198,793) 9,472,704
Consolidated Opening Balance
Operating Surplus (Deficit) for the Period
Other Movements in
Reserves
Closing Balance
01.01.2017 31.12.2017 GBP
Total 25,863,481 (3,630,931) (2,578,620) 19,653,930
145 The Organization maintains separate accounts for each Fund, which are combined into eight groups for reporting purposes as set out above. 146 The General Fund was established for the purpose of accounting for the expenditure of the Organization. 147 The Working Capital Fund was originally established as a US dollar based Fund by Assembly resolution A.19(I) and was converted to sterling with effect from 1 January 1988 by Assembly resolution A.633(15)B. The
3 All funds and bilateral agreements with a closing balances in excess of £500,000 are disclosed separately, with other funds being
aggregated under 'Other Bilateral Operations and Multi-Donor Trust Funds'. 4 Governments of Australia, Canada, China, Denmark, Egypt, Finland, France, Germany, Italy, Japan, Malaysia, Netherlands, Nigeria,
Oman, Republic of Korea, Saudi Arabia, Spain, Sweden, United States of America, European Commission, Indian Ocean Commission, International Association of Ports and Harbours (IAPH), International Transport Workers Federation, Norwegian Agency for Development Corporation (NORAD), Union of Greek Ship-owners, United Nations Development Programme (UNDP), United Nations Environment Programme (UNEP), United Nations Office for Project Services (UNOPS), Ballast Water TV Documentary, Goal-Based Standards (GBS) Trust Fund, IMO London Convention/Protocol TC Trust Fund, IMO Malacca and Singapore Straits Trust Fund, IMO West and central Africa Maritime Security Trust Fund, IMO/REMPEC Trust Fund, IMO-Glo Ballast Global Industry Alliance (GIA) Fund, Implementation of the revised STCW Convention and Code, International Search and Rescue (SAR) Trust Fund, International Ship Recycling Trust Fund, Junior Professional Officer, Marine Pollution Response Trust Fund, Research and Development Trust Fund, Seminars and Workshops Fund, Study on Greenhouse Gas Emissions, Tsunami Relief Fund, Voluntary IMO Member States Audit Scheme Trust Fund.
FINANCIAL REPORT AND AUDITED FINANCIAL STATEMENTS FOR THE YEAR ENDED 31 DECEMBER 2017
53
purpose of the Fund is to make advances, if necessary, to finance the budgetary appropriations of the Regular Budget to cover temporary cash flow deficits. Assembly resolution A.1039 (27) further authorized the Secretary-General to use the fund as a reserve to account for currency gains or losses in the regular budget arising from differences between the United Nations operational rate of exchange and the rate against the pound sterling adopted for calculation of the appropriation. It also authorises the Secretary-General to advance such sums from the Working Capital Fund as may be necessary to meet unforeseen or extraordinary expenses arising during the biennium, with the prior agreement of the Council, provided that such expenses are of a clearly exceptional nature and relate specifically to the Strategic and High-level Action plans of the Organization and that the Council is assured that the relevant expenditure cannot be met by appropriate transfer action within the total budget approved for a calendar year. 148 The Printing Fund was established with effect from 1 January 1966 by Assembly resolution A.100(IV) to provide for the production and sales of IMO publications, being subsequently replaced by the Trading Fund through Assembly resolution A.1014(26), broadening its terms of reference to encompass the Organization's current commercial activities. 149 The Termination Benefit Fund was established with effect from 1 January 1996 by Assembly resolution A.837(19) at an initial level of £900,000 to meet the costs associated with termination benefits to staff of the Organization. The scope of the Fund was widened to allow the financing of the additional costs of temporary assistance required to replace staff on long-term sick leave. From 2012 it was further widened to accommodate long-term employee benefit liabilities previously allocated among all Funds on the basis of headcount. 150 The Technical Cooperation Fund was originally established with effect from 1 January 1986 by Assembly resolution A.593(14) as a US dollar based fund, the interest income from which was used to assist the Technical Cooperation Programme of the Organization in accordance with the proposal supported by the Assembly in biennial budgets. The Fund was converted to a sterling based fund with effect from 1 January 1996 by Assembly resolution A.837(19). By that resolution, the scope of the Fund was widened to enable funds to be drawn down and applied to technical cooperation activities. 151 The Headquarters Capital Fund was established with effect from 1 January 1994 by Assembly resolution A.778(18) to meet the capital expenditure necessary for the efficient operation of the Organization and for fulfilling the Organization's liabilities under the terms of the Lease for the Headquarters building between the Organization and the Government of the United Kingdom. The scope of the Headquarters Capital Fund was widened to include expenditure on the design, installation and implementation of office automation systems, including training on these systems. 152 The Training and Development Fund was established with effect from 1 January 2002 by Assembly resolution A.906(22) at an initial level of £200,000 by a transfer from the surplus of the then Printing Fund as at 1 January 2002 for organizational strengthening initiatives. 153 Trust Funds are established to account for the expenditures related to the activities financed from the respective donors. Fund balances represent the unexpended portion of contributions that are intended to be utilized in future operational requirements consistent with the Terms of Reference of the Fund. These constitute IMO's residual interest in the assets after deducting all its liabilities.

FINANCIAL REPORT AND AUDITED FINANCIAL STATEMENTS FOR THE YEAR ENDED 31 DECEMBER 2017
54
NOTE 3: REVENUE
Note 3.1: Assessed Contributions 154 The Organization's ten largest contributors to assessed contributions in 2017 are shown below. Assessed contributions are based on a flat base rate with additional components based on economic factors using UN index and merchant fleet tonnage. WMU and IMLI do not receive assessed contributions.
IMO Amount GBP % of total
assessment
1 Panama 4,896,058 16.26
2 Liberia 2,943,744 9.77
3 Marshall Islands 2,803,537 9.31
4 Singapore 1,829,757 6.07
5 Malta 1,482,972 4.92
6 Bahamas 1,322,304 4.39
7 United Kingdom 1,237,591 4.11
8 China 1,236,270 4.10
9 Greece 942,964 3.13
10 United States Of America 831,412 2.76
Total 19,526,609 64.82
Note 3.2: Donor Voluntary Contributions 155 Contributions through donor agreements are recognized as revenue at the point of signature, except to the extent that such agreement contains a condition within the meaning of IPSAS 23 – "Revenue from Non-Exchange Transactions" such that the contributions must be returned if the condition is not met. For agreements which do contain such a condition, revenue is recognized as the project is delivered. 156 The Organization's ten largest contributors to donor revenue in 2017 are shown below:
IMO Amount GBP % of total donor revenue
1 Government of the Republic of Korea 1,788,300 32.2 2 European Commission 957,072 17.2 3 Government of Norway 818,611 14.7 4 United Nations Environment Programme (UNEP) 652,764 11.7 5 Government of the United States of America 251,225 4.5 6 Government of China 244,510 4.4 7 Government of Japan 239,658 4.3 8 Government of Malaysia 172,200 3.1 9 United Nations Development Programme (UNDP) 111,750 2.0
10 Government of Netherlands 111,490 2.0
Total 5,347,580 96.1

FINANCIAL REPORT AND AUDITED FINANCIAL STATEMENTS FOR THE YEAR ENDED 31 DECEMBER 2017
55
157 The consolidated group's ten largest contributors to donor revenue in 2017 are shown below:
Consolidated Amount GBP % of total donor revenue
1 Government of Sweden 2,566,200 24.2 2 Government of the Republic of Korea 2,002,779 18.9 3 European Commission 957,072 9.0 4 Nippon Foundation 956,605 9.0 5 Government of Norway 818,611 7.7 6 United Nations Environment Programme (UNEP) 652,764 6.2 7 Government of the United States of America 251,225 2.4 8 Government of China 244,510 2.3 9 Government of Japan 239,658 2.3
10 Government of Malaysia 200,117 1.9
Total 8,889,541 83.9
Note 3.3: Commercial Activities 158 Key commercial revenue streams for the Organization and the consolidated group are shown below:
IMO Consolidated 2017 2016 2017 2016 GBP GBP GBP GBP
Publication Sales 11,901,775 12,319,895 11,901,185 12,319,024 Cafeteria Sales 1,062,293 699,724 1,062,293 699,724 Assessment fees 383,932 255,402 383,932 255,402 Letting of conference facilities and other commercial revenue
385,842 171,911 1,636,735 1,331,774
Total 13,733,842 13,446,932 14,984,145 14,605,924
159 The major components of IMO Publication Sales are shown below:
IMO 2017 2016 GBP GBP
Sale of physical publications 9,976,966 10,892,893 Electronic publications 789,112 563,449 Royalties 699,914 495,526 Subscriptions 212,305 194,491 Model Courses 127,826 116,167 Other publications 95,652 57,369
Total 11,901,775 12,319,895

FINANCIAL REPORT AND AUDITED FINANCIAL STATEMENTS FOR THE YEAR ENDED 31 DECEMBER 2017
56
Note 3.4: Fellowships 160 Both WMU and IMLI receive funds for fellowships to support students. IMO does not receive such revenue, and consequently the consolidated figures only are shown. The five largest aggregate contributors are listed below: Consolidated 2017 % of total
fellowship revenue
GBP
1 The Nippon Foundation 1,619,048 32.1 2 Government of Norway 495,021 9.8 3 Philippines Port Authority & Merchant Marine Academy 421,220 8.3 4 The TK Foundation 232,724 4.6 5 International Transport Workers' Federation (ITF) 175,513 3.5
Total 2,943,526 58.3
Note 3.5: Other Revenue 161 The most significant sources of other revenue are set out below: IMO Consolidated
2017 2016
2017 2016
GBP GBP GBP GBP
Interest earned on investment of funds 209,630 231,749 288,399 269,504
Sub-letting of office space - - - 14,553
Other revenue 26,887 54,039 219,979 412,693
Total 236,517 285,788 508,378 696,750

FINANCIAL REPORT AND AUDITED FINANCIAL STATEMENTS FOR THE YEAR ENDED 31 DECEMBER 2017
57
NOTE 4: EXPENSES IMO Consolidated 2017 2016 2017 2016 GBP GBP GBP GBP
4.1: Staff and other personnel costs Professional and general service staff, experts 27,413,551 26,261,440 33,861,805 31,784,886 Appointment and separation 2,777,642 2,379,153 2,822,022 2,494,616 Termination benefit 137,343 27,322 137,343 27,322 Consultants 1,453,403 1,684,999 1,855,030 2,246,940 Temporary assistance 1,346,050 1,205,368 1,356,459 1,235,953 Meetings personnel (interpreters, translators, temporary employees)
801,398 866,532
801,397 866,532
Total staff and other personnel costs 33,929,387 32,424,814 40,834,056 38,656,249
4.2:Travel expenses
Fares 1,064,983 1,175,193 1,406,356 1,418,499 Daily Subsistence Allowance (DSA) and other expenses 996,847
970,044
1,202,762 1,192,424
Total travel expenses 2,061,830 2,145,237 2,609,118 2,610,923
4.3: Supplies, consumables and other running costs
Office supplies and consumables 85,084 131,662 139,599 173,403 Telecommunications and information technology 1,222,262 1,127,103 1,512,232 1,327,297 Rent, rates and insurance 1,440,866 1,435,961 1,491,095 1,480,791 Utilities 701,613 556,914 748,011 603,248 Medical costs 23,213 16,820 23,213 16,820 Library books, magazines, subscriptions 33,032 30,192 201,665 202,527 Hospitality 25,234 31,636 151,786 151,783 Vehicle, local transport and hotel accommodation 35,492 46,215 46,684 53,556 Postage, telephone and freight 383,284 369,099 446,063 432,496 Equipment, furniture and local procurement 2,143,119 870,162 2,171,024 854,221 Building maintenance 905,349 1,198,487 916,000 1,203,163 Other operational costs - - 182,888 215,527
Total supplies, consumables and other running costs 6,998,548 5,814,251 8,030,260 6,714,832
4.4: Costs related to trading activities
Cost of Sales IMO Publications 828,617 1,019,209 828,617 1,019,209 Cost of Sales Model courses 25,247 30,797 25,247 30,797 Loss on Physical Inventory (4,144) (1,717) (4,144) (1,717) Publications issued free of charge 30,115 27,604 30,115 27,604 Provision for return of obsolete publications 75,089 81,793 75,089 81,793 Printing (contract - out) 133,738 146,859 133,738 146,859 Electronic publishing (IMO/Vega) 149,315 156,013 149,315 156,013 Catering food and supplies 564,488 447,663 564,488 447,663 Public relations articles held by WMU - - 8,514 6,743
Total costs related to trading activities 1,802,465 1,908,221 1,810,979 1,914,964

FINANCIAL REPORT AND AUDITED FINANCIAL STATEMENTS FOR THE YEAR ENDED 31 DECEMBER 2017
58
IMO Consolidated
2017 2016 2017 2016
GBP GBP GBP GBP
4.5: Outsourced services
Security services 499,460 533,375 529,932 574,834 Cleaning services 493,454 451,059 632,353 566,117 Telecommunications/IT related services - - 38,206 35,318 Catering services - - 95,681 101,086 Leases 20,178 26,986 20,178 26,986 Sub-contract delivery of Technical Cooperation activities 58,393
39,459
58,393 39,459
Total outsourced services 1,071,485 1,050,879 1,374,743 1,343,800
4.6: Training and development Staff training 53,519 59,352 85,100 85,686 Fellowships 743,434 1,784,566 2,537,316 2,313,516 Group training including participant travel 2,488,900 2,434,458 2,488,900 2,434,459 Student costs (WMU and IMLI) - - 138,481 94,558
Total training and development 3,285,853 4,278,376 5,249,797 4,928,219
4.7: Currency exchange (gain) loss 1,714,673 (3,103,706) 2,913,448 (3,905,654)
4.8: Depreciation, amortization and impairment
Depreciation of property, plant and equipment 490,761 516,276 671,529 681,674 Loss/(gain) on disposal of property, plant and equipment
927 38,576
927 39,639
Amortization of intangible assets 404,283 213,008 406,211 221,607 Impairment of IMO publications 45,247 21,348 45,247 21,348
Total depreciation, amortization and impairment 941,218 789,208 1,123,914 964,268
4.9: Return of unspent funds 317,872 326,840 317,872 326,840
4.10: Other expenses Jointly financed UN bodies 111,346 104,914 111,346 104,914 Grants 299,236 461,019 - 170,750 Bank charges 178,335 174,755 198,203 190,042 External audit 49,468 58,100 83,916 93,381 Other miscellaneous expenses 168,600 807,222 611,108 1,086,024
Total other expenses 806,985 1,606,010 1,004,573 1,645,111
Total expenses 52,930,316 47,240,130 65,268,760 55,199,552
162 Staff and other personnel costs include salaries, fees, employee benefits and other costs associated with staff, project experts and support personnel, consultants, temporary assistance and meeting personnel (interpreters, translators and temporary employees) of all headquarters and field staff employed by IMO. 163 Travel includes the cost of the fares, DSA and other associated expenses of the mission of staff members, project experts and consultants. The costs of home leave travel, recruitment travel and repatriation travel are reported under 4.1 – Staff and other personnel costs and the students' travel and field trips costs are accounted for under 4.6 – Training and development.
FINANCIAL REPORT AND AUDITED FINANCIAL STATEMENTS FOR THE YEAR ENDED 31 DECEMBER 2017
59
164 Supplies, consumables and other running costs primarily include the cost of running the headquarters and field office buildings, including rent paid under the building lease with the Government of the United Kingdom of £1,195,751 (2016: £1,195,751). 165 Costs related to trading activities include the cost of all commercial sales within the meaning of IPSAS 9 – "Revenue from Exchange Transactions", but excludes staff costs and common overhead costs. 166 Outsourced services include the costs of the most significant outsourcing arrangements in place, namely those for the provision of security, cleaning and building management services. Sub-contracts under the technical cooperation and extra-budgetary activities are also reported under this expense category. 167 Training and development includes the cost of staff training incurred under the regular budget and the Training and Development Fund, and the fellowship and group training costs incurred under the Technical Cooperation Fund and various donor trust Funds. 168 Other expenses include shared costs of jointly financed UN bodies, public information (including IMO News and publicity), bank charges and external audit fees.
NOTE 5: STATEMENT OF COMPARISON OF BUDGET AND ACTUAL AMOUNTS 169 Explanations of material differences between the original budget and the final budget as well as between the final budget and the actual amounts are presented under the Financial and Budget Performance Highlights section of the Secretary-General’s Statement. 170 The Organization’s budget and accounts are prepared on different bases. The Statement of Financial Performance (Statement II) is prepared on a full accrual basis using a classification based on the nature of expenses, whereas the Statement of Comparison of Budget and Actual Amounts (Statement V) is prepared on a modified accrual basis. In this respect, it is required under IPSAS 24 that actual amounts presented in Statement V should be reconciled to the actual amounts presented in the financial statements, identifying differences in terms of basis, timing and entity, respectively.
171 Basis differences occur when the approved budget is prepared on a basis other than the accounting basis. For IMO, the budget is prepared on a modified accruals basis and the financial statements are prepared on a full accruals basis in accordance with IPSAS, and as a result basis differences arise in particular for long-term assets and liabilities. One example is Property, Plant and Equipment, where budget expenditure is recognized on purchase of a new asset while the IPSAS-based expenditure recognized in Statement II shows depreciation over the life of the asset. 172 Entity differences occur when the budget omits programmes or entities that are part of the entity for which the financial statements are prepared. For IMO, the Organization’s extra-budgetary and donor-funded programmes are not a part of the budgetary approval process of the Assembly and the Council and so are not included in Statement V, and consequently the revenue and expenses relating to such programmes are an entity difference. 173 Presentation differences occur as a result of differences in the format and classification schemes adopted for the presentation of the Statement of Cash Flow and the Statement of Comparison of Budget and Actual Amounts, in particular in relation to the reflection of transfers from the surplus of the Trading Fund which then forms the basis for a proportion of the approved budget of other Funds. These amounts are shown separately for budget comparison purposes, but are eliminated when preparing the overall IMO position shown in Statements II and IV.

FINANCIAL REPORT AND AUDITED FINANCIAL STATEMENTS FOR THE YEAR ENDED 31 DECEMBER 2017
60
174 Timing differences occur when the budget period differs from the reporting period reflected in the financial statements. There is no timing difference for IMO, for the purposes of comparison between budget and actual amounts.
175 The reconciliation between the actual amounts on a comparable basis in the Statement of Comparison of Budget and Actual Amounts (Statement V) and the actual amounts in the Statement of Cash Flow (Statement IV) for the year ended 31 December 2017 is shown below. Budget amounts have been presented on a functional classification basis in accordance with the approved budget for 2017, which presents a breakdown of the budget for purposes of the above comparison. The amount of surplus of £1,998,595 for 2017 shown in Statement Va (IMO only) has been reconciled to the net decrease in cash and cash equivalents of (£2,079,702) presented in Statement IV (IMO 2017) and the details of the reconciliation are presented in the table below.
Adjustments pertaining to cash flows from:
Operating activities
Investing activities
Financing activities
Total
Actual amounts on a comparable basis as presented in the Budget and Actual comparative Statement
A 1,998,595 - - 1,998,595
Basis differences (a) (1,303,601) (828,901) 333,498 (1,799,004)
Entity differences (b) (2,233,580) (75,430) - (2,309,010)
Presentation differences (c) 29,717 - - 29,717
Total Differences B=a+b+c (3,507,464) (904,331) 333,498 (4,078,297)
Actual amounts in the Statement of Cash Flows
C=A+B (1,508,869) (904,331) 333,498 (2,079,702)
176 The reconciliation of the amount of surplus of £2,820,082 shown in Statement Vb (Consolidated 2017 including WMU and IMLI) has also been made to the net decrease in cash and cash equivalents of £3,139,070 indicated in Statement IV (Consolidated 2017), as shown in the table below, using the reconciliation statements submitted by WMU and IMLI.
Adjustments pertaining to the cash flows from:
Operating activities
Investing activities
Financing activities
Total
Actual amounts on a comparable basis as presented in the Budget and Actual comparative Statement
A 2,820,082 - - 2,820,082
Basis differences (a) (1,303,599) (828,901) 333,498 (1,799,002)
Entity differences (b) (3,073,125) (1,116,742) - (4,189,867)
Presentation differences (c) 29,717 - - 29,717
Total Differences B=a+b+c (4,347,007) (1,945,643) 333,498 (5,959,152)
Actual amounts in the Statement of Cash Flows
C=A+B (1,526,925) (1,945,643) 333,498 (3,139,070)

FINANCIAL REPORT AND AUDITED FINANCIAL STATEMENTS FOR THE YEAR ENDED 31 DECEMBER 2017
61
NOTE 6: SEGMENT REPORTING
Note 6.1: Segmental Statements of Financial Position
Note 6.1.1: Statement of Financial Position by Segment – IMO
Core
Programme Management
Trading and
Business Activities
Technical Cooperation Activities and
Trust Fund
Elimination Grand Total
GBP
ASSETS
Current assets
Cash and cash equivalents 23,463,901 8,228,361 24,884,136 - 56,576,398
Contributions receivable 90,551 - 234,458 - 325,009
Inventories - 1,118,521 - - 1,118,521
Advances to sub-contractors - - 530,386 - 530,386
Inter-segment sums receivable 1,960,941 1,387,403 1,470,800 (4,819,144) -
Other receivables – exchange transactions 2,340,271 288,696 561,342 - 3,190,309
Other receivables – non-exchange transactions
- - - - -
Total Current Assets 27,855,664 11,022,981 27,681,122 (4,819,144) 61,740,623
Non-current assets
Property, plant and equipment 1,943,743 24,258 152,190 - 2,120,191
Intangible assets 814,665 - 58,185 - 872,850
Total non-current assets 2,758,408 24,258 210,375 - 2,993,041
TOTAL ASSETS 30,614,072 11,047,239 27,891,497 (4,819,144) 64,733,664
LIABILITIES
Current liabilities
Payables and accruals – exchange transactions
(1,057,821) (862,366) (1,219,612) - (3,139,799)
Payables and accruals – non-exchange transactions
(448,628) - (5,112,376) - (5,561,004)
Provisions and warranties - (66,981) - - (66,981)
Inter-segment sums payable (2,160,164) (832,602) (1,826,378) 4,819,144 -
Employee benefits (57,827) - (5,249) - (63,076)
Finance lease liabilities (115,469) - - - (115,469)
Total current liabilities (3,839,909) (1,761,949) (8,163,615) 4,819,144 (8,946,329)
Non-current liabilities
Employee benefits (45,998,294) - - - (45,998,294)
Finance lease liabilities (316,337) - - - (316,337)
Total non-current liabilities (46,314,631) - - - (46,314,631)
TOTAL LIABILITIES (50,154,540) (1,761,949) (8,163,615) 4,819,144 (55,260,960)
NET ASSETS (19,540,468) 9,285,290 19,727,882 - 9,472,704
FUND BALANCES AND RESERVES
Fund balances and reserves (17,852,818) 9,417,494 21,174,787 - 12,739,463
Surplus (Deficit) for the year (1,687,650) (132,204) (1,446,905) - (3,266,759)
TOTAL FUND BALANCES AND RESERVES (19,540,468) 9,285,290 19,727,882 - 9,472,704

FINANCIAL REPORT AND AUDITED FINANCIAL STATEMENTS FOR THE YEAR ENDED 31 DECEMBER 2017
62
Note 6.1.2: Statement of Financial Position by Segment – Consolidated
Core
Programme Management
Trading and
Business Activities
Technical Cooperation
Activities and Trust
Fund
Education and
Research Elimination Grand Total
GBP
ASSETS
Current assets
Cash and cash equivalents 23,463,901 8,228,361 24,884,136 13,935,815 - 70,512,213
Contributions receivable 90,551 - 234,458 13,409 (107) 338,311
Inventories - 1,118,521 - 47,799 (19,838) 1,146,482
Advances to sub-contractors - - 530,386 - - 530,386
Inter-segment sums receivable 1,960,941 1,387,403 1,470,800 - (4,819,144) -
Other receivables – exchange transactions
2,340,271 288,696 561,342 1,045,490 (375,060) 3,860,739
Other receivables – non-exchange transactions
- - - 16,564 - 16,564
Total current assets 27,855,664 11,022,981 27,681,122 15,059,077 (5,214,149) 76,404,695
Non-current assets
Investment in Bonds 886,500 - 886,500
Property, plant and equipment
1,943,743 24,258 152,190 304,313 (162) 2,424,342
Intangible assets 814,665 - 58,185 389 - 873,239
Total non-current assets 2,758,408 24,258 210,375 1,191,202 (162) 4,184,081
TOTAL ASSETS 30,614,072 11,047,239 27,891,497 16,250,279 (5,214,311) 80,588,776
LIABILITIES
Current liabilities
Payables and accruals – exchange transactions
(1,057,821) (862,366) (1,219,612) (354,882) 380,090 (3,114,591)
Payables and accruals – non-exchange transactions
(448,628) - (5,112,376) (5,276,939) 560,536 (10,277,407)
Provisions and warranties - (66,981) - - - (66,981)
Inter-segment sums payable (2,160,164) (832,602) (1,826,378) - 4,819,144 -
Employee benefits (57,827) - (5,249) (56,661) - (119,737)
Finance lease liabilities (115,469) - - - - (115,469)
Total current liabilities (3,839,909) (1,761,949) (8,163,615) (5,688,482) 5,759,770 (13,694,185)
Non-current liabilities
Employee benefits (45,998,294) - - (926,030) - (46,924,324)
Finance lease liabilities (316,337) - - - - (316,337)
Total non-current liabilities (46,314,631) - - (926,030) - (47,240,661)
TOTAL LIABILITIES (50,154,540) (1,761,949) (8,163,615) (6,614,512) 5,759,770 (60,934,846)
NET ASSETS (19,540,468) 9,285,290 19,727,882 9,635,767 545,459 19,653,930
FUND BALANCES AND RESERVES
Fund balances and reserves (17,852,818) 9,417,494 21,174,787 9,884,059 661,339 23,284,861
Surplus (Deficit) for the year (1,687,650) (132,204) (1,446,905) (248,292) (115,880) (3,630,931)
TOTAL FUND BALANCES AND RESERVES
(19,540,468) 9,285,290 19,727,882 9,635,767 545,459 19,653,930

FINANCIAL REPORT AND AUDITED FINANCIAL STATEMENTS FOR THE YEAR ENDED 31 DECEMBER 2017
63
Note 6.2: Segmental Statements of Financial Performance Note 6.2.1: Statement of Financial Performance by Segment – IMO
Core
Programme Management
Trading and Business Activities
Technical Cooperation Activities and
Trust Fund
Elimination Grand Total
GBP
Revenue
Assessed contributions 30,131,469 - - - 30,131,469
Donor voluntary contributions - - 5,561,729 - 5,561,729
Commercial activities 385,842 12,832,490 515,510 - 13,733,842
Other revenue 111,482 28,106 96,929 - 236,517
Support costs earned 1,395,948 - - (1,395,948) -
Inter-segment transfers 3,479,945 - 5,992,114 (9,472,059) -
TOTAL REVENUE 35,504,686 12,860,596 12,166,282 (10,868,007) 49,663,557
Expenses
Staff and other personnel costs (28,524,496) (1,932,133) (3,472,758) - (33,929,387)
Travel expenses (496,133) (103,414) (1,462,283) - (2,061,830)
Supplies, consumables and other running costs
(4,245,665) (694,412) (2,058,471) - (6,998,548)
Cost related to trading activities (260) (1,802,205) - - (1,802,465)
Outsourced services (893,666) (119,426) (58,393) - (1,071,485)
Training and development (52,734) (785) (3,232,334) - (3,285,853)
Support costs charged - (662,674) (733,274) 1,395,948 -
Depreciation, amortisation and impairment
(811,856) (55,746) (73,616) - (941,218)
Return of unspent funds - - (317,872) - (317,872)
Other expenses 44,417 (133,317) (718,085) - (806,985)
Inter-segment transfers (1,937,459) (7,480,867) (53,733) 9,472,059 -
TOTAL EXPENSES (36,917,852) (12,984,979) (12,180,819) 10,868,007 (51,215,643)
Currency exchange gain/(loss) (274,484) (7,821) (1,432,368) - (1,714,673)
SURPLUS (DEFICIT) FOR THE YEAR (1,687,650) (132,204) (1,446,905) - (3,266,759)

FINANCIAL REPORT AND AUDITED FINANCIAL STATEMENTS FOR THE YEAR ENDED 31 DECEMBER 2017
64
Note 6.2.2: Statement of Financial Performance by Segment – Consolidated
Core
Programme Management
Trading and Business Activities
Technical Cooperation
Activities and Trust
Fund
Education and
Research Elimination Grand Total
GBP
Revenue
Assessed contributions 30,131,469 - - - - 30,131,469 Donor voluntary contributions
- - 5,561,729 5,042,999 (180) 10,604,548
Commercial activities 385,842 12,832,490 515,510 1,270,126 (19,823) 14,984,145 Fellowships 6,428,764 (1,019,475) 5,409,289 Other revenue 111,482 28,106 96,929 272,418 (557) 508,378 Support costs earned 1,395,948 - - (1,395,948) Inter-segment transfers 3,479,945 - 5,992,114 - (9,472,059) -
TOTAL REVENUE 35,504,686 12,860,596 12,166,282 13,014,307 (11,908,042) 61,637,829 Expenses Staff and other personnel costs
(28,524,496) (1,932,133) (3,472,758) (6,923,712) 19,043 (40,834,056)
Travel expenses (496,133) (103,414) (1,462,283) (547,900) 612 (2,609,118) Supplies, consumables and other running costs
(4,245,665) (694,412) (2,058,471) (1,032,374) 662 (8,030,260)
Costs related to trading activities
(260) (1,802,205) - (8,514) - (1,810,979)
Outsourced services (893,666) (119,426) (58,393) (303,258) - (1,374,743) Training and development (52,734) (785) (3,232,334) (2,564,309) 600,365 (5,249,797) Support costs charged - (662,674) (733,274) - 1,395,948 - Depreciation, amortization and impairment
(811,856) (55,746) (73,616) (182,696) - (1,123,914)
Return of unspent funds - - (317,872) - - (317,872) Other expenses 44,417 (133,317) (718,085) (496,823) 299,235 (1,004,573) Inter-segment transfers (1,937,459) (7,480,867) (53,733) - 9,472,059 -
TOTAL EXPENSES (36,917,852) (12,984,979) (12,180,819) (12,059,586) 11,787,924 (62,355,312)
Currency exchange gain/ (loss)
(274,484) (7,821) (1,432,368) (1,203,013) 4,238 (2,913,448)
SURPLUS (DEFECIT)FOR THE YEAR
(1,687,650) (132,204) (1,446,905) (248,292) (115,880) (3,630,931)
177 Some internal activities result in accounting transactions which create inter-segment revenue and expense balances in the financial statements. Inter-segment transactions are reflected in the above statements to accurately present these financial statements, the most significant examples of which are the Council-mandated transfers from the Trading Fund to other organizational funds. The aggregate amount was £7,480,867, of which £5,984,693 was to the Technical Cooperation Fund, comprising £5,685,458 for the TC Fund itself and a further £299,235 for onward transfer to WMU, and £1,496,174 was to the Core Programme. In addition, there are support costs totalling £733,274 charged on extra-budgetary activities and £662,674 charged to the Trading Activities to reimburse costs incurred by the Core Programme. 178 In the consolidated notes, revenue totalling £578,730 (2016:£526,430) and expenditure totalling £674,746 (2016:£1,181,068) between IMO and WMU, and revenue totalling £461,305 (2016:£312,049) and expenditure totalling £249,409 (2016:£681,823) between IMO and IMLI, have been included in the segment reporting figures and eliminated in arriving at the consolidated position. The elimination has resulted in a net effect of increasing the deficit by £115,880 (2016:£1,023,411). Further information on the nature of these transactions are provided in Note 9.2.

FINANCIAL REPORT AND AUDITED FINANCIAL STATEMENTS FOR THE YEAR ENDED 31 DECEMBER 2017
65
179 A brief summary of the goods and services provided under each segment, and their objectives, is set out in Note 1, paragraphs 41 to 46.
NOTE 7: COMMITMENTS AND CONTINGENCIES
Note 7.1: Commitments 180 As at 31 December 2017, IMO had commitments for goods and services including consultancy contracted but not delivered as follows: IMO 2017 2016 GBP GBP
Purchase of services including consultancy 1,522,271 1,562,462
181 The actual discharge of the 2016 commitments in 2017 is £800,770, the breakdown of which is shown below:
2016 Commitments
2017 discharge
Regular budget strategic results 65,275 43,819 Trading activities 3,936 3,936 Headquarters capital 172,672 62,360 Training and development 1,026 923 Termination benefit - - Technical cooperation (TC Fund) 323,914 246,786
Sub-total 566,823 357,824
Technical cooperation (Donor Funds) 995,639 442,946
Total 1,562,462 800,770
182 Neither WMU nor IMLI has commitments or contingencies at the year end and consequently the figures shown above reflect the consolidated position as well.
Note 7.2: Legal or Contingent Liabilities 183 As at 31 December 2017, there are no contingent liabilities arising from legal actions and claims that are likely to result in a significant liability to IMO and to the consolidated group. 184 The Organization, in conjunction with UNDP, conducted a review of all historical balances under the UNDP Service Clearing Account (SCA), and its predecessor the Interoffice Voucher (IOV) scheme, under which UNDP provides services to other UN system organizations, and the Project Clearing Account (PCA), through which UNDP acts as a donor for IMO extra-budgetary activities. While the Organization’s financial statements reflect amendments arising as a result of that review, there remains a net difference on the SCA and PCA accounts of $103,726 and $432,533 respectively, as at 31 December 2017, between IMO and UNDP.
NOTE 8: LOSSES, EX-GRATIA PAYMENTS AND WRITE-OFFS 185 Financial Regulation 12.3 provides that “The Secretary-General may make such ex-gratia payments as he deems to be necessary in the interest of the Organization, provided that a statement of such payments shall be submitted to the Assembly with the financial statements”. During 2017, no ex-gratia payments were made relating to staff termination, medical related bills or service incurred losses suffered by staff.

FINANCIAL REPORT AND AUDITED FINANCIAL STATEMENTS FOR THE YEAR ENDED 31 DECEMBER 2017
66
186 Financial Regulation 12.4 provides that “The Secretary-General may, after full investigation, authorize the writing off of losses of cash, stores and other assets, provided that a statement of all such amounts written off shall be submitted to the External Auditor with the financial statements.” During 2017, loss of assets resulted in write-offs to the total amount of £927 for IMO and for the consolidated group (2016: £17,864 and £19,646). In addition, write-offs as a result of the loss or obsolescence of inventory totalled £45,247 (2016: £21,348) for IMO and for the consolidated group £43,440 (2016: £22,348). 187 There were no cases of fraud or presumptive fraud in 2017.
NOTE 9: RELATED PARTIES AND KEY MANAGEMENT PERSONNEL
Note 9.1: Key Management Personnel
Number of individuals (Full
Time Equivalent)
Compensation and post
adjustment Entitlements
Pension and health plans
Total remuneration
2017
Outstanding Loans and Advances
against entitlements 31.12.2017
IMO
8.25 1,197,864 117,584 284,942 1,600,390 -
Consolidated
10.25 1,732,254 137,059 358,429 2,227,742 - 188 Key management personnel of IMO are the Secretary-General and the seven Divisional Directors. Key management personnel of the consolidated group are the key management personnel of IMO in addition to the President of the WMU and the Director of the IMLI, as they have the authority and responsibility for planning, directing and controlling the activities of the consolidated group. During the period from 1 August to 31 October 2017, a Senior Deputy Director was covering the post of one of the Divisional Director who was on leave of absence, as such the total staff cost for the three months period was included in the total remuneration for 2017. 189 The aggregate remuneration paid to key management personnel includes: net salaries, post adjustment, entitlements (such as representation allowance and other allowances), assignment and other grants, rental subsidy, personal effects shipment costs, and employer pension and current health insurance contributions 190 Key management personnel are also qualified for post-employment benefits (Note 2.11) at the same level as other employees. Key management personnel of IMO are participants of UNJSPF.
Note 9.2: Related Parties 191 The Organization's only related parties within the meaning of IPSAS 20 – "Related Party Disclosures" are the UN International Computing Centre (ICC), WMU and IMLI. The consolidated group, including those bodies, has no related parties. 192 The ICC was established in January 1971 pursuant to Resolution 2741 (XXV) of the United Nations General Assembly. ICC provides Information Technology and Communications services to Partners and Users in the United Nations System. As a Partner bound by the Mandate of the ICC, IMO would be proportionately responsible for any third party claim or liability arising from or related to service activities of the ICC as specified in the ICC Mandate. At 31 December 2017, there are no known claims that impact IMO. Ownership of assets is

FINANCIAL REPORT AND AUDITED FINANCIAL STATEMENTS FOR THE YEAR ENDED 31 DECEMBER 2017
67
with ICC until dissolution. Upon dissolution, the division of all assets and liabilities amongst Partner Organizations shall be agreed by the Management Committee by a formula defined at that time.
193 During 2017, IMO provided £355,132 (2016: £789,549) and £249,337 (2016: £681,622) in fellowship and other funding to WMU and IMLI, respectively, under its Technical Cooperation Programme. These amounts are reflected in expenditure in the IMO figures and have been eliminated on consolidation. Current liabilities of WMU towards IMO totalling £435,208 (2016: £702,012) and IMLI towards IMO of £386,576 (2016: £561,798), in respect of deferred fellowship revenue, have also been eliminated.
NOTE 10: OTHER CHANGES IN NET ASSETS 194 In addition to the actuarial losses of £3,198,793 reported in Note 2.11, exchange rate differences arose due to the effect of converting the opening net assets of WMU and IMLI, whose functional currencies are Swedish Krona and Euro respectively, at the 2017 closing rate which differs from the 2016 closing rate, and such changes are presented as a separate component of net assets/equity in accordance with IPSAS 4. GBP WMU IMLI Total
Opening balance at 31.12.2017 exchange rate 6,244,463 2,894,169 9,138,632 Opening balance at 01.01.2017 exchange rate 6,618,700 3,005,928 9,624,628 (374,237) (111,759) (485,996)
NOTE 11: EVENTS AFTER REPORTING DATE 195 IMO's reporting date is 31 December 2017. On the date of the signing of these accounts, there had been no material events, favourable or unfavourable, incurred between the balance sheet date and the date when the financial statements were authorized for issue that would have impacted these statements.

FINANCIAL REPORT AND AUDITED FINANCIAL STATEMENTS FOR THE YEAR ENDED 31 DECEMBER 2017
68
ANNEX (unaudited)
Name Address
IMO International Maritime Organization
4, Albert Embankment London SE1 7SR United Kingdom
General Counsel Director, Legal Affairs and External Relations Division
Mr. F. J. Kenney 4, Albert Embankment London SE1 7SR United Kingdom
Actuary Barnett Waddingham LLP
Cheapside House 138 Cheapside London EC2V 6BW
Principal Bankers J.P. Morgan Chase JP Morgan Chase Bank N.A. 25 Bank Street Canary Wharf London E14 5JP
External Auditor Auditor General of Ghana
The Auditor General Ministry Block O P.O. Box M 96 Accra Ghana