international monetary fund financial statements(ifrs) for complete financial statements and should...
TRANSCRIPT

INTERNATIONAL MONETARY
FUND
FINANCIAL STATEMENTS
Quarter Ended October 31, 2014

1
IMF Financial Statements
General Department
Consolidated statements of financial position 3
Consolidated statements of comprehensive income 4
Consolidated statements of changes in reserves, resources, and retained earnings 4
Consolidated statements of cash flows 5
Notes to the consolidated financial statements 6
Schedule 1—Quotas, IMF’s holdings of currencies, reserve tranche positions, and outstanding credit and loans 11
Schedule 2—Financial resources and liquidity position in the General Resources Account 16
Schedule 3—Status of arrangements in the General Resources Account 17
Schedule 4—Status of borrowings in the General Resources Account 18
SDR Department
Statements of financial position 20
Statements of comprehensive income 21
Notes to the financial statements 22
Schedule 1—Statements of changes in SDR holdings 23
Schedule 2—Allocations and holdings of participants 24
Concessional Lending and Debt Relief Trusts
Statements of financial position 29
Statements of comprehensive income and change in resources 29
Statements of cash flows 30
Notes to the financial statements 31
Schedule 1—PRG Trust: Status of arrangements 35 Schedule 2—PRG Trust: Cumulative contributions to Subsidy Accounts related to distribution of
IMF’s General Reserve attributable to windfall gold sales profits 36

I. General Department

General Department
Consolidated statements of financial position
(In millions of SDRs)
October 31, 2014(unaudited)
April 30, 2014
October 31, 2014(unaudited)
April 30, 2014
Assets Liabilities (including quotas)
Usable currencies 156,657 153,460 Investment trades payable 245 353
Credit outstanding (Note 2) 78,884 81,238 Other liabilities 694 723
Other currencies 37,290 37,290 Employee benefits (Note 9) 472 135
Total currencies 272,831 271,988 Special Contingent Account 1,188 1,188
SDR holdings 12,979 12,462 Borrowings (Note 6) 47,788 47,288
Interest and charges receivable (Note 3) 632 585 Quotas, represented by:
Investments (Note 4) 15,146 15,199 Reserve tranche positions 44,178 47,374
Gold holdings (Note 5) 3,167 3,167 Subscription payments 193,943 190,747
Fixed assets 374 350 Total quotas 238,121 238,121
Other assets 77 71 Total liabilities (including quotas) 288,508 287,808
Reserves of the General Resources Account 16,542 15,945 Retained earnings of the Investment Account 134 47 Resources of the Special Disbursement Account 22 22 ______ ______ _______ ______
Total assets 305,206 303,822 Total liabilities, reserves, retained earnings, and resources 305,206 303,822
The accompanying notes are an integral part of these consolidated financial statements.
Andrew Tweedie /s Director, Finance Department
Christine Lagarde /s Managing Director
3

4
General Department
Consolidated statements of comprehensive income for the three and six months ended October 31, 2014, and 2013
(unaudited)
(In millions of SDRs)
2014
2013 (restated) 1
Three months Six months
Three months Six months
Operational income
Interest and charges (Note 3) 630 1,265 582 1,165. Interest on SDR holdings 2 5 3 5. Net income from investments (Note 4) 66 87 20 10. Service charges and commitment fees (Note 3) 6 53 6 59.
704 1,410 611 1,239. Operational expenses Remuneration (Note 8) 4 13 8 17 Interest expense on borrowings (Note 6) 6 17 9 17 Administrative expenses 214 436 229 468
224 466 246 502 Net operational income 480 944 365 737
Other comprehensive income
Remeasurement of defined benefit obligation (Note 9) (262) (260) 255 972
Total comprehensive income 218 684 620 1,709
Total comprehensive income of the General Department comprises:
Total comprehensive income of the General Resources Account 152 597 600 1,699 Total comprehensive income of the Investment Account 66 87 20 10 Total comprehensive income of the Special Disbursement Account — — — —
218 684 620 1,709
The accompanying notes are an integral part of these consolidated financial statements. 1 Prior year amounts related to employee benefits have been restated to reflect the application of IAS 19 (amended).
General Department
Consolidated statements of changes in reserves, resources, and retained earnings for the six months ended October 31, 2014, and 2013
(unaudited)
(In millions of SDRs)
The accompanying notes are an integral part of these consolidated financial statements.
1 Prior year amounts related to employee benefits have been restated to reflect the application of IAS 19 (amended).
General Resources
Account reserves
Investment Account retained earnings
Special Disbursement
Account resources
Balance at April 30, 2013 (restated)1 15,060 39 22 Total comprehensive income 1,699 10 — Distribution (Note 11) (1,750) — — Balance at October 31, 2013 (restated)1 15,009 49 22 Balance at April 30, 2014 15,945 47 22 Total comprehensive income 597 87 — Balance at October 31, 2014 16,542 134 22

5
General Department
Consolidated statements of cash flows for the six months ended October 31, 2014, and 2013
(unaudited)
(In millions of SDRs)
2014
2013(restated)1
Usable currencies and SDRs from operating activities
Total comprehensive income 684 1,709
Adjustments to reconcile total comprehensive income to usable currencies and SDRs generated by operations
Depreciation and amortization 16 15 Interest and charges (1,265) (1,165) Interest on SDR holdings (5) (5)
Net income from investments (87) (10) Remuneration 13 17 Interest expense on borrowings 17 17 (627) 578
Changes in other assets (8)
13 Changes in other liabilities (13) (20)
Changes in employee benefits liabilities 337 (868) (311) (297) Usable currencies and SDRs from credit to members Purchases (6,892) (6,026) Repurchases 9,246 11,234 2,043 4,911 Interest received Interest and charges 1,218 1,125 Interest on SDR holdings 7 5 Remuneration and interest paid Remuneration (21) (19) Interest on borrowings (25) (16) Net usable currencies and SDRs (used in)/provided by operating activities 3,222 6,006 Usable currencies and SDRs from investment activities
Acquisition of fixed assets (40) (27) Net disposition/(acquisition) of investments 32 (187)
Net usable currencies and SDRs used in investment activities (8) (214) Usable currencies and SDRs from financing activities Borrowings 5,119 3,294 Repayments of borrowings (4,619) (2,216)
Distribution — (1,750)
Net usable currencies and SDRs provided by/(used in) financing activities 500 (672) Net increase in usable currencies and SDRs 3,714 5,120
Usable currencies and SDRs, beginning of period 165,922 155,233
Usable currencies and SDRs, end of period 169,636 160,353
The accompanying notes are an integral part of these consolidated financial statements.1 Prior year amounts related to employee benefits have been restated to reflect the application of IAS 19 (amended).

General Department
Notes to the consolidated financial statements
6
1. Basis of preparation The unaudited consolidated financial statements of the General Department are prepared in accordance with International Accounting Standard 34 (Interim Financial Reporting). The consolidated financial statements include the accounts of the General Resources Account (GRA); the Investment Account (IA); the Special Disbursement Account (SDA); and the Multilateral Debt Relief Initiative-I Trust (MDRI-I Trust), for which the IMF is the Trustee and over which the SDA has substantial control. These consolidated financial statements do not include all information and notes required by International Financial Reporting Standards (IFRS) for complete financial statements and should be read in conjunction with the April 30, 2014 consolidated financial statements and the notes included therein.
Unit of account The consolidated financial statements are presented in Special Drawing Rights (SDRs), which is the General Department’s unit of account. At October 31, 2014, one SDR was equal to US$1.47833 (US$1.54969 at April 30, 2014).
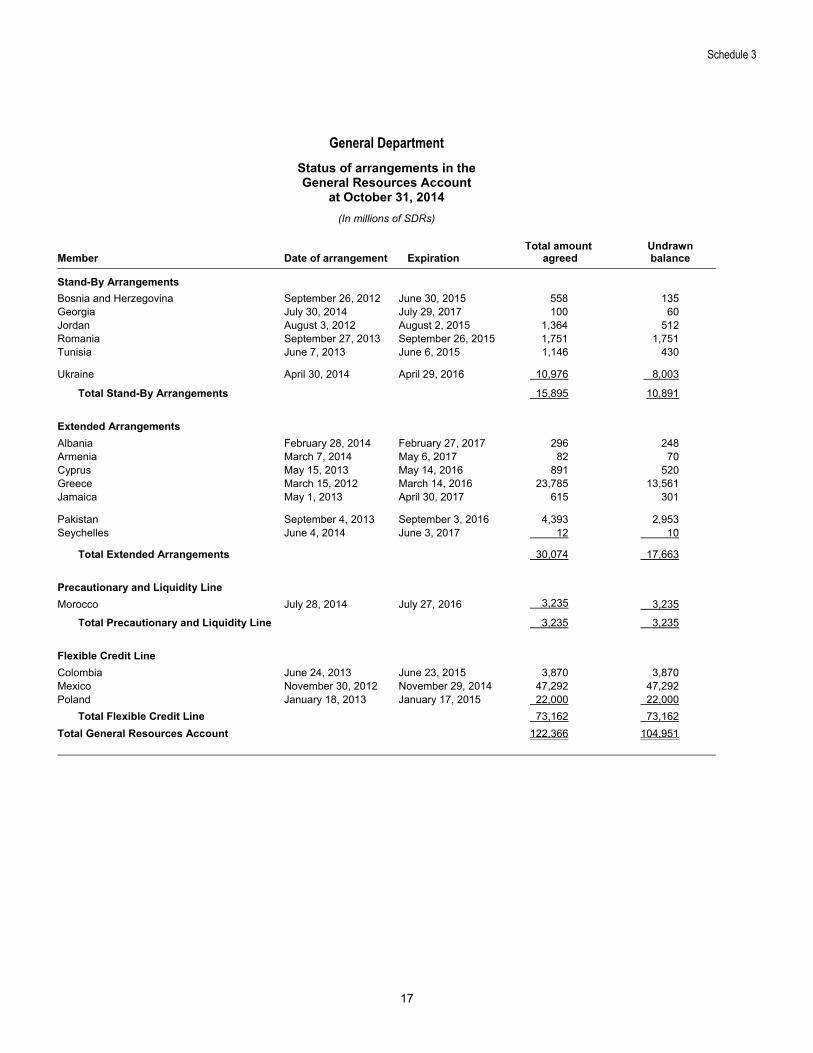
2. Arrangements and credit outstanding in the General Resources Account During the six months ended October 31, 2014, the IMF approved a Stand-By Arrangement (SBA) for Georgia (SDR 100 million); an extended arrangement for Seychelles (SDR 12 million); and a successor Precautionary and Liquidity Line (PLL) for Morocco (SDR 3,235 million). The SBA for Bosnia and Herzegovina was augmented by SDR 84 million. For the six months ended October 31, 2013, SBAs for Romania (SDR 1,752 million) and Tunisia (SDR 1,146 million), extended arrangements for Cyprus (SDR 891 million), Jamaica (SDR 615 million), and Pakistan (SDR 4,393 million), and a Flexible Credit Line (FCL) for Colombia (SDR 3,870 million) were approved. Drawings under credit tranches and extended arrangements during the six months ended October 31, 2014, and 2013, amounted to SDR 6,892 million and SDR 6,026 million, respectively. There were no drawings under FCL and PLL arrangements during the six months ended October 31, 2014, and 2013. At October 31, 2014, the undrawn balances under 13 SBAs and extended arrangements that were in effect in the GRA amounted to SDR 28,554 million (SDR 36,054 million under 13 SBAs and extended arrangements at April 30,2014). In addition, at October 31, 2014, and April 30, 2014, three arrangements under the FCL in the amount of SDR 73,162 million and one arrangement under the PLL with an undrawn balance of SDR 3,235 million at October 31, 2014 (SDR 4,117 million at April 30, 2014) were active; see Schedule 3.
Changes in the outstanding use of IMF credit under the various facilities of the GRA during the six months ended October 31, 2014, and 2013 were as follows:
¹Extended Fund Facility (EFF); Compensatory and Contingency Financing Facility (CFF); Supplementary Financing Facility (SFF).
Scheduled repurchases in the GRA, including overdue repurchases, are summarized below:
Financial year ending April 30
General Resources Account
(In millions of SDRs) 2015 7,697
2016 11,020
2017 7,563
2018 9,251
2019 10,950
2020 and beyond 32,135
Overdue 268
Total 78,884
The use of credit in the GRA by the largest users was as follows:
October 31, 2014 April 30, 2014
(In millions of SDRs and as a percentage of total GRA credit outstanding)
Largest user of credit 22,942 29.1% 22,942 28.2%
Three largest users of credit 64,016 81.2% 64,547 79.5%
Five largest users of credit 70,055 88.8% 70,601 86.9%
April 30, 2014 Purchases Repurchases October 31, 2014
(In millions of SDRs)
Credit tranches 29,418 3,327 (9,240) 23,505 EFF¹ 51,625 3,565 (5) 55,185 Enlarged access 149 — (1) 148 CFF¹ 29 — — 29 SFF¹ 17 — — 17
Total credit outstanding 81,238 6,892 (9,246) 78,884
April 30, 2013 Purchases Repurchases October 31, 2013
(In millions of SDRs)
Credit tranches 48,947 230 (11,231) 37,946 EFF¹ 41,037 5,796 (1) 46,832 Enlarged access 152 — (2) 150 CFF¹ 29 — — 29 SFF¹ 17 — — 17
Total credit outstanding 90,182 6,026 (11,234) 84,974

General Department
Notes to the consolidated financial statements
7
The five largest users of GRA credit at October 31, 2014, in descending order, were Portugal, Greece, Ireland, Ukraine, and Pakistan (Portugal, Greece, Ireland, Romania, and Pakistan at April 30, 2014). The concentration of GRA outstanding credit by region was as follows:
October 31, 2014 April 30, 2014
.(In millions of SDRs and as a percentage of total GRA credit outstanding)
Africa 458 0.6% 629 0.8%Asia and Pacific 963 1.2% 1,230 1.5%Europe 71,916 91.2% 73,122 90.0%Middle East and Central Asia 4,595 5.8% 5,078 6.3%Western Hemisphere 952 1.2% 1,179 1.4%
Total 78,884 100% 81,238 100%
Overdue obligations At October 31, 2014 and April 30, 2014, two members were six months or more overdue in settling their financial obligations to the General Department as follows: GRA
Repurchases and SAF loans1
GRA Charges and SAF interest
October 31, 2014
April 30, 2014
October 31, 2014
April 30, 2014
(In millions of SDRs)
Total overdue 277 280 846 844 Overdue for six months
or more 277 280 844 842 Overdue for three years
or more 277 280 836 834
¹Structural Adjustment Facility (SAF)
The type and duration of the overdue amounts in the General Department were as follows at October 31, 2014:
GRA Repurchases
and SAF loans
GRA Charges and SAF interest
Total obligation
Longest overdue
obligation
(In millions of SDRs)
Somalia 105 122 227 July 1987
Sudan 172 724 896 July 1985 Total 277 846 1,123
3. Interest and charges At October 31, 2014, the credit outstanding on which the IMF levies charges amounted to SDR 78,884 million (SDR 84,974 million at October 31, 2013). For the six months ended October 31, 2014, and 2013, the basic rate of charge was set at the SDR interest rate plus a fixed margin of 100 basis points. The average rate of charge (adjusted for burden sharing) before applicable surcharges for the six months ended October 31, 2014 was 1.071 percent per annum (1.07 percent per annum for the six months ended October 31, 2013). Interest and charges receivable were as follows:
October 31, 2014 April 30, 2014
(In millions of SDRs) Interest and charges 1,340 1,290 Amount paid through burden
sharing (710) (709)
630 581
Accrued interest on SDR holdings 2 4 Total interest and charges
receivable 632 585
The IMF recovers the loss of income due to charges not paid by Somalia and Sudan under the burden sharing mechanism. (All other members are current.) Under this mechanism, the rate of charge is increased and the rate of remuneration is reduced so as to generate an amount of net income equal to the overdue charges. Members that participate in burden sharing receive refunds to the extent that overdue charges are subsequently collected. The rate of remuneration was adjusted in the second quarter of financial year 2015 by 0.003 percent for burden sharing. Commitment fees on canceled, reduced, or expired arrangements and service charges amounted to SDR 53 million and SDR 59 million for the six months ended October 31, 2014, and 2013, respectively.
4. Investments Investments consisted of the following:
October 31, 2014 April 30, 2014
(In millions of SDRs) Investment Account
Fixed–Income subaccount 10,617 10,731
Endowment subaccount 4,516 4,455
15,133 15,186
MDRI-I Trust 13 13
Total 15,146 15,199

General Department
Notes to the consolidated financial statements
8
Investments consisted of the following:
October 31, 2014
Fixed-Income Subaccount
Endowment Subaccount
MDRI-I Trust Total
(In millions of SDRs)At fair value through profit or loss
International financial institutions obligations:
Medium term instruments (BIS) 4,859 — — 4,859
Others 887 — — 887
Developed market sovereign bonds 4,809 239 — 5,048
Developed market corporate bonds — 167 — 167
Emerging market bonds — 110 — 110
Inflation-linked bonds — 222 — 222
Developed market equities — 275 — 275
Emerging market equities — 54 — 54
Real estate investment trusts — 57 — 57
10,555 1,124 — 11,679
At amortized cost
Short-term investments 62 — — 62
Fixed-term deposits — 3,392 13 3,405
Total 10,617 4,516 13 15,146
April 30, 2014
Fixed-Income Subaccount
Endowment Subaccount
MDRI-I Trust Total
(In millions of SDRs)At fair value through profit or loss
International financial institutions obligations:
Medium term instruments (BIS) 4,878 — — 4,878
Others 997 — — 997
Developed market sovereign bonds 4,813 76 — 4,889
Developed market corporate bonds — 53 — 53
Emerging market bonds — 36 — 36
Inflation-linked bonds — 71 — 71
Developed market equities — 89 — 89
Emerging market equities — 18 — 18
Real estate investment trusts — 18 — 18
10,688 361 — 11,049
At amortized cost
Short-term investments 43 — — 43
Fixed-term deposits — 4,094 13 4,107
Total 10,731 4,455 13 15,199
The maturities of the fixed-income securities in the Investment Account were as follows:
Financial year ending April 30 (In millions of SDRs)
2015 3,894 2016 2,997 2017 4,886 2018 2,352 2019 146 2020 and beyond 485 Total 14,760
Investment income comprised the following for the six months ended October 31: 2014 2013 (In millions of SDRs)
Interest and dividends 48 40.
Net realized (losses)/gains (59) 26.
Net unrealized gains/(losses) 98 (56) Total 87 10.
5. Gold holdings At October 31, 2014 and April 30, 2014, the IMF held gold of 2,814 metric tons, equal to 90.474 million fine troy ounces, at designated depositories. Gold holdings were valued at a historical cost of SDR 3,167 million at October 31, 2014 and April 30, 2014, based on a cost per fine troy ounce of SDR 35. At October 31, 2014, the market value of the IMF’s holdings of gold was SDR 71.8 billion (SDR 75.2 billion at April 30, 2014).
6. Borrowings The IMF may potentially borrow up to SDR 366.5 billion under the enlarged and amended New Arrangements to Borrow (NAB), and SDR 18.5 billion under the General Arrangements to Borrow (GAB) and an associated agreement with Saudi Arabia (see Schedule 4). The NAB is the facility of first and principal recourse, and outstanding drawings and commitments under the NAB and GAB combined cannot exceed SDR 366.5 billion. As of October 31, 2014, only the NAB has been activated with SDR 242 billion available for drawing. In addition, to bolster the IMF’s resources, 38 member countries have committed to increase IMF resources by US$461 billion (equivalent to SDR 312 billion at October 31, 2014) through bilateral borrowing agreements (the 2012 agreements). These resources are intended to serve as a second line of defense to the IMF’s quota and NAB resources and a bridge to the Fifteenth Review of Quotas. The Executive Board approved, in September 2014, a one-year extension of the 2012 borrowing agreements. As of October 31, 2014, borrowing agreements with commitments of US$407 billion (SDR 275 billion) were effective but not activated. During the six months ended October 31, 2014, borrowings and repayments of borrowings amounted to SDR 5,119 million and SDR 4,619 million, respectively (SDR 3,294 million and SDR 2,216 million, respectively, during the six months ended October 31, 2013). Total outstanding borrowings at October 31, 2014, and April 30, 2014, were SDR 47,788 million and SDR 47,288 million, respectively (see Schedule 4). Outstanding borrowings are denominated in SDRs and carry interest at the SDR interest rate, which averaged 0.071 percent per annum for the six months ended October 31, 2014 (0.07 percent per annum during the six months ended October 31, 2013). The interest expense on outstanding borrowings was SDR 17 million for the six months ended October 31, 2014, and 2013.

General Department
Notes to the consolidated financial statements
9
Scheduled repayments of outstanding borrowings are summarized below:
Financial year ending April 30
(In millions of SDRs) 2015 3,689
2016 5,661
2017 4,510
2018 5,986
2019 7,135
2020 and beyond 20,807
Total 47,788
7. Fair value measurement Fair value is the price that would be received to sell an asset or paid to transfer a liability in an orderly transaction between market participants at the measurement date. Specific valuation techniques used to value financial instruments have not changed during the period. The following tables present the fair value hierarchy used to determine the fair value of investments at October 31, 2014 and April 30, 2014:
October 31, 2014
Level 1: Level 2:
Quoted prices in active markets
Based on observable market data Total
(In millions of SDRs)
Recurring fair value measurements
International financial institutions obligations:
Medium-term instruments (BIS) — 4,859 4,859
Others — 887 887
Developed market sovereign bonds — 5,048 5,048
Developed market corporate bonds — 167 167
Emerging market bonds — 110 110
Inflation-linked bonds — 222 222
Developed market equities 275 — 275
Emerging market equities 19 35 54
Real estate investment trusts 57 — 57
Total 351 11,328 11,679
April 30, 2014
Level 1: Level 2:
Quoted prices in active markets
Based on observable market data Total
(In millions of SDRs)
Recurring fair value measurements
International financial institutions obligations:
Medium-term instruments (BIS) — 4,878 4,878
Others — 997 997
Developed market sovereign bonds — 4,889 4,889
Developed market corporate bonds — 53 53
Emerging market bonds — 36 36
Inflation-linked bonds — 71 71
Developed market equities 89 — 89
Emerging market equities — 18 18
Real estate investment trusts 18 — 18
Total 107 10,942 11,049
There have been no transfers between Level 1 and Level 2 during the period and none of the financial instruments were classified as Level 3. Investments in fixed-term deposits and short-term investments in the IA are generally of a short-term nature and are carried at amortized cost which approximates fair value. The fair value of IMF credit outstanding as defined under IFRS 13 cannot be determined due to its unique characteristics, including the debtor’s membership relationship with the IMF, and the IMF’s unique role in providing balance of payments support to member countries. The carrying value of other financial assets and liabilities that are accounted for at amortized cost represents a reasonable estimate of the fair value.
8. Remuneration The IMF pays interest, referred to as remuneration, on each member’s reserve tranche position. The rate of remuneration has been set equal to the SDR interest rate and is adjusted for burden sharing. Remuneration consisted of the following for the six months ended October 31: 2014 2013 (In millions of SDRs)
Remuneration 14 18Burden sharing adjustment (1) (1) 13 17
9. Employee benefits The IMF has a defined benefit Staff Retirement Plan (SRP) that covers eligible staff and an adjunct plan, the Supplemental Retirement Benefits Plan (SRBP), for a subset of participants of the SRP. Participants contribute seven percent of their pensionable gross remuneration and the IMF contributes the remainder of the cost of funding the Plans. In addition, the IMF provides other employment and post-retirement benefits, including medical insurance, life insurance, and other non-pension long-term benefits. For this purpose, the IMF established a separate account, the Retired Staff Benefits Investment Account (RSBIA), to hold and invest resources set aside to fund the cost of these post-retirement benefits of current and future retirees. The defined benefit obligations of the SRP, the SRBP, and other post-retirement benefits are valued annually by independent actuaries using the Projected Unit Credit Method. The latest actuarial valuations were carried out at April 30, 2014 and the net liability of the plans amounted to SDR 135 million. For the six months ended October 31, 2014 and 2013, the remeasurements of the net defined benefit obligation comprise actuarial gains and losses (the effect of changes in the discount rate, from 4.4 percent to 4.18 percent and from 4.05 percent to 4.77 percent for the respective half-years), and the return on plan assets excluding the amounts included in net interest on the net defined benefits obligation.

General Department
Notes to the consolidated financial statements
10
The fair value of the plan assets was as follows: October 31, 2014 April 30, 2014 (In millions of SDRs) Pension Plans 6,176 5,813Other employee benefits 1,321 1,233Total assets 7,497 7,046
10. Related party transactions The General Resources Account holds SDRs and accepts and uses them in operations and transactions with participants in the SDR Department. The expenses of conducting the SDR Department, the SRP, the SRBP, the RSBIA, and other accounts administered by the IMF as Trustee are paid by the GRA. Reimbursements are made annually by the SDR Department (through assessments levied on SDR Department participants), PRG Trust, Post-Catastrophe Debt Relief Trust, MDRI-I Trust, the SRP, and the RSBIA, and some, but not all, of the administered accounts.
11. Reserve distributions In the context of securing sufficient resources to subsidize concessional lending by the PRG Trust, the IMF Executive Board adopted two related decisions, in February and September 2012, to distribute to all members in proportion to their quotas amounts in the General Reserve equivalent to SDR 700 million and SDR 1.75 billion, respectively, attributable to windfall gold sales profits. The distributions became effective when satisfactory financing assurances existed regarding the availability of new subsidy contributions to the PRG Trust equivalent to at least 90 percent of the approved distribution amounts. The distributions of SDR 700 million and SDR 1.75 billion were made in October 2012 and October 2013, respectively.
12. Other administered accounts At the request of certain members, the IMF has established accounts to administer resources contributed by these members and to perform financial and technical services consistent with the purposes of the IMF. The assets of each account and each subaccount are separate from the assets of all other accounts of, or administered by, the IMF and are not to be used to discharge liabilities or to meet losses incurred in the administration of other accounts.
The total assets of these accounts were as follows:
October 31, 2014 April 30, 2014
(In millions of U.S. dollars) Administered Account Japan 131.4 131.4 Administered Account for Selected Fund Activities - Japan 1.6 1.8 Framework Administered Account for Technical Assistance Activities 8.5 9.1Framework Administered Account for Selected Fund Activities 308.9 314.2 Administered Account for Interim Holdings of Voluntary Contributions for Fund Activities —1 —1
(In millions of SDRs)
Supplementary Financing Facility Subsidy Account 0.9 0.9 Administered Account - Indonesia — 25.0 Post-SCA-2 Administered Account 41.0 40.9 SCA-1/Deferred Charges Administered Account 34.9 34.9 Administered Account People’s Bank of China 172.1 171.6 Interim Administered Account for Windfall Gold Sales Profits 38.6 38.9 Interim Administered Account for Remaining Windfall Gold Sales Profits 98.8 124.3 Post-EPCA/ENDA Interim Administered Account 1.2 1.2
¹Less than US$50,000

Schedule 1 General Department
Quotas, IMF’s holdings of currencies, reserve tranche positions and outstanding credit and loans
at October 31, 2014
(In millions of SDRs)6
11
Outstanding credit and loans General Resources Account GRA IMF’s holdings of
currencies¹ Reserve tranche position
Amount Percent² SDA³ PRG
Trust⁴ Total⁵
Member Quota Total Percent of
quota (A) + (B) + (C) = (D)
Afghanistan, Islamic Republic of 161.9 161.9 100.0 — — — — 75.8 75.8Albania 60.0 105.2 175.3 6.2 51.4 0.07 — 6.3 57.7Algeria 1,254.7 785.9 62.6 468.8 — — — — —Angola 286.3 715.9 250.1 — 429.5 0.54 — — 429.5Antigua and Barbuda 13.5 67.0 496.3 0.1 53.6 0.07 — — 53.6 Argentina 2,117.1 2,116.9 100.0 0.2 — — — — —Armenia 92.0 254.0 276.1 — 162.0 0.21 — 147.0 309.0Australia 3,236.4 2,338.9 72.3 897.9 — — — — —Austria 2,113.9 1,633.8 77.3 480.1 — — — — —Azerbaijan 160.9 160.8 99.9 0.1 — — — 1.3 1.3 Bahamas, The 130.3 124.0 95.2 6.3 — — — — —Bahrain 135.0 63.8 47.3 71.2 — — — — —Bangladesh 533.3 532.8 99.9 0.6 — — — 507.6 507.6Barbados 67.5 61.7 91.4 5.8 — — — — —Belarus 386.4 550.6 142.5 — 164.2 0.21 — — 164.2 Belgium 4,605.2 3,569.9 77.5 1,035.4 — — — — —Belize 18.8 14.6 77.7 4.2 — — — — —Benin 61.9 59.6 96.3 2.3 — — — 95.2 95.2Bhutan 6.3 5.3 84.1 1.0 — — — — —Bolivia 171.5 162.6 94.8 8.9 — — — — — Bosnia and Herzegovina 169.1 639.2 378.0 — 470.1 0.60 — — 470.1Botswana 87.8 56.5 64.4 31.3 — — — — —Brazil 4,250.5 3,501.7 82.4 748.8 — — — — —Brunei Darussalam 215.2 201.7 93.7 13.7 — — — — —Bulgaria 640.2 606.1 94.7 34.1 — — — — — Burkina Faso 60.2 52.6 87.4 7.6 — — — 138.2 138.2Burundi 77.0 76.6 99.5 0.4 — — — 90.7 90.7Cambodia 87.5 87.5 100.0 — — — — — —Cameroon 185.7 184.7 99.5 1.0 — — — 103.7 103.7Canada 6,369.2 4,481.9 70.4 1,887.3 — — — — — Cabo Verde 11.2 10.8 96.4 0.4 — — — 0.4 0.4Central African Republic 55.7 55.4 99.5 0.3 — — — 70.4 70.4Chad 66.6 63.7 95.6 2.9 — — — 13.7 13.7Chile 856.1 656.4 76.7 199.7 — — — — —China 9,525.9 9,241.5 97.0 284.4 — — — — —
Colombia 774.0 486.6 62.9 287.4 — — — — —Comoros 8.9 8.3 93.3 0.6 — — — 12.8 12.8Congo, Democratic Republic of the 533.0 533.0 100.0 — — — — 308.8 308.8Congo, Republic of 84.6 84.0 99.3 0.6 — — — 13.1 13.1Costa Rica 164.1 144.1 87.8 20.0 — — — — —
Côte d'Ivoire 325.2 324.2 99.7 1.0 — — — 654.0 654.0Croatia 365.1 364.9 99.9 0.2 — — — — —Cyprus 158.2 480.9 304.0 48.5 371.3 0.47 — — 371.3Czech Republic 1,002.2 624.8 62.3 377.4 — — — — —Denmark 1,891.4 1,463.9 77.4 427.5 — — — — —

Schedule 1 (continued) General Department
Quotas, IMF’s holdings of currencies, reserve tranche positions and outstanding credit and loans
at October 31, 2014
(In millions of SDRs)6
12
Outstanding credit and loans General Resources Account GRA IMF’s holdings of
currencies¹ Reserve tranche position
Amount Percent² SDA³ PRG
Trust⁴ Total⁵
Member Quota Total Percent of
quota (A) + (B) + (C) = (D)
Djibouti 15.9 14.8 93.1 1.1 — — — 21.5 21.5
Dominica 8.2 8.2 100.0 — — — — 6.7 6.7
Dominican Republic 218.9 602.9 275.4 — 384.0 0.49 — — 384.0
Ecuador 347.8 319.3 91.8 28.5 — — — — —
Egypt 943.7 943.7 100.0 — — — — — —
El Salvador 171.3 171.3 100.0 — — — — — —
Equatorial Guinea 52.3 47.4 90.6 4.9 — — — — —
Eritrea 15.9 15.9 100.0 — — — — — —
Estonia 93.9 79.7 84.9 14.2 — — — — —
Ethiopia 133.7 126.2 94.4 7.5 — — — 183.8 183.8
Republic of Fiji 70.3 53.8 76.5 16.6 — — — — —
Finland 1,263.8 1,000.7 79.2 263.2 — — — — —
France 10,738.5 8,376.3 78.0 2,362.3 — — — — —
Gabon 154.3 153.5 99.5 0.8 — — — — —
Gambia, The 31.1 29.6 95.2 1.5 — — — 30.1 30.1
Georgia 150.3 239.3 159.2 — 89.0 0.11 — 29.4 118.4
Germany 14,565.5 11,353.0 77.9 3,212.5 — — — — —
Ghana 369.0 368.9 100.0 0.1 — — — 424.4 424.4
Greece 1,101.8 22,469.6 2039.4 241.0 21,608.7 27.39 — — 21,608.7
Grenada 11.7 11.7 100.0 — — — — 19.0 19.0
Guatemala 210.2 210.2 100.0 — — — — — —
Guinea 107.1 107.0 99.9 0.1 — — — 119.1 119.1
Guinea-Bissau 14.2 13.9 97.9 0.3 — — — 7.2 7.2
Guyana 90.9 90.9 100.0 — — — — 9.3 9.3
Haiti 81.9 81.8 99.9 0.1 — — — 39.3 39.3
Honduras 129.5 120.9 93.4 8.6 — — — 4.1 4.1
Hungary 1,038.4 964.6 92.9 73.8 — — — — —
Iceland 117.6 610.7 519.3 18.8 511.9 0.65 — — 511.9
India 5,821.5 4,345.3 74.6 1,476.4 — — — — —
Indonesia 2,079.3 1,933.8 93.0 145.5 — — — — —
Iran, Islamic Republic of 1,497.2 1,497.2 100.0 — — — — — —
Iraq 1,188.4 1,552.1 130.6 171.1 534.8 0.68 — — 534.8
Ireland 1,257.6 20,464.8 1627.3 258.7 19,465.8 24.68 — — 19,465.8
Israel 1,061.1 689.0 64.9 372.1 — — — — —
Italy 7,882.3 6,128.0 77.7 1,754.4 — — — — —
Jamaica 273.5 751.4 274.7 — 477.9 0.61 — — 477.9
Japan 15,628.5 15,283.5 97.8 345.4 — — — — —
Jordan 170.5 1,022.6 599.8 0.4 852.5 1.08 — — 852.5
Kazakhstan 365.7 365.7 100.0 ** — — — — —
Kenya 271.4 258.1 95.1 13.3 — — — 674.2 674.2
Kiribati 5.6 5.6 100.0 ** — — — — —
Korea 3,366.4 2,723.7 80.9 642.7 — — — — —
Kosovo 59.0 132.4 224.4 14.2 87.6 0.11 — — 87.6
Kuwait 1,381.1 912.8 66.1 469.2 — — — — —
Kyrgyz Republic 88.8 88.8 100.0 ** — — — 132.7 132.7

Schedule 1 (continued) General Department
Quotas, IMF’s holdings of currencies, reserve tranche positions and outstanding credit and loans
at October 31, 2014
(In millions of SDRs)6
13
Outstanding credit and loans General Resources Account GRA IMF’s holdings of
currencies¹ Reserve tranche position
Amount Percent² SDA³ PRG
Trust⁴ Total⁵
Member Quota Total Percent of
quota (A) + (B) + (C) = (D)
Lao People's Democratic Republic 52.9 52.9 100.0 — — — — — —Latvia 142.1 142.1 100.0 0.1 — — — — —Lebanon 266.4 231.7 87.0 34.7 — — — — —Lesotho 34.9 31.1 89.1 3.8 — — — 50.6 50.6Liberia 129.2 129.2 100.0 ** — — — 103.3 103.3 Libya 1,123.7 827.9 73.7 295.8 — — — — —Lithuania 183.9 183.9 100.0 ** — — — — —Luxembourg 418.7 360.0 86.0 58.7 — — — — —Macedonia, former Yugoslav Republic of 68.9 216.7 314.5 ** 147.8 0.19 — — 147.8Madagascar 122.2 122.1 99.9 0.1 — — — 67.0 67.0 Malawi 69.4 67.0 96.5 2.4 — — — 125.2 125.2Malaysia 1,773.9 1,164.2 65.6 609.7 — — — — —Maldives 10.0 9.5 95.0 2.0 1.5 — — 2.1 3.6Mali 93.3 83.3 89.3 10.0 — — — 87.0 87.0Malta 102.0 63.7 62.5 38.3 — — — — — Marshall Islands 3.5 3.5 100.0 ** — — — — —Mauritania 64.4 64.4 100.0 ** — — — 83.4 83.4Mauritius 101.6 63.2 62.2 38.5 — — — — —Mexico 3,625.7 2,642.6 72.9 983.1 — — — — —Micronesia, Federated States of 5.1 5.1 100.0 ** — — — — — Moldova 123.2 270.7 219.7 ** 147.5 0.19 — 221.6 369.1Mongolia 51.1 56.7 111.0 0.1 5.7 0.01 — — 5.7Montenegro 27.5 20.9 76.0 6.6 — — — — —Morocco 588.2 517.7 88.0 70.5 — — — — —Mozambique 113.6 113.6 100.0 ** — — — 117.0 117.0 Myanmar 258.4 258.4 100.0 — — — — — —Namibia 136.5 136.4 99.9 0.1 — — — — —Nepal 71.3 71.3 100.0 ** — — — 50.3 50.3Netherlands 5,162.4 4,032.6 78.1 1,129.9 — — — — —New Zealand 894.6 574.8 64.3 319.8 — — — — — Nicaragua 130.0 130.0 100.0 — — — — 86.3 86.3Niger 65.8 57.2 86.9 8.6 — — — 67.9 67.9Nigeria 1,753.2 1,753.1 100.0 0.1 — — — — —Norway 1,883.7 1,551.2 82.3 332.5 — — — — —Oman 237.0 153.0 64.6 84.1 — — — — — Pakistan 1,033.7 3,005.4 290.7 0.1 1,971.8 2.50 — — 1,971.8Palau 3.1 3.1 100.0 ** — — — — —Panama 206.6 194.8 94.3 11.9 — — — — —Papua New Guinea 131.6 131.2 99.7 0.4 — — — — —Paraguay 99.9 78.4 78.5 21.5 — — — — — Peru 638.4 398.3 62.4 240.1 — — — — —Philippines 1,019.3 666.4 65.4 352.9 — — — — —Poland 1,688.4 1,259.4 74.6 429.0 — — — — —Portugal 1,029.7 23,763.9 2307.8 207.8 22,942.0 29.08 — — 22,942.0Qatar 302.6 197.9 65.4 104.7 — — — — —

Schedule 1 (continued) General Department
Quotas, IMF’s holdings of currencies, reserve tranche positions and outstanding credit and loans
at October 31, 2014
(In millions of SDRs)6
14
Outstanding credit and loans General Resources Account GRA IMF’s holdings of
currencies¹ Reserve tranche position
Amount Percent² SDA³ PRG
Trust⁴ Total⁵
Member Quota Total Percent of
quota (A) + (B) + (C) = (D)
Romania 1,030.2 2,727.1 264.7 — 1,696.9 2.15 — — 1,696.9Russian Federation 5,945.4 4,411.0 74.2 1,534.4 — — — — —Rwanda 80.1 80.1 100.0 — — — — 6.0 6.0St. Kitts and Nevis 8.9 42.3 475.3 0.1 33.5 0.04 — — 33.5St. Lucia 15.3 16.3 106.5 ** 1.0 — — 10.7 11.7 St. Vincent and the Grenadines 8.3 9.9 119.3 0.5 2.1 — — 9.1 11.2Samoa 11.6 10.9 94.0 0.7 — — — 11.6 11.6San Marino 22.4 16.9 75.4 5.5 — — — — —São Tomé and Príncipe 7.4 7.4 100.0 ** — — — 3.3 3.3Saudi Arabia 6,985.5 5,304.0 75.9 1,681.5 — — — — — Senegal 161.8 159.9 98.8 1.9 — — — 123.4 123.4Serbia 467.7 652.7 139.6 — 185.0 0.23 — — 185.0Seychelles 10.9 38.5 353.2 0.5 28.2 0.04 — — 28.2Sierra Leone 103.7 103.7 100.0 ** — — — 114.0 114.0Singapore 1,408.0 933.5 66.3 475.1 — — — — — Slovak Republic 427.5 267.8 62.6 159.7 — — — — —Slovenia 275.0 171.4 62.3 103.7 — — — — —Solomon Islands 10.4 9.9 95.2 0.6 — — — 12.7 12.7Somalia 44.2 140.5 317.9 — 96.2 0.12 8.8 — 111.5South Africa 1,868.5 1,782.8 95.4 85.7 — — — — — South Sudan 123.0 93.5 76.0 29.5 — — — — —Spain 4,023.4 3,108.1 77.3 915.3 — — — — —Sri Lanka 413.4 1,321.5 319.7 47.9 956.0 1.21 — — 956.0Sudan 169.7 341.8 201.4 ** 172.1 0.22 — — 231.3Suriname 92.1 86.0 93.4 6.1 — — — — — Swaziland 50.7 44.1 87.0 6.6 — — — — —Sweden 2,395.5 1,905.0 79.5 490.5 — — — — —Switzerland 3,458.5 3,328.9 96.3 129.7 — — — — —Syrian Arab Republic 293.6 293.6 100.0 ** — — — — —Tajikistan 87.0 87.0 100.0 ** — — — 104.4 104.4 Tanzania 198.9 188.9 95.0 10.0 — — — 296.5 296.5Thailand 1,440.5 945.0 65.6 495.5 — — — — —Timor-Leste 10.8 10.2 94.4 0.7 — — — — —Togo 73.4 72.9 99.3 0.6 — — — 87.8 87.8Tonga 6.9 5.2 75.4 1.7 — — — — — Trinidad and Tobago 335.6 211.0 62.9 124.6 — — — — —Tunisia 286.5 946.4 330.3 56.4 716.3 0.91 — — 716.3Turkey 1,455.8 1,343.0 92.3 112.8 — — — — —Turkmenistan 75.2 75.2 100.0 ** — — — — —Tuvalu 1.8 1.4 77.8 0.4 — — — — — Uganda 180.5 180.5 100.0 ** — — — 1.2 1.2Ukraine 1,372.0 5,438.4 396.4 ** 4,066.4 5.15 — — 4,066.4United Arab Emirates 752.5 479.5 63.7 273.6 — — — — —United Kingdom 10,738.5 8,368.0 77.9 2,370.7 — — — — —United States 42,122.4 32,185.9 76.4 9,934.8 — — — — —

Schedule 1 (concluded)
General Department
Quotas, IMF’s holdings of currencies, reserve tranche positions and outstanding credit and loans
at October 31, 2014
(In millions of SDRs)6
15
Components may not sum exactly to totals because of rounding. ¹ Includes nonnegotiable, non-interest-bearing notes that members are entitled to issue in substitution for currencies, and outstanding currency valuation adjustments. ² Represents the percentage of total use of GRA resources (column A). ³ Loans under Structural Adjustment Facility (SAF) previously financed by the SDA. 4 For information purposes only. The PRG Trust is not a part of the General Department. 5 Includes outstanding Trust Fund loans to Somalia (SDR 6.5 million) and Sudan (SDR 59.2 million). 6 ** Represents an amount less than SDR 50,000.
Outstanding credit and loans General Resources Account GRA IMF’s holdings of
currencies¹ Reserve tranche position
Amount Percent² SDA³ PRG
Trust⁴ Total⁵
Member Quota Total Percent of
quota (A) + (B) + (C) = (D)
Uruguay 306.5 192.2 62.7 114.3 — — — — —Uzbekistan 275.6 275.6 100.0 ** — — — — —Vanuatu 17.0 14.5 85.3 2.5 — — — — —Venezuela, República Bolivariana de 2,659.1 2,337.2 87.9 321.9 — — — — —Vietnam 460.7 460.7 100.0 ** — — — — — Yemen, Republic of 243.5 243.5 100.0 ** — — — 144.4 144.4Zambia 489.1 489.1 100.0 ** — — — 242.9 242.9Zimbabwe 353.4 353.1 99.9 0.3 — — — 64.0 64.0
Total 238,120.6 272,830.8 44,177.7 78,884.3 100.00 8.8 6,233.5 85,192.3

Schedule 2
16
General Department
Financial resources and liquidity position in the General Resources Account
(In millions of SDRs)
October 31, 2014 April 30, 2014
Usable resources
Usable currencies 156,657 153,460 SDR holdings 12,979 12,462 Available resources under borrowing arrangements1 241,713 242,768
Total usable resources2 411,349 408,690 Less: Undrawn balances under GRA arrangements 104,951 113,333 Equals: Uncommitted usable resources 306,398 295,357 Plus: Repurchases one year forward3 13,972 16,936 Less: Repayments of borrowing one year forward4 7,051 8,304 Less: Prudential balance5 39,663 39,663 Equals: One-year forward commitment capacity (FCC)6 273,656 264,326 Memorandum items Resources committed under borrowing arrangements
GAB/NAB 366,457 366,457 2012 Bilateral borrowing agreements 311,635 297,285
Quotas of members that finance IMF transactions 198,317 198,317 Liquid liabilities
Reserve tranche positions 44,178 47,374 Outstanding borrowings 47,788 47,288
¹ The available resources take into account a prudential balance set at 20 percent of amounts made available under the NAB (the activated amount of the NAB and a portion of NAB financing from prior activation periods not yet drawn). ² Usable resources consist of (1) holdings of currencies of members considered by the IMF as having balance of payments and reserve positions sufficiently strong for their currencies to be used in transfers; (2) SDR holdings; and (3) any unused amounts under credit lines that have been activated. ³ Repurchases due from member countries during the coming 12-month period. ⁴ Repayments of borrowings during the coming 12-month period, assuming that the IMF unilaterally extends the maturities of the outstanding drawings under the 2009 borrowing agreements. ⁵ Prudential balance is set at 20 percent of quotas of members whose currencies are used in the financing of IMF transactions. ⁶ The FCC does not include US$461 billion (SDR 312 billion) in bilateral commitments from members to boost the IMF resources. These resources will only be counted toward the FCC once: (1) individual bilateral agreements are effective; and (2) the associated resources are available for use by the IMF, as determined by the Executive Board.
Schedule 3
17
General Department
Status of arrangements in the General Resources Account
at October 31, 2014
(In millions of SDRs)
Member Date of arrangement Expiration Total amount agreed
Undrawn balance
Stand-By Arrangements
Bosnia and Herzegovina September 26, 2012 June 30, 2015 558 135 Georgia July 30, 2014 July 29, 2017 100 60 Jordan August 3, 2012 August 2, 2015 1,364 512 Romania September 27, 2013 September 26, 2015 1,751 1,751 Tunisia June 7, 2013 June 6, 2015 1,146 430
Ukraine April 30, 2014 April 29, 2016 10,976 8,003
Total Stand-By Arrangements 15,895 10,891
Extended Arrangements
Albania February 28, 2014 February 27, 2017 296 248 Armenia March 7, 2014 May 6, 2017 82 70 Cyprus May 15, 2013 May 14, 2016 891 520 Greece March 15, 2012 March 14, 2016 23,785 13,561 Jamaica May 1, 2013 April 30, 2017 615 301
Pakistan September 4, 2013 September 3, 2016 4,393 2,953 Seychelles June 4, 2014 June 3, 2017 12 10
Total Extended Arrangements 30,074 17,663
Precautionary and Liquidity Line Morocco July 28, 2014 July 27, 2016 3,235 3,235
Total Precautionary and Liquidity Line 3,235 3,235
Flexible Credit Line Colombia June 24, 2013 June 23, 2015 3,870 3,870 Mexico November 30, 2012 November 29, 2014 47,292 47,292 Poland January 18, 2013 January 17, 2015 22,000 22,000
Total Flexible Credit Line 73,162 73,162
Total General Resources Account 122,366 104,951

18
Outstanding borrowings
Member, Central Bank Commitment amount at October 31, 2014 at April 30, 2014
NAB commitments 1
Australia 4,370 581 545 Austria 3,579 474 481 Belgium 7,862 1,042 1,057 Brazil 8,741 1,160 1,118 Canada 7,624 971 974 Banco Central de Chile 1,360 174 183 China 31,217 3,886 3,969 Cyprus 340 35 35 Danmarks Nationalbank 3,208 411 431 Deutsche Bundesbank 25,371 3,250 3,410 Finland 2,232 296 300 France 18,657 2,475 2,507 Hong Kong Monetary Authority 340 45 46 India 8,741 1,119 1,117 Bank of Israel 500 67 68 Italy 13,578 1,728 1,825 Japan 65,953 8,649 8,160 Korea 6,583 838 886 Kuwait 341 41 44 Luxembourg 971 129 125 Malaysia 340 43 46 Mexico 4,995 662 675 Netherlands 9,044 1,201 1,192 New Zealand 624 79 84 Norway 3,871 514 496 Bangko Sentral ng Pilipinas 340 43 46 National Bank of Poland 2,530 332 340 Banco de Portugal 1,542 64 64 Russian Federation 8,741 1,139 1,178 Saudi Arabia 11,126 1,346 1,433 Singapore 1,277 170 172 South Africa 340 45 44 Spain 6,702 889 901 Sveriges Riksbank 4,440 565 543 Swiss National Bank 10,905 1,393 1,336 Thailand 340 45 46 United Kingdom 18,657 2,487 2,383 United States 69,075 9,217 8,823
366,457 Borrowing Agreements2
Central Bank of Malta 12 13 Slovak Republic 43 48 Czech National Bank 101 113 Bank of Slovenia 27 31
Total 47,788 47,288 1 In addition to the NAB, the IMF may also borrow under the GAB, and an associated agreement with Saudi Arabia, amounts up to SDR 17 billion and SDR 1.5 billion, respectively, but with maximum borrowings under the NAB and GAB of SDR 366.5 billion. At October 31, 2014, members have committed US$461 billion (SDR 312 billion) to boost IMF resources and serve as a second line of defense to the IMF’s quota and NAB resources, of which bilateral agreements totaling US$407 billion (SDR 275 billion) were signed and became effective. The latter includes agreements with Bank of Algeria, Australia, National Bank of Belgium, People’s Bank of China, Czech National Bank, Danmarks Nationalbank, Bank of Finland, France, Deutsche Bundesbank, Reserve Bank of India, Banca d’Italia, Japan, Korea, Luxembourg, Bank Negara Malaysia, Central Bank of Malta, Banco de Mexico, De Nederlandsche Bank NV, New Zealand, Norges Bank, Oesterreichische Nationalbank, Bangko Sentral ng Pilipinas, Narodowy Bank Polski, Central Bank of the Russian Federation, Saudi Arabia, Monetary Authority of Singapore, Slovak Republic, Bank of Slovenia, Spain, Sveriges Riksbank, Bank of Thailand, and Central Bank of the Republic of Turkey.2 The 2009 borrowing agreements have expired.
Schedule 4
General Department
Status of borrowings in the General Resources Account
(In millions of SDRs)

II. Financial Statements of the
SDR Department

SDR Department
Statements of financial position (In millions of SDRs)
October 31, 2014
(unaudited)
April 30, 2014
October 31, 2014
(unaudited)
April 30, 2014
Assets Liabilities
Net charges receivable 3 5 Net interest payable 3 5
Participants with holdings below allocations (Note 2) Participants with holdings above allocations (Note 2)
Allocations 127,807 128,099 SDR holdings 79,401 79,007
Less: SDR holdings 110,771 111,477 Less: allocations 76,284 75,992
Allocations in excess of holdings 17,036 16,622 Holdings in excess of allocations 3,117 3,015
Holdings by the General Resources Account 12,979 12,462
Holdings by prescribed holders 940 1,145
Total assets 17,039
16,627
Total liabilities 17,039
16,627
The accompanying notes are an integral part of these financial statements.
Andrew Tweedie /s Director, Finance Department
Christine Lagarde /s Managing Director
20

21
SDR Department
Statements of comprehensive income for the three and six months ended October 31, 2014, and 2013
(unaudited)
(In millions of SDRs)1
2014 2013 Three
months Six
months Three
months Six
months
Revenue
Net charges from participants with holdings below allocations 2 6 3 6 Assessment on SDR allocations ** 1 1 1 3 7 4 7 Expenses Interest on SDR holdings Net interest to participants with holdings above allocations ** 1 ** 1 General Resources Account 2 5 3 5 Prescribed holders ** ** ** ** 2 6 3 6 Administrative expenses ** 1 1 1 3 7 4 7 Other comprehensive income ― ― ― ― Total comprehensive income ― ― ― ―
The accompanying notes are an integral part of these financial statements. 1 ** Represents an amount less than SDR 500,000

SDR Department
Notes to the financial statements
22
1. Basis of preparation
The unaudited financial statements of the SDR Department are prepared in accordance with International Accounting Standard 34 (Interim Financial Reporting) issued by the International Accounting Standards Board (IASB). These financial statements do not include all information and notes required by International Financial Reporting Standards (IFRS) for complete financial statements and should be read in conjunction with the April 30, 2014 financial statements and the notes included therein. The SDR Department holds no cash or cash equivalents. Cash flows arising from operating activities are limited to the receipt of charges and assessments and payment of interest. A Statement of Cash Flows is not presented as it does not provide additional information beyond what is already contained in the Statement of Comprehensive Income. Receipts and uses of SDRs are shown in Schedule 1.
1.1 Unit of account The financial statements are presented in SDRs, which is the SDR Department’s unit of account. At October 31, 2014, one SDR was equal to US$1.47833 (US$1.54969 at April 30, 2014). 1.2 SDR interest rate, interest and charges
Interest is paid on holdings of SDRs and charges are levied on each participant’s net cumulative allocations plus any negative balance of the participant or unpaid charges at the SDR interest rate. The SDR interest rate is set equal to the combined market interest rate, which is a weighted average of yields or rates on short-term instruments in the money markets of the Euro area (three-month Eurepo rate), Japan (three-month Treasury Discount Bills), the United Kingdom (three-month Treasury Bills), and the United States (three-month Treasury Bills). The SDR interest rate is determined weekly and enters into effect on the following Monday. Beginning October 27, 2014, the SDR interest rate is subject to a floor of 0.05 percent and is rounded to three decimal places. The average SDR interest rate was 0.052 and 0.071 percent for the three and six months ended October 31, 2014 (0.07 percent for the three and six months ended October 31, 2013). 2. Allocations and holdings
At October 31 and April 30, 2014, cumulative allocations to participants totaled SDR 204.1 billion. Participants with holdings below their allocations have used part of their allocations, resulting in a net obligation to the SDR Department presented as an asset on the Statements of Financial Position. Participants with holdings in excess of their allocations have established a net claim on the SDR Department, which is presented in the Statements of Financial Position as a liability.
Participants’ net SDR positions at October 31 and April 30, 2014, were as follows:
October 31, 2014 April 30, 2014
Below Above Below Above allocations allocations Total allocations allocations Total
(In millions of SDRs) Cumulative allocations 127,807 76,284 204,091 128,099 75,992 204,091 Holdings of SDRs 110,771 79,401 190,172 111,477 79,007 190,484 Net SDR positions
17,036 (3,117) 13,919 16,622 (3,015) 13,607
A summary of SDR holdings at October 31 and April 30, 2014 is provided below:
October 31, 2014 April 30, 2014
(In millions of SDRs) Participants 190,172 190,484 General Resources Account 12,979 12,462 Prescribed holders 940 1,145
Total holdings 204,091 204,091 In accordance with the provision of the Fourth Amendment of the IMF’s Articles of Agreement, SDRs are held in escrow on behalf of participants with overdue obligations to the General Department and the Poverty Reduction and Growth Trust (PRG Trust). At October 31 and April 30, 2014, SDR 86.7 million was held in escrow for Somalia (SDR 4.2 million), Sudan (SDR 16.1 million), and Zimbabwe (SDR 66.4 million). These amounts would be released to the participants upon the settlement of all overdue obligations, and their allocations and holdings adjusted accordingly.
3. Overdue charges and assessments
At October 31 and April 30, 2014, no participant was overdue in meeting its financial obligations to the SDR Department.
4. Related party transactions and administrative expenses The General Resources Account (GRA) is a holder of SDRs and conducts operations and transactions with the SDR Department participants. The GRA’s holdings of SDRs amounted to SDR 13.0 billion at October 31, 2014 (SDR 12.5 billion at April 30, 2014). The expenses of conducting the business of the SDR Department are paid by the IMF from the General Resources Account, which is reimbursed by the SDR Department. For this purpose, the SDR Department levies an assessment on all participants in proportion to their cumulative allocations at the end of each financial year.

Schedule 1
23
Ending balances include rounding differences. ¹ ** Represents an amount less than SDR 500,000.
SDR Department
Statements of changes in SDR holdings
for the six months ended October 31, 2014, and 2013 (In millions of SDR)1
Participants
General Resources
Account Prescribed
holders
Total 2014 2013
Total holdings, beginning of the period 190,484 12,462 1,145 204,091 204,091
Receipts of SDRs Transfers among participants and prescribed holders Transactions by agreement 1,121 - 67 1,188 2,103 Settlement of financial obligations - - 54 54 1 IMF-related operations PRG Trust lending-related transactions 278 - 172 450 395 PRG Trust borrowing-related transactions 51 - 280 331 313 Contributions to PRG Trust - - - - 1,037 Contributions to and deposits in Administered Accounts - - - - 128
Other operations ** - - ** ** Net interest on SDRs 1 - 1 2 1 Transfers between participants and the GRA
Acquisitions in exchange for currencies of other members 1,167 - - 1,167 983 Purchases 191 - - 191 148
Repurchases - 656 - 656 855 GRA charges - 1,276 - 1,276 1,191 Remuneration 22 - - 22 19 Interest on borrowings 25 - - 25 18 Refunds 17 - - 17 15 Distributions - - - - 1,748 Interest on SDRs - 7 - 7 5 Total receipts 2,873 1,939 574 5,386 8,960
Uses of SDRs Transfers among participants and prescribed holders
Transactions by agreement 738 - 450 1,188 2,103 Settlement of financial obligations 54 - - 54 1 IMF-related operations
PRG Trust lending-related transactions 172 - 278 450 395 PRG Trust borrowing-related transactions 280 - 51 331 313
Contributions to PRG Trust - - - - 1,037 Contributions to and deposits in Administered Accounts - - - - 128
Other operations ** - ** ** ** Transfers between participants and the GRA
Acquisitions in exchange for currencies of other members - 1,167 - 1,167 983 Purchases - 191 - 191 148 Repurchases 656 - - 656 855 GRA charges 1,276 - - 1,276 1,191 Remuneration - 22 - 22 19 Interest on borrowings - 25 - 25 18 Refunds - 17 - 17 15 Distributions - - - - 1,748
Net SDR charges paid 9 - - 9 6 Total uses 3,185 1,422 779 5,386 8,960 Total holdings, end of the period 190,172 12,979 940 204,091 204,091
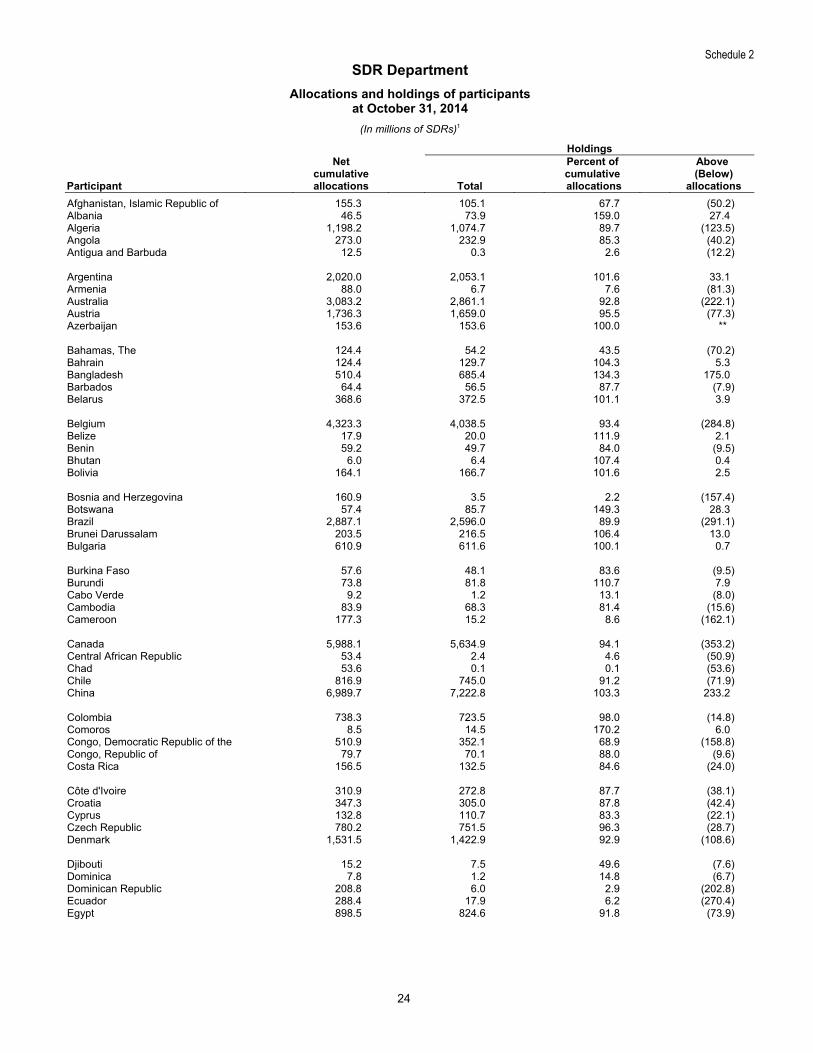
Schedule 2
SDR Department
Allocations and holdings of participants at October 31, 2014
(In millions of SDRs)1
Holdings
Participant
Net cumulative allocations Total
Percent of cumulative allocations
Above (Below)
allocations
24
Afghanistan, Islamic Republic of 155.3 105.1 67.7 (50.2) Albania 46.5 73.9 159.0 27.4 Algeria 1,198.2 1,074.7 89.7 (123.5) Angola 273.0 232.9 85.3 (40.2) Antigua and Barbuda 12.5 0.3 2.6 (12.2) Argentina 2,020.0 2,053.1 101.6 33.1 Armenia 88.0 6.7 7.6 (81.3) Australia 3,083.2 2,861.1 92.8 (222.1) Austria 1,736.3 1,659.0 95.5 (77.3) Azerbaijan 153.6 153.6 100.0 ** Bahamas, The 124.4 54.2 43.5 (70.2) Bahrain 124.4 129.7 104.3 5.3 Bangladesh 510.4 685.4 134.3 175.0 Barbados 64.4 56.5 87.7 (7.9) Belarus 368.6 372.5 101.1 3.9 Belgium 4,323.3 4,038.5 93.4 (284.8) Belize 17.9 20.0 111.9 2.1 Benin 59.2 49.7 84.0 (9.5) Bhutan 6.0 6.4 107.4 0.4 Bolivia 164.1 166.7 101.6 2.5 Bosnia and Herzegovina 160.9 3.5 2.2 (157.4) Botswana 57.4 85.7 149.3 28.3 Brazil 2,887.1 2,596.0 89.9 (291.1) Brunei Darussalam 203.5 216.5 106.4 13.0 Bulgaria 610.9 611.6 100.1 0.7 Burkina Faso 57.6 48.1 83.6 (9.5) Burundi 73.8 81.8 110.7 7.9 Cabo Verde 9.2 1.2 13.1 (8.0) Cambodia 83.9 68.3 81.4 (15.6) Cameroon 177.3 15.2 8.6 (162.1) Canada 5,988.1 5,634.9 94.1 (353.2) Central African Republic 53.4 2.4 4.6 (50.9) Chad 53.6 0.1 0.1 (53.6) Chile 816.9 745.0 91.2 (71.9) China 6,989.7 7,222.8 103.3 233.2 Colombia 738.3 723.5 98.0 (14.8) Comoros 8.5 14.5 170.2 6.0 Congo, Democratic Republic of the 510.9 352.1 68.9 (158.8) Congo, Republic of 79.7 70.1 88.0 (9.6) Costa Rica 156.5 132.5 84.6 (24.0) Côte d'Ivoire 310.9 272.8 87.7 (38.1) Croatia 347.3 305.0 87.8 (42.4) Cyprus 132.8 110.7 83.3 (22.1) Czech Republic 780.2 751.5 96.3 (28.7) Denmark 1,531.5 1,422.9 92.9 (108.6) Djibouti 15.2 7.5 49.6 (7.6) Dominica 7.8 1.2 14.8 (6.7) Dominican Republic 208.8 6.0 2.9 (202.8) Ecuador 288.4 17.9 6.2 (270.4) Egypt 898.5 824.6 91.8 (73.9)

Schedule 2 (continued) SDR Department
Allocations and holdings of participants at October 31, 2014
(In millions of SDRs)
Holdings
Participant
Net cumulative allocations Total
Percent of cumulative allocations
Above (Below)
allocations
25
El Salvador 163.8 165.6 101.1 1.8 Equatorial Guinea 31.3 21.2 67.6 (10.1) Eritrea 15.2 3.7 24.5 (11.5) Estonia 62.0 62.0 100.1 0.1 Ethiopia 127.9 93.8 73.4 (34.1) Republic of Fiji 67.1 51.1 76.1 (16.0) Finland 1,189.5 1,126.0 94.7 (63.5) France 10,134.2 9,319.9 92.0 (814.4) Gabon 146.7 132.8 90.5 (13.9) Gambia, The 29.8 21.2 71.4 (8.5) Georgia 144.0 144.2 100.2 0.3 Germany 12,059.2 11,966.0 99.2 (93.2) Ghana 353.9 222.2 62.8 (131.7) Greece 782.4 554.0 70.8 (228.4) Grenada 11.2 8.7 77.9 (2.5) Guatemala 200.9 175.6 87.4 (25.3) Guinea 102.5 160.3 156.5 57.8 Guinea-Bissau 13.6 12.4 91.0 (1.2) Guyana 87.1 0.6 0.7 (86.5) Haiti 78.5 68.8 87.6 (9.7) Honduras 123.8 88.2 71.2 (35.7) Hungary 991.1 13.0 1.3 (978.1) Iceland 112.2 8.0 7.1 (104.2) India 3,978.3 2,888.6 72.6 (1,089.7) Indonesia 1,980.4 1,761.1 88.9 (219.3) Iran, Islamic Republic of 1,426.1 1,552.0 108.8 125.9 Iraq 1,134.5 577.5 50.9 (557.0) Ireland 775.4 650.7 83.9 (124.7) Israel 883.4 835.9 94.6 (47.4) Italy 6,576.1 6,129.0 93.2 (447.1) Jamaica 261.6 187.2 71.5 (74.4) Japan 12,285.0 13,041.1 106.2 756.1 Jordan 162.1 127.7 78.8 (34.4) Kazakhstan 343.7 348.3 101.4 4.7 Kenya 259.6 21.3 8.2 (238.3) Kiribati 5.3 5.4 101.3 0.1 Korea 2,404.4 2,267.3 94.3 (137.1) Kosovo 55.4 52.6 95.0 (2.8) Kuwait 1,315.6 1,446.9 110.0 131.3 Kyrgyz Republic 84.7 129.7 153.0 44.9 Lao People's Democratic Republic 50.7 51.1 100.8 0.4 Latvia 120.8 120.8 100.0 ** Lebanon 193.3 192.3 99.5 (1.0) Lesotho 32.9 46.5 141.4 13.6 Liberia 124.0 179.9 145.1 55.9 Libya 1,072.7 1,623.1 151.3 550.4 Lithuania 137.2 137.3 100.0 0.1 Luxembourg 246.6 244.4 99.1 (2.2) Macedonia, former Yugoslav Republic of 65.6 4.0 6.1 (61.6) Madagascar 117.1 70.8 60.5 (46.3)

Schedule 2 (continued)
SDR Department
Allocations and holdings of participants at October 31, 2014
(In millions of SDRs)
Holdings
Participant
Net cumulative allocations Total
Percent of cumulative allocations
Above (Below)
allocations
26
Malawi 66.4 2.6 4.0 (63.7) Malaysia 1,346.1 1,286.6 95.6 (59.6) Maldives 7.7 6.8 88.2 (0.9) Mali 89.4 73.4 82.1 (16.0) Malta 95.4 67.5 70.8 (27.9) Marshall Islands 3.3 3.4 101.1 ** Mauritania 61.7 0.7 1.2 (60.9) Mauritius 96.8 100.0 103.3 3.2 Mexico 2,851.2 2,690.4 94.4 (160.8) Micronesia, Federated States of 4.8 6.2 129.6 1.4 Moldova 117.7 2.6 2.2 (115.1) Mongolia 48.8 43.0 88.1 (5.8) Montenegro 25.8 26.3 102.0 0.5 Morocco 561.4 558.4 99.5 (3.0) Mozambique 108.8 102.3 94.0 (6.5) Myanmar 245.8 1.9 0.8 (243.8) Namibia 130.4 4.9 3.8 (125.5) Nepal 68.1 36.9 54.1 (31.2) Netherlands 4,836.6 4,569.6 94.5 (267.0) New Zealand 853.8 925.8 108.4 72.0 Nicaragua 124.5 120.3 96.6 (4.2) Niger 62.9 54.3 86.2 (8.7) Nigeria 1,675.4 1,675.1 100.0 (0.2) Norway 1,563.1 1,482.3 94.8 (80.8) Oman 178.8 175.3 98.0 (3.5) Pakistan 988.6 528.0 53.4 (460.5) Palau 3.0 3.0 101.1 ** Panama 197.0 170.8 86.7 (26.2) Papua New Guinea 125.5 9.2 7.4 (116.3) Paraguay 95.2 110.7 116.2 15.5 Peru 609.9 531.2 87.1 (78.7) Philippines 838.0 846.3 101.0 8.3 Poland 1,304.6 987.2 75.7 (317.5) Portugal 806.5 792.7 98.3 (13.8) Qatar 251.4 271.2 107.9 19.8 Romania 984.8 19.1 1.9 (965.7) Russian Federation 5,671.8 5,690.9 100.3 19.1 Rwanda 76.8 79.9 104.0 3.0 St. Kitts and Nevis 8.5 6.2 72.5 (2.3) St. Lucia 14.6 15.4 105.8 0.8 St. Vincent and the Grenadines 7.9 0.8 9.7 (7.1) Samoa 11.1 12.6 114.0 1.6 San Marino 15.5 15.5 99.5 (0.1) São Tomé and Príncipe 7.1 0.2 3.5 (6.8) Saudi Arabia 6,682.5 6,265.9 93.8 (416.6) Senegal 154.8 130.1 84.1 (24.7) Serbia 445.0 66.4 14.9 (378.7) Seychelles 8.3 5.9 71.0 (2.4) Sierra Leone 99.5 112.2 112.7 12.7 Singapore 744.2 873.9 117.4 129.7

Schedule 2 (concluded) SDR Department
Allocations and holdings of participants at October 31, 2014
(In millions of SDRs)
Holdings
Participant
Net cumulative allocations Total
Percent of cumulative allocations
Above (Below)
allocations
27
Slovak Republic 340.5 323.0 94.9 (17.4) Slovenia 215.9 207.0 95.9 (8.9) Solomon Islands 9.9 9.2 92.9 (0.7) Somalia 46.5 18.3 39.4 (28.2) South Africa 1,785.4 1,788.2 100.2 2.8 South Sudan 105.4 77.1 73.2 (28.3) Spain 2,827.6 2,690.0 95.1 (137.5) Sri Lanka 395.5 9.0 2.3 (386.4) Sudan 178.0 125.2 70.4 (52.8) Suriname 88.1 81.3 92.3 (6.8) Swaziland 48.3 48.7 100.9 0.5 Sweden 2,249.0 2,099.3 93.3 (149.6) Switzerland 3,288.0 3,065.2 93.2 (222.8) Syrian Arab Republic 279.2 282.2 101.1 3.0 Tajikistan 82.1 69.7 84.9 (12.4) Tanzania 190.5 150.2 78.8 (40.3) Thailand 970.3 974.5 100.4 4.3 Timor-Leste 7.7 7.1 91.9 (0.6) Togo 70.3 59.3 84.3 (11.1) Tonga 6.6 7.1 107.7 0.5 Trinidad and Tobago 321.1 275.8 85.9 (45.4) Tunisia 272.8 193.9 71.1 (78.9) Turkey 1,071.3 966.2 90.2 (105.2) Turkmenistan 69.8 69.8 100.0 ** Tuvalu 1.7 1.3 74.7 (0.4) Uganda 173.1 48.5 28.1 (124.5) Ukraine 1,309.4 13.7 1.0 (1,295.7) United Arab Emirates 568.4 542.4 95.4 (26.0) United Kingdom 10,134.2 9,632.1 95.0 (502.1) United States 35,315.7 35,848.5 101.5 532.8 Uruguay 293.3 245.7 83.8 (47.5) Uzbekistan 262.8 266.1 101.3 3.3 Vanuatu 16.3 1.5 9.3 (14.8) Venezuela, República Bolivariana de 2,543.3 2,258.6 88.8 (284.7) Vietnam 314.8 268.0 85.1 (46.8) Yemen, Republic of 232.3 162.0 69.8 (70.2) Zambia 469.1 373.8 79.7 (95.3) Zimbabwe 272.2 92.8 34.1 (179.4) Above allocation 76,284.4 79,401.5 104.1 3,117.1 Below allocation 127,806.3 110,770.6 86.7 (17,035.7) Total participants 204,090.7 190,172.1 Participants’ holdings held in escrow 86.7 86.7 General Resources Account — 12,978.9 Prescribed holders — 939.7 204,177.4 204,177.4
Totals may not add up due to rounding. 1 ** Represents an amount less than SDR 50,000.

III. Financial Statements of the Concessional Lending and Debt Relief Trusts

29
Concessional Lending and Debt Relief Trusts
Statements of financial position
(In millions of SDRs)
PRG Trust
PRG-HIPC Trust and Related Umbrella
Account MDRI-II Trust PCDR Trust and Related
Umbrella Account
October 31, 2014
(unaudited) April 30,
2014
October 31, 2014
(unaudited) April 30,
2014
October 31, 2014
(unaudited) April 30,
2014
October 31, 2014
(unaudited) April 30,
2014
Assets
Cash and cash equivalents 218 173 17 17 — — — —
Interest receivable 17 17 — — — — — —
Investments (Note 2) 7,237 7,184 400 402 39 39 102 102
Loans receivable (Note 3) 6,233 6,031 — — — — — —
Total assets 13.705 13,405 417 419 39 39 102 102
Liabilities and resources
Interest payable and other liabilities 44 21 — — — — — — Borrowings (Note 4) 6.347 6,138 176 179 — — — —
Total liabilities 6,391 6,159 176 179 — — — — Resources 7,314 7,246 241 240 39 39 102 102
Total liabilities and resources 13,705 13,405 417 419 39 39 102 102
The accompanying notes are an integral part of these financial statements.
Andrew Tweedie /s Director, Finance Department
Christine Lagarde /s Managing Director
Concessional Lending and Debt Relief Trusts
Statements of comprehensive income and changes in resources for the three and six months ended October 31, 2014, and 2013
(unaudited)
(In millions of SDRs)
PRG Trust
PRG-HIPC Trust and Related Umbrella
Account MDRI-II Trust
PCDR Trust and Related Umbrella
Account 2014 2013 2014 2013 2014 2013 2014 2013
Three
months Six
months Three
months Six
monthsThree
monthsSix
monthsThree
monthsSix
monthsThree
monthsSix
monthsThree
months Six
months Three
monthsSix
monthsThree
monthsSix
months
Resources, beginning of period 7,268 7,246 5,851 5,860 240 240 239 239 39 39 39 39 102 102 102 102
Investment income (Note 2) 19 21 9 3 1 1 — — — — — — — — — —
Interest income on loans (Note 3) — — — — — — — — — — — — — — — —
Contributions (Note 6) 43 78 1,174 1,175 — — — — — — — — — — — —
Interest expense (3) (6) (3) (6) — — — — — — — — — — — —
Administrative expenses (Note 7) (12) (24) — — — — — — — — — — — — — —
Other expenses (1) (1) (1) (2) — — — — — — — — — — — —
Net income 46 68 1,179 1,170 1 1 — — — — — — — — — —
Other comprehensive income — — — — — — — — — — — — — — — —
Total comprehensive income /changes in resources 46 68 1,179 1,170 1 1 — — — — — — — — — —
Resources, end of period 7,314 7,314 7.030 7,030 241 241 239 239 39 39 39 39 102 102 102 102
The accompanying notes are an integral part of these financial statements.

30
Concessional Lending and Debt Relief Trusts
Statements of cash flows for the six months ended October 31, 2014, and 2013
(unaudited)
(In millions of SDRs)
PRG Trust
PRG-HIPC Trust and Related
Umbrella Account MDRI-II Trust
PCDR Trust and Related Umbrella
Account 2014 2013 2014 2013 2014 2013 2014 2013
Cash flows from operating activities
Total comprehensive income 68 1,170 1 — — — — —Adjustments to reconcile total comprehensive income to cash generated by operations
Investment income (21) (3) (1) — — — — —
Interest expense 6 6 — — — — — —
Loan disbursements (392) (273) — — — — — —
Loan repayments 190 196 — — — — — —
Interest received 21 21 1 2 — — — —
Interest paid (7) (7) — — — — — —
Change in other liabilities 24 — — — — — — —Net cash (used in)/provided by operating activities (111) 1,110 1 2 — — — —
Cash flows from investment activities
Net (acquisition)/disposition of investments (53) 24 2 (5) — (30) — 52Net cash (used in)/provided by investment activities (53) 24 2 (5) — (30) — 52
Cash flows from financing activities
Borrowings 446 276 — — — — — —
Repayments of borrowings (237) (213) (3) (10) — — — —Net cash provided by/(used in) financing activities 209 63 (3) (10) — — — —
Net increase/(decrease) in cash and cash equivalents 45 1,197 — (13) — (30) — 52
Cash and cash equivalents, beginning of year 173 315 17 30 — 30 — —
Cash and cash equivalents, end of period 218 1,512 17 17 — — — 52
The accompanying notes are an integral part of these financial statements.
Concessional Lending and Debt Relief Trusts Notes to the financial statements
31
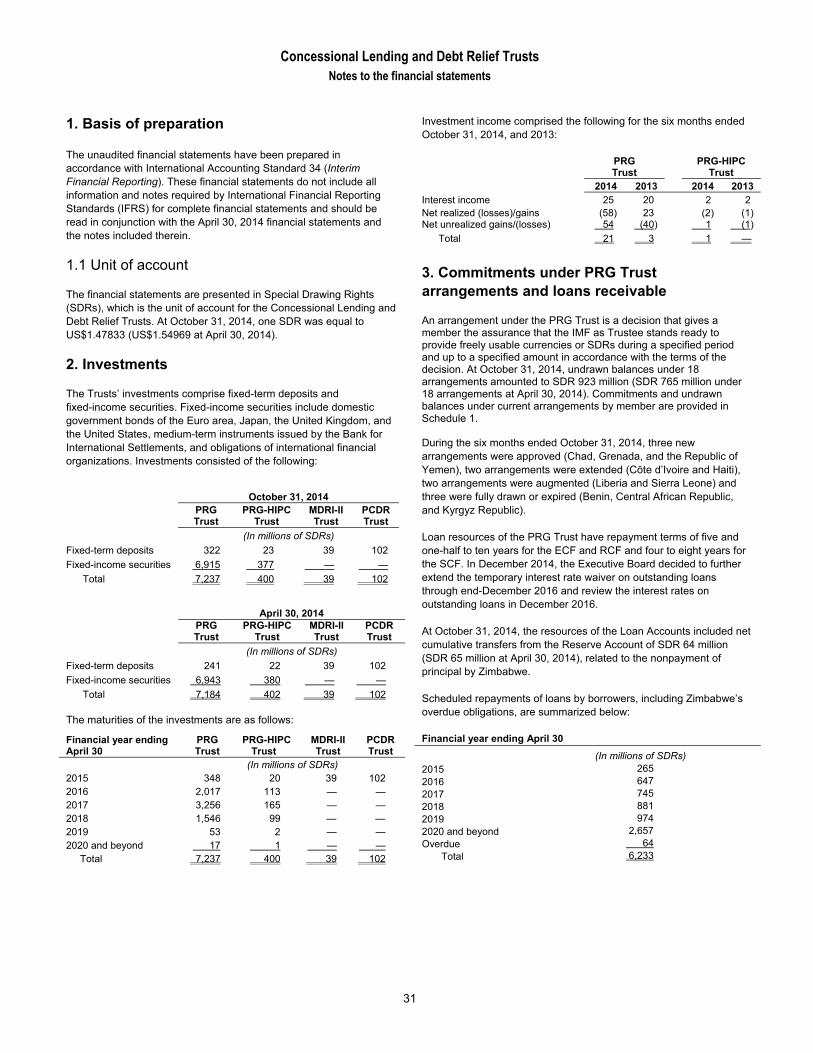
1. Basis of preparation The unaudited financial statements have been prepared in accordance with International Accounting Standard 34 (Interim Financial Reporting). These financial statements do not include all information and notes required by International Financial Reporting Standards (IFRS) for complete financial statements and should be read in conjunction with the April 30, 2014 financial statements and the notes included therein.
1.1 Unit of account The financial statements are presented in Special Drawing Rights (SDRs), which is the unit of account for the Concessional Lending and Debt Relief Trusts. At October 31, 2014, one SDR was equal to US$1.47833 (US$1.54969 at April 30, 2014).
2. Investments The Trusts’ investments comprise fixed-term deposits and fixed-income securities. Fixed-income securities include domestic government bonds of the Euro area, Japan, the United Kingdom, and the United States, medium-term instruments issued by the Bank for International Settlements, and obligations of international financial organizations. Investments consisted of the following:
October 31, 2014 PRG Trust
PRG-HIPC Trust
MDRI-II Trust
PCDR Trust
(In millions of SDRs) Fixed-term deposits 322 23 39 102
Fixed-income securities 6,915 377 — —
Total 7,237 400 39 102
April 30, 2014 PRG Trust
PRG-HIPC Trust
MDRI-IITrust
PCDRTrust
(In millions of SDRs) Fixed-term deposits 241 22 39 102
Fixed-income securities 6,943 380 — —
Total 7,184 402 39 102 The maturities of the investments are as follows:
Financial year ending April 30
PRG Trust
PRG-HIPC Trust
MDRI-II Trust
PCDR Trust
(In millions of SDRs) 2015 348 20 39 102 2016 2,017 113 — — 2017 3,256 165 — — 2018 1,546 99 — — 2019 53 2 — — 2020 and beyond 17 1 — — Total 7,237 400 39 102
Investment income comprised the following for the six months ended October 31, 2014, and 2013:
PRG Trust
PRG-HIPC Trust
2014 2013 2014 2013 Interest income 25 20 2 2 Net realized (losses)/gains (58) 23 (2) (1) Net unrealized gains/(losses) 54 (40) 1 (1)
Total 21 3 1 —
3. Commitments under PRG Trust arrangements and loans receivable An arrangement under the PRG Trust is a decision that gives a member the assurance that the IMF as Trustee stands ready to provide freely usable currencies or SDRs during a specified period and up to a specified amount in accordance with the terms of the decision. At October 31, 2014, undrawn balances under 18 arrangements amounted to SDR 923 million (SDR 765 million under 18 arrangements at April 30, 2014). Commitments and undrawn balances under current arrangements by member are provided in Schedule 1. During the six months ended October 31, 2014, three new arrangements were approved (Chad, Grenada, and the Republic of Yemen), two arrangements were extended (Cȏte d’Ivoire and Haiti), two arrangements were augmented (Liberia and Sierra Leone) and three were fully drawn or expired (Benin, Central African Republic, and Kyrgyz Republic). Loan resources of the PRG Trust have repayment terms of five and one-half to ten years for the ECF and RCF and four to eight years for the SCF. In December 2014, the Executive Board decided to further extend the temporary interest rate waiver on outstanding loans through end-December 2016 and review the interest rates on outstanding loans in December 2016. At October 31, 2014, the resources of the Loan Accounts included net cumulative transfers from the Reserve Account of SDR 64 million (SDR 65 million at April 30, 2014), related to the nonpayment of principal by Zimbabwe. Scheduled repayments of loans by borrowers, including Zimbabwe’s overdue obligations, are summarized below: Financial year ending April 30
(In millions of SDRs) 2015 265 2016 647 2017 745 2018 881 2019 974 2020 and beyond 2,657 Overdue 64 Total 6,233

Concessional Lending and Debt Relief Trusts Notes to the financial statements
32
The use of credit in the PRG Trust by the largest users was as follows:
October 31, 2014 April 30, 2014 (In millions of SDRs and percent
of total PRG Trust credit outstanding)
Largest user of credit 674 10.8% 687 11.4% Three largest users of credit 1,836 29.5% 1,734 28.8% Five largest users of credit 2,569 41.2% 2,478 41.1%
The five largest users of credit at October 31 and April 30, 2014, in descending order, were Kenya, Cȏte d’Ivoire, Bangladesh, Ghana, and Democratic Republic of the Congo. The concentration of PRG Trust outstanding credit by region was as follows:
October 31, 2014 April 30, 2014
(In millions of SDRs and percent of total PRG Trust credit outstanding)
Africa 4,497 72.1% 4,350 72.1% Asia and Pacific 584 9.4% 519 8.6% Europe 228 3.7% 239 4.0% Middle East and Central Asia 740 11.9% 728 12.1% Western Hemisphere 184 2.9% 195 3.2%
Total 6,233 100% 6,031 100%
4. Borrowings The weighted average interest rate on PRG Trust borrowings was 0.20 percent and 0.21 for the six months ended October 31, 2014 and 2013, respectively. During the same periods, interest rates on PRG-HIPC Trust borrowings averaged 0.01 percent and 0.03 percent, respectively. Scheduled repayments of borrowings are summarized below:
Financial year ending April 30 PRG Trust PRG-HIPC
Trust
(In millions of SDRs)
2015 1,385 —
2016 1,172 —
2017 747 —
2018 861 —
2019 726 121
2020 and beyond 1,456 55
Total 6,347 176
The undrawn balances of the PRG Trust borrowing agreements amounted to SDR 7,264 million and SDR 17 million for the Loan Accounts, and Subsidy Accounts, respectively as of October 31, 2014 (SDR 7,656 million and SDR 20 million respectively as of April 30, 2014).
5. Fair value measurement At October 31, 2014 and April 30, 2014, the Trusts’ investments in fixed-income securities (see Note 2) were categorized as Level 2 based on the fair value hierarchy (there were no Level 1 or Level 3 securities).
Investments in fixed-term deposits are generally of a short-term nature and are carried at amortized cost which approximates fair value. The fair value of PRG Trust loans receivable as defined under IFRS 13 cannot be determined due to their unique characteristics, including the debtor’s membership relationship with the IMF, the Trustee, and the Trust’s unique role in providing balance of payments support to member countries. The carrying value of other assets and liabilities accounted for at amortized cost represents a reasonable estimate of the fair value.
6. Contributions Contributions to the PRG Trust Subsidy Accounts amounted to SDR 78 million and SDR 1,175 million for the six months ended October 31, 2014, and 2013, respectively. These contributions include voluntary contributions made by IMF members following the distributions from the IMF’s General Reserve of SDR 0.7 billion and SDR 1.75 billion in October 2012 and 2013, respectively, attributable to windfall gold sales profits. Cumulative contributions related to the distributions of the IMF’s General Reserve amounted to SDR 0.6 billion for the first distribution and SDR 1.4 billion for the second distribution at October 31, 2014 (see Schedule 2).
7. Related party transactions The expenses of conducting the business of the Trusts were paid by the General Resources Account (GRA) of the IMF. For the financial year ended April 30, 2014, the PRG and PCDR Trusts made reimbursements of SDR 48 million and SDR 0.01 million, respectively, to the GRA. To meet the financing needs of low income countries, the IMF has mobilized resources from various sources. In addition to bilateral contributions from member countries, the IMF also made contributions, via the Special Disbursement Account, to the PRG, PRG-HIPC, and PCDR Trusts. Cumulative contributions from the IMF as of October 31, 2014 and 2013 were as follows:
(In millions of SDRs)
PRG Trust Reserve Account 2,697PRG Trust Subsidy Accounts 1,018PRG-HIPC Trust 1,239PCDR Trust 280 Total 5,234
8. Combining statements of financial position and statements of comprehensive income and changes in resources The statements of financial position and statements of comprehensive income and changes in resources of the PRG Trust, PRG-HIPC Trust, and the PCDR Trust (including the Umbrella Accounts) are as follows:

Note 8 (continued)
33
Concessional Lending and Debt Relief Trusts
Combining statements of financial position
(In millions of SDRs)1
PRG Trust PRG-HIPC Trust and Related Umbrella Account PCDR Trust and Related Umbrella Account October 31, 2014
(unaudited) April 30,
2014 October 31, 2014
(unaudited) April 30,
2014 October 31, 2014
(unaudited) April 30,
2014
Loan Accounts
Reserve Account
Subsidy Accounts Total Total
PRG-HIPC Trust
Account
Umbrella Account for HIPC
Operations Total Total
PCDR Trust
Account
Umbrella Account for PCDR
Operations Total Total Assets
Cash and cash equivalents ** 112 106 218 173 17 ** 17 17 ** — ** ** Interest receivable 17 ** ** 17 17 ** — ** ** ** — ** ** Investments — 3,688 3,549 7,237 7,184 400 — 400 402 102 — 102 102
Loans receivable 6,233 — — 6,233 6,031 — — — — — — — —
Accrued account transfers (80) 91 (11) — — — — — — — — — —
Total assets 6,170 3,891 3,644 13,705 13,405 417 ** 417 419 102 — 102 102
Liabilities and resources
Interest payable and other liabilities 20 24 ** 44 21 ** — ** ** ** — ** —
Borrowings 6,086 — 261 6,347 6,138 176 — 176 179 — — — —
Total liabilities 6,106 24 261 6,391 6,159 176 — 176 179 ** — ** —
Resources 64 3,867 3,383 7,314 7,246 241 ** 241 240 102 — 102 102
Total liabilities and resources 6,170 3,891 3,644 13,705 13,405 417 ** 417 419 102 — 102 102
1 ** Represents an amount less than SDR 500,000

Note 8 (concluded)
34
Concessional Lending and Debt Relief Trusts
Combining statements of comprehensive income and changes in resources for the six months ended October 31, 2014, and 2013
(unaudited)
(In millions of SDRs)1
PRG Trust PRG-HIPC Trust and Related Umbrella Account PCDR Trust and Related Umbrella Account 2014 2013 2014 2013 2014 2013
Loan
Accounts Reserve Account
Subsidy Accounts Total Total
PRG-HIPC Trust
Account
Umbrella Account for HIPC
Operations Total Total
PCDR Trust
Account
Umbrella Account for PCDR
Operations Total Total Resources, beginning of year 65 3,880 3,301 7,246 5,860 240 ** 240 239 102 — 102 102
Investment income — 10 11 21 3 1 — 1 ** ** — ** **
Interest income on loans — — — — — — — — — — — — —.
Contributions — — 78 78 1,175 ** — ** ** — — — —.
Interest expense (6) — ** (6) (6) ** — ** ** — — — —.
Administrative expenses — (24) — (24) — — — — — ** — ** **
Other expenses ** ** (1) (1) (2) ** — ** ** — — — —.
Transfers between:
Loan and Reserve Accounts (1) 1 — — — — — — — — — — —
Loan and Subsidy Accounts 6 — (6) — — — — — — — — — —
Net (loss) income (1) (13) 82 68 1,170 1 — 1 ** ** — ** **
Other comprehensive income — — — — — — — — — — — — —
Total comprehensive (loss)
income/changes in resources (1) (13) 82 68 1,170 1 — 1 ** ** — ** **
Resources, end of period 64 3,867 3,383 7,314 7.030 241 ** 241 239. 102 — 102 102.
1 ** Represents an amount less than SDR 500,000

Schedule 1
PRG Trust Status of arrangements
at October 31, 2014
(In millions of SDRs)
35
Member Date of
arrangement Expiration
date Amount agreed
Undrawn balance
Extended Credit Facility
Afghanistan, Islamic Republic of Nov. 14, 2011 Nov. 13, 2014 85.0 61.0
Bangladesh Apr. 11, 2012 Apr. 10, 2015 640.0 182.8
Burkina Faso Dec. 27, 2013 Dec. 26, 2016 27.1 22.0
Burundi Jan. 27, 2012 Jan. 26, 2015 30.0 5.0
Chad Aug. 1, 2014 Jul. 31, 2017 79.9 66.6
Cȏte d'Ivoire Nov. 4, 2011 Dec. 31, 2014 390.2 32.5
Gambia, The May 25, 2012 May 24, 2015 18.7 7.8
Grenada Jun. 26, 2014 Jun. 25, 2017 14.0 12.0
Guinea Feb. 24, 2012 Feb. 23, 2015 128.5 36.7
Haiti Jul. 21, 2010 Dec. 28, 2014 41.0 1.6
Liberia Nov. 19, 2012 Nov. 18, 2015 84.0 22.2
Malawi Jul. 23, 2012 Nov. 22, 2015 104.1 52.0
Mali Dec. 18, 2013 Dec. 17, 2016 30.0 24.0
Niger Mar. 16, 2012 Dec. 31, 2015 79.0 33.8
São Tomé and Príncipe Jul. 20, 2012 Jul. 19, 2015 2.6 1.5
Sierra Leone Oct. 21, 2013 Oct. 20, 2016 88.1 44.4
Solomon Islands Dec. 7, 2012 Dec. 6, 2015 1.0 0.4
Yemen, Republic of Sep. 2, 2014 Sep. 1, 2017 365.3 316.5
Total 2,208.5 922.8

Schedule 2
PRG Trust
Cumulative contributions to Subsidy Accounts related to distributions of IMF’s General Reserve attributable to windfall gold sales profits1
at October 31, 2014 (In millions of SDRs)2
36
Contributions related toSecond distribution
First distribution Member
General Subsidy
ECF Subsidy
RCF Subsidy
SCF Subsidy Total
Total cumulative
contributions
Afghanistan, Islamic Republic of 1.2 — — — 1.2 — 1.2
Albania 0.4 — — — 0.4 — 0.4
Algeria 9.2 — — — 9.2 3.7 12.9
Angola 2.1 — — — 2.1 — 2.1
Antigua and Barbuda 0.1 — — — 0.1 — 0.1
Argentina 15.6 — — — 15.6 6.2 21.8
Armenia 0.7 — — — 0.7 0.3 1.0
Australia 23.3 — — — 23.3 9.5 32.8
Austria 15.5 — — — 15.5 6.2 21.7
Bahamas, The 1.0 — — — 1.0 — 1.0
Bangladesh 3.9 — — — 3.9 1.6 5.5
Barbados 0.5 — — — 0.5 — 0.5
Belarus — — — 2.8 2.8 1.1 3.9
Belgium — — — — — 10.1 10.1
Belize 0.1 — — — 0.1 0.1 0.2
Benin — 0.5 — — 0.5 0.2 0.7
Bhutan ** — — — ** ** **
Bosnia and Herzegovina 1.2 — — — 1.2 0.5 1.7
Botswana 0.6 — — — 0.6 0.2 0.8
Brunei Darussalam 1.6 — — — 1.6 0.6 2.2
Bulgaria 4.2 — — — 4.2 1.7 5.9
Burkina Faso 0.4 — — — 0.4 0.2 0.6
Burundi 0.6 — — — 0.6 0.2 0.8
Cambodia 0.6 — — — 0.6 0.3 0.9
Cameroon 1.4 — — — 1.4 0.5 1.9
Canada 46.8 — — — 46.8 18.7 65.5
Cabo Verde — — — — — ** **
Central African Republic — — — — — 0.2 0.2
Chad 0.5 — — — 0.5 0.2 0.7
China — 70.0 — — 70.0 28.0 98.0
Comoros 0.1 — — — 0.1 ** 0.1
Congo, Democratic Republic of the 3.9 — — — 3.9 1.6 5.5
Congo, Republic of — 0.6 — — 0.6 — 0.6
Côte d'Ivoire 2.4 — — — 2.4 1.0 3.4
Croatia 1.3 — — — 1.3 0.5 1.8
Czech Republic 7.4 — — — 7.4 2.9 10.3
Denmark — — — — — 5.6 5.6
Djibouti 0.1 — — — 0.1 ** 0.1
Dominica 0.1 — — — 0.1 ** 0.1
Egypt 6.9 — — — 6.9 2.8 9.7

Schedule 2 (continued)
PRG Trust
Cumulative contributions to Subsidy Accounts related to distributions of IMF’s General Reserve attributable to windfall gold sales profits1
at October 31, 2014 (In millions of SDRs)2
37
Contributions related toSecond distribution
First distribution Member
General Subsidy
ECF Subsidy
RCF Subsidy
SCF Subsidy Total
Total cumulative
contributions
Estonia 0.7 — — — 0.7 0.3 1.0
Ethiopia 1.0 — — — 1.0 0.4 1.4
Republic of Fiji 0.5 — — — 0.5 0.2 0.7
Finland 9.3 — — — 9.3 3.7 13.0
France — 78.9 — — 78.9 31.6 110.5
Gabon 1.1 — — — 1.1 0.5 1.6
Gambia, The — 0.2 — — 0.2 0.1 0.3
Georgia 1.1 — — — 1.1 0.4 1.5
Germany 107.0 — — — 107.0 42.8 149.8
Ghana — — — — — 1.1 1.1
Greece 8.1 — — — 8.1 3.2 11.3
Guinea 0.8 — — — 0.8 0.3 1.1
Guinea-Bissau 0.1 — — — 0.1 ** 0.1
Haiti 0.6 — — — 0.6 0.2 0.8
Honduras 1.0 — — — 1.0 0.4 1.4
Iceland 0.9 — — — 0.9 0.3 1.2
India 42.8 — — — 42.8 17.1 59.9
Iraq — — — — — 3.5 3.5
Italy — 57.9 — — 57.9 23.2 81.1
Jamaica 2.0 — — — 2.0 0.8 2.8
Japan 110.6 — — — 110.6 38.1 148.7
Jordan — — — — — 0.5 0.5
Kenya 2.0 — — — 2.0 0.8 2.8
Korea 24.8 — — — 24.8 9.9 34.7
Kosovo 0.4 — — — 0.4 — 0.4
Kuwait 10.2 — — — 10.2 4.1 14.3
Kyrgyz Republic 0.7 — — — 0.7 0.3 1.0
Lao People's Democratic Republic 0.4 — — — 0.4 0.2 0.6
Latvia 1.0 — — — 1.0 0.4 1.4
Lesotho — 0.3 — — 0.3 0.1 0.4
Liberia — — — — — 0.4 0.4
Lithuania 1.4 — — — 1.4 0.5 1.9
Luxembourg 3.1 — — — 3.1 1.2 4.3
Macedonia, former Yugoslav Republic of 0.5 — — — 0.5 0.2 0.7
Malawi — 0.5 — — 0.5 0.2 0.7
Malaysia 13.0 — — — 13.0 5.2 18.2
Maldives 0.1 — — — 0.1 ** 0.1
Mali 0.7 — — — 0.7 0.3 1.0
Malta 0.7 — — — 0.7 0.3 1.0
Mauritania 0.5 — — — 0.5 0.2 0.7

Schedule 2 (continued)
PRG Trust
Cumulative contributions to Subsidy Accounts related to distributions of IMF’s General Reserve attributable to windfall gold sales profits1
at October 31, 2014 (In millions of SDRs)2
38
Contributions related to Second distribution
First distribution Member
General Subsidy
ECF Subsidy
RCF Subsidy
SCF Subsidy Total
Total cumulative
contributions
Mauritius 0.7 — — — 0.7 0.3 1.0
Micronesia, Federated states of ** — — — ** — **
Moldova 0.9 — — — 0.9 0.4 1.3
Mongolia 0.4 — — — 0.4 0.2 0.6
Montenegro 0.1 — — — 0.1 ** 0.1
Morocco 4.3 — — — 4.3 1.7 6.0
Mozambique 0.8 — — — 0.8 0.3 1.1
Myanmar 1.9 — — — 1.9 0.8 2.7
Namibia 1.0 — — — 1.0 0.4 1.4
Nepal 0.5 — — — 0.5 0.2 0.7
Netherlands 37.9 — — — 37.9 15.2 53.1
New Zealand 6.6 — — — 6.6 2.6 9.2
Nicaragua — 1.0 — — 1.0 0.4 1.4
Niger 0.5 — — — 0.5 0.2 0.7
Nigeria 12.9 — — — 12.9 5.2 18.1
Norway — — 6.9 6.9 13.8 5.5 19.3
Oman 1.7 — — — 1.7 0.7 2.4
Pakistan 7.6 — — — 7.6 3.0 10.6
Panama 1.5 — — — 1.5 0.6 2.1
Papua New Guinea — — — — — 0.4 0.4
Paraguay 0.7 — — — 0.7 0.3 1.0
Philippines — — — — — 3.0 3.0
Portugal — 7.6 — — 7.6 3.0 10.6
Qatar — — — — — 0.9 0.9
Russian Federation 43.7 — — — 43.7 17.5 61.2
Rwanda 0.6 — — — 0.6 0.2 0.8
St. Lucia 0.1 — — — 0.1 — 0.1
Samoa 0.1 — — — 0.1 — 0.1
San Marino 0.1 — — — 0.1 0.1 0.2
São Tomé and Príncipe 0.1 — — — 0.1 ** 0.1
Saudi Arabia 51.3 — — — 51.3 20.5 71.8
Senegal 1.2 — — — 1.2 0.5 1.7
Serbia 3.4 — — — 3.4 1.4 4.8
Seychelles 0.1 — — — 0.1 ** 0.1
Sierra Leone — 0.8 — — 0.8 0.3 1.1
Slovak Republic 2.8 — — — 2.8 1.1 3.9
Slovenia 1.0 — — — 1.0 0.4 1.4
Solomon Islands 0.1 — — — 0.1 ** 0.1
Spain 29.6 — — — 29.6 11.8 41.4
Sri Lanka 3.0 — — — 3.0 1.2 4.2
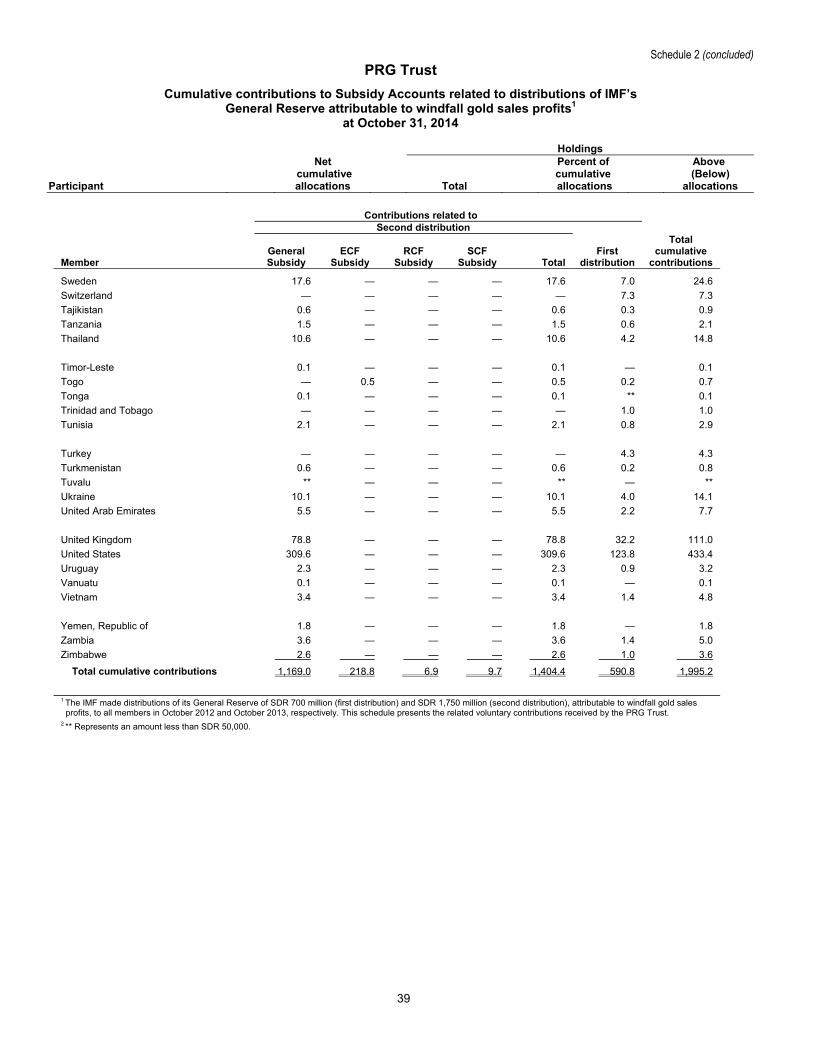
Schedule 2 (concluded) PRG Trust
Cumulative contributions to Subsidy Accounts related to distributions of IMF’s General Reserve attributable to windfall gold sales profits1
at October 31, 2014
Holdings
Participant
Net cumulative allocations Total
Percent of cumulative allocations
Above (Below)
allocations
39
Contributions related to Second distribution
First distribution Member
General Subsidy
ECF Subsidy
RCF Subsidy
SCF Subsidy Total
Total cumulative
contributions
Sweden 17.6 — — — 17.6 7.0 24.6
Switzerland — — — — — 7.3 7.3
Tajikistan 0.6 — — — 0.6 0.3 0.9
Tanzania 1.5 — — — 1.5 0.6 2.1
Thailand 10.6 — — — 10.6 4.2 14.8
Timor-Leste 0.1 — — — 0.1 — 0.1
Togo — 0.5 — — 0.5 0.2 0.7
Tonga 0.1 — — — 0.1 ** 0.1
Trinidad and Tobago — — — — — 1.0 1.0
Tunisia 2.1 — — — 2.1 0.8 2.9
Turkey — — — — — 4.3 4.3
Turkmenistan 0.6 — — — 0.6 0.2 0.8
Tuvalu ** — — — ** — **
Ukraine 10.1 — — — 10.1 4.0 14.1
United Arab Emirates 5.5 — — — 5.5 2.2 7.7
United Kingdom 78.8 — — — 78.8 32.2 111.0
United States 309.6 — — — 309.6 123.8 433.4
Uruguay 2.3 — — — 2.3 0.9 3.2
Vanuatu 0.1 — — — 0.1 — 0.1
Vietnam 3.4 — — — 3.4 1.4 4.8
Yemen, Republic of 1.8 — — — 1.8 — 1.8
Zambia 3.6 — — — 3.6 1.4 5.0
Zimbabwe 2.6 — — — 2.6 1.0 3.6
Total cumulative contributions 1,169.0 218.8 6.9 9.7 1,404.4 590.8 1,995.2
1 The IMF made distributions of its General Reserve of SDR 700 million (first distribution) and SDR 1,750 million (second distribution), attributable to windfall gold sales profits, to all members in October 2012 and October 2013, respectively. This schedule presents the related voluntary contributions received by the PRG Trust.
2 ** Represents an amount less than SDR 50,000.