international monetary fund washington, d.c. · philippines 2 international monetary fund foreign...
TRANSCRIPT

© 2013 International Monetary Fund April 2013 IMF Country Report No. 13/103
July 29, 2012 January 29, 2001 January 29, 2001 January 29, 2001 January 29, 2001
Philippines: Selected Issues This paper on the Philippines was prepared by a staff team of the International Monetary Fund as background documentation for the periodic consultation with the member country. It is based on the information available at the time it was completed on March 14, 2013. The views expressed in this document are those of the staff team and do not necessarily reflect the views of the government of the Philippines or the Executive Board of the IMF. The policy of publication of staff reports and other documents by the IMF allows for the deletion of market-sensitive information.
Copies of this report are available to the public from
International Monetary Fund Publication Services 700 19th Street, N.W. Washington, D.C. 20431
Telephone: (202) 623-7430 Telefax: (202) 623-7201 E-mail: [email protected] Internet: http://www.imf.org
International Monetary Fund
Washington, D.C.

PHILIPPINES SELECTED ISSUES Approved By Rachel van Elkan
Prepared By Asia and Pacific Department
TAX COLLECTIONS IN THE PHILIPPINES: AN EMPIRICAL ANALYSIS __________________ 3 A. Introduction and Main Findings _______________________________________________________ 3 B. How Have Tax Revenue Collections Evolved Over Time? ______________________________ 4 C. Decomposing Tax Collection Increases ________________________________________________ 7 References _______________________________________________________________________________ 15 FIGURES 1. Composition of Tax Collections, 2011 _________________________________________________ 4 2. Tax Collections _________________________________________________________________________ 4 3. Adjusted CIT, PIT, and VAT Collections ________________________________________________ 6 4. CIT, PIT, and VAT Collections and the Economy _______________________________________ 6 5. Excise Tax Collections __________________________________________________________________ 6 6. Import Duty ____________________________________________________________________________ 7 7. Other Taxes ____________________________________________________________________________ 7 8. Determinants of Tax Collections _______________________________________________________ 8 9. Decomposition of Tax Collection Growth ____________________________________________ 10 10. Size of Residual Factor for 2010–12 __________________________________________________ 11 TABLES 1. Size of the Residual Factor for 2011−12 _____________________________________________ 10 2. Size of the Residual Factor for 2011–12: Alternative Cases __________________________ 11 APPENDIX 1. Methodology and Tax Elasticity Estimates ___________________________________________ 12
CONTENTS
March 14, 2013

PHILIPPINES
2 INTERNATIONAL MONETARY FUND
FOREIGN WORKERS AND REMITTANCES IN THE PHILIPPINES: FACTS AND SOME MACROECONOMIC IMPLICATIONS ________________________________________ 16 A. Introduction _________________________________________________________________________ 16 B. Characteristic of Foreign Workers and Remittances _________________________________ 16 C. Impact on Business Cycle ____________________________________________________________ 22 References _______________________________________________________________________________ 25 FIGURES 1. Stock of Overseas Filipino Workers (In millions) _____________________________________ 17 2. Stock of Overseas Filipino Workers __________________________________________________ 17 3. Age Distribution Comparison ________________________________________________________ 17 4. Income Level of Home Region Versus Share in Overseas Filipino Worker Stock (2011) _____________________________________________________________________ 18 5. Employment by Occupation (2000) __________________________________________________ 18 6. Employment by Occupation (2010) __________________________________________________ 18 7. Share of Overseas Filipino Workers by Educational Attainment _____________________ 19 8. Remittances __________________________________________________________________________ 19 9. Average Remittances per Overseas Filipino Workers ________________________________ 19 10. Country Distribution of Remittances _________________________________________________ 20 11. Share of Overseas Filipino Worker Households Saving Remittances ________________ 21 12. Share of Overseas Filipino Worker Households Purchasing Real Estate _____________ 21 13. Growth of Working Age Population _________________________________________________ 21 14. Growth Volatility in ASEAN-4 ________________________________________________________ 22 15. Remittances and Net Capital Inflows ________________________________________________ 22 16. GDP and Remittances ________________________________________________________________ 22 17. Capital Account Balance in ASEAN __________________________________________________ 23 18. NEER in ASEAN ______________________________________________________________________ 23 19. Consumption Volatility Comparison _________________________________________________ 23 20. Remittances and Consumption ______________________________________________________ 24

PHILIPPINES
INTERNATIONAL MONETARY FUND 3
TAX COLLECTIONS IN THE PHILIPPINES: AN EMPIRICAL ANALYSIS1 A. Introduction and Main Findings1
1. Revenue mobilization is one of the most important fiscal challenges facing the Philippines.
The revenue to GDP ratio is low compared with peers, and significant additional revenue is needed
to address large spending gaps for education, health, and infrastructure while maintaining fiscal
sustainability. The authorities have therefore implemented a fiscal strategy focused on revenue
mobilization. So far, reform of alcohol and tobacco excises was recently approved and internal tax
administration reform has been making progress.2 Nevertheless, the authorities’ target to raise the
revenue to GDP ratio to 18 percent by 2016 (from 14.3 percent in 2012) and the tax ratio to
16 percent (from 12.8 percent) is ambitious and requires strong policy efforts going forward.
2. Against this background, we examine historical tax collections in the Philippines (in
Section B) and analyze contributing factors for recent collection increases (in Section C). Main
findings are as follows. First, tax collections have improved in relation to GDP since 2009, as higher
collections of income taxes and VAT compensated lower collections of excises and import duties.
Looking ahead, recent reform of excises on alcohol and tobacco will increase tax collections, while
collections of petroleum excises and import duties are expected to decline further. Second, for
income taxes and VAT, our estimates suggest that about 80 percent of collection increases
during 2011−12 originated from economic growth. The residual, the size of which is estimated at
about 0.3 percent of GDP annually, may be attributed to improvements in tax administration, given
no major tax policy changes. Nevertheless, these results are sensitive to assumptions on tax
elasticities and hence should be treated with caution.
1 Prepared by Masahiro Nozaki, Fiscal Affairs Department. 2 Reform of the Bureau of Internal Revenue (BIR) has been supported by the IMF and the U.S. Millennium Challenge Corporation since 2011. Progress has been made in core areas of administration (e.g., audit, arrears management, large taxpayer service, and data processing). Measures taken thus far include establishment of an institutional strategic plan and key performance indicators; introduction of online taxpayer registration; opening of regional data processing centers to scan and enter tax return data; and launch of a pilot program for riskbased VAT audit in the four Metro Manila regions.

PHILIPPINES
4 INTERNATIONAL MONETARY FUND
B. How Have Tax Revenue Collections Evolved Over Time?
3. In this section, we review historical tax collections in the Philippines by disaggregating tax
revenue into six types: corporate income tax (CIT), personal income tax (PIT), value added tax (VAT),
excise, import duty, and the rest (“other taxes”).3 CIT and VAT are the two main components of tax
revenue, with each of them accounting for about 30 percent of total tax revenue (Figure 1). They are
followed by PIT (16 percent of total tax revenue), excises (7 percent), and import duties (4 percent).
4. Tax collections recovered gradually since 2009 (Figure 2). The tax to GDP ratio increased
from 12.1 percent of GDP in 2009 to 12.8 percent of GDP in 2012, as higher collections for CIT, PIT,
and VAT compensated for declines in excises and import duties. While the tax ratio still falls short of
the pre global recession level of about 13.5 percent of GDP, this is partly explained by a reduction in
the CIT tax rate and PIT relief measures, as discussed below. Going forward, recently approved
reform of “sin” taxes (alcohol and tobacco excises) will raise tax collections by about 0.3 percent of
GDP in 2013, while excises on petroleum products are expected to fall due to lack of inflation
indexation of specific rates, while lower tariff rates on continuing trade liberalization is expected to
reduce import duties.
3 Other taxes include taxes on interest income; a documentary stamp tax; and tax collections by agencies other than the BIR and the Bureau of Customs.
CIT, 3.5 / 28.1
PIT, 2.0 / 16.1VAT, 3.9 / 31.9
Excise, 0.9 / 7.3
Import duty, 0.4 / 3.5
Other taxes, 1.6 / 13.1
Figure 1. Philippines: Composition of Tax Collections, 2011 1/
Sources: Philippine authorities; and IMF staff estimates.1/ The left and right numbers indicate collections in percent of GDP and in percent of total tax revenue, respectively.
12.611.9 11.8 11.7
12.4
13.7 13.5 13.6
12.1 12.1 12.3 12.8
0
2
4
6
8
10
12
14
16
2001 2002 2003 2004 2005 2006 2007 2008 2009 2010 2011 2012
Figure 2. Philippines: Tax Collections(In percent of GDP)
Other taxes Import duty Excise VAT PIT CIT Total
Sources: Philippine authorities; and IMF staff estimates.

PHILIPPINES
INTERNATIONAL MONETARY FUND 5
CIT, PIT, and VAT
5. Tax policy changes have affected CIT and VAT collections.4 The most important one was the
revenue mobilization package implemented in 2006. It included increases in CIT and VAT rates (from
32 percent to 35 percent and from 10 percent to 12 percent, respectively), as well as broadening of
the VAT base by abolishing exemptions for petroleum products, among others. After this, several tax
policy measures through 2009 reduced the tax burden. In particular, the CIT rate was reduced to
30 percent in 2009 (as envisaged under the 2006 package); for PIT, general exemptions (allowances)
were raised and minimum wage earners were exempted in mid2008;5 and VAT on electricity
transmission was replaced by a franchise tax in 2009. There was no major tax policy change
during 2010−12.
6. The Philippines’ tax system is characterized by a generous and complicated regime of tax
incentives. Incentives are currently granted by 13 investment promotion agencies, and include
income tax holidays, a 5 percent tax on gross income earnings (in lieu of all national and local taxes),
and exemptions from VAT and import duties. Foregone revenue is thought to be substantial not
only because of the generosity of the incentives but also due to opportunities for abuse
(e.g., transfer pricing between related parties to ensure profits are made in exempt activities).6
7. If adjusted for the changes in CIT and VAT tax rates, collections for CIT, PIT, and VAT have
increased since 2009 to 9.7 percent of GDP, to a level substantially higher than in 2006−08
(Figure 3). Effective CIT collections recalculated at the current tax rate of 30 percent steadily
increased from 2.2 percent of GDP in 2002 to 3.5 percent of GDP in 2012. PIT collections have been
stable at around 2 percent of GDP, with an exception of a drop in 2009, which likely reflects the 2008
measures. VAT collections recalculated at the current tax rate of 12 percent jumped in 2006,
reflecting the base broadening measures. Since then, the collections experienced a Ushaped
recovery and now recovered to the level achieved in 2006.
4 See Philippines National Tax Research Center (2011) for a summary of past tax policy changes. 5 The PIT tax rate schedule has been unchanged since 2000, but the income brackets, defined in nominal pesos, have not been updated since 1997. Therefore, some taxpayers move to higher income brackets over time because of inflation. 6 There is no official estimate of foregone revenue from tax incentives. Manasan (2002) estimates that the cost of fiscal incentives was 1.1−1.9 percent of GDP annually for 1998−2000.

PHILIPPINES
6 INTERNATIONAL MONETARY FUND
8. CIT, PIT, and VAT collections may reflect cyclical fluctuations of the Philippine economy
(Figure 4). The growth rate of these tax collections adjusted for the changes in CIT and VAT rates
declined in real terms during 2008−09. This may reflect not only tax policy changes (other than the
changes in the CIT and VAT rates) but also a cyclical downturn. After this, the growth rate picked up
in line with recovery in GDP growth in 2010. The development during 2011−12 is less clear cut—
revenue growth intensified in 2011 despite a negative output gap, while it decelerated in 2012 amid
reinvigorated GDP growth. We will address the relationship between these tax collections and
economic cycles further in the next section.
Excise
9. Excises are levied on alcohol, tobacco, and petroleum products, among others. Collections
decreased from 1.7 percent of GDP in 2001 to
0.9 percent of GDP in 2012 (Figure 5). This results
mainly from lack of inflation indexation for
specific rates for alcohol and tobacco during the
first half of the 2000s and for petroleum products
since 1998. Moreover, as part of mitigating
measures for the 2006 revenue mobilization
package, excise rates for petroleum products
were reduced (with tax rates for diesel and
kerosene reduced to zero). As a result, collections of petroleum excises declined from 0.6 percent of
GDP in 2001 to 0.1 percent in 2012.
2.4 2.2 2.3 2.4 2.6 2.7 3.0 3.2 3.2 3.1 3.5 3.5
2.1 2.1 2.0 2.0 2.1 2.1 2.1 2.0 1.6 1.92.0 2.1
3.3 3.3 3.6 3.3 3.34.1 4.0 3.8
3.8 3.73.9 4.1
7.7 7.6 7.9 7.6 7.9
8.9 9.0 9.08.5 8.6
9.4 9.7
0
2
4
6
8
10
12
2001 2002 2003 2004 2005 2006 2007 2008 2009 2010 2011 2012
VAT PIT CIT Total
Sources: Philippine authorities; and IMF staff estimates.1/ Adjusted for changes in the tax rates of CIT and VAT.
Figure 3. Adjusted CIT, PIT, and VAT Collections 1/(In percent of GDP)
-5
0
5
10
15
2007 2008 2009 2010 2011 2012
CIT+PIT+VAT, in real terms, percent change 1/
GDP gap (in percent), right scale
Real GDP growth (percent)
Sources: Philippine authorities; and IMF staff estimates.1/ Adjusted for changes in the tax rates of CIT and VAT.
Figure 4. CIT, PIT, and VAT Collections and the Economy
1.7 1.61.5 1.5
1.3
1.11.0 1.0 1.0 1.0
0.9 0.9
0.0
0.5
1.0
1.5
2.0
2001 2002 2003 2004 2005 2006 2007 2008 2009 2010 2011 2012
Figure 5. Excise Tax Collections (In percent of GDP)
BOC BIR / Other
BIR / Petroleum BIR / Tobacco
BIR / Alcohol Total
Sources: Philippine authorities; and IMF staff estimates.

PHILIPPINES
INTERNATIONAL MONETARY FUND 7
10. Reform of “sin” taxes, i.e., alcohol and tobacco excises, was approved by congress in
late 2012 and became effective in 2013. The reform raised tax rates for these products and will
generate new revenue of 0.3 percent of GDP. Moreover, it introduced an automatic annual increase
of 4 percent for specific tax rates to keep up with inflation, and gradual unification of within product
multiple price categories for beer, distilled spirits, and cigarettes, in line with IMF technical assistance
recommendations (Nakayama and others, 2011).
Import Duties and Other
11. Import duties and other taxes have decreased since the mid2000s. The decrease in import
duties manly reflects lower effective tariff rates following various trade agreements, as well as a
significant reduction in tariff rates for oil in 2010 (Figure 6). Nevertheless, these factors alone do not
account for a sharp drop in nonoil import duties in 2011 by 0.4 percent of GDP. The decrease in
other tax collections is mainly due to lower collections for taxes on interest income, in tandem with a
decline in the domestic interest rate (Figure 7).
C. Decomposing Tax Collection Increases
12. It is important for policymakers to understand the underlying drivers of tax collection
changes. For example, if they misinterpret tax collection increases driven by tax bases as originating
from other permanent factors, and opt to boost spending on a permanent basis, a structural fiscal
deficit will be left. In the Philippines, the recent increase in the collections of CIT, PIT, and VAT by as
much as 1.2 percent of GDP during 2009−12 may reflect high economic growth achieved after the
global recession, improvements in tax administration, or a combination of both.
1.1
1.0 0.9 0.9
1.3
1.1
1.0
1.1
0.9 0.9
0.40.5
0.0
0.2
0.4
0.6
0.8
1.0
1.2
1.4
2001 2002 2003 2004 2005 2006 2007 2008 2009 2010 2011 2012
Figure 6. Import Duty(In percent of GDP)
OilNon-oilTotal
Sources: Philippine authorities; and IMF staff estimates.
1.10.9 0.9 0.9 0.9 0.8 0.6 0.6 0.5 0.5 0.4 0.5
1.3
1.21.1 1.1
1.4 1.41.4 1.4
1.2 1.2 1.2 1.2
2.5
2.11.9 2.0
2.3 2.22.0 2.0
1.81.7 1.6 1.7
0.0
2.5
5.0
7.5
10.0
12.5
0.0
0.5
1.0
1.5
2.0
2.5
3.0
2001 2002 2003 2004 2005 2006 2007 2008 2009 2010 2011 2012
Figure 7. Other Taxes (In percent of GDP)
Other Taxes on interest incomeTotal T-bill rate (%, right scale)
Sources: Philippine authorities; and IMF staff estimates.

PHILIPPINES
8 INTERNATIONAL MONETARY FUND
13. Against this background, we attempt to decompose tax collection increases into two
components: the “tax base” component, which pertains to changes in the tax base, and the
“residual” component, that is, tax collection increases minus the tax base component. Our main
findings are twofold. First, on relative importance of the two components, we find that the tax base
component accounts for about 80 percent of total tax collection increases during 2011−12. It
accounts more than 100 percent of CIT collections (i.e., collections increased less than the tax base
component), for 46 percent of PIT collections, and 66 percent of VAT collections. Second, we find
that the residual component was about 0.3 percent of GDP annually during 2011−12. This may be
attributable to improvements in tax administration, given no major tax policy changes during this
period. Nevertheless, caution is warranted, because this estimate is sensitive to assumptions used in
the analysis.
Analytical Framework
14. Figure 8 illustrates our analytical framework. Put simply, changes in tax collections should be
anchored by changes in the tax base, if tax structures remain unchanged. The remainder, if any,
should originate from changes unrelated to the tax base, such as tax policy reform (e.g., changes in
the tax rates) or tax administration improvements. Changes in the tax base are linked to the
economic conditions, such as output growth and employment conditions.
15. Even if tax structures are unchanged, tax collections may increase faster or slower than the
tax base. A typical example is personal income taxation with a progressive tax rate schedule. As an
improvement in the cyclical condition raises labor income, more individuals are taxed at higher
rates, and hence tax collections increase more than labor income. To reflect this, we use a standard
concept of the elasticity of tax collections with respect to the tax base: it measures the percent
Economy Tax base- GDP - Consumption Tax collections- Inflation - Labor income- Employment - Corpotate profit- Wage Other factors
Tax structures - Tax policy change- Single VAT and CIT rates - Tax admin improvements- Progressive tax rate schedule (PIT) - Collections of back taxes
Figure 8. Determinants of Tax Collections

PHILIPPINES
INTERNATIONAL MONETARY FUND 9
increase of tax collections caused by a 1 percent increase in the tax base. With this concept, the
overall tax collection increase can be decomposed into the component explained by movements in
the tax base (the percent change of the tax base multiplied by the elasticity) and the residual. For
example, if tax collections and the tax base increase by 20 percent and 10 percent, respectively, and
the elasticity is 1.5, then 15 percentage points (10 times 1.5) is attributed to the movements in the
tax base and the residual of 5 percentage points to other factors. The detail of the methodology is
described in Appendix 1.
16. We perform this exercise separately for CIT, PIT, and VAT, to reflect differences in tax
structures. Data availability limits further meaningful disaggregation. We use private consumption as
the tax base of VAT and GDP as the base of CIT and PIT, and estimate tax elasticities for each tax
type based on regressions (the estimation methodology is described in Appendix 1). Corporate
profit and labor income would be ideal tax bases for CIT and PIT, respectively, but data are not
available. As a consequence, the elasticity for CIT and PIT may reflect not only the elasticity of tax
collections with respect to the true tax base, but also the elasticity of the true tax base with respect
to GDP. Nevertheless, provided a stable relationship holds among GDP, the true tax base, and tax
collections, our approach can decompose tax collections of CIT and PIT as intended. The
decomposition is thought to be more reliable for VAT since private consumption is a closer proxy
for the tax base than is GDP.
Results
17. Our analysis suggests that about 80 percent of tax collection increases for CIT, PIT, and VAT
in 2011−12 is attributed to the tax base component. Figure 9 illustrates the decomposition of
growth rates of tax collections. Our estimates suggest that the tax elasticity is 1.89 for CIT, 0.72 for
PIT, and 0.95 for VAT (see the Appendix Table 1.1. for discussions on the validity of these estimates).
We focus on changes since 2010, because it is an ideal base year when the cyclical position is
thought to have been neutral (there was a negative output gap in 2009). For CIT, much of collection
increases are attributed to changes in the tax base, while the residual component is positive in 2011
but negative in 2012. As a result, the tax base component is larger than the collection growth
for 2011−12, and the residual component has a net negative contribution to tax collection growth.
For PIT, on the other hand, the contribution of the residual component is positive and substantial in
both years, reflecting the small tax elasticity. For 2011−12, the tax base component accounts for
46 percent of collection increases. For VAT, the contribution of the residual component is positive

PHILIPPINES
10 INTERNATIONAL MONETARY FUND
but smaller than that of the tax base component, which accounts for 66 percent of collection
increases for 2011−12. Taking account of relative sizes of the three tax types, the tax base
component accounts for 80 percent of tax collection increases for CIT, PIT, and VAT during 2011−12.
18. The size of the residual component is
estimated at about 0.3 percent of GDP per year
for 2011−12. Table 1 shows the magnitude of the
residual component following decomposition of
tax collection levels normalized by potential GDP.
The residual component for CIT, PIT, and VAT
combined is estimated at 0.27 percent of GDP
per year for 2011−12. The increase is higher
in 2011 (0.43 percent of GDP) than in 2012 (0.10 percent of GDP). As discussed, the contribution of
the residual component for CIT is negative because tax collection increases are less than tax base
increases augmented by the (high) tax elasticity. The negative contribution might possibly be related
to increased granting of tax incentives, although this cannot be verified due to lack of such data. For
PIT and VAT, the contribution of the residual component is estimated at 0.14 percent and
0.18 percent of potential GDP, respectively, and exhibits steady increases in 2011 and 2012. The
positive contributions can be attributed to tax administration efforts, given no change in tax policy.
Figure 9. Decomposition of Tax Collection Growth(In percent)
Tax base, augmented by elasticity Residual Collections
Sources: IMF staff estimates.
Elasticity 2011 2012 2011–12 1/
CIT 1.89 0.13 -0.24 -0.05PIT 0.72 0.16 0.13 0.14VAT 0.95 0.15 0.21 0.18Total ... 0.43 0.10 0.27
Sources: IMF staff estimates.
1/ Average of 2011 and 2012.
Table 1. Size of the Residual Factor for 2011–12
(In percent of potential GDP)

PHILIPPINES
INTERNATIONAL MONETARY FUND 11
Sensitivity Analysis
19. The size of the residual component is highly sensitive to tax elasticity assumptions. Figure 10
illustrates that the residual component
for 2011−12 would be wiped out if the
elasticity is larger than 1.6 for CIT and PIT and
1.5 for VAT. On the other hand, if the elasticity
is equal to unity for each tax type, the total
residual component becomes 0.43 percent of
potential GDP (Table 2). If the elasticity values
are replaced with average values for OECD
countries estimated by Girouard and André
(2005), the total residual component becomes 0.27, corroborating our results. Moreover, our VAT
elasticity estimate of 0.95 is generally consistent with the single tax rate (which would make the
elasticity close to 1). Also, the use of private consumption rather than GDP as the tax base makes the
estimate more reliable for VAT than for CIT and PIT. Nevertheless, the sensitivity warrants caution in
interpreting our results, in particular for CIT and PIT.
Elasticity 2010−11 2011−12 2010−12 1/ Elasticity 2010−11 2011−12 2010−12 1/
CIT 1.00 0.33 0.00 0.16 1.50 0.22 -0.13 0.04PIT 1.00 0.12 0.09 0.10 1.26 0.09 0.05 0.07VAT 1.00 0.13 0.20 0.16 1.00 0.13 0.20 0.16Total ... 0.58 0.28 0.43 ... 0.43 0.11 0.27
Sources: IMF staff estimates.
1/ Average of 2011 and 2012.
Alternative 1: elasticity = 1 Alternative 2: elasticity = OECD average
Table 2. Size of the Residual Factor for 2011−12: Alternative Cases
(In percent of potential GDP)
-0.2
-0.1
0.0
0.1
0.2
0.3
0.4
0.5 1.0 1.5 2.0Tax elasticity
Figure 10. Size of Residual Factor for 2010−12 (In percent of potential GDP, per year basis)
CIT PIT VAT
Estimate
Source: IMF staff estimates.
PHILIPPINES
12 INTERNATIONAL MONETARY FUND
Appendix 1. Methodology and Tax Elasticity Estimates Methodology
For each tax type of CIT, PIT, and VAT, tax collections in pesos ( ) are assumed to be a function of the tax base in pesos ( ) augmented by the elasticity ( ) as well as the residual component ( ):
· (1) This implies
(2)
where , , and are growth rates of , and , respectively (i.e., log ,⁄ ). is the elasticity of tax collections with respect to the tax base, because ⁄ . The elasticity is assumed to be constant over time, and is estimated by regressions. The residual component is then calculated from data for and . To measure their size, the components of tax collection increases (in levels) are normalized by potential GDP ( ) as follows:
, ⁄ , ⁄ , ⁄ (3) The data for tax collections are received from the Department of Finance, and private consumption and GDP are taken from national accounts of the Philippines. Tax Elasticity Estimates
Tax elasticity is derived by estimating the log form of equation (1), with both tax collections and the tax base measured in real terms ( and , respectively):
log ε · log where is an error term. This equation is estimated using quarterly data from Q1:1998 to Q2:2012 for CIT and PIT, and from Q1:2006 to Q2:2012 for VAT (to account for the structural break from tax policy changes), using the dynamic OLS model to address potential cointegration between tax collections and the tax base (statistical tests indeed suggest these are cointegrated, as discussed below). Data for CIT collections are adjusted for changes in the tax rate. Quarterly dummies are included in the right hand side. We also estimate the relationship of tax collections with the first, second, and third lag of the tax base variable, to account for time lags of tax collections. That is,
log ε , · log , , 1,2,3.
Appendix Table 1.1. tabulates our elasticity estimates. It reports the result of cointegration tests to check if regressions in levels (not in differences) are appropriate and not spurious. It also includes elasticity estimates for OECD countries from Girouard and André (2005) as an international

PHILIPPINES
INTERNATIONAL MONETARY FUND 13
benchmark. In the main text (Figure 9 and Table 1), the elasticity is set at the average of four different lag specifications.
Main observations are:
For CIT, the tax elasticity with respect to GDP is estimated to be around 1.9. Standard errors are small. The estimates are not sensitive to the lag structure, and the existence of cointegration between CIT collections and GDP is strongly suggested, indicating that it is appropriate to estimate the relationship in levels, not in differences.
Residual-Based Hansen ElasticityNumber of Lags Standard Cointegration Cointegration Estimate
for Tax Base Errors test 2/ Test 3/ OECD Average 4/
0 1.87 *** 0.062 √√ √ …1 1.877 *** 0.058 √√ √ …2 1.88 *** 0.059 √√ √ ...3 1.927 *** 0.056 √√ √ ...
Average 1.889 ... ... ... 1.500
0 0.707 *** 0.094 √√ √ ...1 0.721 *** 0.097 √√ √ ...2 0.739 *** 0.102 √√ √ ...3 0.719 *** 0.107 √√ √ ...
Average 0.722 ... ... ... 1.260
0 0.801 *** 0.162 √ √ ... 1 0.925 *** 0.191 √ √ √ ... 2 1.029 *** 0.242 √ √ ... 3 1.047 *** 0.239 √ √ ...
Average 0.951 ... ... ... 1.000
Sources: IMF staff estimates.
1/ “***” suggests p-value of less than 1 percent.
3/ “√” suggests null hypothesis of cointegration is accepted. 4/ Average elasticity estimates for OECD countries as computed and reported by Girouard and Andre (2006). VAT elasticity is indirect tax elasticity, which is set equal to 1 for all countries.
2/ “√√” suggests cointegration between tax collections and tax base at 95 percent level, and “√” suggests cointegration at 90 percent level.
ElasticityEstimate 1/
Table 1.1. Estimates of Tax Elasticity
CIT (tax base = GDP, sample period = 1998Q1:2012Q2)
PIT (tax base = GDP, sample period = 1998Q1:2012Q2)
VAT (tax base = private consumption, sample period = 2007Q1:2012Q2)

PHILIPPINES
14 INTERNATIONAL MONETARY FUND
For PIT, on the other hand, the elasticity is estimated to be around 0.7, substantially less than 1. While the estimate is somewhat less precise than for CIT, cointegration is also strongly suggested.
For VAT, the elasticity with respect to private consumption ranges from 0.8 to 1. Larger standard errors than for CIT and PIT likely reflect a shorter sample period, which is set to address a structural break due to the 2006 VAT reform. Cointegration is supported.
Are these estimates reliable? For VAT elasticity, the average of 0.95 over the four lag specifications is generally consistent with the single tax rate (which would make the elasticity close to 1) and in line with the elasticity value used in the OECD study. Also, the use of private consumption rather than GDP makes the estimate more reliable. On the other hand, the elasticity for PIT is less than 1. Under a progressive tax rate schedule, the elasticity of PIT collections with respect to the tax base such as labor income should be larger than 1, unless aggregate income growth benefits the poor whose income falls below the PIT threshold. The fact that we do not adjust PIT collections for changes in the effective tax rate (which arise from the lack of inflation adjustment for the income brackets and the mid2008 tax relief) also limits validity of our estimate. Nevertheless, a possible explanation is that our estimates take account of not only the tax collection elasticity (tax collections versus the tax base) but also the tax base elasticity (the tax base versus GDP). The elasticity of tax collections with respect to GDP equals the product of the tax collection elasticity and the tax base elasticity. In this connection, our small PIT elasticity estimate may result from the tax base elasticity of less than 1, that is, labor income is more stable than GDP. If so, corporate profit would be more volatile than GDP (since labor income and corporate profit add up to GDP in principle), which would make the tax base elasticity larger than 1 for CIT.

PHILIPPINES
INTERNATIONAL MONETARY FUND 15
References Girouard, Nathalie, and Christophe André, 2005, “Measuring Cyclically Adjusted Budget Balances for
OECD Countries,” OECD Economics Department Working Paper No. 434 (Paris: Organization for Economic Co operation and Development).
Manasan, Rosario G., 2002, “Explaining the Decline in Tax Effort,” PIDS Policy Note No. 2002−14
(Makati City: Philippine Institute for Development Studies). Nakayama, Kiyoshi, Selcuk Caner, and Peter Mullins, 2011, Philippines: Technical Assistance Report on
Road Map for a Pro Growth and Equitable Tax System, IMF Country Report No. 12/60 (Washington: International Monetary Fund).
National Tax Research Center, 2011, “Tax Performance Analysis of the BIR and BOC, 1998−2009,” NRTC Tax Research Journal. Volume XXIII.3, MayJune (Manila: Department of Finance, Republic of the Philippines).

PHILIPPINES
16 INTERNATIONAL MONETARY FUND
FOREIGN WORKERS AND REMITTANCES IN THE PHILIPPINES: FACTS AND SOME MACROECONOMIC IMPLICATIONS 1/ A. Introduction1
Large scale labor emigration and related remittance inflows are important characteristics of the Philippine economy. Instead of keeping these workers employed at home and exporting the goods and services they produce, the Philippines directly exports a large share of its labor. These workers generate sizable remittances, with annual official inflows amounting to more than 9 percent of GDP. The economic implications of this growth paradigm depend on the characteristics of the emigrants, the likely persistence of these factor flows, and how the resulting remittances are used. While the potential economic and social implications are numerous, here we explore the impact on the economy’s resilience. B. Characteristics of Foreign Workers and Remittances
1. Labor exports are a prominent feature of the Philippines. It is estimated that more than 10 million Filipinos are now abroad, equivalent to around 10 percent of the total population, 18 percent of the workingage population, and 25 percent of the labor force. The number of Overseas Filipinos has increased from 7 million in 1997 to 10.5 million in 2011, driven by the increase in permanent and temporary migrants, while “irregular” migrants have declined dramatically. Moreover, slightly more than 10 percent of households report having at least one Overseas Filipino Worker (OFW) member.2
1 Prepared by Longmei Zhang, Asia and Pacific Department. 2 Temporary migrants are persons whose stay overseas is employment related, and who are expected to return at the end of their work contracts. Permanent migrants are immigrants or legal permanent residents abroad whose stay does not depend on work contracts. Irregular migrants are those without proper documentation or valid residence or work permits, or who are overstaying in a foreign country. OFWs encompass both temporary and irregular migrants.

PHILIPPINES
INTERNATIONAL MONETARY FUND 17
2. OFWs tend to be young and gender-balanced in the aggregate. Based on the 2011 Survey of Overseas Workers:
Male OFWs account for 52 percent of the total.
Most commonly, OFWs are in the 25−29 age group (about 24 percent of the total), followed by the 30−34 age group (about 23 percent).
Compared with the total population, OFWs tend to be disproportionately younger. As a result, about 30 percent of the population within the range of 25−40 years is working abroad.
Female OFWs are younger than their male counterparts. About 27 percent of female OFWs are in the 25−29 age group, with a quarter in the 30−34 years group. In contrast, male OFWs over the age of 45 years comprise the largest single category (23 percent).
3. OFWs tend to come from richer regions. Based on the 2011 Survey on Overseas Workers, half the migrants come from four regions (including the national capital region), and these have among the highest per capita incomes.3 More generally, there appears to be a positive correlation
3 To some extent, this may include the impact of remittances on measured income. However, one would expect incomes in poorer regions to be biased up to a greater extent by including remittances in income.

PHILIPPINES
18 INTERNATIONAL MONETARY FUND
between regional income and the share in migration.4 This may reflect that richer regions produce better-educated workers who, in turn, are in higher demand abroad. On the other hand, the share of households reporting at least one OFW member is broadly the same (slightly over 10 percent) in the national capital region and in the rest of the country.
4. The majority of newly-employed OFWs are engaged in low- and midskill occupations. In the last decade, the share of production workers and service workers (including household workers, care takers, and cooks) has risen steadily, and together accounted for more than 80 percent of labor outflows in 2010. The share of professionals also increased from 7 percent in 2000 to 12 percent in 2010, mainly nurses and engineers. On the other hand, the share of performing artists declined sharply from 24 percent in 2000 to only 1 percent in 2010.5 Slightly more than half (56 percent) of the stock of female OFWs were classified as being employed as unskilled workers in 2011, while just under half (47 percent) the stock of male OFWs were employed as tradesmen, plant and machine operators, and in assembly work.
5. The education level of OFWs is rising. As of 2004, nearly two thirds of OFWs had attended or graduated from college (36 percent were college graduates), up from 56 percent in 1994. As a result, OFWs are considerably better educated than the domestic labor force, where only 13 percent
4 Because we do not control for the population of each region, it is not possible to conclude the propensity to emigrate is higher in richer regions. 5 This may reflect a change in classification.

PHILIPPINES
INTERNATIONAL MONETARY FUND 19
were college graduates as of 2004.6 However, based on the distribution of job types, it appears that many OFWs may be employed in positions that are not fully commensurate with their level of educational attainment.
6. Remittances have grown rapidly in the past decade to become an important source of national income. Close to 95 percent of households that include at least one OFW report receiving remittances. Based on official statistics, since 2002, remittances have grown at double digit annual rates, although they have slowed down since the global financial crisis. In 2012, personal remittances continued to grow in U.S. dollar terms, reaching US$23.8 billion, but declined somewhat relative to GDP to 9.5 percent on the appreciating peso and faster real GDP growth.7 Remittances from female OFWs tend to be smaller than those from male OFWs. Based on the 2011 OFW survey, around 31 percent of remittances were sourced from female OFWs, despite the roughly balanced gender ratio, likely reflecting differences in the mix of occupations.
7. Official statistics likely underreport the true size of remittances. Based on the 2011 Survey on OFWs, staff estimates that remittances not captured by official statistics amounted to about 50 percent of officially-reported remittances.
8. Remittance flows appear to be somewhat
sensitive to business cycles in host countries. The
increase in remittances over time has been driven
both by the growing number of OFWs and an
increase in the average remittance per migrant
(growing at 9 percent annually on average).
6 The education data are taken from Ducanes and Abella (2008), who derive it from the Labor Force Survey. 7 Personal remittances compiled in accordance with BPM6 include the net compensation of employees with work contracts of less than one year, personal transfers of workers with contracts of one year or more, and capital transfers between households. Cash remittances coursed through banks equalled US$21.4 billion (8.5 percent of GDP) in 2012.

PHILIPPINES
20 INTERNATIONAL MONETARY FUND
However, since the onset of the global financial crisis in 2008, the average remittance per worker has leveled off. In addition, the number of emigrants fell temporarily in 2008 and 2009, before picking up in 2010.
9. Reflecting the geographic diversification of host countries, remittance inflows now originate from a wider set of regions. The share of remittances from the United States has declined gradually from 65 percent in 2000 to 42 percent in 2011, although it remains the primary source of inflows.8 Canada is now the second largest source country, with remittances accounting for 10 percent of total inflows. Other regions, like the Middle East and Europe,9 have also gained in importance over time, with the percentage share doubling in the last decade. Inflows from Asia, on the other hand, have been relatively stable and account for 13 percent of total remittances.10
10. The expenditure pattern of remittances has also varied over time. Survey data indicate that among remittance receiving households, nearly all spend some (unspecified) share of remittances
8 However, not all remittances reported as originating in the United States were remitted by U.S.based OFWs. This reflects the common practice of remittance centers around the world, especially in the Middle East, to course remittances through correspondent banks, which tend to be located in the United States. 9 The top three hosting countries in Middle East are: Saudi Arabia (8 percent), UAE (4 percent) and Qatar (1 percent). The top four hosting countries in Europe include: United Kingdom (5 percent), Italy (3 percent), Germany (2 percent), and Norway (2 percent). 10 Major hosting countries in Asia are Japan (5 percent), Singapore (4 percent) and Hong Kong SAR (2 percent).

PHILIPPINES
INTERNATIONAL MONETARY FUND 21
on food and other household needs.11 More generally, spending patterns from remittances shifted significantly in the lead up to the global financial crisis, when allocations to more discretionary types of spending—purchases of appliances and vehicles, education, saving—collapsed. In the aftermath, households once again broadened their allocation of remittances to a wide range of categories, including savings (45 percent of households). Consistent with anecdotal evidence, the survey indicates that about 10 percent of respondents use remittances to purchase real estate, and this share is markedly higher at 20 percent in the national capital region than in the rest of the country.
11. Domestic factors suggest that the stream of OFWs will continue. Based on UN projections, the working age population of the Philippines is forecast to expand for the next 50 years. From the current rapid pace of 2½ percent per annum, the annual increase in the working age population is projected to moderate gradually, reaching about 1 percent in 2050. In addition, ample untapped labor resources exist in the form of low labor force participation (64 percent) and elevated unemployment and underemployment (7 percent and 20 percent, respectively). The still large wage gap with hosting countries—Clemens and others (2008) find that a Filipino could increase his purchasing power adjusted wage by a factor of five if he took a job in the U.S.—remains a strong attraction for working abroad.
11 The survey does not indicate the share of remittances allocated to each spending category.

PHILIPPINES
22 INTERNATIONAL MONETARY FUND
12. Longer term demand conditions abroad are also supportive of continued outward flows. Many advanced economies are aging rapidly, reducing the size of their labor forces while raising demand for elder care and health workers. While a protracted period of slow growth in advanced economies could dampen demand for foreign workers in the near to medium term, demographic factors are likely to dominate over the longer run.
C. Impact on Business Cycle
13. Compared to its ASEAN peers, the Philippines has exhibited greater growth stability during the past two decades. In the 1980s, Philippine GDP growth was the most volatile in the region. However, during 1990−2011, a period encompassing the Asian crisis and the global financial crisis, volatility in peer countries increased, while volatility in the Philippines declined significantly, and fell below that of its neighbors. This raises the question of whether remittances contributed to this stabilization. In a cross country context, Chami and others (2009) find that remittances dampen the volatility of output growth in recipient countries. This stabilizing effect could occur through the balance of payments financing channel and/or the consumption smoothing channel.
Balance of Payments Financing
14. Compared to other sources of foreign exchange, remittances appear to be among the least sensitive to economic shocks. In fact, remittances could even be countercyclical if they are motivated by an altruistic desire to protect the welfare of recipients. There is some evidence of such behavior during the 1997−98 Asian crisis, when remittances in dollars terms increased by around 30 percent annually, but then slowed sharply after the crisis.
PHILIPPINES
INTERNATIONAL MONETARY FUND 23
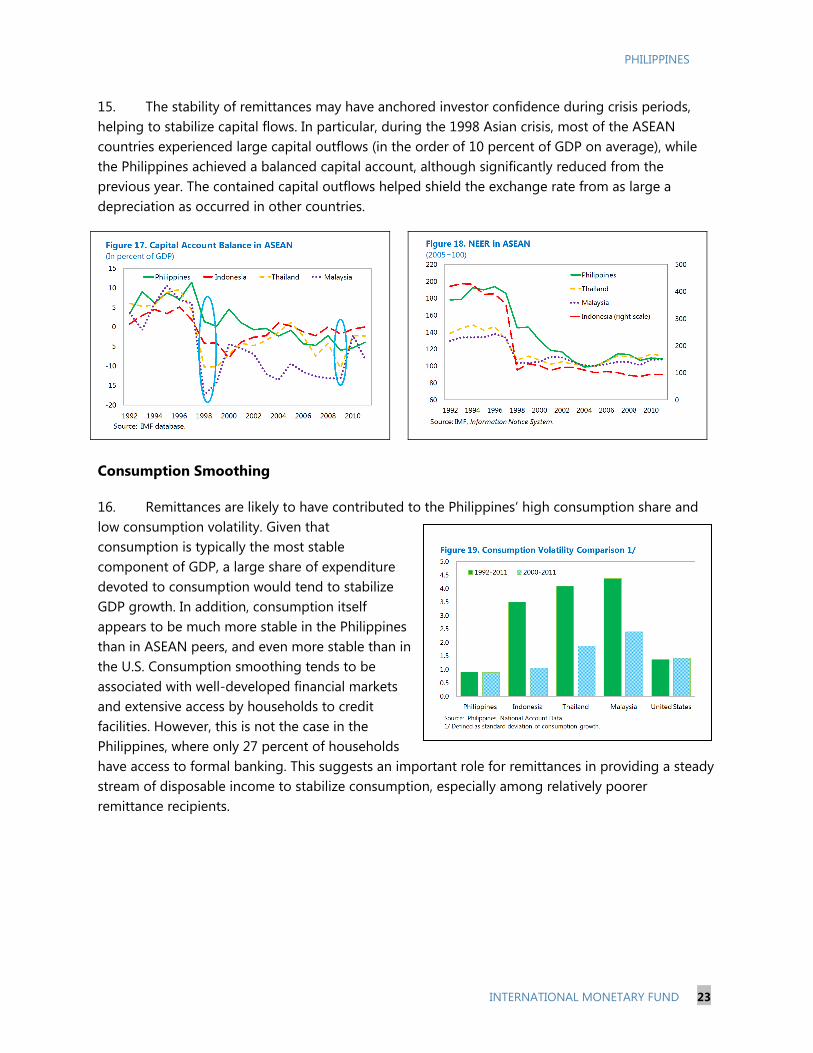
15. The stability of remittances may have anchored investor confidence during crisis periods, helping to stabilize capital flows. In particular, during the 1998 Asian crisis, most of the ASEAN countries experienced large capital outflows (in the order of 10 percent of GDP on average), while the Philippines achieved a balanced capital account, although significantly reduced from the previous year. The contained capital outflows helped shield the exchange rate from as large a depreciation as occurred in other countries.
Consumption Smoothing
16. Remittances are likely to have contributed to the Philippines’ high consumption share and low consumption volatility. Given that consumption is typically the most stable component of GDP, a large share of expenditure devoted to consumption would tend to stabilize GDP growth. In addition, consumption itself appears to be much more stable in the Philippines than in ASEAN peers, and even more stable than in the U.S. Consumption smoothing tends to be associated with welldeveloped financial markets and extensive access by households to credit facilities. However, this is not the case in the Philippines, where only 27 percent of households have access to formal banking. This suggests an important role for remittances in providing a steady stream of disposable income to stabilize consumption, especially among relatively poorer remittance recipients.

PHILIPPINES
24 INTERNATIONAL MONETARY FUND
17. It is also noteworthy that private consumption behaved differently during the two financial crises, which may reflect differences in the nature of the shocks. During the Asian crisis, private consumption remained very robust, growing above 4 percent. At that time, remittances were countercyclical, and grew at an annual rate of 30 percent.12 In contrast, during the 2008 financial crisis, consumption growth weakened substantially, alongside a slowdown in remittances, which were impacted by the global reach of the financial crisis.
12 Some of this increase may reflect the introduction of a new reporting system for remittances in 1998.

PHILIPPINES
INTERNATIONAL MONETARY FUND 25
References Barajas, Adolfo, Ralph Chami, Dalia S. Hakura, and Peter Montiel, 2010, “Workers’ Remittances and
the Equilibrium Real Exchange Rate: Theory and Evidence,” IMF Working Paper No. 10/287 (Washington: International Monetary Fund).
Burgess, Robert, and Vikram Haksar, 2005, “Migration and Foreign Remittances in the Philippines,”
IMF Working Paper No. 05/111 (Washington: International Monetary Fund). Clemens, Michael, Claudio E. Montenegro, and Lant Pritchett, 2008, “The Place Premium: Wage
Differences for Identical Workers across the U.S. Border,” Center for Global Development Working Paper No. 148 (Washington).
Chami, Ralph, Dalia Hakura, and Peter Montiel, 2009, “Remittances: An Automatic Output
Stabilizer?,” IMF Working Paper No. 09/91 (Washington: International Monetary Fund). Ducanes, Geoffrey, and Manolo Abella, 2008, “Overseas Filipino Workers and Their Impact on
Household Poverty,” ILO Asian Regional Programme on Governance of Labour Migration Working Paper No. 5 (Bangkok, Thailand: International Labour Organization, ILO Regional Office for Asia and the Pacific).
Durdu, Ceyhun Bora, and Serdar Sayan, 2008. "Emerging Market Business Cycles with Remittance
Fluctuations," International Finance Discussion Papers No. 946 (Washington: Board of Governors of the Federal Reserve System).
Pernia, Ernesto M., 2011, “Is Labor Export Good Development Policy”, The Philippine Review of
Economics, Vol. 48, No. 1, pp. 13−34. Tuaño Amador, Ma. Cyd N., Racquel A. Claveria, Ferdinand S. Co, and Vic K. Delloro, 2007,
“Philippine Overseas Workers and Migrants’ Remittances: the Dutch Disease Question and the Cyclicality Issue,” Bangko Sentral Review (Manila: Bangko Sentral ng Pilipinas).