international petrochemical industry forum...rongsheng i 6.sinochem qz 10.sinopec gulei...
TRANSCRIPT

Confidential. © 2018 IHS Markit®. All Rights Reserved.Confidential. © 2018 IHS MarkitTM. All Rights Reserved.
International Petrochemical
Industry Forum13 September 2018 | Chengdu, China
Paul Pang
Vice President \ IHS Markit\ APAC Oil, Mid-down Streams, and Chemical
+86 21 24229016

Confidential. © 2018 IHS Markit®. All Rights Reserved.
Asia Chemical Industry Overview

Confidential. © 2018 IHS Markit®. All Rights Reserved.© 2017 IHS Markit
Asia is by far the largest market
Rest of World45%
China36%
Japan3%
Korea4%
Taiwan2%
Singapore1%
Thailand2%
Malaysia1%
Indonesia1%
Philippines0%
Vietnam0% India
5%
Benzene8%
PX7%
Ethylene25%
Propylene17%
MEOH13%
PVC9%
Caustic12%
Soda Ash9%
World total demand in 2018 = 639 million tons

Confidential. © 2018 IHS Markit®. All Rights Reserved.© 2017 IHS Markit
Asia market is a very diversified
Demand in 2018 (million Tons)
Gro
wth
Rate
(%, 2
01
3-1
8)
China
India
Indonesia
Thailand
Philippines
Taiwan
Malaysia
Korea
Singapore
Japan
(5.0)
0.0
5.0
10.0
0.00 100.00 200.00 300.00

Confidential. © 2018 IHS Markit®. All Rights Reserved.© 2017 IHS Markit
0
100
200
300
400
2012 2013 2014 2015 2016 2017 2018 2019 2020 2021 2022 2023 2024 2025
Japan Korea Taiwan China
Mill
ion ton
China is the only growing country in Northeast Asia
Demand

Confidential. © 2018 IHS Markit®. All Rights Reserved.© 2017 IHS Markit
Southeast Asia/India is growing but from a small base
0
10
20
30
40
50
60
70
80
90
100
2012 2013 2014 2015 2016 2017 2018 2019 2020 2021 2022 2023 2024 2025
Singapore Thailand Malaysia Indonesia Philippines Vietnam India
Mill
ion T
on
Demand

Confidential. © 2018 IHS Markit®. All Rights Reserved.© 2017 IHS Markit
SEA: Multiple projects are constructed or planned
-
1
1
2
2
3
3
4
4
2019 2020 2021 2022 2023 2024 2025
Singapore Thailand Malaysia
Indonesia Philippines Vietnam
Million Ton
Capacity addition
PRPC (2019)
Ethylene: 1,260 KTA
Propylene: 1,200 KTA
Long Son (2023)
Ethylene: 1,000 KTA
Propylene: 500 KTA
PTTGC(2021)
Ethylene: 500 KTA
Propylene: 250 KTAHengyi PC (2020)
PX: 1,500 KTA
Bz: 550 KTA
Nghi Son PC (2018)
PX: 700 KTA
Bz: 250 KTA

Confidential. © 2018 IHS Markit®. All Rights Reserved.© 2017 IHS Markit
India: quiet but there likely be more projects coming after 2020
HPCL Mittal Energy(2022)
Ethylene: 1,200 KTA
Propylene: 500 KTA

Confidential. © 2018 IHS Markit®. All Rights Reserved.
China Highlight

Confidential. © 2018 IHS Markit®. All Rights Reserved.
Evolution of policy: opening up but gradual
Launch discharge
permitting system
NOV
2019 20202017 20182015 20162013 201420122007
Deregulate most
investment in chemical;
Restrict less than 1000
KTA refining to JV with
local majority share
JAN
Started opening FDI
in oil / gas, and
Petrochemicals
OCT
Deregulate
refining/
chemical FDI;
deregulate
crude import
FEB
Deregulate
approval
system
JAN
Completely deregulate
refining/chemical;
restrict FDI in oil / gas
upstream to JV only
JULY
Launch nationwide
CO2 trading
DEC Environment
protection tax
JAN ???
Carbon
tax

Confidential. © 2018 IHS Markit®. All Rights Reserved.
• Policy change paves way for private investment
• Private companies are more nimble and efficient
• Strong entrepreneurship
• Grow big to survive: eat or be eaten
Private investment is leading the growth
Product: olefins, PX, Bz, PTA, MEOH, MEG, Caustic, soda ash
Percent of capacityCapacity (million ton)
0%
20%
40%
60%
80%
0
100
200
300
400
2000 2002 2004 2006 2008 2010 2012 2014 2016 2018 2020 2022
Sinopec PetroChina CNOOC Foreign
Local Private
Capacity Comparison between SOEs and Private
Private & Local

Confidential. © 2018 IHS Markit®. All Rights Reserved.
Capital investment in billion US$
© 2018 IHS MarkitSource: IHS Markit
Conventional petrochemical leads growth again
• Coal chemicals
– High CAPEX
– High emission
– Less policy incentives
– Competitive cash cost
• Conventional
– High profitability
– Lowered entry barriers
0
5
10
15
20
25
30
2012 2013 2014 2015 2016 2017 2018 2019 2020 2021 2022
CTO/CTP MTO PDH CTMEG PX Cracker
Petrochemical
Unconventional

Confidential. © 2018 IHS Markit®. All Rights Reserved.
17%
North America
Commodity and specialty chemicals by value
• Strong in commodity but weak in
specialty
• Short-term focus investment strategy
• Short history in the business
• Insufficient investment into R&D, due
to poor IP protection
Commodity versus specialty
Source: IHS Markit
8%
China
Specialty Commodity© 2018 IHS Markit

Confidential. © 2018 IHS Markit®. All Rights Reserved.
North & Northeast
Middle & West
South
East
A wave of integrated refining / petrochemical complexes
8.Wanhua
Chemical
2.SP
Chemicals
Standalone light feed cracker
4.Sinopec
Wuhan
14.Panjin-
Aarmco
7.Shandong
Yuhuang
9.Hengli PC
13.Shenghong
PC
12.Zhejiang PC-
Rongsheng II
3.Zhejiang PC-
Rongsheng I
6.Sinochem QZ
10.Sinopec Gulei
1.CNOOC-
SHELL
11.Sinopec
Hainan
5.Sinopec/
KPC
Integrated complex
Capacity addition (2018-2021), million ton
0
30
60
90
120
Refinery CDU
0
5
10
15
20
C2 C3 PX

Confidential. © 2018 IHS Markit®. All Rights Reserved.
817
≥42
0%
20%
40%
60%
80%
100%
Global Refinery 2016 Petro Rabigh Hengli Refinery-PX
Others Jet/Kerosene Diesel Gasoline Chemicals
Refinery product yields
NaphthaNaphtha
All chemicals
A New China
Refinery/Petrochemical Complex

Confidential. © 2018 IHS Markit®. All Rights Reserved.
In operation
Under construction
China
Mongolia
South Korea
CTO projects
No. Name Cap./KTA Startup Status
1 SXYCPC-Yan'an E&C 700 Mid-2018 Constructing
2 Huating Coal Group 200 Apr-2018 Constructing
3 Baofeng Energy phase 2 600 Nov-2019 Constructing
4 Zhong'an Coal Chem. 600 Oct-2019 Constructing
5 Shanxi Coking Corp. 600 Apr-2020 Constructing
6 Yulin Energy & Chem. 600 Apr-2020 Constructing
7 Qinghai Damei 600 Mid-2021 Constructing
Total 3,900
1 Baotou Shenhua 630 Apr-2022 Planning
2 Qinghai Mining 670 Mid-2022 Planning
3 Sinopec Zhijin 600 2022 Planning
4 Shenhua Ningmei&SABIC 700 Jul-2023 Planning
5 China Coal Yuheng 600 Mid-2023 Planning
6 CPI/Total JV 890 2024 Planning
7 Sinopec Hebi 600 2024 Planning
Total 4,690

Confidential. © 2018 IHS Markit®. All Rights Reserved.
A wave of CTMEG projects is coming
Capacity KTA On stream
1 CNSG Hong Si Fang 300 2018
2 ECO Coal Chemical 240 2018
3 Jiutai 100 2018
4 Yongjin Xinxiang 200 2018
5 Xinjiang Tianye 100 2018
6 Xinhang Energy 100 2018
7 Xinjiang Tianying 150 2018
8 Qianxi 300 2018
9 Hualu Hengsheng 500 2019
10 Huiteng Energy 400 2019
11 Xiangkuang Hongtong 200 2019
12 Binzhou Chem 300 2019
13 Connel 300 2019
14 Xinjiang Tianye 600 2020
Total 3,790
Coal-based
Existing CTMEG capacity 2,075 KTA
Planned capacity > 5,000 KTA

Confidential. © 2018 IHS Markit®. All Rights Reserved.
• Nation-wide carbon trading
• “Gas for coal” in “2+26” regions
• Enforcement of new regulations
• Ban on waste imports
Pollution issue: too serious to be ignored further

Confidential. © 2018 IHS Markit®. All Rights Reserved.
Ban on waste import: a big impact in recycling materials
© 2018 IHS MarkitSource: IHS MarkitDomestic Import
0
2
4
6
8
10
12
2000 2003 2006 2009 2012 2015 2018
China recycled PE/PP consumption, million ton
Ban waste
import
Confidential. © 2018 IHS Markit®. All Rights Reserved.
Trade Friction between
China & America

Confidential. © 2018 IHS Markit®. All Rights Reserved.
The U.S. has trade deficit with many countries
-400
-350
-300
-250
-200
-150
-100
-50
0
US merchandise trade balance with selected countries, 2017

Confidential. © 2018 IHS Markit®. All Rights Reserved.
China and U.S. trade balance
China America
Bil. USD % GDP Bil. USD % GDP
GDP 12,217 19,391
Commodity export 2,280 18.7 1,546 8.0
Commodity import 1,832 15.0 2,343 12.1
Net export 448 3.7 -797 -4.1
Export to US/China 434 3.6 130 0.7
Date sources: Trade date from IMF,GDP data from IHS Markit
Note: Corresponding export and import data between trading partners are frequently inconsistent in the IMF Direction of Trade database, due to
“difference in 1) classification concepts and detail, 2) time of recording, 3) valuation, and 4) coverage, as well as 5) processing errors”.Source: http://datahelp.imf.org/knowledgebase/articles/484353-why-do-the-exports-of-country-a-to-country-b-not-e
Confidential. © 2018 IHS Markit®. All Rights Reserved.
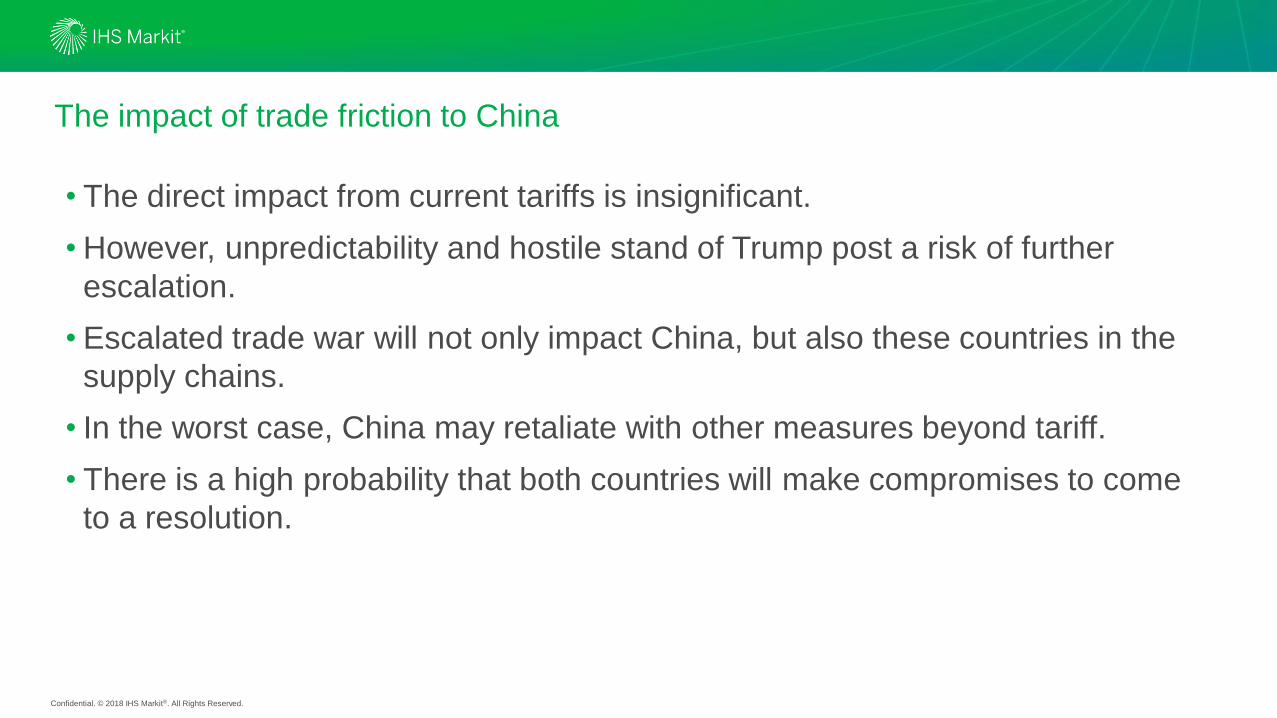
The impact of trade friction to China
• The direct impact from current tariffs is insignificant.
• However, unpredictability and hostile stand of Trump post a risk of further
escalation.
• Escalated trade war will not only impact China, but also these countries in the
supply chains.
• In the worst case, China may retaliate with other measures beyond tariff.
• There is a high probability that both countries will make compromises to come
to a resolution.

Confidential. © 2018 IHS Markit®. All Rights Reserved.
Key takeaway
•Strong margins supporting acceleration in new capacity
additions.
•Asia chemical industry is very diversified, and continues to be
the fastest growing region.
•China will continue driving global demand and capacity
expansion.
•Threats to the positive outlook include escalating protectionist
trade rhetoric, geo-politics, rising energy costs….

IHS Markit Customer Care
Americas: +1 800 IHS CARE (+1 800 447 2273)
Europe, Middle East, and Africa: +44 (0) 1344 328 300
Asia and the Pacific Rim: +604 291 3600
Disclaimer
The information contained in this presentation is confidential. Any unauthorized use, disclosure, reproduction, or dissemination, in full or in part, in any media or by any means, without the prior written permission of IHS Markit Ltd. or any of its aff iliates ("IHS Markit") is
strictly prohibited. IHS Markit owns all IHS Markit logos and trade names contained in this presentation that are subject to license. Opinions, statements, estimates, and projections in this presentation (including other media) are solely those of the individual author(s) at the
time of writing and do not necessarily reflect the opinions of IHS Markit. Neither IHS Markit nor the author(s) has any obligation to update this presentation in the event that any content, opinion, statement, estimate, or projection (collectively, "information") changes or
subsequently becomes inaccurate. IHS Markit makes no warranty, expressed or implied, as to the accuracy, completeness, or timeliness of any information in this presentation, and shall not in any way be liable to any recipient for any inaccuracies or omissions. Without
limiting the foregoing, IHS Markit shall have no liability whatsoever to any recipient, whether in contract, in tort (including negligence), under warranty, under statute or otherwise, in respect of any loss or damage suffered by any recipient as a result of or in connection with
any information provided, or any course of action determined, by it or any third party, whether or not based on any information provided. The inclusion of a link to an external website by IHS Markit should not be understood to be an endorsement of that website or the site's
owners (or their products/services). IHS Markit is not responsible for either the content or output of external websites. Copyright © 2018, IHS Markit®. All rights reserved and all intellectual property rights are retained by IHS Markit.
25