international reinsurance pricing and challenges casualty actuarial society seminar on ratemaking...
TRANSCRIPT
International Reinsurance Pricing and Challenges
Casualty Actuarial Society
Seminar on Ratemaking
March 9 - 10, 2000

Agenda
EQECAT Overview Catastrophe Modeling Overview Pricing and Challenges
— Exposure Data Cresta level information Limited, if any, structural information
— Modeling Data Varies from Country to Country Soil Information Terrain Information Building Vulnerabilities Frequency & Severity of events

EQECAT
Leading provider of Consulting Services and Catastrophe Modeling Software to the Insurance Industry and Financial Community
EQECAT was founded in 1994 and is a wholly owned subsidiary of EQE International.
Headquartered in Oakland
Other offices in Irvine, Philadelphia, Boston, London, Paris, Sydney and Tokyo
Note: EQE has been providing Software and Consulting Services to the Insurance Industry since
1986.

Top U.S. Risk Management Consultants
1. PricewaterhouseCoopers$60,840,000 2,645209
2. Arthur Andersen $54,647,759 861198
3. Deloitte & Touche L.L.P.$54,300,000 1,000334
4. EQE INTERNATIONAL $42,300,000 1,100250
5. Ernst & Young L.L.P. $31,038,000 900170
6. Tillinghast-Towers Perrin$28,356,000 85071
1998 Total Risk Mgmt.Company Revenues Clients Professionals
Reference: Business Insurance, February 1999
(Ranked by risk management consulting services)

EQECAT
Over 45 companies license EQECAT’s software— Primary Insurance Companies — Reinsurance Companies— Global Insurers (Non-US)— Brokers and Financial Institutions
EQECAT has worked with over 100 insurance companies on a consulting basis— Portfolio Analysis— Pricing and Product Analysis— Education & Training— Claims & Loss Control Support— Securitization

Securitization Experience
California Earthquake Authority (1996) SR Earthquake Fund, Ltd. (1997) Parametric Re (1997) Mitsui Marine (1998) Hedge Financial Products (CNA
Insurance) (1998) Concentric Ltd./Circle Maihama Ltd.
(Oriental Land)(1999). Namazu Re (Gerling Global
Reinsurance) (1999)

EQECAT
Geographic Areas: — United States
Earthquake - All 50 States + Puerto Rico Hurricane - Gulf Coast & Eastern Seaboard,
Hawaii & Puerto Rico
— International - (Earthquake, Windstorms, Flood) Over 70 countries including: Canada, UK,
Western Europe, Eastern Europe, Japan, Caribbean, Israel, Italy, Philippines, Chile, Australia, New Zealand, Mexico, Taiwan, Indonesia and Turkey

Catastrophe Modeling Overview

Catastrophe Modeling Methodology
First Step - Define the Hazard
HURRICANECentral PressureRadius to Max WindTranslational SpeedWind FieldTerrain
HURRICANECentral PressureRadius to Max WindTranslational SpeedWind FieldTerrain
FAULTStrike-slipThrustMax. MagnitudeRupture LengthDuration
FAULTStrike-slipThrustMax. MagnitudeRupture LengthDuration

Catastrophe Modeling Methodology
Second Step - Overlay Portfolio
Individual Risk InformationLocationConstruction type AgeInsured value
Individual Risk InformationLocationConstruction type AgeInsured value
Individual Locations

WIND SPEEDCalculated for each LocationVw = f(Pc, d, regional topography)
WIND SPEEDCalculated for each LocationVw = f(Pc, d, regional topography)
GROUND MOTION Calculated for each LocationPGA=f(M1,d,regional geology)MMI = f(PGA, soil)
GROUND MOTION Calculated for each LocationPGA=f(M1,d,regional geology)MMI = f(PGA, soil)
Local Site Factors (Terrain/Soil)
Distance (d)
Catastrophe Modeling Methodology
Third Step - Determine Site Hazard Severity

Catastrophe Modeling Methodology
Fourth Step - Estimate Ground up Damage
Hazard Severity
Vulnerability FunctionsCalculated damage for each Location

PDF Probability density function of damage
Distribution of damagebased on hazard severity
Distribution of hazardseverity at the site
Intensity
Damage Calculation Uncertainty Reflected in Damage
Estimate
Dam
age

Catastrophe Modeling Methodology
Step Five - Compute Insured Loss
Insurance Data- Insured value- Deductible- Occurrence, site & policy limits- Facultative- Treaties
Insurance Data- Insured value- Deductible- Occurrence, site & policy limits- Facultative- Treaties
site & policy losses

Loss
Pro
bab
ilit
y
Deductible
DamageDistribution
Catastrophe Modeling Methodology
Compute Insured Loss

Catastrophe Modeling Methodology
Portfolio Results
Statistically combine individual results taking Correlation into account— Correlation of performance is a real issue
It is computationally intense It lengthens the tail of the curve
— PML understated without correlationPDF
$ Dmg
Ret. 20%
Ded
uctib
le
Reten
tion
Ret.
40%
Rein
suran
ce
60%
Rein
s.
40%
Rein
s.
40%
Rein
s.
50%
Rein
s.
50%
Reten
tion

Catastrophe Modeling Methodology
Probabilistic Analysis
Requires the development of a extensive Stochastic Event Set
Repeat analysis process for Events 1 through N
The above analysis enables the development of the Annual Loss and Loss Distribution
Event 1 Freq 1 Dmg 1 Loss 1Event 2 Freq 2 Dmg 2 Loss 2
: : : :: : : :
Event N Freq N Dmg N Loss N

International Reinsurance Pricing and Challenges

International Reinsurance Pricing and Challenges
Exposure Data— Cresta level information— Limited, if any, structural information
Modeling Data Varies from Country to Country— Soil Information— Terrain Information— Building Vulnerabilities
Building Codes Building Practices Code Enforcement
— Frequency & Severity of events (Stochastic event set)

Premiumby country, etc. Decreasing
Uncertainty
IncreasingQualityof Data Cresta
ZonesOccupancy
(Residential,Commercial)
Premiumor TSI
PostalCode
Standard StructuralClassification
TSI/Risk
Address,Log/Lat, etc.
Material, age, height, engineering report, etc.
Value, limits, ded., etc.
Specificaddress
DetailedOccupancy Codes
TSI, value, limits, etc.
Location Structural Insurance
Exposure Data

Level of Data Impacts Pricing
Cresta Prefecture
Ku Shi

Aggregate vs. Detail Data
Japan Typhoon
0.00
0.10
0.20
0.30
0.40
0.50
0.60
0.70
0.80
0.90
1.00
Cresta Miyazaki-ken Kagoshima-ken Kumamoto-ken Fukuoka-een Oita-ken Saga-ken
Prefectures within Cresta Zone
Rat
e p
er
$1,0
00
Pricing varies significantly within a Cresta Zone
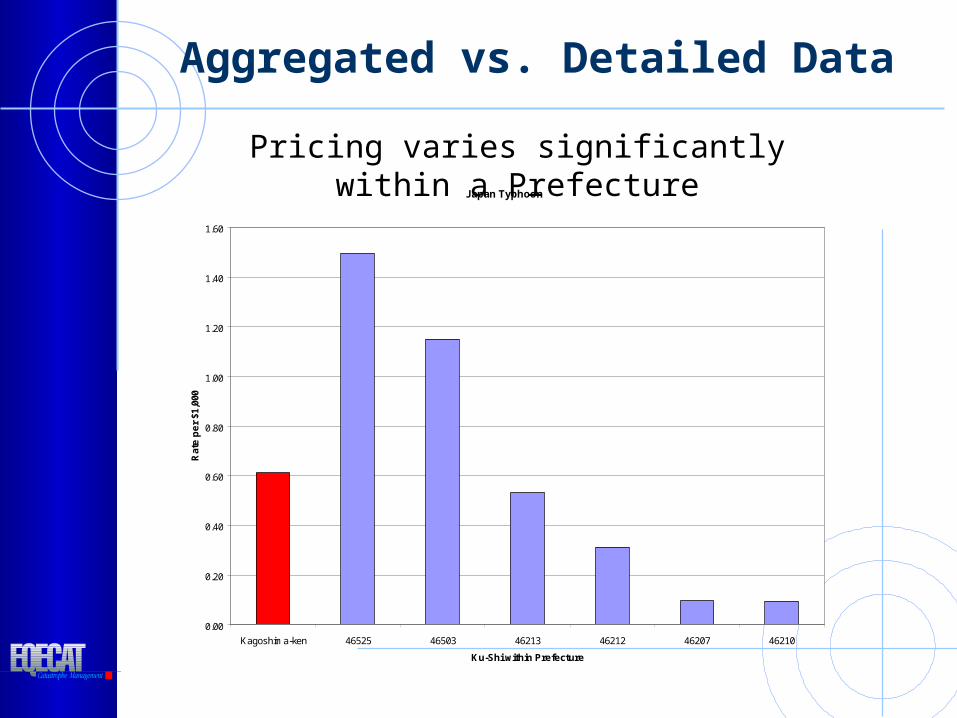
Aggregated vs. Detailed Data
Japan Typhoon
0.00
0.20
0.40
0.60
0.80
1.00
1.20
1.40
1.60
Kagoshima-ken 46525 46503 46213 46212 46207 46210
Ku-Shi within Prefecture
Rat
e p
er
$1,0
00
Pricing varies significantly within a Prefecture
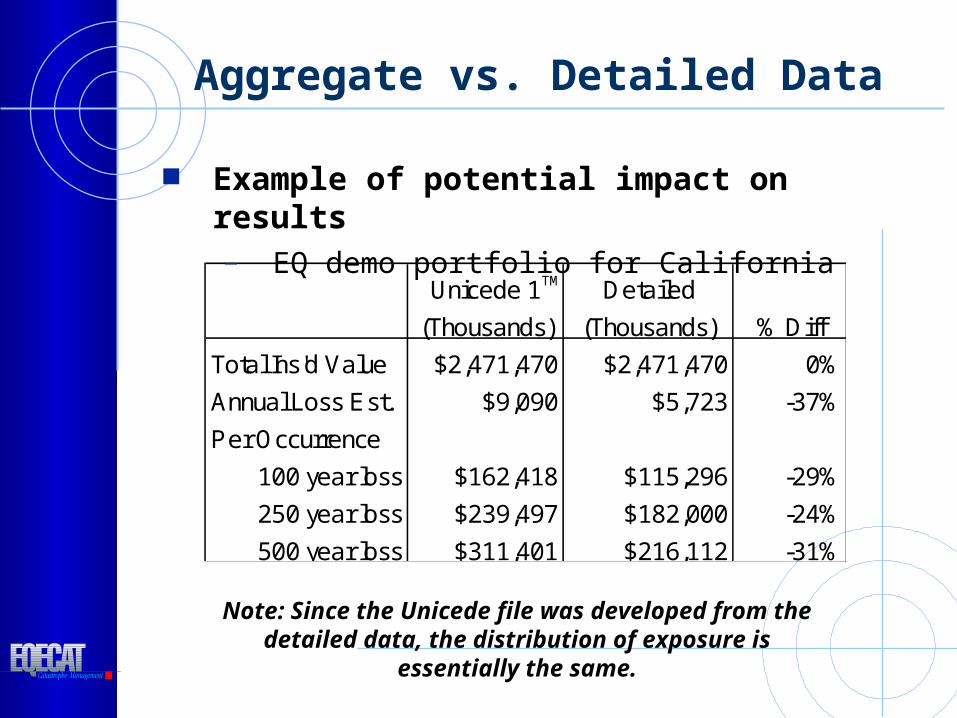
Aggregate vs. Detailed Data
Unicede 1 Detailed
(Thousands) (Thousands) % Diff
Total Ins'd Value $2,471,470 $2,471,470 0%
Annual Loss Est. $9,090 $5,723 -37%
Per Occurrence
100 year loss $162,418 $115,296 -29%
250 year loss $239,497 $182,000 -24%
500 year loss $311,401 $216,112 -31%
Example of potential impact on results— EQ demo portfolio for California
Note: Since the Unicede file was developed from the detailed data, the distribution of exposure is essentially the same.
TM

Structural Information

Impact of Structure Type
Building performance varies significantly from one building type to another
Vulnerability functions are used to develop damage estimates which are structure specific

Impact of Structure Type
Japan Aggregate Loss Distribution
400
600
800
1,000
1,200
1,400
1,600
99.00 99.10 99.20 99.30 99.40 99.50 99.60 99.70 99.80 99.90
Probability of Non-Exceedance
Lo
ss (
$ T
ho
usa
nd
s)
Structure Type 6 Structure Type 3
• Rate per $1,000 Structure Type 6 = 0.50• Rate per $1,000 Structure Type 3 = 0.17

Critical Modeling Data Varies from Country to Country
1:24,000
Taiwanby SoilType
SbSb-cScSc-dSdW
1:500,000
Section of LA
TaiwanCritical modeling data includes soil, terrain, frequency & severity of events, etc.

Adapazari - near total damage due to poor soil and
liquefaction.
Impact of Soil on Pricing
August 17, 1999 Izmit, Turkey
(M7.4 Earthquake)

Impact of Soil on Pricing
San Diego, CA 92118Annual Aggregate Loss Distribution
0.0%
5.0%
10.0%
15.0%
20.0%
25.0%
30.0%
99.00 99.10 99.20 99.30 99.40 99.50 99.60 99.70 99.80 99.90
Probability of Non-Exceedance
PM
L
Soft Soil Stiff Soil Hard Rock
Rate per $1,000
Soft Soil - $4.80 Stiff Soil - $2.70 Hard Rock - $0.40

Impact of Terrain (Friction) on Pricing
Loss CostsStructure Type 1 - Frame
$1000 Deductible
Loss CostsStructure Type 1 - Frame
2 % Deductible

Building Codes
Taiwan— Building with height less than
50 meters No dynamic analysis is
required No third party review (by a
committee) is required Geotechnical engineers are
not required if the excavation is less than 10 meters deep
— Architects are in charge of planning, design, and construction inspection
Building practice varies from country to country

Building Codes/Practices
Most of the damaged high rise buildings in Taiwan were round 12 stories (less than 50 m high)
September 21, 1999 ChiChi, Taiwan (M7.6 Earthquake)

New high-end buildings (they “were” built to the California code)!
Building Code Enforcement
August 17, 1999 Izmit, Turkey (M7.4 Earthquake)

Earthquake Frequency and Severity
Western U.S. EarthquakesUSGS Catalog, Mw, Mmin = 5.0
5 to 6 (499)6 to 7 (134)7 to 8.2 (26)
Eastern U.S. EarthquakesUSGS Catalog, Mw, Mmin=4.0
4 to 5 (208)5 to 6 (23)6 to 7 (4)
7 to 8.3 (4)
TAITUNG
SUAO
TAIPEI
ILAN
HUALIEN
KAOSHIUNG
TAINAN
CHIAI
HSINCHU
Earthquakes in the Region of TaiwanMw Magnitude
4 to 55 to 66 to 7
7 to 8
8 to 8.1
Since earthquake are felt and measured around the world the historical data is fairly good for most countries.
Taiwan
U.S.
However, information on fault location, type and other characteristics varies. This is an issue since major earthquakes are infrequent events

Typhoon/Hurricane Frequency and Severity
Hurricane data is good for major industrialized countries, but largely antidotal for most other countries.

Conclusion
International Reinsurers are working with very limited data which can skew or bias results
Ability of models to effectively develop loss cost varies from country to country
There is a lot of uncertainty in the process which must be accounted for in reinsurance pricing
There are also other issues, not touched on in this presentation, that can impact results (e.g., Damage to Loss calculation, handling of uncertainty, etc.)In spite of the above, Catastrophe models are still the In spite of the above, Catastrophe models are still the
best tool available for pricing reinsurance. best tool available for pricing reinsurance.