international relations and cooperation budget/2015... · the minister of international relations...
TRANSCRIPT

VOTE 6ESTIMATES OF NATIONAL EXPENDITURE
Photos provided by GCIS.
INTERNATIONAL RELATIONS AND COOPERATION


Estimates of
National Expenditure
2015
National Treasury
Republic of South Africa
25 February 2015

ISBN: 978-0-621-43285-5 RP: 08/2015 The 2015 Estimates of National Expenditure e-publications are compiled with the latest available information from departmental and other sources. Some of this information is unaudited or subject to revision. The Estimates of National Expenditure e-publications for individual votes are available on www.treasury.gov.za. Compared to the abridged version of the 2015 ENE, the 2015 ENE e-publications provide more detailed information, including on goods and services, transfers and subsidies, as well as on programme specific personnel expenditure. The abridged version of the ENE contains one additional table at the end of a chapter that shows expenditure on infrastructure, whereas the vote ENE e-publications’ additional tables also contain summaries of expenditure on conditional allocations to provinces and municipalities; departmental public private partnerships; and donor funding. Budget information is also provided for the public entities that are not shown in detail in the abridged publication. In some e-publications more detailed information at the level of site service delivery is included.

Foreword
Some of the tough economic conditions occasioned by the 2008 to 2009 global financial crisis continue to plague most parts of the world: Economic growth remains sluggish, unemployment and inequality levels are elevated, while financial markets tend to reposition themselves substantially at the slightest sign of unsettling news. As an open economy, South Africa is highly susceptible to global economic developments, often disproportionately so. In the face of all of this, the 2015 Medium Term Expenditure Framework (MTEF) response provides for positive real growth in expenditure averaging 2.1 per cent per year. The annual budget reaches R1.6 trillion by 2017/18.
True to the commitment government made in the Medium Term Budget Policy Statement (MTBPS) in October 2014, the budget framework sets out departmental programmes and plans that fit within the broad expenditure envelope published last year. To keep our fiscal accounts firmly on a sustainable path, the MTBPS proposed a fiscal policy package that has trimmed overall spending by R25 billion, which is the combined amount for 2015/16 and 2016/17. Government spending does continue to surpass inflation after these adjustments in both years, but growth is marginally slower. In addition, for 2017/18, R45 billion is placed in an unallocated reserve to cushion our plans against unforeseeable eventualities. Further, to achieve our fiscal objectives, government has had to institute carefully selected tax measures too. These are implemented within the framework of a progressive tax system and have been informed by the work of the Davies Tax Committee. The tax proposals are set out in detail in chapter 4 of the Budget Review.
The process of realigning expenditure in response to the closing of the fiscal space is being actively managed, in the context of government’s 2014-2019 medium term strategic framework. Some of our aspirations might take longer to realise. Within government’s institutions, more urgent and essential existing programmes are being prioritised above other programmes that are reduced. The implementation of some newly proposed programmes will either be phased in over a longer period or, in some cases, possibly even delayed. Social sector spending and key infrastructure spending, as well as other key areas of spending, continue to grow in real terms.
In addition to the reprioritisation of government programmes, the policy frameworks and implementation methodology of programmes are being re-evaluated, with a focus on service delivery of programmes. In line with the 2013/14 National Treasury instruction on cost containment measures, financing programmes must entail a greater share of goods and services budgets being devoted towards core areas of service delivery. The focus of government programmes is being sharpened, both in terms of spatial distribution, and in terms of their nature and emphasis. Effectiveness and efficiency of expenditure is our guiding mantra.
The spending plans contained in the 2015 Budget do respond to our short term needs for economic growth. However, to achieve our ambition of faster growth, which we unquestionably need for pushing back the frontiers of unemployment, poverty and inequality, we must continue to strive towards shifting the composition of expenditure more towards investment, away from consumption. Institutional spending, as always, is being closely monitored, and the ongoing process of realignment continues. The details of the spending of national government departments and its entities are encompassed in the chapters of this publication.
All the expenditure and service delivery information contained in the chapters of this publication result from a wide ranging intergovernmental consultative process, leading to executive approval of reprioritised and realigned spending allocations. Many people have contributed to making this publication possible, particularly my colleagues in national departments and agencies. Their collaboration and understanding during the budget allocation and document drafting processes has been invaluable. Appreciation is also due to the dedicated team at National Treasury for the publication of this highly valuable resource.
Lungisa Fuzile Director-General: National Treasury


Introduction
The Estimates of National Expenditure publications
The Estimates of national Expenditure (ENE) publications provide comprehensive information on how budget resources are generated, how institutions have spent their budgets in previous years, and how institutions plan to spend the resources allocated to them over the MTEF period. Key performance indicators are included for each national government vote and entity showing what the institutions aim to achieve by spending their budget allocations in a particular manner. This information provides Parliament and the public with the necessary tools to hold government accountable against the 14 outcomes set out in the 2014-2019 medium term strategic framework.
The 2015 ENE publications largely retain the scope of information presented in previous years’ publications. For ease of comprehension, however, in the 2015 publications information is presented in a more succinct and concise manner in data tables and their accompanying explanatory narratives. The reader can thus more readily understand what each institution is planning to spend its budget on and what it aims to achieve. Each chapter in the abridged 2015 ENE publication relates to a specific budget vote. A separate, more detailed, e-publication is also available for each vote.
Compared to the abridged version of the 2015 ENE, the 2015 ENE e-publications provide more detailed information, including on goods and services, transfers and subsidies, as well as on programme specific personnel expenditure. The abridged version of the ENE contains one additional table at the end of a chapter that shows expenditure on infrastructure, whereas the vote ENE e-publications’ additional tables also contain summaries of expenditure on conditional allocations to provinces and municipalities; departmental public private partnerships; and donor funding. Budget information is also provided for the public entities that are not shown in detail in the abridged publication. In some e-publications more detailed information at the level of site service delivery is included.
A separate 2015 ENE Overview e-publication is also available, which contains a description at the main budget non-interest spending level, summarising the ENE publication information across votes. The 2015 ENE Overview contains this narrative explanation and summary tables; a description of the budgeting approach; and also has a write-up on how to interpret the information that is contained in each section of the publications.


International Relations and Cooperation
National Treasury
Republic of South Africa

Contents
Budget summary ................................................................................................................................ 1
Vote purpose ....................................................................................................................................... 1
Mandate ............................................................................................................................................... 1
Selected performance indicators ...................................................................................................... 2
Expenditure analysis .......................................................................................................................... 2
Expenditure trends ............................................................................................................................. 4
Expenditure estimates ....................................................................................................................... 5
Personnel information ....................................................................................................................... 7
Departmental receipts ........................................................................................................................ 7
Programme 1: Administration ........................................................................................................... 8
Programme 2: International Relations .............................................................................................. 9
Programme 3: International Cooperation ........................................................................................ 11
Programme 4: Public Diplomacy and Protocol Services ............................................................... 13
Programme 5: International Transfers ............................................................................................ 15
Public entities and other agencies .................................................................................................. 17
Additional tables ................................................................................................................................ 20

1
Vote 6 International Relations and Cooperation Budget summary
2015/16 2016/17 2017/18
R million Total Current
payments Transfers and
subsidies Payments for capital
assets Total Total MTEF allocation Administration 1 418.5 1 167.0 1.2 250.3 1 468.7 1 535.3International Relations 2 931.7 2 897.2 4.4 30.0 3 131.4 3 304.0International Cooperation 466.9 464.9 0.0 2.1 483.5 512.2Public Diplomacy and Protocol Services 246.3 244.4 0.3 1.6 256.4 270.7International Transfers 635.2 – 635.2 – 603.5 921.1Total expenditure estimates 5 698.6 4 773.5 641.2 284.0 5 943.6 6 543.3Executive authority Minister of International Relations and Cooperation Accounting officer Director General of International Relations and Cooperation Website address www.dirco.gov.za The Estimates of National Expenditure e-publications for individual votes are available on www.treasury.gov.za. These publications provide more comprehensive coverage of vote specific information, particularly about goods and services, transfers and subsidies, personnel, public entities, donor funding, public private partnerships, conditional allocations to provinces and municipalities and expenditure information at the level of service delivery, where appropriate.
Vote purpose Formulate, coordinate, implement and manage South Africa’s foreign policy and international relations programmes.
Mandate According to the Constitution, the president is ultimately responsible for the foreign policy and international relations of South Africa. It is the president’s prerogative to appoint heads of mission, to receive foreign heads of mission, to conduct state to state relations, and to negotiate and sign all international agreements. International agreements that are not of a technical, administrative or executive nature will only bind the country after being approved by Parliament, which also approves the country’s ratification of or accession to multilateral agreements. All international agreements must be tabled in Parliament for information purposes.
The Minister of International Relations and Cooperation is entrusted with the formulation, promotion, execution and daily conduct of South Africa’s foreign policy.
The department’s overall mandate is to work for the realisation of South Africa’s foreign policy objectives. This is done by:
• coordinating and aligning South Africa’s international relations • monitoring developments in the international environment • communicating government’s policy positions • developing and advising government on policy options, and creating mechanisms and avenues for achieving
objectives • protecting South Africa’s sovereignty and territorial integrity • contributing to the creation of an enabling international environment for South African businesses • sourcing developmental assistance • assisting South African citizens abroad.

2015 Estimates of National Expenditure
2
Selected performance indicators
Table 6.1 Performance indicators by programme and related outcome Indicator Programme Outcome Past Current Projections 2011/12 2012/13 2013/14 2014/15 2015/16 2016/17 2017/18
Number of structured bilateral mechanisms to promote national priorities (the African Agenda and the Agenda of the South) per year
International Relations
Outcome 11: Create a better South Africa, a better Africa and a better world
–1 –1 42 34 34 34 34
Number of tourism promotional events hosted per year2
International Relations
–1 –1 –1 –1 67 67 67
Number of high level engagements coordinated to promote national priorities (the African Agenda and Agenda of the South) per year
International Relations
–1 –1 61 65 58 58 58
Number of economic diplomacy activities to attract investment, tourism and the development of cooperation per year:
International Relations
trade and investment seminars3 –1 –1 154 273 112 112 112engagements with chambers of commerce3 57 155 125 125 125Number of bilateral meetings held with targeted government ministries and high level potential investors per year
International Relations
–1 –1 72 34 150 150 150
Number of development cooperation initiatives held per year
International Relations
–1 –1 31 115 –4 –4 –4
Number of AU structures and processes used to promote peace and stability, socioeconomic development, good governance and democracy on the continent per year
International Cooperation
–1 –1 5 4 4 4 4
Number of NEPAD summits, working group meetings and processes supported with substance and logistics to enhance socioeconomic development on the continent per year
International Cooperation
–1 –1 4 4 4 4 4
Number of SADC structures and processes supported with substance and logistics to promote peace and stability, socioeconomic development, good governance, democracy and regional integration per year
International Cooperation
–1 –¹ 5 8 10 10 10
Percentage of requests for protocol services responded to per year
Public Diplomacy and Protocol Services
–5 –5 100%6 100% 100% 100% 100%
Percentage of requests for public diplomacy services responded to per year
Public Diplomacy and Protocol Services
–5 –5 100%(192)7
100% 100% 100% 100%
1. New indicator, hence no historical data. 2. This indicator relates to the tourism promotional events undertaken by the department where the Department of Tourism has no representation in a foreign mission. 3. The medium term performance targets were revised following the finalisation of the department’s mid-term budget and performance review for 2014/15. 4. From 2015/16, reporting on the indicator as a standalone will be discontinued from 2015/16 and integrated with the indicator for bilateral meetings held with targeted government ministries
and high level potential investors. 5. This indicator was revised and expressed as a percentage from 2013/14. 6. Requests for protocol services responded to: 9 international conferences; 28 555 dignitaries at the 3 state protocol lounges; 107 incoming and 95 outgoing visits; 2 972 protocol ceremonial
and hospitality services; and 214 incoming and outgoing international visits for provincial and local governments. 7. Professional coverage for 150 departmental activities and 42 media enquiries responded to per year.
Expenditure analysis The national development plan envisions South Africa as a globally competitive economy and an influential, leading member of the international community. The plan sees South Africa as promoting and contributing globally to sustainable development, democracy, the rule of law, human rights, and peace and security. Outcome 11 of government’s 2014-2019 medium term strategic framework (create a better South Africa, a better Africa and a better world) further articulates this vision of South Africa in the regional, African and international arenas.
South Africa’s foreign policy is aligned with these visions and objectives, and the Department of International Relations and Cooperation will continue over the medium term to sustain South Africa’s international economic and political relations and to participate in global governance forums. The department will also be enhancing its operational capacity.

Vote 6: International Relations and Cooperation
3
Sustaining economic and political relations and participating in global governance forums
The department will continue to participate in multilateral forums, including the African Union (AU) structures. Government’s 2014-2019 medium term strategic framework tasks the department with increasing the uptake of South Africa’s quota in AU structures over the medium term from 30 per cent (8 of 27 posts filled) to 60 per cent (16 posts filled).
The department remains committed to the consolidation of regional integration through participation in the Southern African Development Community (SADC) region, and will be involved over the medium term in reviewing the SADC regional indicative strategic development plan and in conceptualising the processes for establishing a free trade area, led by the Department of Trade and Industry.
The department also continues to promote post-conflict reconstruction and development and participate in political reform in the Great Lakes region. Over the medium term, this will include operationalising the tripartite agreement between South Africa, Angola and the Democratic Republic of the Congo in support of the peace and security framework agreement for the Great Lakes region, deploying the SADC intervention brigade in the Democratic Republic of the Congo, working with the Department of Defence to operationalise the AU peace and security architecture, and participating in the political processes to restore order and stability in the Central African Republic, the Democratic Republic of the Congo, Libya, Somalia and South Sudan.
These and other such activities are funded over the medium term from R9.4 billion in the International Relations programme and R1.5 billion in the International Cooperation programmes.
Enhancing the department’s operational capacity
Over the medium term, the department intends to redefine outgoing development cooperation. It has reviewed the current institutional and policy arrangements for outgoing development cooperation, and plans to table the Partnership Fund for Development Bill. The bill seeks to repeal the African Renaissance and International Cooperation Fund Act (2000) and provides the legislative framework for establishing the South African Development Partnership Agency to replace the fund. Cabinet approved budget reductions of R335.3 million in 2015/16, R467.1 million in 2016/17, and R168.5 million in 2017/18 are to be effected on non-essential goods and services, compensation of employees and the transfers to the African Renaissance and International Cooperation Fund. The fund has sufficient cash reserves to absorb the impact of the reductions and its operations will not be affected.
The department operates in a global environment, under conditions that are often significantly different from those defined by the policy context for the public service in South Africa. To address these differences, the department has reviewed the legislative framework governing its operations and intends to table the Foreign Services Bill over the medium term.
Both the outgoing development work and the work on the Foreign Services Bill are funded in the Administration programme.
The department’s international property portfolio consists of 133 state owned properties and 800 rented properties. Presently, the department spends approximately R575 million per year on leases in countries where it does not own properties. High rental costs are exacerbated in countries where the lease property market is poorly regulated. Over the medium term, the department will conduct a feasibility study on the viability of developing an acquisition and disposal strategy, including risk assessment and cost benefit analysis elements. The feasibility study will promote a shift towards property ownership over rental, and will contemplate different funding models, including public private partnerships. The aim is to bring coordination and sustainability to the department’s current acquisitions and disposals processes.
Over the medium term, the department will be completing the construction of chanceries and official residences in Tanzania, Malawi and the Netherlands. The department also intends to enter into public private partnerships for constructing chanceries on vacant state owned land in India, Saudi Arabia, Senegal, Mali, Botswana and Uruguay. Spending on infrastructure increased from R205.2 million in 2011/12 to R213.5 million in 2014/15, and is expected to increase to R223.7 million in 2017/18. The funding is earmarked for infrastructure development, the acquisition of land and buildings, and the renovation of refurbishment of state owned infrastructure.

2015 Estimates of National Expenditure
4
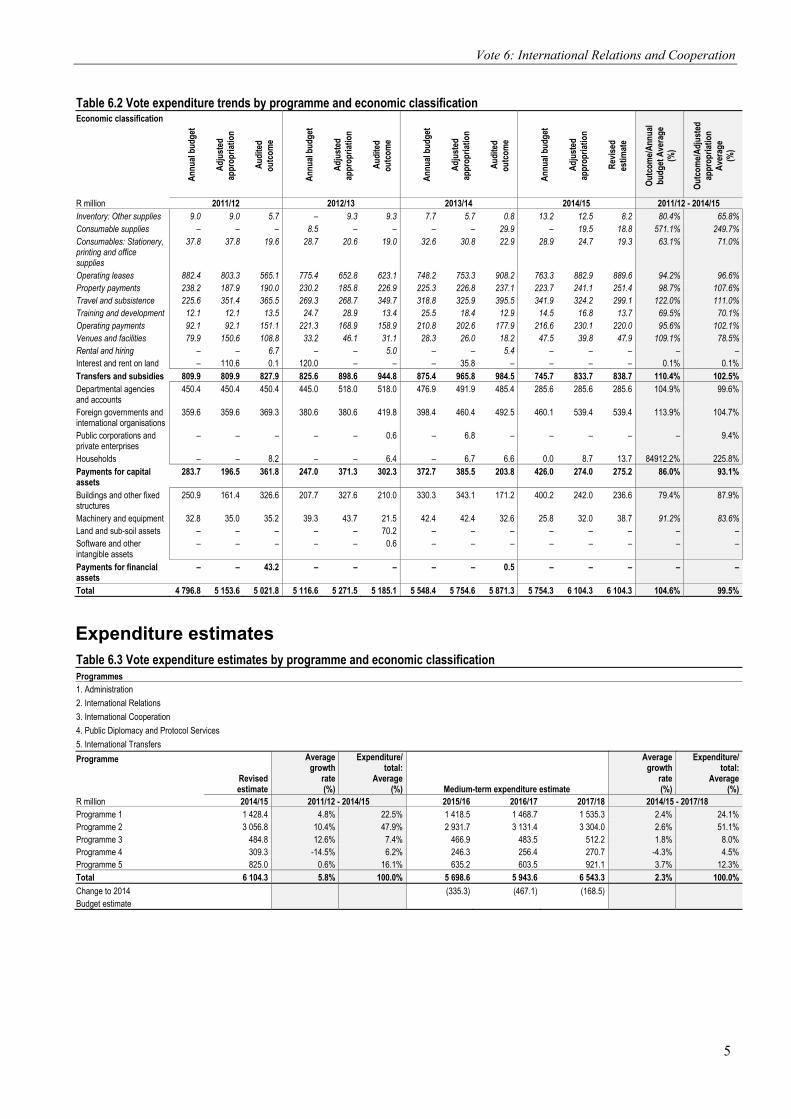
Expenditure trends Table 6.2 Vote expenditure trends by programme and economic classification Programmes 1. Administration 2. International Relations 3. International Cooperation 4. Public Diplomacy and Protocol Services 5. International Transfers Programme
Ann
ual b
udge
t
Adj
uste
d
appr
opria
tion
Aud
ited
ou
tcom
e
Ann
ual b
udge
t
Adj
uste
d
appr
opria
tion
Aud
ited
ou
tcom
e
Ann
ual b
udge
t
Adj
uste
d
appr
opria
tion
Aud
ited
ou
tcom
e
Ann
ual b
udge
t
Adj
uste
d
appr
opria
tion
Rev
ised
es
timat
e
Out
com
e/A
nnua
l bu
dget
Ave
rage
(%
)
Out
com
e/A
djus
ted
ap
prop
riatio
n
Ave
rage
(%
)
R million 2011/12 2012/13 2013/14 2014/15 2011/12 - 2014/15 Programme 1 1 245.5 1 239.4 1 170.6 1 275.6 1 265.3 1 133.1 1 327.8 1 320.7 1 267.2 1 396.3 1 419.6 1 428.4 95.3% 95.3%Programme 2 2 200.9 2 270.6 2 213.2 2 425.2 2 441.7 2 451.7 2 653.4 2 768.1 2 892.9 2 810.2 3 047.5 3 056.8 105.2% 100.8%Programme 3 328.9 339.3 333.0 369.9 364.8 370.4 447.9 459.0 451.7 486.4 504.4 484.8 100.4% 98.3%Programme 4 211.5 494.4 485.4 220.3 301.1 292.1 243.9 254.5 281.6 317.2 309.3 309.3 137.8% 100.7%Programme 5 809.9 809.9 819.6 825.6 898.6 937.8 875.4 952.4 978.0 744.3 823.6 825.0 109.4% 102.2%Total 4 796.8 5 153.6 5 021.8 5 116.6 5 271.5 5 185.1 5 548.4 5 754.6 5 871.3 5 754.3 6 104.3 6 104.3 104.6% 99.5%
Change to 2014 Budget estimate
350.0
Economic classification Current payments 3 703.1 4 147.2 3 788.9 4 044.1 4 001.6 3 937.9 4 300.3 4 403.3 4 682.5 4 582.6 4 996.6 4 990.4 104.6% 99.2%Compensation of employees
1 704.5 1 843.6 1 934.2 1 851.5 2 118.3 2 153.2 2 238.8 2 354.3 2 433.7 2 461.8 2 581.8 2 609.3 110.6% 102.6%
Goods and services 1 998.6 2 193.1 1 854.7 2 072.6 1 883.3 1 784.7 2 061.5 2 013.2 2 248.8 2 120.8 2 414.8 2 381.1 100.2% 97.2%of which: Administrative fees 11.5 11.5 10.1 7.3 12.6 7.7 6.3 6.3 8.6 13.6 9.7 8.5 90.2% 87.0%Advertising 14.6 48.3 15.8 11.7 22.6 13.6 14.6 14.6 12.0 13.1 19.9 23.7 120.7% 61.8%Assets less than the capitalisation threshold
8.2 8.2 30.4 3.4 9.2 5.5 3.5 3.5 4.7 3.7 3.7 3.6 234.8% 179.0%
Audit costs: External 14.7 14.7 14.6 15.3 15.3 15.5 16.5 17.9 19.5 20.3 20.3 20.3 104.6% 102.5%Bursaries: Employees 0.3 0.3 0.7 1.8 1.8 1.1 2.3 2.3 0.9 2.9 2.2 1.5 57.6% 63.5%Catering: Departmental activities
30.9 47.6 16.2 25.7 19.8 18.2 22.6 27.2 19.2 34.6 41.6 38.5 80.9% 67.6%
Communication 88.3 91.0 77.9 115.0 50.2 55.7 65.5 65.5 69.9 94.0 59.0 22.0 62.2% 84.9%Computer services 124.5 147.2 119.3 112.4 133.1 87.1 111.7 111.7 120.2 128.0 106.8 145.9 99.1% 94.7%Consultants and professional services: Business and advisory services
17.3 17.3 3.6 10.5 13.9 15.5 26.1 28.7 37.1 15.5 12.5 14.8 102.5% 98.2%
Consultants and professional services: Infrastructure and planning
– – 3.2 – – 5.7 – – 0.0 – – – – –
Consultants and professional services: Legal costs
– – 5.1 2.2 4.5 2.5 2.5 2.5 2.8 2.6 2.6 3.0 181.2% 137.9%
Contractors 50.6 59.8 97.1 84.2 96.9 78.9 97.1 97.1 82.6 97.8 164.0 150.3 124.0% 97.8%Agency and support / outsourced services
8.0 50.4 8.8 58.7 79.8 6.3 61.5 12.9 47.1 15.1 161.2 160.4 155.5% 73.2%
Entertainment 29.3 29.3 11.2 18.4 16.7 12.8 17.3 17.3 13.2 14.0 14.0 13.7 64.3% 65.8%Fleet services (including government motor transport)
– – 0.0 – – – – – 0.2 – – – – –
Inventory: Clothing material and accessories
– – – – – 0.0 – – 0.0 – 0.7 0.7 – 107.9%
Inventory: Farming supplies
– – – – – – – – 0.1 – – – – –
Inventory: Food and food supplies
1.1 1.1 0.9 1.5 1.3 3.6 1.6 1.1 0.4 1.7 1.2 2.1 118.3% 150.4%
Inventory: Fuel, oil and gas
17.8 17.8 12.7 11.9 19.6 16.9 14.2 14.2 0.1 13.3 2.7 2.9 57.0% 60.1%
Inventory: Materials and supplies
4.1 4.1 0.9 0.8 4.5 1.7 0.8 0.8 1.4 0.9 0.9 0.9 74.5% 47.9%
Inventory: Medical supplies
0.3 0.3 0.2 0.4 0.5 0.1 0.1 0.1 0.0 0.1 0.1 0.1 41.8% 38.6%
Inventory: Medicine 0.0 0.0 – 0.0 0.0 – 0.0 0.0 – 0.0 0.0 0.1 54.2% 54.2%
Vote 6: International Relations and Cooperation
5
Table 6.2 Vote expenditure trends by programme and economic classification Economic classification
Ann
ual b
udge
t
Adj
uste
d
appr
opria
tion
Aud
ited
ou
tcom
e
Ann
ual b
udge
t
Adj
uste
d
appr
opria
tion
Aud
ited
ou
tcom
e
Ann
ual b
udge
t
Adj
uste
d
appr
opria
tion
Aud
ited
ou
tcom
e
Ann
ual b
udge
t
Adj
uste
d
appr
opria
tion
Rev
ised
es
timat
e
Out
com
e/A
nnua
l bu
dget
Ave
rage
(%
)
Out
com
e/A
djus
ted
ap
prop
riatio
n
Ave
rage
(%
)
R million 2011/12 2012/13 2013/14 2014/15 2011/12 - 2014/15 Inventory: Other supplies 9.0 9.0 5.7 – 9.3 9.3 7.7 5.7 0.8 13.2 12.5 8.2 80.4% 65.8%Consumable supplies – – – 8.5 – – – – 29.9 – 19.5 18.8 571.1% 249.7%Consumables: Stationery, printing and office supplies
37.8 37.8 19.6 28.7 20.6 19.0 32.6 30.8 22.9 28.9 24.7 19.3 63.1% 71.0%
Operating leases 882.4 803.3 565.1 775.4 652.8 623.1 748.2 753.3 908.2 763.3 882.9 889.6 94.2% 96.6%Property payments 238.2 187.9 190.0 230.2 185.8 226.9 225.3 226.8 237.1 223.7 241.1 251.4 98.7% 107.6%Travel and subsistence 225.6 351.4 365.5 269.3 268.7 349.7 318.8 325.9 395.5 341.9 324.2 299.1 122.0% 111.0%Training and development 12.1 12.1 13.5 24.7 28.9 13.4 25.5 18.4 12.9 14.5 16.8 13.7 69.5% 70.1%Operating payments 92.1 92.1 151.1 221.3 168.9 158.9 210.8 202.6 177.9 216.6 230.1 220.0 95.6% 102.1%Venues and facilities 79.9 150.6 108.8 33.2 46.1 31.1 28.3 26.0 18.2 47.5 39.8 47.9 109.1% 78.5%Rental and hiring – – 6.7 – – 5.0 – – 5.4 – – – – –Interest and rent on land – 110.6 0.1 120.0 – – – 35.8 – – – – 0.1% 0.1%Transfers and subsidies 809.9 809.9 827.9 825.6 898.6 944.8 875.4 965.8 984.5 745.7 833.7 838.7 110.4% 102.5%Departmental agencies and accounts
450.4 450.4 450.4 445.0 518.0 518.0 476.9 491.9 485.4 285.6 285.6 285.6 104.9% 99.6%
Foreign governments and international organisations
359.6 359.6 369.3 380.6 380.6 419.8 398.4 460.4 492.5 460.1 539.4 539.4 113.9% 104.7%
Public corporations and private enterprises
– – – – – 0.6 – 6.8 – – – – – 9.4%
Households – – 8.2 – – 6.4 – 6.7 6.6 0.0 8.7 13.7 84912.2% 225.8%Payments for capital assets
283.7 196.5 361.8 247.0 371.3 302.3 372.7 385.5 203.8 426.0 274.0 275.2 86.0% 93.1%
Buildings and other fixed structures
250.9 161.4 326.6 207.7 327.6 210.0 330.3 343.1 171.2 400.2 242.0 236.6 79.4% 87.9%
Machinery and equipment 32.8 35.0 35.2 39.3 43.7 21.5 42.4 42.4 32.6 25.8 32.0 38.7 91.2% 83.6%Land and sub-soil assets – – – – – 70.2 – – – – – – – –Software and other intangible assets
– – – – – 0.6 – – – – – – – –
Payments for financial assets
– – 43.2 – – – – – 0.5 – – – – –
Total 4 796.8 5 153.6 5 021.8 5 116.6 5 271.5 5 185.1 5 548.4 5 754.6 5 871.3 5 754.3 6 104.3 6 104.3 104.6% 99.5%
Expenditure estimates Table 6.3 Vote expenditure estimates by programme and economic classification Programmes 1. Administration 2. International Relations 3. International Cooperation 4. Public Diplomacy and Protocol Services
5. International Transfers Programme
Revised estimate
Averagegrowth
rate(%)
Expenditure/total:
Average(%) Medium-term expenditure estimate
Averagegrowth
rate(%)
Expenditure/total:
Average(%)
R million 2014/15 2011/12 - 2014/15 2015/16 2016/17 2017/18 2014/15 - 2017/18 Programme 1 1 428.4 4.8% 22.5% 1 418.5 1 468.7 1 535.3 2.4% 24.1%Programme 2 3 056.8 10.4% 47.9% 2 931.7 3 131.4 3 304.0 2.6% 51.1%Programme 3 484.8 12.6% 7.4% 466.9 483.5 512.2 1.8% 8.0%Programme 4 309.3 -14.5% 6.2% 246.3 256.4 270.7 -4.3% 4.5%Programme 5 825.0 0.6% 16.1% 635.2 603.5 921.1 3.7% 12.3%Total 6 104.3 5.8% 100.0% 5 698.6 5 943.6 6 543.3 2.3% 100.0%
Change to 2014 Budget estimate
(335.3) (467.1) (168.5)

2015 Estimates of National Expenditure
6
Table 6.3 Vote expenditure estimates by programme and economic classification Economic classification
Revised estimate
Average growth
rate (%)
Expenditure/total:
Average(%) Medium-term expenditure estimate
Average growth
rate (%)
Expenditure/total:
Average(%)
R million 2014/15 2011/12 - 2014/15 2015/16 2016/17 2017/18 2014/15 - 2017/18 Current payments 4 990.4 6.4% 78.4% 4 773.5 5 047.6 5 325.6 2.2% 82.9%Compensation of employees 2 609.3 12.3% 41.2% 2 526.2 2 624.9 2 784.2 2.2% 43.4%Goods and services 2 381.1 2.8% 37.3% 2 247.3 2 422.7 2 541.4 2.2% 39.5%of which: Administrative fees 8.5 -9.7% 0.2% 8.3 9.1 9.6 4.3% 0.1%Advertising 23.7 -21.1% 0.3% 12.5 14.7 14.3 -15.6% 0.3%Assets less than the capitalisation threshold
3.6 -24.1% 0.2% 4.7 4.7 4.6 8.5% 0.1%
Audit costs: External 20.3 11.4% 0.3% 22.0 23.2 24.3 6.3% 0.4%Bursaries: Employees 1.5 72.8% 0.0% 1.1 1.1 1.2 -7.8% 0.0%Catering: Departmental activities 38.5 -6.8% 0.4% 19.0 19.1 20.1 -19.5% 0.4%Communication 22.0 -37.7% 1.0% 57.7 53.8 54.8 35.6% 0.8%Computer services 145.9 -0.3% 2.1% 130.8 124.6 131.5 -3.4% 2.2%Consultants and professional services: Business and advisory services
14.8 -4.9% 0.3% 25.0 25.1 25.9 20.3% 0.4%
Consultants and professional services: Legal costs
3.0 – 0.1% 3.1 3.2 3.4 4.2% 0.1%
Contractors 150.3 36.0% 1.8% 76.4 70.9 74.0 -21.0% 1.5%Agency and support / outsourced services
160.4 47.1% 1.0% 181.8 182.8 191.9 6.2% 3.0%
Entertainment 13.7 -22.4% 0.2% 13.7 14.0 14.7 2.4% 0.2%Inventory: Clothing material and accessories
0.7 – 0.0% – – – -100.0% 0.0%
Inventory: Food and food supplies 2.1 22.3% 0.0% 0.6 0.4 1.0 -21.2% 0.0%Inventory: Fuel, oil and gas 2.9 -45.2% 0.1% 2.7 0.6 17.4 81.3% 0.1%Inventory: Materials and supplies 0.9 -40.4% 0.0% 0.9 0.9 1.0 5.0% 0.0%Inventory: Medical supplies 0.1 -22.0% 0.0% 0.1 0.1 0.1 2.7% 0.0%Inventory: Medicine 0.1 32.8% 0.0% – – – -100.0% 0.0%Inventory: Other supplies 8.2 -2.9% 0.1% 1.0 1.0 8.9 2.8% 0.1%Consumable supplies 18.8 – 0.2% 24.1 23.3 4.7 -37.1% 0.3%Consumables: Stationery, printing and office supplies
19.3 -20.1% 0.4% 25.5 25.4 26.5 11.2% 0.4%
Operating leases 889.6 3.5% 13.5% 861.3 1 036.3 1 095.9 7.2% 16.0%Property payments 251.4 10.2% 4.1% 266.3 276.7 283.0 4.0% 4.4%Travel and subsistence 299.1 -5.2% 6.4% 288.3 277.8 284.0 -1.7% 4.7%Training and development 13.7 4.2% 0.2% 13.9 15.3 16.2 5.7% 0.2%Operating payments 220.0 33.7% 3.2% 190.5 195.3 206.6 -2.1% 3.3%Venues and facilities 47.9 -31.7% 0.9% 18.2 23.0 25.8 -18.6% 0.5%Rental and hiring – – 0.1% – – – – –Transfers and subsidies 838.7 1.2% 16.2% 641.2 610.0 928.0 3.4% 12.4%Departmental agencies and accounts
285.6 -14.1% 7.8% 154.0 96.8 431.5 14.8% 4.0%
Foreign governments and international organisations
539.4 14.5% 8.2% 481.2 506.7 489.6 -3.2% 8.3%
Households 13.7 – 0.2% 6.0 6.4 6.9 -20.6% 0.1%Payments for capital assets 275.2 11.9% 5.2% 284.0 285.9 289.7 1.7% 4.7%Buildings and other fixed structures 236.6 13.6% 4.3% 233.1 246.7 248.3 1.6% 4.0%Machinery and equipment 38.7 3.4% 0.6% 50.9 39.3 41.3 2.3% 0.7%Land and sub-soil assets – – 0.3% – – – – –Payments for financial assets – – 0.2% – – – – –Total 6 104.3 5.8% 100.0% 5 698.6 5 943.6 6 543.3 2.3% 100.0%

Vote 6: International Relations and Cooperation
7
Personnel information Table 6.4 Vote personnel numbers and cost by salary level and programme1 Programmes 1. Administration
2. International Relations
3. International Cooperation
4. Public Diplomacy and Protocol Services
5. International Transfers
Number of posts estimated for 31 March 2015 Number and cost2 of personnel posts filled / planned for on funded establishment Number
Number of
funded posts
Number of posts
additional to the
establishment Actual Revised estimate Medium-term expenditure estimate
Averagegrowth
rate(%)
2013/14 2014/15 2015/16 2016/17 2017/18 2014/15 - 2017/18 International Relations and Cooperation
Number Cost
Unit Cost
Number Cost
Unit Cost
Number Cost
Unit Cost
Number Cost
Unit Cost
Number Cost
Unit Cost
Salary level 4 588 23 4 320 2 436.7 0.6 4 552 2 609.3 0.6 4 552 2 526.2 0.6 4 571 2 624.9 0.6 4 592 2 784.2 0.6 0.3% 100.0%1 – 6 382 4 365 67.5 0.2 382 80.0 0.2 382 87.7 0.2 384 91.1 0.2 387 98.0 0.3 0.4% 8.4%7 – 10 1 490 9 1 284 439.7 0.3 1 465 592.3 0.4 1 465 595.5 0.4 1 478 627.4 0.4 1 487 664.9 0.4 0.5% 32.3%11 – 12 436 7 411 266.2 0.6 436 296.1 0.7 436 314.2 0.7 440 334.0 0.8 442 353.6 0.8 0.5% 9.6%13 – 16 309 3 281 263.4 0.9 298 258.8 0.9 298 281.6 0.9 298 300.6 1.0 305 327.6 1.1 0.8% 6.6%Other 1 971 – 1 979 1 399.8 0.7 1 971 1 382.2 0.7 1 971 1 247.2 0.6 1 971 1 271.9 0.6 1 971 1 340.2 0.7 – 43.2%Programme 4 588 23 4 320 2 436.7 0.6 4 552 2 609.3 0.6 4 552 2 526.2 0.6 4 571 2 624.9 0.6 4 592 2 784.2 0.6 0.3% 100.0%Programme 1 946 22 855 330.3 0.4 946 375.3 0.4 946 377.1 0.4 958 387.7 0.4 961 412.9 0.4 0.5% 20.9%Programme 2 2 831 – 2 761 1 714.6 0.6 2 795 1 813.3 0.6 2 795 1 728.2 0.6 2 795 1 789.3 0.6 2 797 1 896.5 0.7 0.0% 61.2%Programme 3 471 1 415 277.1 0.7 471 292.3 0.6 471 290.7 0.6 471 309.5 0.7 471 328.8 0.7 – 10.3%Programme 4 340 – 289 114.7 0.4 340 128.4 0.4 340 130.2 0.4 347 138.4 0.4 363 146.0 0.4 2.2% 7.6%1. Data has been provided by the department and may not necessarily reconcile with official government personnel data. 2. Rand million.
Departmental receipts Table 6.5 Departmental receipts by economic classification
Audited outcome Adjusted estimate
Revised estimate
Averagegrowth
rate (%)
Receipt item/total:
Average(%) Medium-term receipts estimate
Averagegrowth
rate (%)
Receipt item/total:
Average(%)
R thousand 2011/12 2012/13 2013/14 2014/15 2011/12 - 2014/15 2015/16 2016/17 2017/18 2014/15 - 2017/18 Departmental receipts 82 928 46 694 36 569 46 189 47 865 -16.7% 100.0% 48 182 48 561 49 155 0.9% 100.0%Sales of goods and services produced by department 586 682 870 818 854 13.4% 1.4% 908 954 1 001 5.4% 1.9%Sales by market establishments
270 351 417 381 394 13.4% 0.7% 414 434 456 5.0% 0.9%
of which: Parking fee 270 351 417 381 394 13.4% 0.7% 414 434 456 5.0% 0.9%Administrative fees 316 – – 350 366 5.0% 0.3% 384 404 424 5.0% 0.8%of which: Insurance fees 45 – – 38 45 – – 47 50 53 5.6% 0.1%Garnishee fees 271 – – 312 321 5.8% 0.3% 337 354 371 4.9% 0.7%Other sales – 331 453 87 94 – 0.4% 110 116 121 8.8% 0.2%of which: Replacement of access cards and name tags
– 331 453 6 8 – 0.4% 8 9 9 4.0% –
Sale of departmental documents and publications
– – – – 1 – – 1 1 1 – –
Transport fees – – – 81 85 – – 101 106 111 9.3% 0.2%Sales of scrap, waste, arms and other used current goods
1 003 182 – – – -100.0% 0.6% – – – – –
of which: Sales of scrap 1 003 182 – – – -100.0% 0.6% – – – – – Fines, penalties and forfeits
188 2 554 37 – 40 -40.3% 1.3% – – – -100.0% –
Interest, dividends and rent on land
1 436 582 1 384 1 582 1 308 -3.1% 2.2% 1 373 1 442 1 514 5.0% 2.9%
Interest 1 281 547 1 384 1 582 1 308 0.7% 2.1% 1 373 1 442 1 514 5.0% 2.9%Rent on land 155 35 – – – -100.0% 0.1% – – – – – Sales of capital assets 1 873 1 675 2 125 3 859 3 721 25.7% 4.4% 3 907 4 102 4 307 5.0% 8.3%Transactions in financial assets and liabilities
77 842 41 019 32 153 39 930 41 942 -18.6% 90.1% 41 994 42 063 42 333 0.3% 86.9%
Total 82 928 46 694 36 569 46 189 47 865 -16.7% 100.0% 48 182 48 561 49 155 0.9% 100.0%

2015 Estimates of National Expenditure
8
Programme 1: Administration
Programme purpose
Provide strategic leadership, management and support services to the department.
Expenditure trends and estimates
Table 6.6 Administration expenditure trends and estimates by subprogramme and economic classification Subprogramme
Audited outcome Adjusted
appropriation
Averagegrowth
rate(%)
Expen-diture/Total:
Average(%)
Medium-term expenditure estimate
Averagegrowth
rate(%)
Expen-diture/Total:
Average(%)
R thousand 2011/12 2012/13 2013/14 2014/15 2011/12 - 2014/15 2015/16 2016/17 2017/18 2014/15 - 2017/18 Ministry 4 528 4 398 6 143 5 956 9.6% 0.4% 6 230 6 641 7 059 5.8% 0.4%Departmental Management 12 550 14 036 14 336 15 563 7.4% 1.1% 16 388 17 470 18 571 6.1% 1.2%Audit Services 13 221 14 178 16 950 21 137 16.9% 1.3% 19 832 20 431 21 603 0.7% 1.4%Financial Management 108 886 104 476 122 236 124 431 4.5% 9.2% 130 953 134 608 142 447 4.6% 9.1%Corporate Services 517 448 540 770 633 313 687 779 9.9% 47.7% 642 618 653 373 688 243 – 45.7%Diplomatic Training, Research and Development
62 451 67 464 59 375 60 506 -1.0% 5.0% 66 493 71 731 76 514 8.1% 4.7%
Foreign Fixed Assets Management 216 792 194 464 154 437 221 256 0.7% 15.8% 223 838 235 701 235 701 2.1% 15.7%Office Accommodation 234 710 193 359 260 406 282 941 6.4% 19.5% 312 169 328 715 345 151 6.8% 21.7%Total 1 170 586 1 133 145 1 267 196 1 419 569 6.6% 100.0% 1 418 521 1 468 670 1 535 289 2.6% 100.0%
Change to 2014 Budget estimate
23 314 25 239 27 562 29 108
Economic classification
Current payments 831 070 847 603 1 089 822 1 160 421 11.8% 78.7% 1 167 033 1 201 719 1 266 398 3.0% 82.1%Compensation of employees 310 116 328 321 330 278 365 365 5.6% 26.7% 377 113 387 707 412 918 4.2% 26.4%Goods and services 520 871 519 282 759 544 795 056 15.1% 52.0% 789 920 814 012 853 480 2.4% 55.7%of which: Administrative fees 4 567 1 354 1 434 2 134 -22.4% 0.2% 1 964 2 364 2 696 8.1% 0.2%Advertising 3 208 1 755 5 120 5 692 21.1% 0.3% 5 430 6 766 5 998 1.8% 0.4%Assets less than the capitalisation threshold 24 817 77 58 46 -87.7% 0.5% 49 51 54 5.5% – Audit costs: External 14 628 15 457 19 471 20 273 11.5% 1.4% 21 955 23 190 24 324 6.3% 1.5%Bursaries: Employees 704 1 133 880 2 212 46.5% 0.1% 1 097 1 111 1 187 -18.7% 0.1%Catering: Departmental activities 2 805 3 138 1 841 1 840 -13.1% 0.2% 1 925 2 026 2 127 5.0% 0.1%Communication 14 650 15 366 22 673 19 928 10.8% 1.5% 17 457 16 856 17 160 -4.9% 1.2%Computer services 79 515 85 158 110 791 106 018 10.1% 7.6% 130 486 124 274 131 113 7.3% 8.4%Consultants and professional services: Business and advisory services
2 791 2 167 36 424 11 263 59.2% 1.1% 22 797 21 766 22 354 25.7% 1.3%
Consultants and professional services: Infrastructure and planning
3 188 5 572 – – -100.0% 0.2% – – – – –
Consultants and professional services: Legal costs
– – 211 221 – – 231 243 255 4.9% –
Contractors 84 943 65 910 65 934 144 506 19.4% 7.2% 62 194 67 885 71 278 -21.0% 5.9%Agency and support / outsourced services 6 687 1 734 10 554 159 296 187.7% 3.6% 178 831 179 788 188 772 5.8% 12.1%Entertainment 166 264 368 409 35.1% – 427 449 471 4.8% – Fleet services (including government motor transport)
23 – – – -100.0% – – – – – –
Inventory: Clothing material and accessories
– 43 – – – – – – – – –
Inventory: Food and food supplies 87 25 81 125 12.8% – 131 138 145 5.1% – Inventory: Fuel, oil and gas 56 2 047 133 139 35.4% – 146 154 162 5.2% – Inventory: Materials and supplies 3 19 21 24 100.0% – 25 26 27 4.0% – Inventory: Medical supplies – 3 5 9 – – 10 10 10 3.6% – Inventory: Other supplies 840 2 453 780 820 -0.8% 0.1% 856 901 946 4.9% 0.1%Consumable supplies – – 11 5 500 – 0.1% – – – -100.0% 0.1%Consumables: Stationery, printing and office supplies
5 458 6 273 8 026 9 448 20.1% 0.6% 8 914 8 856 9 203 -0.9% 0.6%
Operating leases 75 874 74 515 198 493 87 765 5.0% 8.7% 136 802 153 371 161 040 22.4% 9.2%Property payments 15 768 30 942 87 472 29 721 23.5% 3.3% 25 727 27 091 28 446 -1.5% 1.9%Travel and subsistence 88 830 118 631 102 016 89 678 0.3% 8.0% 90 712 90 740 95 337 2.1% 6.3%Training and development 10 786 12 448 11 935 15 652 13.2% 1.0% 12 467 13 796 14 606 -2.3% 1.0%Operating payments 77 571 71 658 73 653 81 156 1.5% 6.1% 65 732 68 366 71 784 -4.0% 4.9%Venues and facilities 2 906 384 1 159 1 181 -25.9% 0.1% 3 555 3 794 3 985 50.0% 0.2%Rental and hiring – 756 – – – – – – – – – Interest and rent on land 83 – – – -100.0% – – – – – – Transfers and subsidies 967 2 184 1 101 3 720 56.7% 0.2% 1 227 1 296 1 361 -28.5% 0.1%Public corporations and private enterprises – 36 133 – – – – – – – – Households 967 2 148 968 3 720 56.7% 0.2% 1 227 1 296 1 361 -28.5% 0.1%

Vote 6: International Relations and Cooperation
9
Table 6.6 Administration expenditure trends and estimates by subprogramme and economic classification Economic classification
Audited outcome Adjusted
appropriation
Averagegrowth
rate(%)
Expen-diture/Total:
Average(%)
Medium-term expenditure estimate
Averagegrowth
rate(%)
Expen-diture/Total:
Average(%)
R thousand 2011/12 2012/13 2013/14 2014/15 2011/12 - 2014/15 2015/16 2016/17 2017/18 2014/15 - 2017/18 Payments for capital assets 338 161 283 358 176 273 255 428 -8.9% 21.1% 250 261 265 655 267 530 1.6% 17.8%Buildings and other fixed structures 326 522 209 470 176 078 241 966 -9.5% 19.1% 233 093 246 675 248 322 0.9% 16.6%Machinery and equipment 11 639 3 726 195 13 462 5.0% 0.6% 17 168 18 980 19 208 12.6% 1.2%Land and sub-soil assets – 70 162 – – – 1.4% – – – – – Payments for financial assets 388 – – – -100.0% – – – – – –
Total 1 170 586 1 133 145 1 267 196 1 419 569 6.6% 100.0% 1 418 521 1 468 670 1 535 289 2.6% 100.0%
Proportion of total programme expenditure to vote expenditure
23.3% 21.9% 21.6% 23.3% – – 24.9% 24.7% 23.5% – –
Details of transfers and subsidies
Households
Social benefits
Current 967 2 148 968 3 720 56.7% 0.2% 1 227 1 296 1 361 -28.5% 0.1%
Employee social benefits 967 2 148 968 3 720 56.7% 0.2% 1 227 1 296 1 361 -28.5% 0.1%
Public corporations and private enterprises
Public corporations
Other transfers to public corporations
Current – 36 133 – – – – – – – –
Television licences – 36 133 – – – – – – – –
Personnel information
Table 6.7 Administration personnel numbers and cost by salary level¹
Number of posts estimated for
31 March 2015 Number and cost2 of personnel posts filled / planned for on funded establishment Number
Number of
funded posts
Number of posts
additional to the
establishment Actual Revised estimate Medium-term expenditure estimate
Averagegrowth
rate(%)
Salary level/total:
Average(%)
2013/14 2014/15 2015/16 2016/17 2017/18 2014/15 - 2017/18
Administration
Number Cost Unit Cost
Number Cost
Unit Cost
Number Cost
Unit Cost
Number Cost
Unit Cost
Number Cost
Unit Cost
Salary level 946 22 855 330.3 0.4 946 375.3 0.4 946 377.1 0.4 958 387.7 0.4 961 412.9 0.4 0.5% 100.0%1 – 6 248 4 259 47.3 0.2 248 54.1 0.2 248 61.0 0.2 250 62.1 0.2 250 67.1 0.3 0.3% 26.1%7 – 10 513 8 433 141.3 0.3 513 200.4 0.4 513 184.0 0.4 523 189.4 0.4 526 201.2 0.4 0.8% 54.4%11 – 12 116 7 104 71.6 0.7 116 69.7 0.6 116 68.7 0.6 116 69.9 0.6 116 73.1 0.6 – 12.2%13 – 16 66 3 56 63.7 1.1 66 48.4 0.7 66 56.9 0.9 66 59.5 0.9 66 64.5 1.0 – 6.9%Other 3 – 3 6.3 2.1 3 2.7 0.9 3 6.5 2.2 3 6.9 2.3 3 7.0 2.3 – 0.3%
1. Data has been provided by the department and may not necessarily reconcile with official government personnel data. 2. Rand million.
Programme 2: International Relations
Programme purpose
Promote relations with foreign countries.
Objectives
• Strengthen political, economic and social relations through bilateral agreements with targeted countries to advance South Africa’s national priorities by promoting South African national and international relations policies, strategies and programmes, on an ongoing basis.
Subprogrammes
• Africa embraces relevant national priorities by strengthening bilateral cooperation with individual countries in Africa, particularly through focusing on increasing exports of South African goods and services, foreign direct investment with technology transfers into value added industries and mineral beneficiation, and inbound tourism and skills enhancement.

2015 Estimates of National Expenditure
10
• Asia and Middle East embraces relevant national priorities by strengthening bilateral cooperation with individual countries in Asia and the Middle East, particularly through focusing on increasing exports of South African goods and services, foreign direct investment with technology transfers into value added industries and mineral beneficiation, and inbound tourism and skills enhancement.
• Americas and Caribbean embraces relevant national priorities by strengthening bilateral cooperation with individual countries in the Americas and the Caribbean, particularly through focusing on increasing exports of South African goods and services, foreign direct investment with technology transfers into value added industries and mineral beneficiation, and inbound tourism and skills enhancement.
• Europe embraces relevant national priorities by strengthening bilateral cooperation with individual countries in Europe, particularly through focusing on increasing exports of South African goods and services, foreign direct investment with technology transfers into value added industries and mineral beneficiation, and inbound tourism and skills enhancement.
Expenditure trends and estimates
Table 6.8 International Relations expenditure trends and estimates by subprogramme and economic classification Subprogramme
Audited outcome Adjusted
appropriation
Averagegrowth
rate(%)
Expen-diture/Total:
Average(%)
Medium-term expenditure estimate
Averagegrowth
rate(%)
Expen-diture/Total:
Average(%)
R thousand 2011/12 2012/13 2013/14 2014/15 2011/12 - 2014/15 2015/16 2016/17 2017/18 2014/15 - 2017/18 Africa 688 991 736 548 860 918 902 332 9.4% 30.1% 885 923 940 088 996 880 3.4% 30.0%Asia and Middle East 577 421 643 159 751 704 780 863 10.6% 26.0% 734 839 801 637 848 693 2.8% 25.5%Americas and Caribbean 346 869 404 523 492 205 530 913 15.2% 16.7% 501 138 537 386 578 032 2.9% 17.3%Europe 599 961 667 434 788 050 833 343 11.6% 27.2% 809 757 852 328 880 374 1.8% 27.2%Total 2 213 242 2 451 664 2 892 877 3 047 451 11.3% 100.0% 2 931 657 3 131 439 3 303 979 2.7% 100.0%
Change to 2014 Budget estimate
237 291 (70 634) (93 978) (106 934)
Economic classification Current payments 2 144 912 2 432 221 2 873 207 3 025 872 12.2% 98.8% 2 897 197 3 110 888 3 281 445 2.7% 99.2%Compensation of employees 1 317 977 1 480 001 1 714 594 1 796 908 10.9% 59.5% 1 728 196 1 789 313 1 896 450 1.8% 58.1%Goods and services 826 935 952 220 1 158 613 1 228 964 14.1% 39.3% 1 169 001 1 321 575 1 384 995 4.1% 41.1%of which: Administrative fees 4 568 6 087 5 385 6 962 15.1% 0.2% 6 237 6 562 6 725 -1.1% 0.2%Advertising 1 045 756 2 067 1 357 9.1% – 1 418 1 353 1 357 – – Assets less than the capitalisation threshold 4 096 5 070 3 893 3 539 -4.8% 0.2% 4 384 4 357 4 181 5.7% 0.1%Catering: Departmental activities 10 952 12 755 13 883 15 689 12.7% 0.5% 14 181 13 953 14 705 -2.1% 0.5%Communication 27 576 30 078 34 055 31 320 4.3% 1.2% 30 862 28 051 28 271 -3.4% 1.0%Computer services 836 733 964 140 -44.9% – 147 155 163 5.2% – Consultants and professional services: Business and advisory services
346 1 450 675 1 035 44.1% – 1 110 1 170 1 229 5.9% –
Consultants and professional services: Infrastructure and planning
3 140 – – -100.0% – – – – – –
Consultants and professional services: Legal costs
3 383 1 266 1 459 1 028 -32.8% 0.1% 1 660 1 694 1 751 19.4% –
Contractors 11 339 11 197 14 652 11 971 1.8% 0.5% 12 577 11 860 12 356 1.1% 0.4%Agency and support / outsourced services 1 083 3 071 1 342 1 759 17.5% 0.1% 2 809 2 884 2 962 19.0% 0.1%Entertainment 9 377 10 698 10 687 11 523 7.1% 0.4% 11 024 11 183 11 681 0.5% 0.4%Fleet services (including government motor transport)
– – 142 – – – – – – – –
Inventory: Food and food supplies 13 20 25 9 -11.5% – 9 10 10 3.6% – Inventory: Fuel, oil and gas 12 216 14 373 – 2 472 -41.3% 0.3% 2 150 – 16 772 89.3% 0.2%Inventory: Materials and supplies 849 1 654 1 383 834 -0.6% – 874 920 966 5.0% – Inventory: Medical supplies 162 84 – 114 -11.1% – 118 125 132 5.0% – Inventory: Other supplies 4 193 5 729 – 11 408 39.6% 0.2% – – 7 788 -11.9% 0.2%Consumable supplies – – 25 747 8 416 – 0.3% 21 331 20 322 1 810 -40.1% 0.4%Consumables: Stationery, printing and office supplies
8 850 7 752 9 708 10 664 6.4% 0.3% 10 093 10 168 10 657 – 0.3%
Operating leases 435 196 498 344 649 125 718 514 18.2% 21.7% 662 112 812 390 852 269 5.9% 24.5%Property payments 137 120 158 857 175 342 169 362 7.3% 6.0% 197 512 207 859 218 076 8.8% 6.4%Travel and subsistence 85 200 100 715 105 902 100 432 5.6% 3.7% 90 296 82 150 82 867 -6.2% 2.9%Training and development 756 863 928 1 034 11.0% – 1 346 1 415 1 478 12.6% – Operating payments 59 599 70 661 87 492 106 390 21.3% 3.1% 87 528 87 714 90 391 -5.3% 3.0%Venues and facilities 8 177 8 842 10 444 12 992 16.7% 0.4% 11 623 15 280 16 398 8.1% 0.5%Rental and hiring – 1 025 3 313 – – – – – – – –

Vote 6: International Relations and Cooperation
11
Table 6.8 International Relations expenditure trends and estimates by subprogramme and economic classification Economic classification
Audited outcome Adjusted
appropriation
Averagegrowth
rate(%)
Expen-diture/Total:
Average(%)
Medium-term expenditure estimate
Averagegrowth
rate(%)
Expen-diture/Total:
Average(%)
R thousand 2011/12 2012/13 2013/14 2014/15 2011/12 - 2014/15 2015/16 2016/17 2017/18 2014/15 - 2017/18 Transfers and subsidies 6 989 4 030 4 086 5 471 -7.8% 0.2% 4 440 4 833 5 173 -1.8% 0.2%Foreign governments and international organisations
100 – – 1 393 140.6% – – – – -100.0% –
Households 6 889 4 030 4 086 4 078 -16.0% 0.2% 4 440 4 833 5 173 8.3% 0.1%Payments for capital assets 14 439 15 413 15 584 16 108 3.7% 0.6% 30 020 15 718 17 361 2.5% 0.6%Buildings and other fixed structures 105 571 – 15 -47.7% – 16 17 18 6.3% – Machinery and equipment 14 334 14 261 15 584 16 093 3.9% 0.6% 30 004 15 701 17 343 2.5% 0.6%Software and other intangible assets – 581 – – – – – – – – – Payments for financial assets 46 902 – – – -100.0% 0.4% – – – – –
Total 2 213 242 2 451 664 2 892 877 3 047 451 11.3% 100.0% 2 931 657 3 131 439 3 303 979 2.7% 100.0%
Proportion of total programme expenditure to vote expenditure
44.1% 47.3% 49.3% 49.9% – – 51.4% 52.7% 50.5% – –
Details of transfers and subsidies
Households
Social benefits
Current 6 889 4 030 4 086 4 078 -16.0% 0.2% 4 440 4 833 5 173 8.3% 0.1%
Employee social benefits 6 889 4 030 4 086 4 078 -16.0% 0.2% 4 440 4 833 5 173 8.3% 0.1%
Foreign governments and international organisations
Current 100 – – 1 393 140.6% – – – – -100.0% –
Embassy of Palestine 100 – – 1 393 140.6% – – – – -100.0% –
Personnel information
Table 6.9 International Relations personnel numbers and cost by salary level¹
Number of posts estimated for 31 March 2015 Number and cost2 of personnel posts filled / planned for on funded establishment Number
Number of
funded posts
Number of posts
additional to the
establishment Actual Revised estimate Medium-term expenditure estimate
Averagegrowth
rate(%)
Salary level/total:
Average(%)
2013/14 2014/15 2015/16 2016/17 2017/18 2014/15 - 2017/18
International Relations
Number Cost Unit Cost
Number Cost
Unit Cost
Number Cost
Unit Cost
Number Cost
Unit Cost
Number Cost
Unit Cost
Salary level 2 831 – 2 761 1 714.6 0.6 2 795 1 813.3 0.6 2 795 1 728.2 0.6 2 795 1 789.3 0.6 2 797 1 896.5 0.7 0.0% 100.0%1 – 6 37 – 34 6.5 0.2 37 7.8 0.2 37 8.3 0.2 37 8.9 0.2 37 9.5 0.3 – 1.3%7 – 10 599 – 530 181.2 0.3 574 245.9 0.4 574 261.5 0.5 574 280.5 0.5 569 296.4 0.5 -0.3% 20.5%11 – 12 191 – 197 124.6 0.6 191 141.6 0.7 191 151.7 0.8 191 162.4 0.9 191 172.8 0.9 – 6.8%13 – 16 186 – 176 155.6 0.9 175 158.6 0.9 175 170.0 1.0 175 182.9 1.0 182 202.2 1.1 1.3% 6.3%Other 1 818 – 1 824 1
246.7 0.7 1 818 1
259.50.7 1 818 1
136.70.6 1 818 1
154.60.6 1 818 1
215.5 0.7 – 65.0%
1. Data has been provided by the department and may not necessarily reconcile with official government personnel data. 2. Rand million.
Programme 3: International Cooperation
Programme purpose
Participate in international organisations and institutions in line with South Africa’s national values and foreign policy objectives.
Objectives
• Contribute towards a reformed, strengthened and equal rules based multilateral system that will be responsive to the needs of developing countries, and Africa in particular, by participating in the global system of governance on an ongoing basis.
• Strengthen the AU and its structures by providing ongoing financial support for the operations of the Pan African Parliament in terms of the country host agreement.
• Improve governance and capacity in the SADC secretariat by implementing the secretariat’s job evaluation plan and assisting with the recruitment process on an ongoing basis.

2015 Estimates of National Expenditure
12
• Contribute towards New Partnership for Africa’s Development (NEPAD) processes for socioeconomic development in Africa by participating in the African Peer Review Mechanism and submitting the African Peer Review Mechanism country report when required.
• Strengthen bilateral, trilateral and multilateral interests and relations within the Brazil-Russia-India-China-South Africa group of countries dialogue forum through continuous active participation in forum structures.
• Strengthen political solidarity, economic cooperation and sociocultural relations with Asian countries by participating in the New Asian-African Strategic Partnership structures over the medium term.
• Strengthen North-South economic and political relations and cooperation to advance the African Agenda through the ongoing financing of development initiatives and support to institutional and governance reforms.
Subprogrammes
• Global System Governance provides for multilateralism and a rules based international order. This entails participating and playing an active role in all forums of the United Nations (UN) system and its specialised agencies, and funding programmes that promote the principles of multilateral activity.
• Continental Cooperation provides for the enhancement of the African Agenda and sustainable development. • South-South Cooperation provides for partnerships with countries of the South in advancing South Africa’s
own development needs and the needs of the African Agenda; and creates political, economic and social convergence for the fight against poverty, underdevelopment and the marginalisation of the South.
• North-South Dialogue provides for South Africa’s bilateral and multilateral engagements to consolidate and strengthen relations with organisations of the North to advance and support national priorities, the African Agenda and the developmental agenda of the South.
Expenditure trends and estimates
Table 6.10 International Cooperation expenditure trends and estimates by subprogramme and economic classification Subprogramme
Audited outcome Adjusted
appropriation
Averagegrowth
rate(%)
Expen-diture/Total:
Average(%)
Medium-term expenditure estimate
Averagegrowth
rate(%)
Expen-diture/Total:
Average(%)
R thousand 2011/12 2012/13 2013/14 2014/15 2011/12 - 2014/15 2015/16 2016/17 2017/18 2014/15 - 2017/18 Global System of Governance 196 003 221 807 249 445 266 332 10.8% 56.3% 253 330 264 374 291 216 3.0% 54.7%Continental Cooperation 77 445 81 985 124 200 156 337 26.4% 26.5% 133 604 136 778 133 623 -5.1% 28.5%South-South Cooperation 4 271 6 143 6 861 7 402 20.1% 1.5% 3 686 3 827 4 086 -18.0% 1.0%North-South Dialogue 55 288 60 461 71 183 74 329 10.4% 15.7% 76 325 78 491 83 240 3.8% 15.9%Total 333 007 370 396 451 689 504 400 14.8% 100.0% 466 945 483 470 512 165 0.5% 100.0%
Change to 2014 Budget estimate
18 029 (74 313) (76 740) (80 053)
Economic classification Current payments 334 116 367 713 441 055 503 310 14.6% 99.2% 464 850 480 535 509 082 0.4% 99.5%Compensation of employees 210 474 238 810 277 125 294 503 11.8% 61.5% 290 723 309 483 328 821 3.7% 62.2%Goods and services 123 642 128 903 163 930 208 807 19.1% 37.7% 174 127 171 052 180 261 -4.8% 37.3%of which: Administrative fees 247 194 310 195 -7.6% 0.1% 204 215 226 5.0% – Advertising 188 108 1 189 70 -28.1% 0.1% 972 1 025 1 076 148.6% 0.2%Assets less than the capitalisation threshold 1 171 317 264 125 -52.6% 0.1% 289 305 322 37.1% 0.1%Catering: Departmental activities 1 259 1 285 1 552 1 403 3.7% 0.3% 1 209 1 337 1 409 0.1% 0.3%Communication 4 711 4 628 4 763 3 840 -6.6% 1.1% 5 336 5 161 5 420 12.2% 1.0%Computer services 3 128 596 – -100.0% – – – – – – Consultants and professional services: Business and advisory services
400 1 934 1 133 -30.7% 0.1% 1 014 2 100 2 211 155.2% 0.3%
Consultants and professional services: Legal costs
1 684 1 049 1 164 1 398 -6.0% 0.3% 1 229 1 305 1 369 -0.7% 0.3%
Agency and support / outsourced services 1 013 1 245 4 549 113 -51.9% 0.4% 118 124 130 4.8% – Entertainment 1 429 1 654 1 636 1 977 11.4% 0.4% 2 068 2 178 2 287 5.0% 0.4%Fleet services (including government motor transport)
– – 31 – – – – – – – –
Inventory: Clothing material and accessories
– – 10 – – – – – – – –
Inventory: Farming supplies – – 60 – – – – – – – –

Vote 6: International Relations and Cooperation
13
Table 6.10 International Cooperation expenditure trends and estimates by subprogramme and economic classification Economic classification
Audited outcome Adjusted
appropriation
Averagegrowth
rate(%)
Expen-diture/Total:
Average(%)
Medium-term expenditure estimate
Averagegrowth
rate(%)
Expen-diture/Total:
Average(%)
R thousand 2011/12 2012/13 2013/14 2014/15 2011/12 - 2014/15 2015/16 2016/17 2017/18 2014/15 - 2017/18 Inventory: Food and food supplies 1 – – 229 511.8% – – – 265 5.0% – Inventory: Fuel, oil and gas 384 445 – 123 -31.6% 0.1% 381 401 492 58.7% 0.1%Inventory: Learner and teacher support material
3 – – – -100.0% – – – – – –
Inventory: Materials and supplies 12 17 2 2 -45.0% – 2 2 2 – – Inventory: Medical supplies 2 2 – 1 -20.6% – 1 1 1 – – Inventory: Other supplies 263 313 – 301 4.6% 0.1% 186 54 208 -11.6% – Consumable supplies – – 1 121 4 102 – 0.3% 192 344 149 -66.9% 0.2%Consumables: Stationery, printing and office supplies
1 502 1 152 1 232 1 493 -0.2% 0.3% 1 883 1 610 1 686 4.1% 0.3%
Operating leases 52 894 50 222 60 571 76 619 13.1% 14.5% 62 370 70 571 82 579 2.5% 14.9%Property payments 8 235 7 559 9 024 11 417 11.5% 2.2% 7 465 7 860 1 453 -49.7% 1.4%Travel and subsistence 32 338 39 183 57 988 55 059 19.4% 11.1% 51 541 47 755 45 942 -5.9% 10.2%Training and development 1 953 55 10 92 -63.9% 0.1% 97 103 108 5.5% – Operating payments 11 289 14 613 15 705 40 683 53.3% 5.0% 35 836 37 387 42 486 1.5% 8.0%Venues and facilities 2 099 1 744 705 2 028 -1.1% 0.4% 233 208 219 -52.4% 0.1%Rental and hiring – 97 129 – – – – – – – – Transfers and subsidies 213 84 996 234 3.2% 0.1% 26 28 29 -50.1% – Households 213 84 996 234 3.2% 0.1% 26 28 29 -50.1% – Payments for capital assets 2 766 2 599 9 638 856 -32.4% 1.0% 2 069 2 907 3 054 52.8% 0.5%Buildings and other fixed structures – – 921 – – 0.1% – – – – – Machinery and equipment 2 766 2 599 8 717 856 -32.4% 0.9% 2 069 2 907 3 054 52.8% 0.5%Payments for financial assets (4 088) – – – -100.0% -0.2% – – – – –
Total 333 007 370 396 451 689 504 400 14.8% 100.0% 466 945 483 470 512 165 0.5% 100.0%
Proportion of total programme expenditure to vote expenditure
6.6% 7.1% 7.7% 8.3% – – 8.2% 8.1% 7.8% – –
Details of transfers and subsidies
Households
Social benefits
Current 213 84 996 234 3.2% 0.1% 26 28 29 -50.1% –
Employee social benefits 213 84 996 234 3.2% 0.1% 26 28 29 -50.1% –
Personnel information
Table 6.11 International Cooperation personnel numbers and cost by salary level¹
Number of posts estimated for 31 March 2015 Number and cost2 of personnel posts filled / planned for on funded establishment Number
Number of
funded posts
Number of posts
additional to the
establishment Actual Revised estimate Medium-term expenditure estimate
Averagegrowth
rate(%)
Salary level/total:
Average(%)
2013/14 2014/15 2015/16 2016/17 2017/18 2014/15 - 2017/18
International Cooperation
Number Cost Unit Cost
Number Cost
Unit Cost
Number Cost
Unit Cost
Number Cost
Unit Cost
Number Cost
Unit Cost
Salary level 471 1 415 277.1 0.7 471 292.3 0.6 471 290.7 0.6 471 309.5 0.7 471 328.8 0.7 – 100.0%1 – 6 22 – 17 3.2 0.2 22 4.6 0.2 22 4.9 0.2 22 5.3 0.2 22 5.6 0.3 – 4.7%7 – 10 172 1 134 46.1 0.3 172 72.2 0.4 172 75.2 0.4 172 79.4 0.5 172 84.0 0.5 – 36.5%11 – 12 89 – 75 47.5 0.6 89 60.3 0.7 89 68.9 0.8 89 74.1 0.8 89 78.6 0.9 – 18.9%13 – 16 38 – 37 33.5 0.9 38 35.2 0.9 38 37.7 1.0 38 40.3 1.1 38 42.9 1.1 – 8.1%Other 150 – 152 146.8 1.0 150 120.1 0.8 150 104.0 0.7 150 110.4 0.7 150 117.7 0.8 – 31.8%
1. Data has been provided by the department and may not necessarily reconcile with official government personnel data. 2. Rand million.
Programme 4: Public Diplomacy and Protocol Services
Programme purpose
Communicate South Africa’s role and position in international relations in domestic and international arenas, and provide protocol services.

2015 Estimates of National Expenditure
14
Objectives
• Ensure a better understanding of South Africa’s foreign policy by providing ongoing strategic public diplomacy direction and state protocol services nationally and internationally.
Subprogrammes
• Public Diplomacy promotes a positive projection of South Africa’s image; communicates foreign policy positions to both domestic and foreign audiences; and markets and brands South Africa by using public diplomacy platforms, strategies, products and services.
• Protocol Services facilitates incoming and outgoing high level visits and ceremonial events, coordinates and regulates engagement with the local diplomatic community, provides protocol advice and support to the various spheres of government, facilitates the hosting of international conferences in South Africa, and manages state protocol lounges and guesthouses.
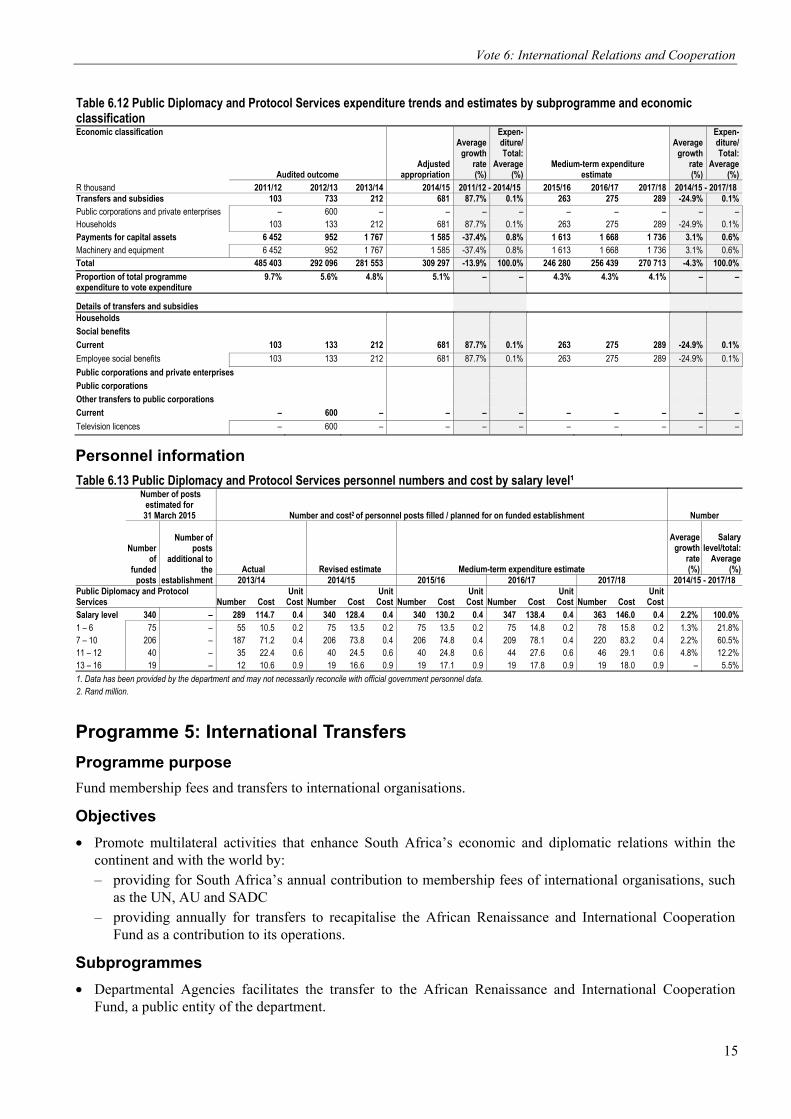
Expenditure trends and estimates Table 6.12 Public Diplomacy and Protocol Services expenditure trends and estimates by subprogramme and economic classification Subprogramme
Audited outcome Adjusted
appropriation
Averagegrowth
rate(%)
Expen-diture/Total:
Average(%)
Medium-term expenditure estimate
Averagegrowth
rate(%)
Expen-diture/Total:
Average(%)
R thousand 2011/12 2012/13 2013/14 2014/15 2011/12 - 2014/15 2015/16 2016/17 2017/18 2014/15 - 2017/18 Public Diplomacy 49 013 68 195 73 987 62 781 8.6% 18.6% 62 345 65 125 68 967 3.2% 23.9%Protocol Services 436 390 223 901 207 566 246 516 -17.3% 81.4% 183 935 191 314 201 746 -6.5% 76.1%Total 485 403 292 096 281 553 309 297 -13.9% 100.0% 246 280 256 439 270 713 -4.3% 100.0%
Change to 2014 Budget estimate
(7 952) (3 999) (9 449) (10 163)
Economic classification Current payments 478 848 290 411 279 574 307 031 -13.8% 99.1% 244 404 254 496 268 688 -4.3% 99.3%Compensation of employees 95 639 106 112 114 681 125 023 9.3% 32.3% 130 181 138 386 146 016 5.3% 49.8%Goods and services 383 209 184 299 164 893 182 008 -22.0% 66.8% 114 223 116 110 122 672 -12.3% 49.4%of which: Advertising 11 389 10 968 3 637 12 782 3.9% 2.8% 4 679 5 524 5 828 -23.0% 2.7%Assets less than the capitalisation threshold 291 60 565 12 -65.5% 0.1% 13 14 14 5.3% – Catering: Departmental activities 1 192 984 1 879 22 659 166.9% 2.0% 1 734 1 802 1 875 -56.4% 2.6%Communication 30 931 5 623 8 426 3 911 -49.8% 3.6% 4 042 3 764 3 953 0.4% 1.4%Computer services 38 946 1 108 104 668 -74.2% 3.0% 183 193 203 -32.8% 0.1%Consultants and professional services: Business and advisory services
72 9 978 16 58 -7.0% 0.7% 61 64 67 4.9% –
Consultants and professional services: Infrastructure and planning
– – 20 – – – – – – – –
Consultants and professional services: Legal costs
– 150 – – – – – – – – –
Contractors 233 798 672 163 -11.2% 0.1% 171 180 189 5.1% 0.1%Agency and support / outsourced services – 278 – – – – – – – – – Entertainment 213 136 543 118 -17.9% 0.1% 226 239 250 28.4% 0.1%Fleet services (including government motor transport)
– – 3 – – – – – – – –
Inventory: Clothing material and accessories
– – – 673 – – – – – -100.0% 0.1%
Inventory: Food and food supplies 848 3 556 275 831 -0.7% 0.4% 452 292 599 -10.3% 0.2%Inventory: Fuel, oil and gas – 38 1 – – – – – – – – Inventory: Learner and teacher support material
– 17 – – – – – – – – –
Inventory: Materials and supplies 56 7 1 – -100.0% – – – – – – Inventory: Medical supplies – – – 4 – – – – – -100.0% – Inventory: Medicine – – – 48 – – – – – -100.0% – Inventory: Other supplies 407 813 – 5 -76.9% 0.1% – – 1 -41.5% – Consumable supplies – – 3 047 1 500 – 0.3% 2 575 2 652 2 731 22.1% 0.9%Consumables: Stationery, printing and office supplies
3 789 3 793 3 915 3 095 -6.5% 1.1% 4 609 4 784 4 955 17.0% 1.6%
Operating leases 1 114 – 1 – -100.0% 0.1% – – – – – Property payments 28 863 29 576 30 985 30 625 2.0% 8.8% 35 615 33 892 35 061 4.6% 12.5%Travel and subsistence 159 155 91 184 101 857 78 995 -20.8% 31.5% 55 751 57 178 59 846 -8.8% 23.3%Training and development – – 2 – – – – – – – – Operating payments 2 630 1 925 1 081 1 858 -10.9% 0.5% 1 404 1 836 1 910 0.9% 0.6%Venues and facilities 95 659 20 149 5 878 23 619 -37.3% 10.6% 2 827 3 718 5 213 -39.6% 3.3%Rental and hiring 6 699 3 081 1 965 – -100.0% 0.9% – – – – –
Vote 6: International Relations and Cooperation
15
Table 6.12 Public Diplomacy and Protocol Services expenditure trends and estimates by subprogramme and economic classification Economic classification
Audited outcome Adjusted
appropriation
Averagegrowth
rate(%)
Expen-diture/Total:
Average(%)
Medium-term expenditure estimate
Averagegrowth
rate(%)
Expen-diture/Total:
Average(%)
R thousand 2011/12 2012/13 2013/14 2014/15 2011/12 - 2014/15 2015/16 2016/17 2017/18 2014/15 - 2017/18 Transfers and subsidies 103 733 212 681 87.7% 0.1% 263 275 289 -24.9% 0.1%Public corporations and private enterprises – 600 – – – – – – – – – Households 103 133 212 681 87.7% 0.1% 263 275 289 -24.9% 0.1%Payments for capital assets 6 452 952 1 767 1 585 -37.4% 0.8% 1 613 1 668 1 736 3.1% 0.6%Machinery and equipment 6 452 952 1 767 1 585 -37.4% 0.8% 1 613 1 668 1 736 3.1% 0.6%Total 485 403 292 096 281 553 309 297 -13.9% 100.0% 246 280 256 439 270 713 -4.3% 100.0%
Proportion of total programme expenditure to vote expenditure
9.7% 5.6% 4.8% 5.1% – – 4.3% 4.3% 4.1% – –
Details of transfers and subsidies
Households
Social benefits
Current 103 133 212 681 87.7% 0.1% 263 275 289 -24.9% 0.1%
Employee social benefits 103 133 212 681 87.7% 0.1% 263 275 289 -24.9% 0.1%
Public corporations and private enterprises
Public corporations
Other transfers to public corporations
Current – 600 – – – – – – – – –
Television licences – 600 – – – – – – – – –
Personnel information
Table 6.13 Public Diplomacy and Protocol Services personnel numbers and cost by salary level¹
Number of posts estimated for 31 March 2015 Number and cost2 of personnel posts filled / planned for on funded establishment Number
Number of
funded posts
Number of posts
additional to the
establishment Actual Revised estimate Medium-term expenditure estimate
Averagegrowth
rate(%)
Salary level/total:
Average(%)
2013/14 2014/15 2015/16 2016/17 2017/18 2014/15 - 2017/18 Public Diplomacy and Protocol Services
Number Cost
Unit Cost
Number Cost
Unit Cost
Number Cost
Unit Cost
Number Cost
Unit Cost
Number Cost
Unit Cost
Salary level 340 – 289 114.7 0.4 340 128.4 0.4 340 130.2 0.4 347 138.4 0.4 363 146.0 0.4 2.2% 100.0%1 – 6 75 – 55 10.5 0.2 75 13.5 0.2 75 13.5 0.2 75 14.8 0.2 78 15.8 0.2 1.3% 21.8%7 – 10 206 – 187 71.2 0.4 206 73.8 0.4 206 74.8 0.4 209 78.1 0.4 220 83.2 0.4 2.2% 60.5%11 – 12 40 – 35 22.4 0.6 40 24.5 0.6 40 24.8 0.6 44 27.6 0.6 46 29.1 0.6 4.8% 12.2%13 – 16 19 – 12 10.6 0.9 19 16.6 0.9 19 17.1 0.9 19 17.8 0.9 19 18.0 0.9 – 5.5%
1. Data has been provided by the department and may not necessarily reconcile with official government personnel data. 2. Rand million.
Programme 5: International Transfers
Programme purpose
Fund membership fees and transfers to international organisations.
Objectives
• Promote multilateral activities that enhance South Africa’s economic and diplomatic relations within the continent and with the world by: – providing for South Africa’s annual contribution to membership fees of international organisations, such
as the UN, AU and SADC – providing annually for transfers to recapitalise the African Renaissance and International Cooperation
Fund as a contribution to its operations.
Subprogrammes
• Departmental Agencies facilitates the transfer to the African Renaissance and International Cooperation Fund, a public entity of the department.

2015 Estimates of National Expenditure
16
• Membership Contribution facilitates transfers to international organisations annually.
Expenditure trends and estimates
Table 6.14 International Transfers expenditure trends and estimates by subprogramme and economic classification Subprogramme
Audited outcome Adjusted
appropriation
Averagegrowth
rate(%)
Expen-diture/Total:
Average(%)
Medium-term expenditure estimate
Averagegrowth
rate(%)
Expen-diture/Total:
Average(%)
R thousand 2011/12 2012/13 2013/14 2014/15 2011/12 - 2014/15 2015/16 2016/17 2017/18 2014/15 - 2017/18 Departmental agencies 450 370 517 982 485 442 285 560 -14.1% 48.9% 154 037 96 831 431 483 14.8% 32.4%Membership contribution 369 218 419 793 492 539 538 047 13.4% 51.1% 481 194 506 707 489 622 -3.1% 67.6%Total 819 588 937 775 977 981 823 607 0.2% 100.0% 635 231 603 538 921 105 3.8% 100.0%
Change to 2014 Budget estimate
79 318 (211 574) (314 508) (423)
Economic classification Transfers and subsidies 819 588 937 775 977 981 823 607 0.2% 100.0% 635 231 603 538 921 105 3.8% 100.0%Departmental agencies and accounts 450 370 517 982 485 442 285 560 -14.1% 48.9% 154 037 96 831 431 483 14.8% 32.4%Foreign governments and international organisations
369 218 419 793 492 539 538 047 13.4% 51.1% 481 194 506 707 489 622 -3.1% 67.6%
Total 819 588 937 775 977 981 823 607 0.2% 100.0% 635 231 603 538 921 105 3.8% 100.0%
Proportion of total programme expenditure to vote expenditure
16.3% 18.1% 16.7% 13.5% – – 11.1% 10.2% 14.1% – –
Details of transfers and subsidies
Departmental agencies and accounts
Departmental agencies (non-business entities)
Current 450 370 517 982 485 442 285 560 -14.1% 48.9% 154 037 96 831 431 483 14.8% 32.4%
African Renaissance and International Cooperation Fund
450 370 517 982 485 442 277 560 -14.9% 48.6% 145 637 88 031 422 243 15.0% 31.3%
Southern African Development Partnership Agency
– – – 8 000 – 0.2% 8 400 8 800 9 240 4.9% 1.2%
Foreign governments and international organisations
Current 369 218 419 793 492 539 538 047 13.4% 51.1% 481 194 506 707 489 622 -3.1% 67.6%
African Union 125 017 167 045 176 768 171 439 11.1% 18.0% 160 216 168 707 177 142 1.1% 22.7%
Group of 77 countries 109 113 120 122 3.8% – 128 135 142 5.2% –
India-Brazil-South Africa Trust Fund 7 675 9 060 8 441 12 683 18.2% 1.1% 9 424 9 923 10 419 -6.3% 1.4%
New Partnership for Africa's Development 21 164 7 500 10 085 7 950 -27.8% 1.3% 8 316 8 757 9 195 5.0% 1.1%
African Peer Review Mechanism 9 993 2 500 1 017 2 650 -35.8% 0.5% 2 772 2 919 3 065 5.0% 0.4%
Organisation for Economic Cooperation and Development
363 329 394 250 -11.7% – 262 274 288 4.8% –
United Nations Development Programme 4 861 7 557 6 810 10 649 29.9% 0.8% 6 206 6 535 6 862 -13.6% 1.0%
African, Caribbean and Pacific Group of States
4 604 5 664 3 916 12 722 40.3% 0.8% 4 378 4 610 4 841 -27.5% 0.9%
Commonwealth of Nations 4 976 5 604 7 029 9 963 26.0% 0.8% 10 421 10 973 11 522 5.0% 1.4%
Southern African Development Community 42 598 52 408 66 925 74 081 20.3% 6.6% 50 374 53 044 55 695 -9.1% 7.8%
United Nations 114 055 129 546 152 664 158 100 11.5% 15.6% 146 334 154 090 161 793 0.8% 20.8%
United Nations Human Rights Council 378 1 122 – 367 -1.0% 0.1% 384 404 424 4.9% 0.1%
Biochemical and Toxin Weapons Convention
222 304 437 531 33.7% – 555 584 613 4.9% 0.1%
Comprehensive Nuclear-Test-Ban Treaty 6 013 1 270 5 112 6 394 2.1% 0.5% 6 688 7 042 7 394 5.0% 0.9%
Humanitarian aid 23 993 24 747 28 199 26 979 4.0% 2.9% 29 358 30 854 32 397 6.3% 4.0%
Indian Ocean Rim Research Centre – – 180 154 – – 161 170 179 5.1% –
Perez-Guerrero Trust Fund 58 60 63 65 3.9% – 68 72 76 5.3% –
South Centre Capital Fund 1 199 1 164 – 1 283 2.3% 0.1% 1 342 1 413 1 484 5.0% 0.2%
United Nations Development Programme in Southern Africa
1 150 1 150 1 150 1 219 2.0% 0.1% 1 275 1 343 1 410 5.0% 0.2%
United Nations technical cooperation 297 – – 122 -25.7% – 128 135 142 5.2% –
United Nations Voluntary Fund for Disability 76 79 – 81 2.1% – 85 90 95 5.5% –
United Nations Children's Fund 230 241 – 244 2.0% – 255 269 282 4.9% –
United Nations Convention on the Law of the Sea
– 305 – 613 – – 641 675 709 5.0% 0.1%
African Union Commission – – 21 904 36 400 – 1.6% 38 300 40 400 3 453 -54.4% 4.0%
Other transfer payments 187 2 025 1 325 2 986 151.8% 0.2% 3 123 3 289 – -100.0% 0.3%

Vote 6: International Relations and Cooperation
17
Public entities and other agencies
African Renaissance and International Cooperation Fund
Mandate The African Renaissance and International Cooperation Fund was established under the African Renaissance and International Cooperation Fund Act (2001), in terms of which it is mandated to:
• enhance cooperation between South Africa and other countries, in particular African countries • promote democracy and good governance • work for the prevention and resolution of conflicts • promote socioeconomic development and integration • provide humanitarian assistance and human resources development.
Selected performance indicators
Table 6.15 African Renaissance and International Cooperation Fund performance indicators by programme/objective/activity and related outcome Indicator Programme/Objective/Activity Outcome Past Current Projections 2011/12 2012/13 2013/14 2014/15 2015/16 2016/17 2017/18Value of funds approved for human resource development per year
Promote human resource development
Outcome 11: Create a better South Africa, a better Africa and a better world
R60m R86m –1 R55.3 m R16 m R16.5m R17.3m
Value of funds approved for humanitarian assistance and disaster relief per year
Humanitarian assistance and disaster relief
R15.m R134.7m –1 R46.2m R152m R160.1m R168.1m
Value of funds approved for cooperation between South Africa and other countries per year
Cooperation between South Africa and other countries, particularly African countries
R130m R49.1m R41.3 m R50.2m R58.5m R 61.6m R 64.7m
Value of funds approved for the prevention and resolution of conflict per year
Prevention and resolution of conflicts R80m R15m –1 R25.1m R46.1m R56.2m R 59.1m
1. No disbursements were made in 2013/14 due to the restructuring of the fund.
Expenditure analysis The national development plan supports an economically integrated Southern Africa and prioritises the flow of development cooperation between countries. According to the plan, development cooperation is an approach that combines market integration, cross-border infrastructure development and policy coordination to diversify production and boost intra-African trade. Outcome 11 of government’s 2014-2019 medium term strategic framework (create a better South Africa, a better Africa and a better world) gives effect to the plan by emphasising that South Africa, informed by its national interests, is a globally competitive economy and an influential and leading member of the international community.
The African Renaissance and International Cooperation Fund, set up in 2000 to replace the Economic Cooperation Promotion Loan Fund, remains the most defined and structured instrument of South Africa’s development assistance. Since 1994, South Africa’s development cooperation with the rest of Africa has been largely defined in terms of geographic priority, infrastructure development, mediation and national reconstruction development. Assistance has been provided to countries outside of the continent that share ideological links with South Africa and have experienced similar liberation struggles.
A comprehensive review of the fund presented evidence to suggest a need for a more coherent, scaled up government intervention to address shortcomings in the current institutional and policy arrangements for the management and implementation of outgoing development cooperation. Cabinet approved the conceptual framework for the South African Development and Partnership Agency in 2009, and the business case for the agency in 2012. In terms of the business case, the agency is being established as a government component to replace the African Renaissance and International Cooperation Fund. The agency will be an autonomous body under the policy and strategic oversight of the Minister of International Relations and Cooperation. The legislative process for establishing the agency is under way, with the Partnership Fund for Development Bill will be presented before Parliament. Once enacted, the bill will repeal the African Renaissance and International

2015 Estimates of National Expenditure
18
Cooperation Fund Act (2000), resulting in the integration of functions and transferring of funds and assets from the fund to the agency.
The department will focus on the operationalisation of the agency over the medium term. Its functions, though extended, include providing humanitarian assistance and natural disaster relief, ensuring increased cooperation between South Africa and other countries, preventing and resolving conflicts, supporting peace missions, strengthening democracy, and promoting infrastructure development on the continent. To this end, the Fund will approve R161.4 million for the prevention and resolution of conflict over the medium term.
Cabinet approved budget reductions of R530 million over the medium term will be effected on transfers to the fund. The Fund will use its accumulated reserves to sustain itself so there is not an adverse effect on service delivery. At the end of March 2014, the fund had accumulated reserves of R1.5 billion.
Programmes/objectives/activities
Table 6.16 African Renaissance and International Cooperation Fund expenditure trends and estimates by programme/objective/activity
Audited outcome Revisedestimate
Averagegrowth
rate(%)
Expen-diture/Total:
Average(%)
Medium-term expenditure estimate
Averagegrowth
rate(%)
Expen-diture/Total:
Average(%)
R thousand 2011/12 2012/13 2013/14 2014/15 2011/12 - 2014/15 2015/16 2016/17 2017/18 2014/15 - 2017/18 Promote socioeconomic development and integration
125 726 321 634 41 300 41 961 -30.6% 47.5% 11 998 10 554 58 332 11.6% 12.3%
Promote democracy and good governance
130 200 – – 43 395 -30.7% 15.5% 20 239 15 721 56 413 9.1% 15.2%
Promote human resource development
13 600 155 748 – 16 942 7.6% 6.4% 6 000 5 500 17 325 0.7% 5.1%
Humanitarian assistance and disaster relief
10 636 576 600 – 121 963 125.5% 25.4% 107 400 56 256 166 440 10.9% 55.3%
Cooperation between South Africa and other countries, particularly African countries
– – – 28 174 – 2.5% – – 64 680 31.9% 6.4%
Prevention and resolution of conflicts – 16 324 – 25 125 – 2.6% – – 59 053 33.0% 5.8%Total 280 162 1 070 306 41 300 277 560 -0.3% 100.0% 145 637 88 031 422 243 15.0% 100.0%
Statements of historical financial performance and position
Table 6.17 African Renaissance and International Cooperation Fund statements of historical financial performance and position Statement of financial performance
Budget Audited outcome Budget
Audited outcome Budget
Audited outcome
Budget estimate
Revised estimate
Outcome/ Budget
Average(%)
R thousand 2011/12 2012/13 2013/14 2014/15 2011/12 - 2014/15 Revenue Non-tax revenue 65 497 77 177 68 772 83 467 72 210 93 564 76 543 98 242 124.5%Other non-tax revenue 65 497 77 177 68 772 83 467 72 210 93 564 76 543 98 242 124.5%Transfers received 450 370 450 370 444 982 517 982 476 942 485 442 277 560 277 560 104.9%Total revenue 515 867 527 547 513 754 601 449 549 152 579 006 354 103 375 802 107.8%
Expenses Current expenses – 9 526 – – – – 190 483 – 5.0%Goods and services – 9 526 – – – – 190 483 – 5.0%Transfers and subsidies – 270 636 – 1 070 306 476 942 41 300 87 077 277 560 294.3%Total expenses – 280 162 – 1 070 306 476 942 41 300 277 560 277 560 221.2%
Surplus/(Deficit) 515 867 247 385 513 754 (468 857) 72 210 537 706 76 543 98 242 – Statement of financial position Receivables and prepayments 35 875 66 931 70 617 125 442 70 617 195 165 70 617 – 156.4%Cash and cash equivalents 1 953 309 1 727 595 1 565 086 1 515 014 2 654 641 1 864 871 2 787 373 – 57.0%Total assets 1 989 184 1 794 526 1 635 703 1 640 456 2 725 258 2 060 036 2 857 990 – 59.7%
Accumulated surplus/(deficit) 450 916 1 384 590 1 190 310 932 956 – 1 470 662 – – 230.8%Trade and other payables 392 332 409 936 445 393 707 500 – 589 374 774 087 – 105.9%Total equity and liabilities 843 248 1 794 526 1 635 703 1 640 456 – 2 060 036 774 087 – 168.9%

Vote 6: International Relations and Cooperation
19
Statements of estimates of financial performance and position
Table 6.18 African Renaissance and International Cooperation Fund statements of estimates of financial performance and position Statement of financial performance Revised
estimate Average
growth rate (%)
Expen- diture/ Total:
Average (%)
Medium-term estimate Average growth
rate (%)
Expen- diture/ Total:
Average (%)
R thousand 2014/15 2011/12 - 2014/15 2015/16 2016/17 2017/18 2014/15 - 2017/18
Revenue Non-tax revenue 98 242 8.4% 17.7% 103 154 108 312 113 728 5.0% 36.0%Other non-tax revenue 98 242 8.4% 17.7% 103 154 108 312 113 728 5.0% 36.0%Transfers received 277 560 -14.9% 82.3% 145 637 88 031 422 243 15.0% 64.0%Total revenue 375 802 -10.7% 100.0% 248 791 196 343 535 971 12.6% 100.0%
Expenses Transfers and subsidies 277 560 0.8% 99.1% 145 637 88 031 422 243 15.0% 100.0%Total expenses 277 560 -0.3% 100.0% 145 637 88 031 422 243 15.0% 100.0%
Surplus/(Deficit) 98 242 -26.5% 103 154 108 312 113 728 5.0% Statement of financial position Receivables and prepayments – -100.0% – 74 147 77 855 81 748 – – Cash and cash equivalents – -100.0% – 2 056 020 2 158 821 2 266 762 – – Total assets – -100.0% – 2 130 167 2 236 676 2 348 510 – –
Accumulated surplus/(deficit) – -100.0% – 1 317 376 1 383 246 1 452 408 – – Trade and other payables – -100.0% – 812 791 853 430 896 102 – – Total equity and liabilities – -100.0% – 2 130 167 2 236 676 2 348 510 – –

2015 Estimates of National Expenditure
20
Additional tables Table 6.A Summary of departmental public private partnership projects Project description: Suitable and sustainable working environment for the department Project
annual unitary fee
at time ofcontract
Budgetedexpenditure Medium-term expenditure estimate
R thousand 2014/15 2015/16 2016/17 2017/18
Projects signed in terms of Treasury Regulation 16 101 254 196 257 207 640 219 061 230 670
Public private partnership unitary charge1 101 254 196 257 207 640 219 061 230 670
Of which:
Capital portion 84 041 162 893 172 341 181 820 191 456
Services provided by the operator 17 213 33 364 35 299 37 241 39 214
Total 101 254 196 257 207 640 219 061 230 670
1. Only payments that have received Treasury approval.
Disclosure notes for projects signed in terms of Treasury Regulation 16 Project name Public private partnership for the design, construction, operation and maintenance of a suitable and
sustainable working environment for the department Brief description New head office building: public private partnership agreement for the design, construction,
operation and maintenance of a suitable and sustainable working environment Date public private partnership agreement was signed 2009/03/13
Duration of public private partnership agreement 25 years
Significant contingent fiscal obligations including termination payments, guarantees, warranties and indemnities and maximum estimated value of such liabilities
None

21
Vote 6: International Relations and Cooperation
Tabl
e 6.
B S
umm
ary
of e
xpen
ditu
re o
n in
fras
truc
ture
Pr
ojec
t nam
e S
ervi
ce d
eliv
ery
o
utpu
ts
Cur
rent
p
roje
ct s
tage
To
tal
proj
ect c
ost
Aud
ited
outc
ome
A
djus
ted
appr
opria
tion
Med
ium
-term
exp
endi
ture
est
imat
e
R th
ousa
nd
2
011/
12
201
2/13
2
013/
14
201
4/15
2
015/
16
201
6/17
2
017/
18
Dep
artm
enta
l inf
rast
ruct
ure
D
ar e
s Sa
laam
: Con
stru
ctio
n of
cha
ncer
y
Func
tiona
l and
effe
ctiv
e of
fice
acco
mm
odat
ion
C
onst
ruct
ion
114
298
876
350
27
472
52
000
29
700
3
900
–
Lilo
ngw
e: C
onst
ruct
ion
of c
hanc
ery
and
staf
f hou
sing
Fu
nctio
nal a
nd e
ffect
ive
offic
e ac
com
mod
atio
n an
d st
aff h
ousi
ng
Con
stru
ctio
n
11
7 87
7
1
03
74
11
600
55
400
45
500
5
200
–
Stan
dard
cha
ncer
y an
d of
ficia
l res
iden
ce
desi
gn p
roje
ct c
once
pt
Onc
e of
f pro
ject
with
an
aim
to d
esig
n a
stan
dard
con
cept
for t
he c
hanc
ery
and
offic
ial
resi
denc
e
Des
ign
500
–
–
–
500
–
–
–
Kiga
li: C
onst
ruct
ion
of c
hanc
ery
and
offic
ial r
esid
ence
Fu
nctio
nal a
nd e
ffect
ive
offic
e ac
com
mod
atio
n an
d of
ficia
l res
iden
ce
Des
ign
31
900
–
–
–
–
–
5
900
26 0
00
Mba
bane
: Con
stru
ctio
n of
sta
ff ho
usin
g Fu
nctio
nal a
nd e
ffect
ive
staf
f hou
sing
Fe
asib
ility
65
759
–
659
2
000
–
3
500
28
600
31 0
00
Mba
bane
: Con
stru
ctio
n of
cha
ncer
y
Func
tiona
l and
effe
ctiv
e of
fice
acco
mm
odat
ion
Feas
ibilit
y
2
9 50
0 –
–
–
–
2
50
6 2
50
23
000
M
onte
vide
o: C
onst
ruct
ion
of s
taff
hous
ing
Fu
nctio
nal a
nd e
ffect
ive
staf
f hou
sing
Fe
asib
ility
3
251
–
–
–
–
–
3
251
–
Luan
da: P
rope
rty a
cqui
sitio
n
Func
tiona
l and
effe
ctiv
e of
fice
acco
mm
odat
ion
Iden
tific
atio
n
6 0
00 –
–
–
–
–
6 00
0 –
Lo
ndon
: Ref
urbi
shm
ent o
f offi
cial
re
side
nce
Ref
urbi
shm
ent o
f inf
rast
ruct
ure
H
ande
d ov
er
47
158
46
372
786
–
–
–
–
–
Was
hing
ton:
Ref
urbi
shm
ent o
f cha
ncer
y
Ref
urbi
shm
ent o
f inf
rast
ruct
ure
H
ande
d ov
er
234
170
39
437
89
153
88
080
17
500
–
–
–
Cop
enha
gen:
Ref
urbi
shm
ent o
f cha
ncer
y an
d of
ficia
l res
iden
ce
Ref
urbi
shm
ent o
f inf
rast
ruct
ure
Fe
asib
ility
29
044
244
–
300
2
500
–
11
500
14 5
00
Paris
: Ref
urbi
shm
ent o
f cha
ncer
y an
d of
ficia
l res
iden
ce
Ref
urbi
shm
ent o
f inf
rast
ruct
ure
Te
nder
9
0 99
6
1
52
4
24
1 0
20 –
5 0
00
4
3 40
0
41
000
The
Hag
ue: R
efur
bish
men
t of c
hanc
ery
and
offic
ial r
esid
ence
R
efur
bish
men
t of i
nfra
stru
ctur
e
Feas
ibilit
y
15
3 58
7
3 6
22
3 8
05
15 0
00
72 1
60
5
4 00
0
5 0
00 –
Mad
rid: R
efur
bish
men
t of c
hanc
ery
and
offic
ial r
esid
ence
R
efur
bish
men
t of i
nfra
stru
ctur
e
Feas
ibilit
y
4 5
00 –
–
–
–
4 5
00 –
–
Sao
Paul
o: R
efur
bish
men
t of c
hanc
ery
Ref
urbi
shm
ent o
f inf
rast
ruct
ure
Fe
asib
ility
2
688
–
1
420
1
068
–
200
–
–
Rom
e: R
efur
bish
men
t of c
hanc
ery
Ref
urbi
shm
ent o
f inf
rast
ruct
ure
Fe
asib
ility
4
700
–
–
–
–
3
000
1
700
–
Lond
on: R
efur
bish
men
t of c
hanc
ery
Ref
urbi
shm
ent o
f inf
rast
ruct
ure
Fe
asib
ility
51
000
–
–
–
–
7
500
28
000
15 5
00
Kins
hasa
: Ref
urbi
shm
ent o
f cha
ncer
y R
efur
bish
men
t of i
nfra
stru
ctur
e
Feas
ibilit
y
1
5 00
0 –
–
–
–
1
0 00
0
5 0
00 –
N
ew Y
ork:
Ref
urbi
shm
ent o
f offi
cial
re
side
nce
R
efur
bish
men
t of i
nfra
stru
ctur
e
Feas
ibilit
y
5 0
00 –
–
–
–
2 5
00
2 5
00 –
Buen
os A
ires:
Ref
urbi
shm
ent o
f cha
ncer
y R
efur
bish
men
t of i
nfra
stru
ctur
e
Feas
ibilit
y
2
5 00
0 –
–
–
–
3 5
00
1
3 00
0
8
500
H
arar
e: R
efur
bish
men
t of c
hanc
ery
Ref
urbi
shm
ent o
f inf
rast
ruct
ure
Fe
asib
ility
18
001
–
–
–
–
1
800
5
000
11 2
01
Map
uto:
Ref
urbi
shm
ent o
f cha
ncer
y,
offic
ial r
esid
ence
and
sta
ff ho
usin
g R
efur
bish
men
t of i
nfra
stru
ctur
e
Feas
ibilit
y
2
8 50
0 –
–
–
–
3 0
00
1
9 00
0
6
500
Lisb
on: R
efur
bish
men
t of c
hanc
ery
Ref
urbi
shm
ent o
f inf
rast
ruct
ure
Fe
asib
ility
21
500
–
–
–
–
3
500
10
000
8 0
00
Tehr
an: R
efur
bish
men
t of o
ffici
al
resi
denc
e R
efur
bish
men
t of i
nfra
stru
ctur
e
Feas
ibilit
y
8 5
00 –
–
–
–
2 5
00
2 5
00
3
500
Vien
na: R
efur
bish
men
t of c
hanc
ery
Ref
urbi
shm
ent o
f inf
rast
ruct
ure
Fe
asib
ility
28
000
–
–
–
–
5
500
7
500
15 0
00
Abuj
a: C
onst
ruct
ion
of c
hanc
ery
and
offic
ial r
esid
ence
Fu
nctio
nal a
nd e
ffect
ive
offic
e ac
com
mod
atio
n an
d of
ficia
l res
iden
ce
On
hold
1
1 94
1
1
0 80
3
1 1
38 –
–
–
–
–
Mas
eru:
Offi
ce a
ccom
mod
atio
n Fu
nctio
nal a
nd e
ffect
ive
offic
e ac
com
mod
atio
n Id
entif
icat
ion
1
477
378
7
6
1 0
23 –
–
–
–
To
kyo:
Ref
urbi
shm
ent o
f offi
cial
resi
denc
e R
efur
bish
men
t of i
nfra
stru
ctur
e
Feas
ibilit
y
5
0 71
8
1 1
78
12 9
90
35 5
50
1 0
00 –
–
–
R
efur
bish
men
t at v
ario
us m
issi
ons
Ref
urbi
shm
ent o
f inf
rast
ruct
ure
Va
rious
8
2 15
6
1 2
54
2 1
74
19 8
06
7 2
34
2
1 18
8
1
0 50
0
20
000
Lo
ndon
: Ac
quis
ition
of C
aven
dish
Clo
se
Ref
urbi
shm
ent o
f inf
rast
ruct
ure
Id
entif
icat
ion
5
778
5
778
–
–
–
–
–
–
Gen
eva:
Acq
uisi
tion
of o
ffici
al re
side
nce
R
efur
bish
men
t of i
nfra
stru
ctur
e
Vario
us
95
019
95
019
–
–
–
–
–
–
Mba
bane
: Ref
urbi
shm
ent o
f offi
cial
re
side
nce
Ref
urbi
shm
ent o
f inf
rast
ruct
ure
Te
nder
1
0 40
0 –
–
–
5 2
00
5 2
00 –
–
Tota
l
1 39
3 91
8
20
5 21
6
1
13 0
49
2
02 9
19
2
13 4
94
2
11 8
38
22
3 70
1
223
701

22
2015 Estimates of National Expenditure
Tabl
e 6.
C S
umm
ary
of d
onor
fund
ing
D
onor
P
roje
ct
Pro
gram
me
Pe
riod
of
com
mitm
ent
Am
ount
com
mitt
ed M
ain
econ
omic
c
lass
ifica
tion
Sp
endi
ng
focu
s A
udite
d ou
tcom
e
Est
imat
e M
ediu
m-te
rm e
xpen
ditu
re e
stim
ate
R th
ousa
nd
2
011/
12
201
2/13
2
013/
14
201
4/15
2
015/
16
201
6/17
2
017/
18
Fore
ign
In
cas
h
Eu
rope
an U
nion
Pr
ogra
mm
e to
sup
port
pro-
poor
po
licy
deve
lopm
ent i
n So
uth
Afric
a Ad
min
istra
tion
Nov
embe
r 20
07 -
June
20
12
5
8 98
3G
oods
and
ser
vice
s Th
e fu
nds
have
bee
n sp
ent o
n pr
ogra
mm
e m
anag
emen
t cos
ts.
The
prog
ram
me
has
2 co
mpo
nent
s:
rese
arch
and
cap
acity
bui
ldin
g. In
th
e re
sear
ch c
ompo
nent
fund
s ha
ve
been
spe
nt o
n re
sear
ch g
rant
s an
d co
mm
issi
oned
rese
arch
on
pove
rty
and
ineq
ualit
y. In
the
capa
city
bu
ildin
g co
mpo
nent
fund
s ha
ve
been
spe
nt o
n a
num
ber o
f ac
tiviti
es s
uch
as tr
aini
ng,
wor
ksho
ps, a
stu
dy to
ur a
nd a
co
nfer
ence
4 57
72
017
––
––
–
Euro
pean
Uni
on
Prog
ram
me
to s
uppo
rt pr
o-po
or
polic
y de
velo
pmen
t in
Sout
h Af
rica
phas
e 2
Adm
inis
tratio
n Ju
ly 2
012
- D
ecem
ber
2017
10
0 00
0G
oods
and
ser
vice
s Th
e ov
eral
l obj
ectiv
e of
pha
se 2
is
to c
ontri
bute
to th
e im
plem
enta
tion
of S
outh
Afri
ca 's
med
ium
term
st
rate
gic
fram
ewor
k, in
line
with
the
outc
omes
-bas
ed a
ppro
ach
and
the
mille
nniu
m d
evel
opm
ent g
oals
–2
215
46 4
0838
438
10 1
326
327
4 08
8
Tota
l
158
983
4 57
74
232
46 4
0838
438
10 1
326
327
4 08
8


Private Bag X115 Pretoria 0001 | 40 Church square Pretoria 0002 | Tel +27 12 395 6697 | Fax +27 12 406 9055
Photos provided by GCIS.