international seminars, erice monday august 20, 2007 energy and climate managing climate change
DESCRIPTION
International Seminars, Erice Monday August 20, 2007 Energy and Climate Managing Climate Change. Arthur H. Rosenfeld, Commissioner California Energy Commission (916) 654-4930 [email protected] http://www.energy.ca.gov/commission/commissioners/rosenfeld.html - PowerPoint PPT PresentationTRANSCRIPT
International Seminars, EriceMonday August 20, 2007
Energy and ClimateManaging Climate Change
Arthur H. Rosenfeld, CommissionerCalifornia Energy Commission
(916) [email protected]
http://www.energy.ca.gov/commission/commissioners/rosenfeld.html
or just Google “Art Rosenfeld”

2
California Energy Commission Responsibilities
Both Regulation and R&D
• California Building and Appliance Standards– Started 1977– Updated every few years
• Siting Thermal Power Plants Larger than 50 MW• Forecasting Supply and Demand (electricity and fuels)• Research and Development
– ~ $80 million per year• California is introducing communicating electric meters and
thermostats that are programmable to respond to time-dependent electric tariffs.

3
Energy Intensity (E/GDP) in the United States (1949 - 2005) and France (1980 - 2003)
0.0
5.0
10.0
15.0
20.0
25.0
1949 1953 1957 1961 1965 1969 1973 1977 1981 1985 1989 1993 1997 2001 2005
tho
usa
nd
Btu
/$ (
in $
200
0)
If intensity dropped at pre-1973 rate of 0.4%/year
Actual (E/GDP drops 2.1%/year)
France
12% of GDP = $1.7 Trillion
7% of GDP =$1.0 Trillion
4
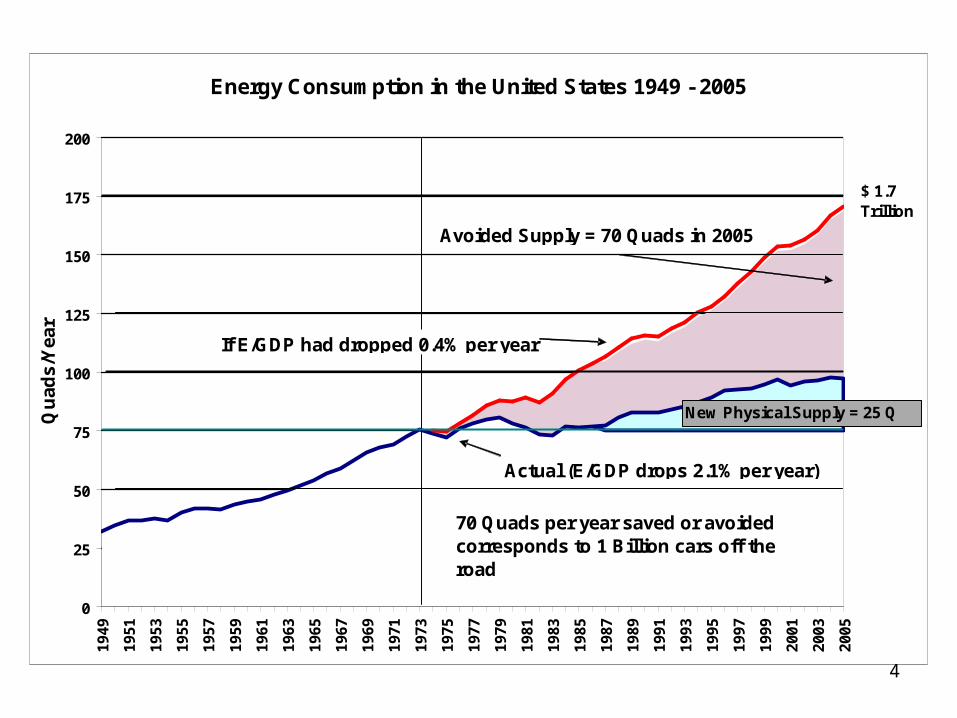
Energy Consumption in the United States 1949 - 2005
0
25
50
75
100
125
150
175
200
1949
1951
1953
1955
1957
1959
1961
1963
1965
1967
1969
1971
1973
1975
1977
1979
1981
1983
1985
1987
1989
1991
1993
1995
1997
1999
2001
2003
2005
Qu
ads/
Yea
r
$ 1.7 Trillion
$ 1.0 Trillion
New Physical Supply = 25 Q
Avoided Supply = 70 Quads in 2005
If E/GDP had dropped 0.4% per year
Actual (E/GDP drops 2.1% per year)
70 Quads per year saved or avoided corresponds to 1 Billion cars off the road
5
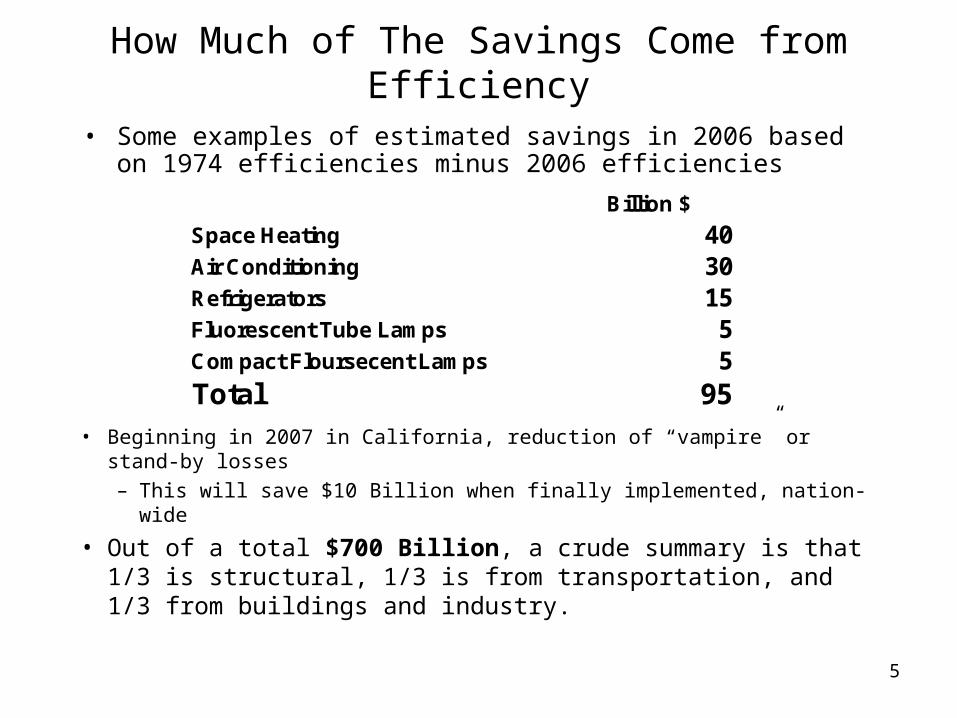
How Much of The Savings Come from Efficiency
• Some examples of estimated savings in 2006 based on 1974 efficiencies minus 2006 efficiencies
• Beginning in 2007 in California, reduction of “vampire” or stand-by losses– This will save $10 Billion when finally implemented, nation-wide
• Out of a total $700 Billion, a crude summary is that 1/3 is structural, 1/3 is from transportation, and 1/3 from buildings and industry.
Billion $
Space Heating 40Air Conditioning 30Refrigerators 15Fluorescent Tube Lamps 5Compact Floursecent Lamps 5Total 95
6
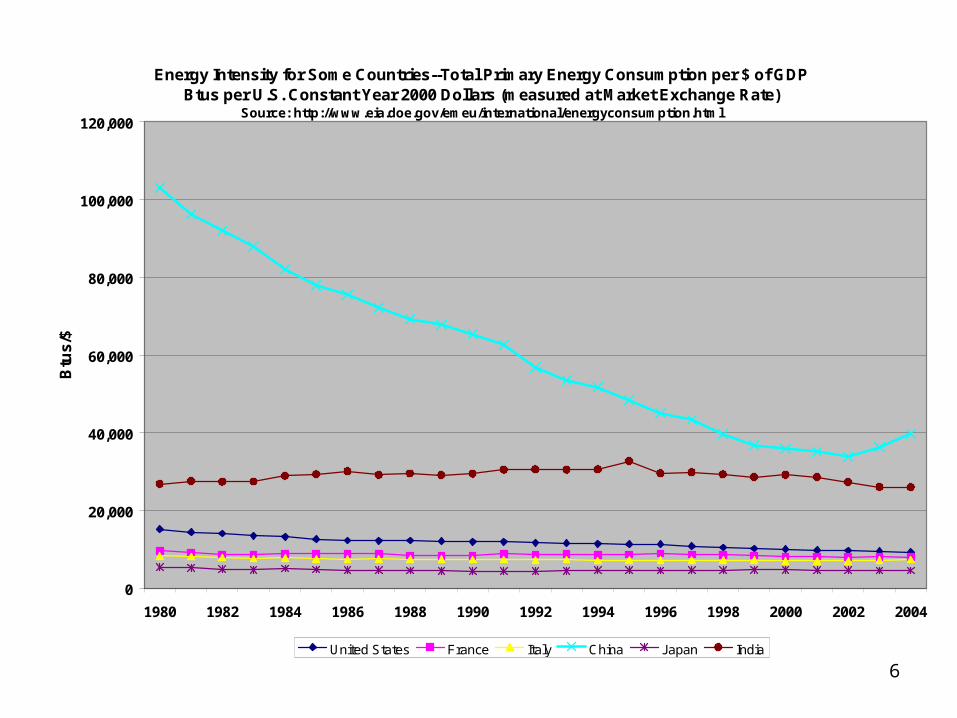
Energy Intensity for Some Countries--Total Primary Energy Consumption per $ of GDPBtus per U.S. Constant Year 2000 Dollars (measured at Market Exchange Rate)
Source: http://www.eia.doe.gov/emeu/international/energyconsumption.html
0
20,000
40,000
60,000
80,000
100,000
120,000
1980 1982 1984 1986 1988 1990 1992 1994 1996 1998 2000 2002 2004
Btu
s/$
United States France Italy China Japan India
7
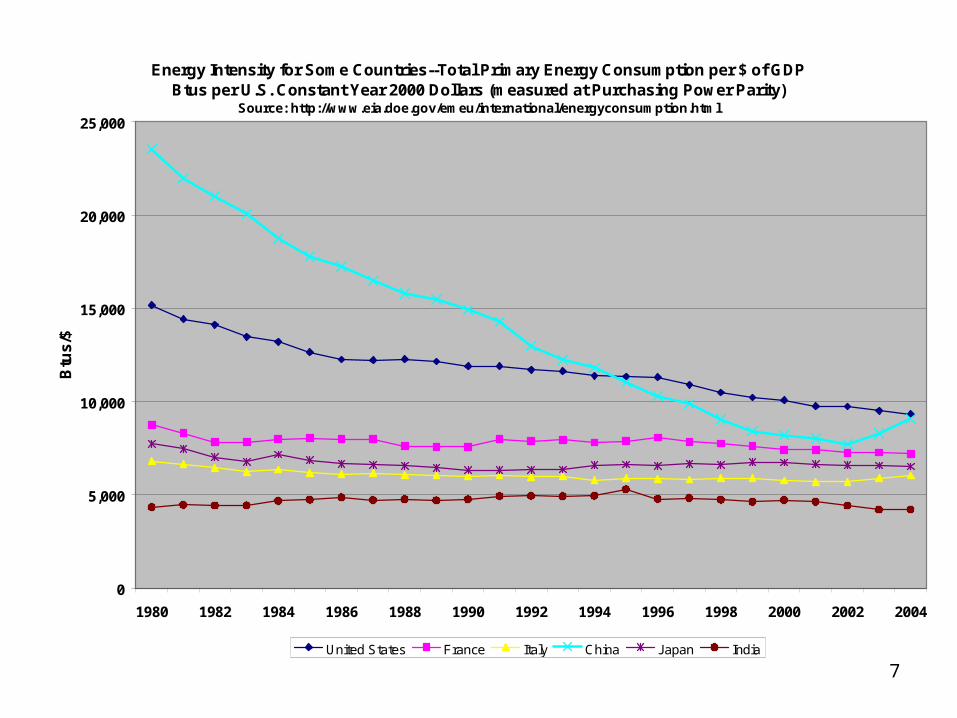
Energy Intensity for Some Countries--Total Primary Energy Consumption per $ of GDPBtus per U.S. Constant Year 2000 Dollars (measured at Purchasing Power Parity)
Source: http://www.eia.doe.gov/emeu/international/energyconsumption.html
0
5,000
10,000
15,000
20,000
25,000
1980 1982 1984 1986 1988 1990 1992 1994 1996 1998 2000 2002 2004
Btu
s/$
United States France Italy China Japan India

8
Carbon Dioxide Intensity and Per Capita CO2 Emissions -- 2004(Fossil Fuel Combustion Only)
0.00
5.00
10.00
15.00
20.00
25.00
0.00 0.10 0.20 0.30 0.40 0.50 0.60 0.70 0.80
Intensity [Metric Tons of CO2 per Thousand U.S. Dollars (constant year 2000 $) at Purchasing Power Parity]
Met
ric
To
ns
of
CO
2 p
er p
erso
n Canada
Australia
California
Mexico
United States
Austria
Belgium
France
Germany
Italy
Netherlands
Switzerland
Japan
India
China
UKSpain

9
Carbon Dioxide Intensity and Per Capita CO2 Emissions -- 2004(Fossil Fuel Combustion Only)
0.00
5.00
10.00
15.00
20.00
25.00
0.00 0.50 1.00 1.50 2.00 2.50 3.00 3.50
Intensity [Metric Tons of CO2 per Thousand U.S. Dollars (constant year 2000 $) at Market Exchange Rates]
Met
ric
To
ns
of
CO
2 p
er p
erso
n Canada
Australia
California
Mexico
United States
Austria
Belgium
France
Germany
Italy
Netherlands
Switzerland
Japan
IndiaChina
UKSpain
10
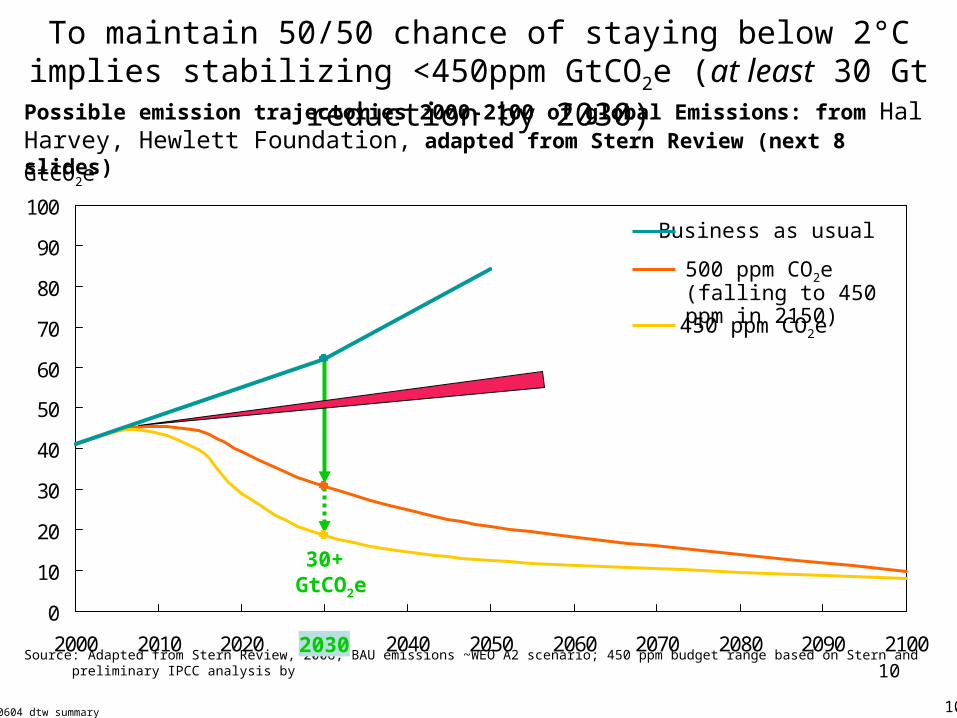
To maintain 50/50 chance of staying below 2°C implies stabilizing <450ppm GtCO2e (at least 30 Gt reduction by 2030)
070604 dtw summary 10
Source: Adapted from Stern Review, 2006; BAU emissions ~WEO A2 scenario; 450 ppm budget range based on Stern and preliminary IPCC analysis by
0
10
20
30
40
50
60
70
80
90
100
2000 2010 2020 2030 2040 2050 2060 2070 2080 2090 2100
Possible emission trajectories 2000-2100 of global Emissions: from Hal Harvey, Hewlett Foundation, adapted from Stern Review (next 8 slides)
GtCO2e
Business as usual
450 ppm CO2e
500 ppm CO2e (falling to 450 ppm in 2150)
2030
30+ GtCO2e
11
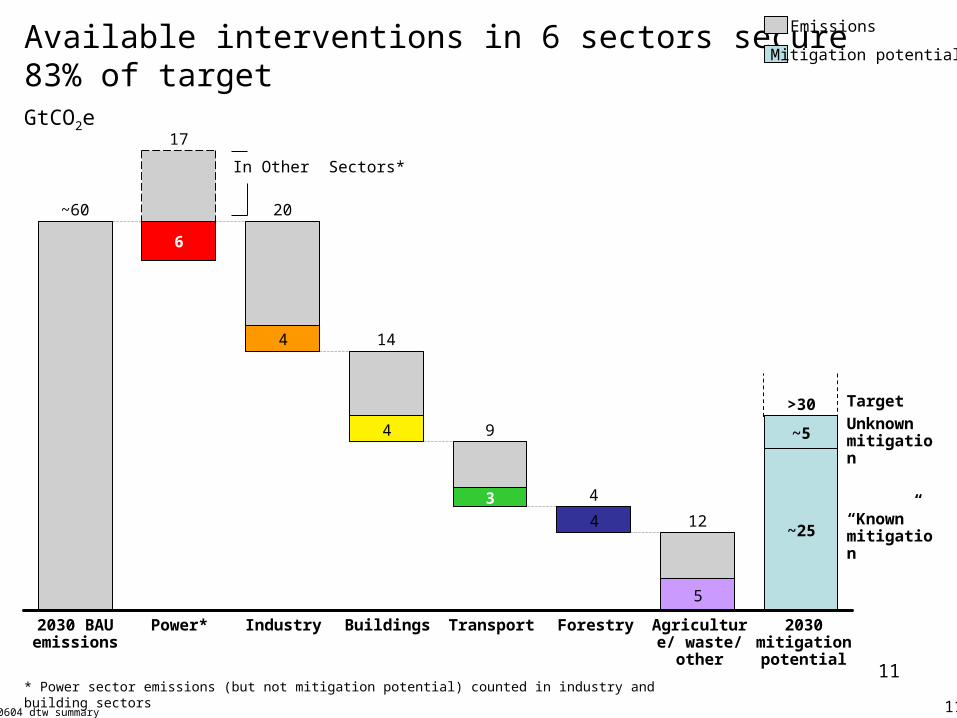
Available interventions in 6 sectors secure 83% of target
070604 dtw summary 11
TargetUnknown mitigation
“Known” mitigation
GtCO2e
Emissions
Mitigation potential
* Power sector emissions (but not mitigation potential) counted in industry and building sectors
2030 mitigation potential
2030 BAU emissions
Industry Buildings Transport Forestry Agriculture/ waste/
other
Power*
4
4
4
5
~60
6
17
20
14
3
9
4
12
~5
~25
>30
In Other Sectors*

12
Utilities
12
6
17
20
14
3
9
4
12
>30
~25
~5
Target
Unknown mitigatio
n
“Known” mitigatio
n
GtCO2e Emissions
Mitigation potential
2030 mitigation potential
2030 BAU emissions
Industry Buildings Transport Forestry Agriculture/ waste/
other
Power
~
1. No New Conventional Coal
2. Carbon Capture and Sequestration
3. Renewable Portfolio Standard
4. Nuclear Power?
13
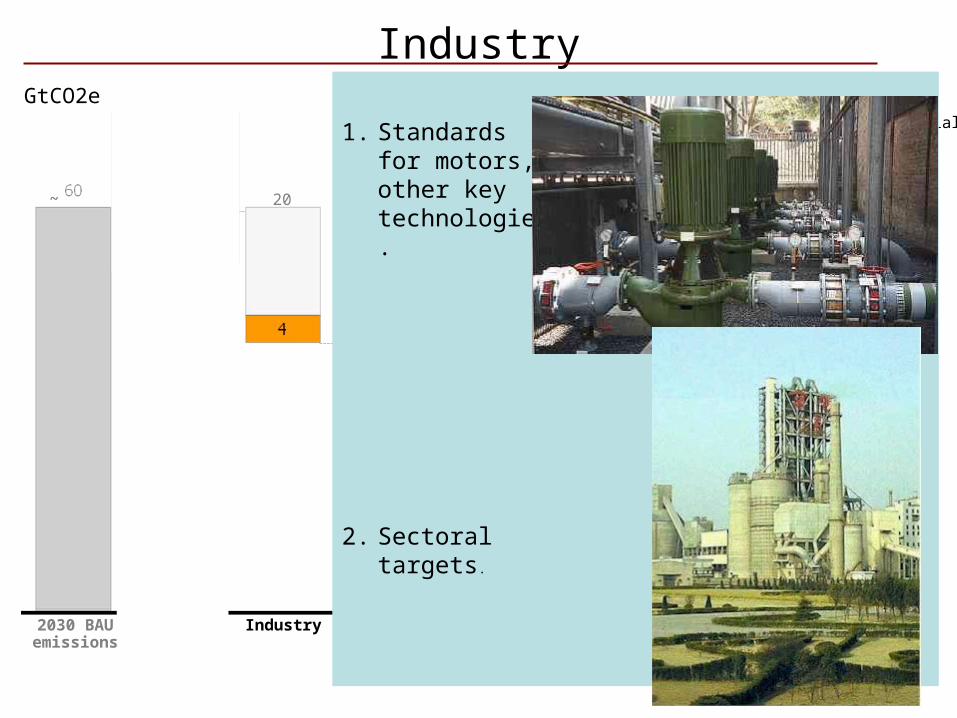
Industry
13
6
17
20
14
3
9
4
12
>30
~25
~5
Target
Unknown mitigatio
n
“Known” mitigatio
n
GtCO2e Emissions
Mitigation potential
2030 mitigation potential
2030 BAU emissions
Industry Buildings Transport Forestry Agriculture/ waste/
other
Power
~
1. Standards for motors, other key technologies.
2. Sectoral targets.
14
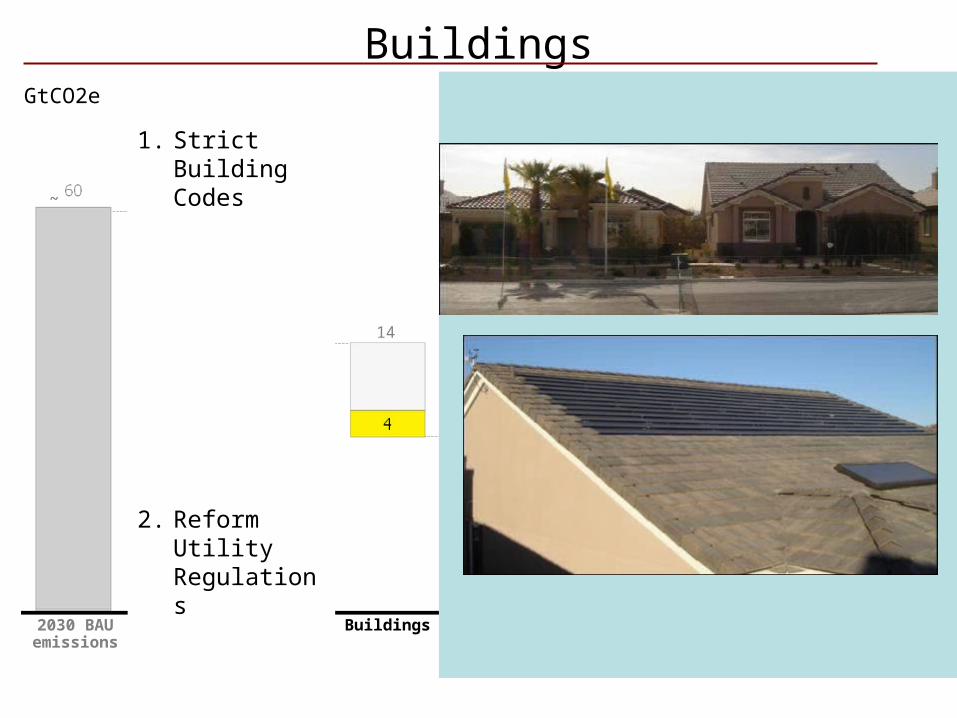
Buildings
14
6
17
20
14
3
9
4
12
>30
~25
~5
Target
Unknown mitigatio
n
“Known” mitigatio
n
GtCO2e Emissions
Mitigation potential
2030 mitigation potential
2030 BAU emissions
Industry Buildings Transport Forestry Agriculture/ waste/
other
Power
~
1. Strict Building Codes
2. Reform Utility Regulations
15
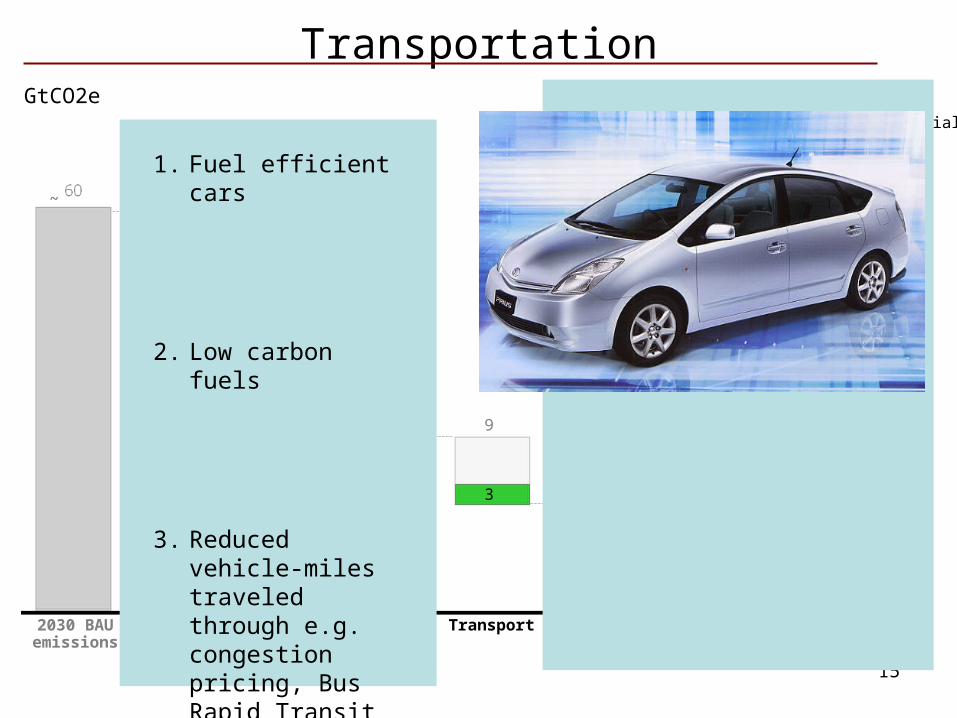
Transportation
15
6
17
20
14
3
9
4
12
>30
~25
~5
Target
Unknown mitigatio
n
“Known” mitigatio
n
GtCO2e Emissions
Mitigation potential
2030 mitigation potential
2030 BAU emissions
Industry Buildings Transport Forestry Agriculture/ waste/
other
Power
~
1. Fuel efficient cars
2. Low carbon fuels
3. Reduced vehicle-miles traveled through e.g. congestion pricing, Bus Rapid Transit
16
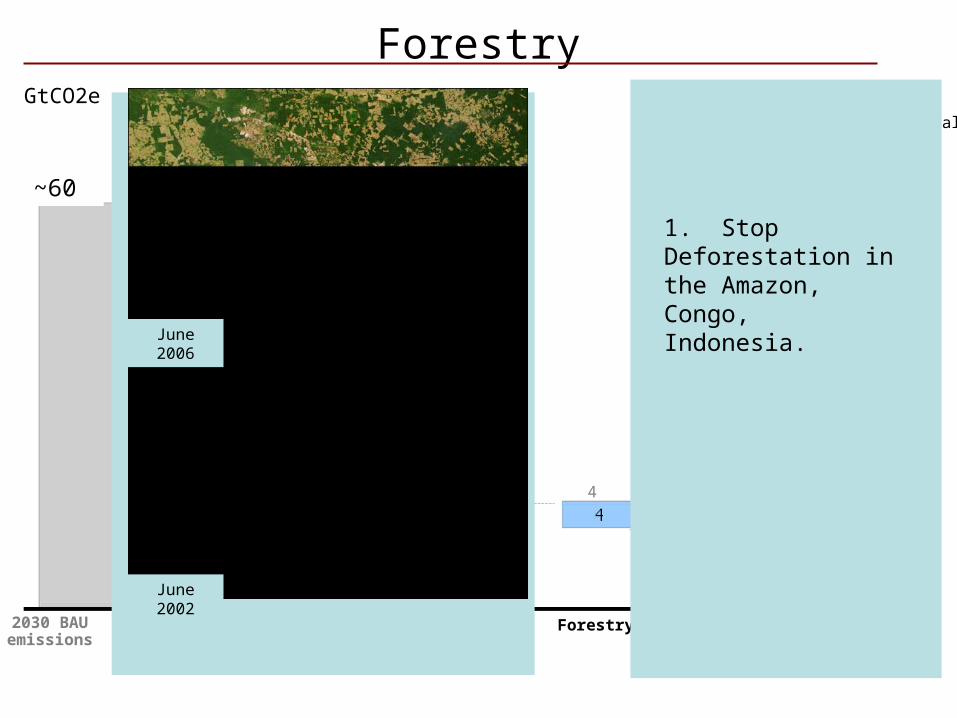
Forestry
16
6
17
20
14
3
9
4
12
>30
~25
~5
Target
Unknown mitigatio
n
“Known” mitigatio
n
GtCO2e Emissions
Mitigation potential
2030 mitigation potential
2030 BAU emissions
Industry Buildings Transport Forestry Agriculture/ waste/
other
Power
~
1. Stop Deforestation in the Amazon, Congo, Indonesia.
June 2006
June 2002
~60

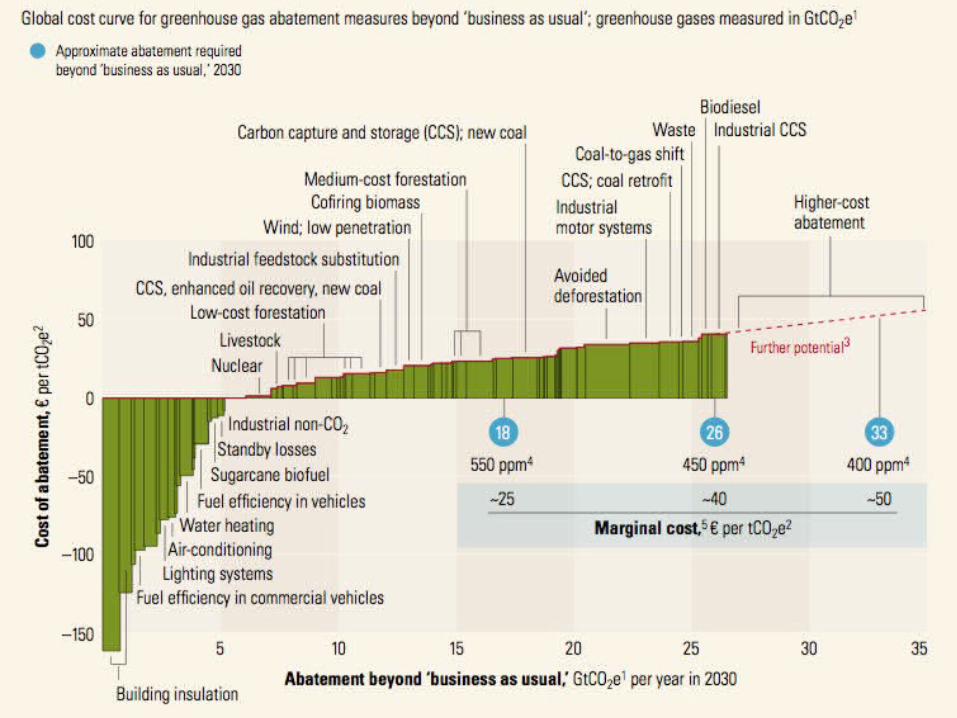
17
18
http://www.mckinseyquarterly.com/Energy_Resources_Materials/A_cost_curve_for_greenhouse_gas_reduction_abstract
McKinsey Quarterly
19
20
International Seminars, EriceMonday August 20, 2007
Energy and ClimateManaging Climate Change
Arthur H. Rosenfeld, CommissionerCalifornia Energy Commission
(916) [email protected]
http://www.energy.ca.gov/commission/commissioners/rosenfeld.htmlor just Google “Art Rosenfeld”
Plenary Session:
Policy and Potential for Energy Efficient Buildings
21
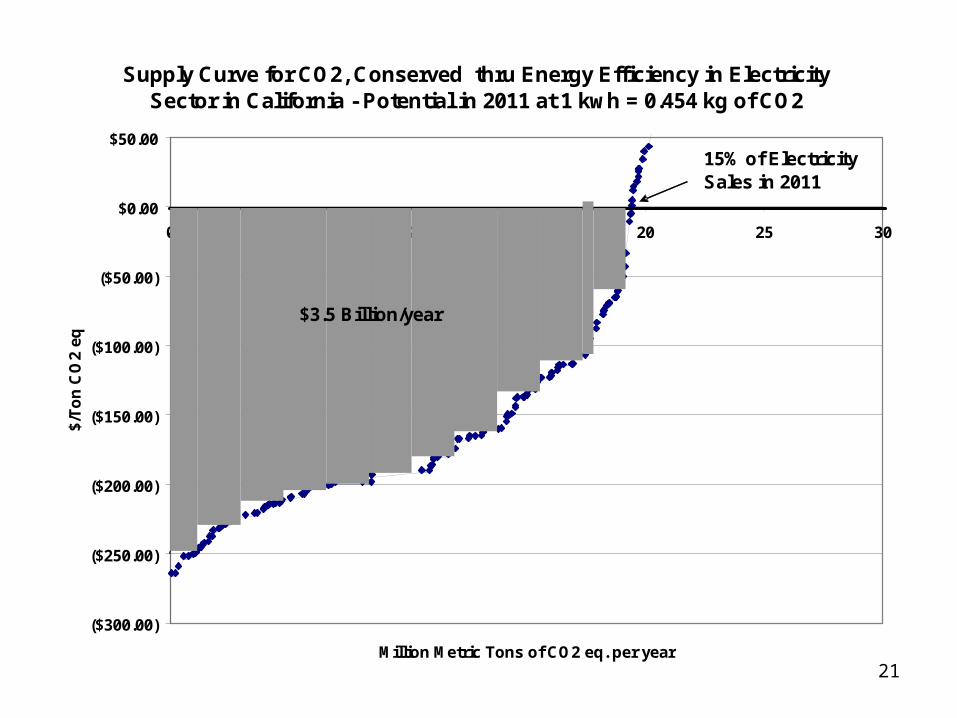
Supply Curve for CO2, Conserved thru Energy Efficiency in Electricity Sector in California - Potential in 2011 at 1 kwh = 0.454 kg of CO2
($300.00)
($250.00)
($200.00)
($150.00)
($100.00)
($50.00)
$0.00
$50.00
0 5 10 15 20 25 30
Million Metric Tons of CO2 eq. per year
$/T
on
CO
2 e
q
15% of Electricity Sales in 2011
$3.5 Billion/year
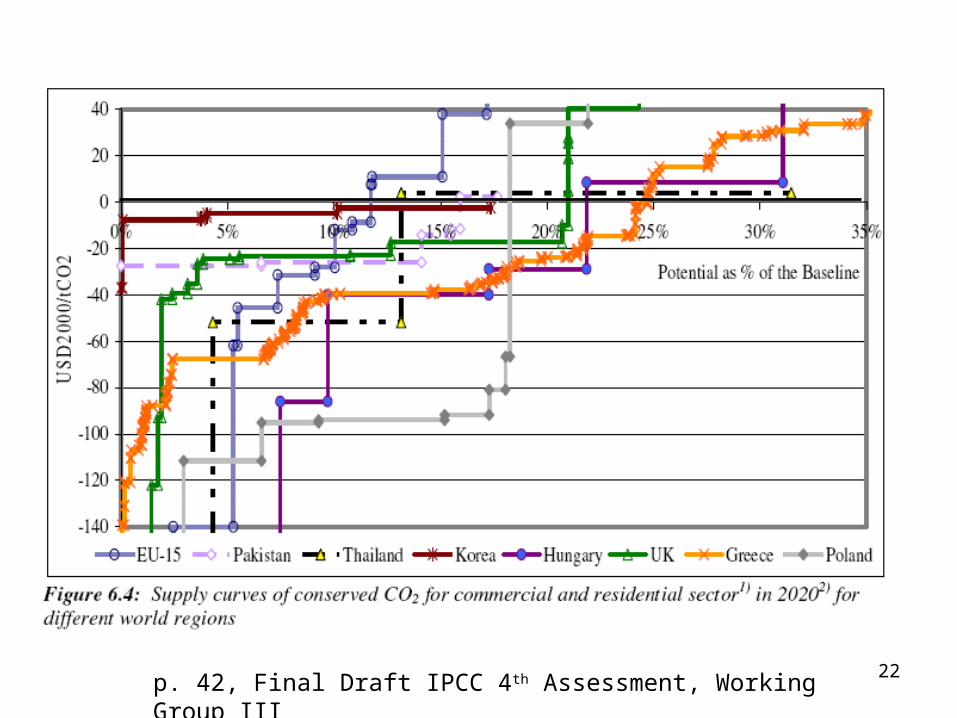
22p. 42, Final Draft IPCC 4th Assessment, Working Group III

23
Per Capita Electricity Sales (not including self-generation)(kWh/person) (2006 to 2008 are forecast data)
0
2,000
4,000
6,000
8,000
10,000
12,000
14,0001
96
0
19
62
19
64
19
66
19
68
19
70
19
72
19
74
19
76
19
78
19
80
19
82
19
84
19
86
19
88
19
90
19
92
19
94
19
96
19
98
20
00
20
02
20
04
20
06
20
08
United States
California
Per Capita Income in Constant 2000 $1975 2005 % change
US GDP/capita 16,241 31,442 94%Cal GSP/capita 18,760 33,536 79%
2005 Differences = 5,300kWh/yr = $165/capita

24
Per Capita Electricity Sales (not including self-generation)(kWh/person) (2006 to 2008 are forecast data)
0
2,000
4,000
6,000
8,000
10,000
12,000
14,0001
96
0
19
62
19
64
19
66
19
68
19
70
19
72
19
74
19
76
19
78
19
80
19
82
19
84
19
86
19
88
19
90
19
92
19
94
19
96
19
98
20
00
20
02
20
04
20
06
20
08
kW
h/p
ers
on
France
United States
California
Portugal
Spain
W. Europe
25
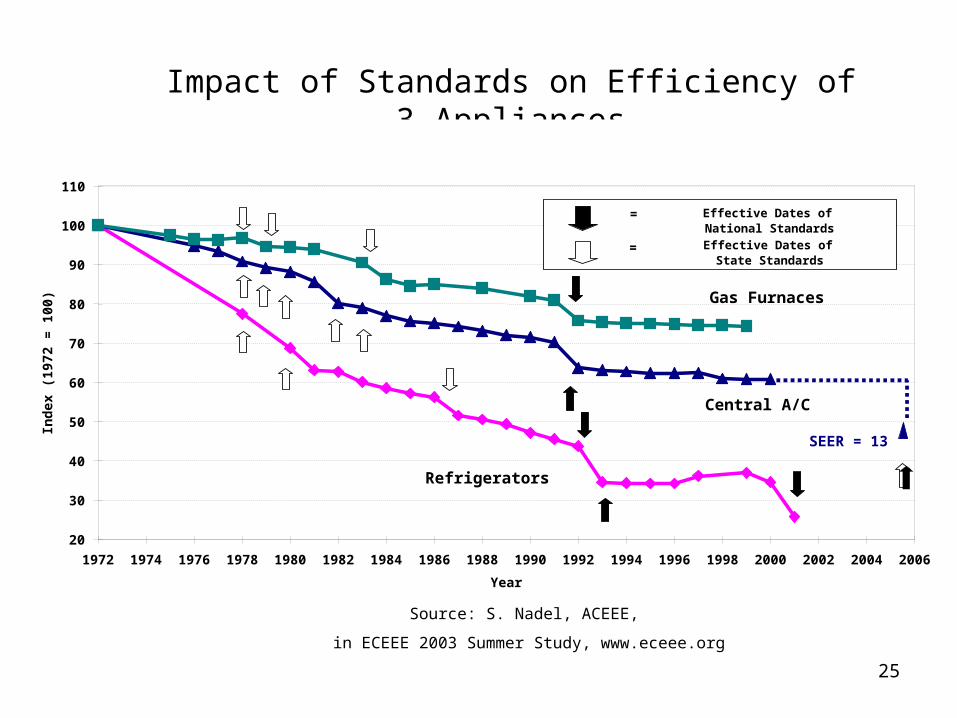
Impact of Standards on Efficiency of 3 Appliances
Source: S. Nadel, ACEEE,
in ECEEE 2003 Summer Study, www.eceee.org
75%
60%
25%20
30
40
50
60
70
80
90
100
110
1972 1974 1976 1978 1980 1982 1984 1986 1988 1990 1992 1994 1996 1998 2000 2002 2004 2006
Year
Ind
ex (
1972
= 1
00)
Effective Dates of National Standards
=
Effective Dates of State Standards
=
Refrigerators
Central A/C
Gas Furnaces
SEER = 13
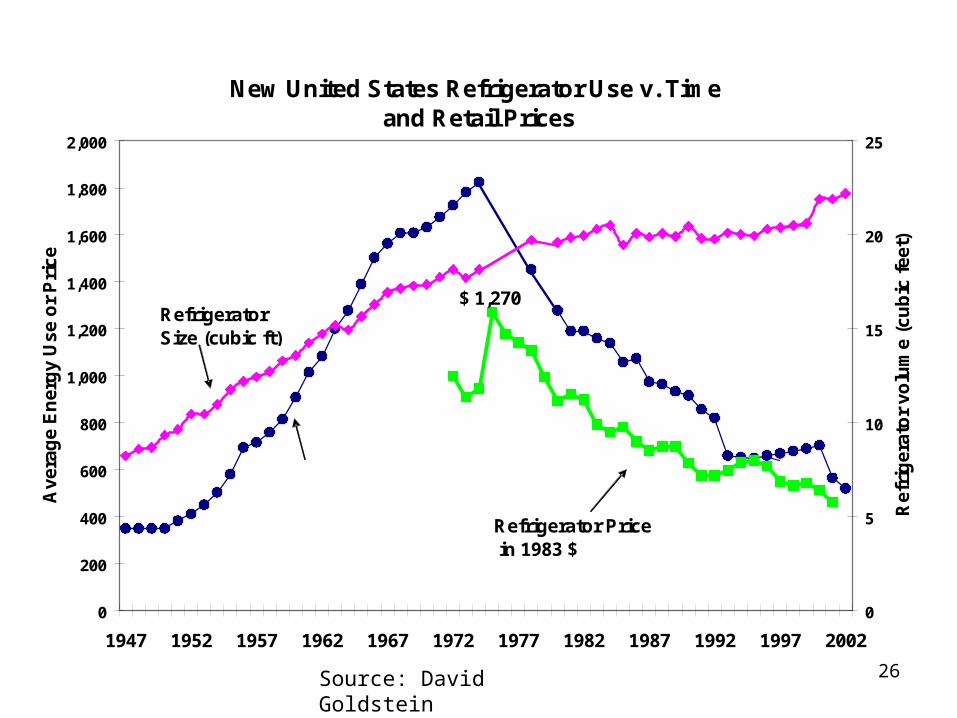
26Source: David Goldstein
New United States Refrigerator Use v. Time and Retail Prices
0
200
400
600
800
1,000
1,200
1,400
1,600
1,800
2,000
1947 1952 1957 1962 1967 1972 1977 1982 1987 1992 1997 2002
Av
era
ge
En
erg
y U
se
or
Pri
ce
0
5
10
15
20
25
Re
frig
era
tor
vo
lum
e (
cu
bic
fe
et)
Energy Use per Unit(kWh/Year)
Refrigerator Size (cubic ft)
Refrigerator Price in 1983 $
$ 1,270
$ 462

27
Annual Energy Saved vs. Several Sources of Supply
Energy Saved Refrigerator Stds
renewables
100 Million 1 KW PV systems
conventional hydro
nuclear energy
0
100
200
300
400
500
600
700
800
Bil
lio
n k
Wh
/yea
r
= 80 power plants of 500 MW each
In the United States
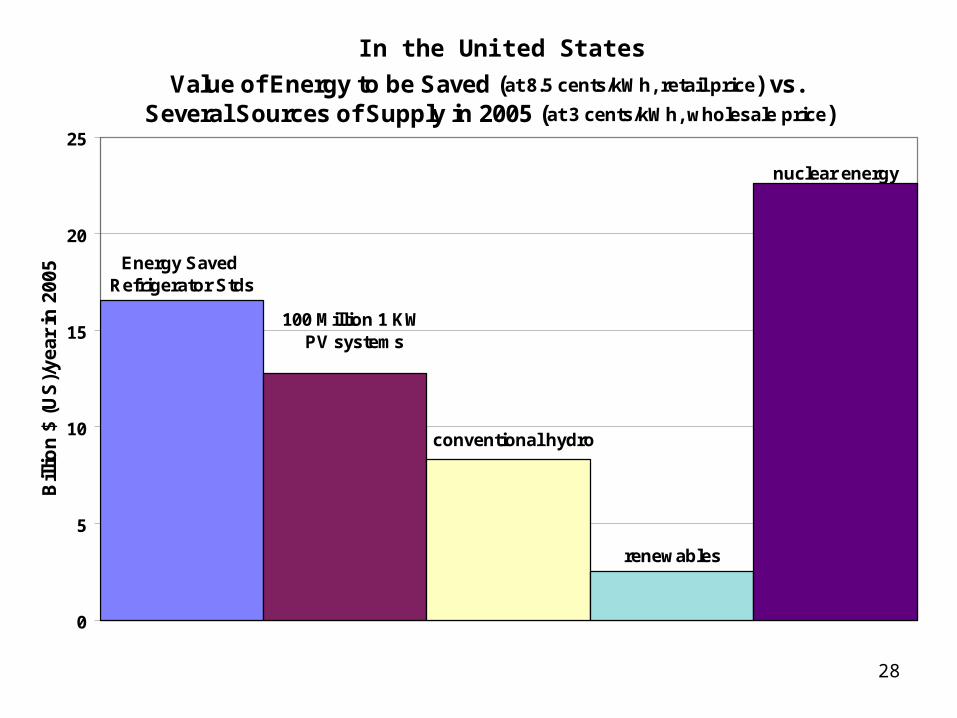
28
Value of Energy to be Saved (at 8.5 cents/kWh, retail price) vs. Several Sources of Supply in 2005 (at 3 cents/kWh, wholesale price)
Energy Saved Refrigerator Stds
renewables
100 Million 1 KW PV systems
conventional hydro
nuclear energy
0
5
10
15
20
25
Bill
ion
$ (
US
)/ye
ar
in 2
00
5In the United States
29
0
20
40
60
80
100
120
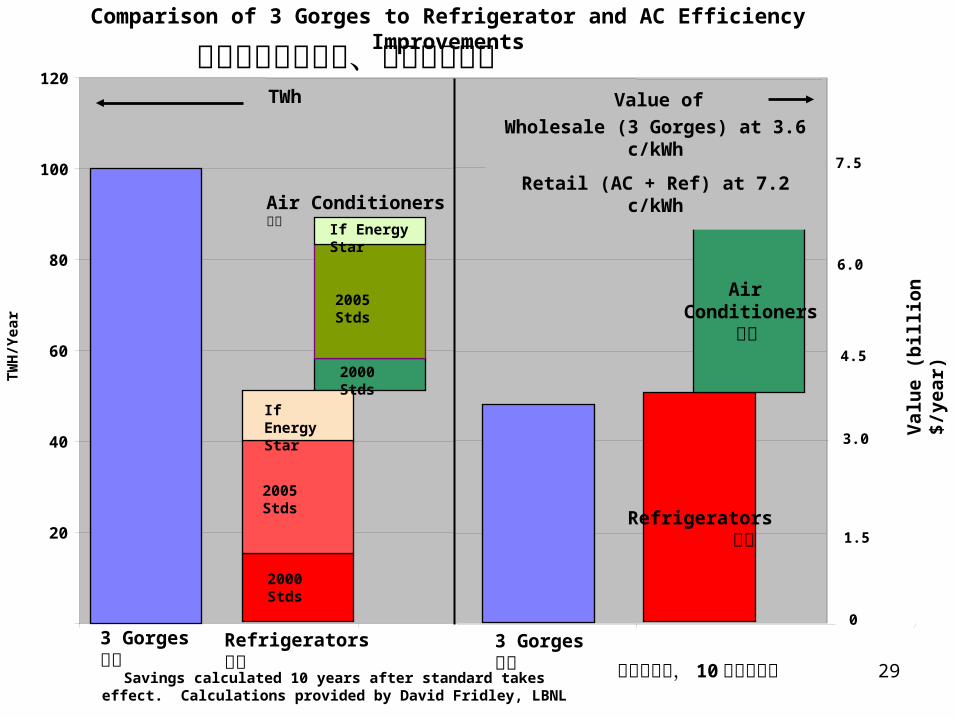
3 Gorges三峡
Refrigerators冰箱
Air Conditioners 空调
TWh
2000 Stds
2000 Stds
2005 Stds
2005 Stds
If Energy Star
If Energy Star
TW
H/Y
ear
1.5
4.5
6.0
3.0
7.5
Val
ue
(bil
lio
n $
/yea
r)
Comparison of 3 Gorges to Refrigerator and AC Efficiency Improvements
Savings calculated 10 years after standard takes effect. Calculations provided by David Fridley, LBNL
Value of TWh
3 Gorges三峡
Refrigerators 冰箱
Air Conditioners
空调
Wholesale (3 Gorges) at 3.6 c/kWh
Retail (AC + Ref) at 7.2 c/kWh
三峡电量与电冰箱、空调能效对比
标准生效后, 10年节约电量

30
United States Refrigerator Use, repeated, to compare with
Estimated Household Standby Use v. Time
0
200
400
600
800
1000
1200
1400
1600
1800
2000
1947
1949
1951
1953
1955
1957
1959
1961
1963
1965
1967
1969
1971
1973
1975
1977
1979
1981
1983
1985
1987
1989
1991
1993
1995
1997
1999
2001
2003
2005
2007
2009
Ave
rage
En
ergy
Use
per
Un
it S
old
(k
Wh
per
yea
r)
Refrigerator Use per Unit
1978 Cal Standard
1990 Federal Standard
1987 Cal Standard
1980 Cal Standard
1993 Federal Standard 2001 Federal
Standard
Estimated Standby Power (per house)
2007 STD.
31
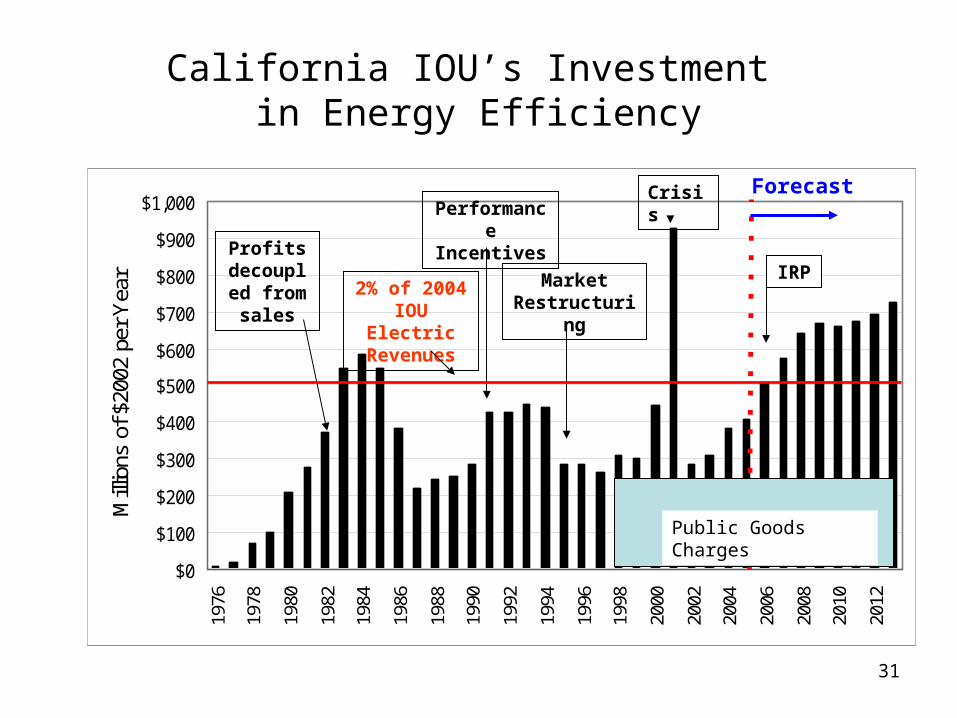
California IOU’s Investment in Energy Efficiency
$0
$100
$200
$300
$400
$500
$600
$700
$800
$900
$1,00019
76
1978
1980
1982
1984
1986
1988
1990
1992
1994
1996
1998
2000
2002
2004
2006
2008
2010
2012
Mill
ions
of
$200
2 pe
r Y
ear
Forecast
Profits decoupled from sales
Performance Incentives
Market Restructuring
Crisis
IRP2% of 2004
IOU Electric Revenues
Public Goods Charges

32
Annual Energy Savings from Efficiency Programs and Standards
0
5,000
10,000
15,000
20,000
25,000
30,000
35,000
40,000
45,0001
97
5
19
76
19
77
19
78
19
79
19
80
19
81
19
82
19
83
19
84
19
85
19
86
19
87
19
88
19
89
19
90
19
91
19
92
19
93
19
94
19
95
19
96
19
97
19
98
19
99
20
00
20
01
20
02
20
03
GW
h/y
ear
Appliance Standards
Building Standards
Utility Efficiency Programs at a cost of
~1% of electric bill
~15% of Annual Electricity Use in California in 2003
33
Cool Urban Surfaces and Global Warming
Hashem AkbariHeat Island Group
Lawrence Berkeley National Laboratory
Tel: 510-486-4287Email: [email protected]
http:HeatIsland.LBL.gov
International Workshop on Countermeasures to Urban Heat Islands August 3 - 4, 2006; Tokyo, Japan

34
Temperature Rise of Various Materials in Sunlight
0.0 0.2 0.4 0.6 0.8 1.0
50
40
30
20
10
0
Tem
pera
ture
Ris
e (°
C)
Galvanized Steel
IR-Refl. Black
Bla
ck
Pai
nt
Gre
en A
sph
alt
Sh
ing
le
Red
Cla
y T
ile
Lt.
Red
Pai
nt
Lt.
Gre
en P
ain
t
Wh
ite
Asp
hal
t S
hin
gle
Wh
ite
Asp
hal
t S
hin
gle
Al
Ro
of
Co
at.
Op
tica
l Wh
ite
Op
tica
l Wh
ite
Wh
ite
Pai
nt
Wh
ite
Pai
nt
Wh
ite
Cem
ent
Co
at.
Wh
ite
Cem
ent
Co
at.
Solar Absorptance

35
Direct and Indirect Effects of Light-Colored Surfaces
•Direct Effect- Light-colored roofs reflect solar radiation, reduce air-
conditioning use
•Indirect Effect- Light-colored surfaces in a neighborhood alter surface
energy balance; result in lower ambient temperature
36
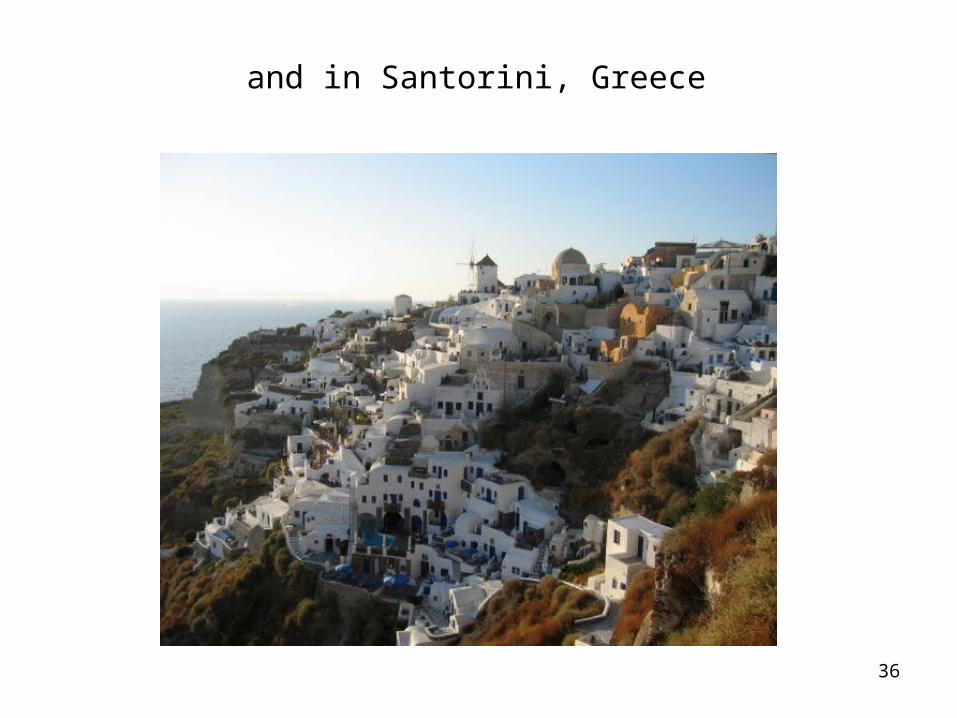
and in Santorini, Greece
37
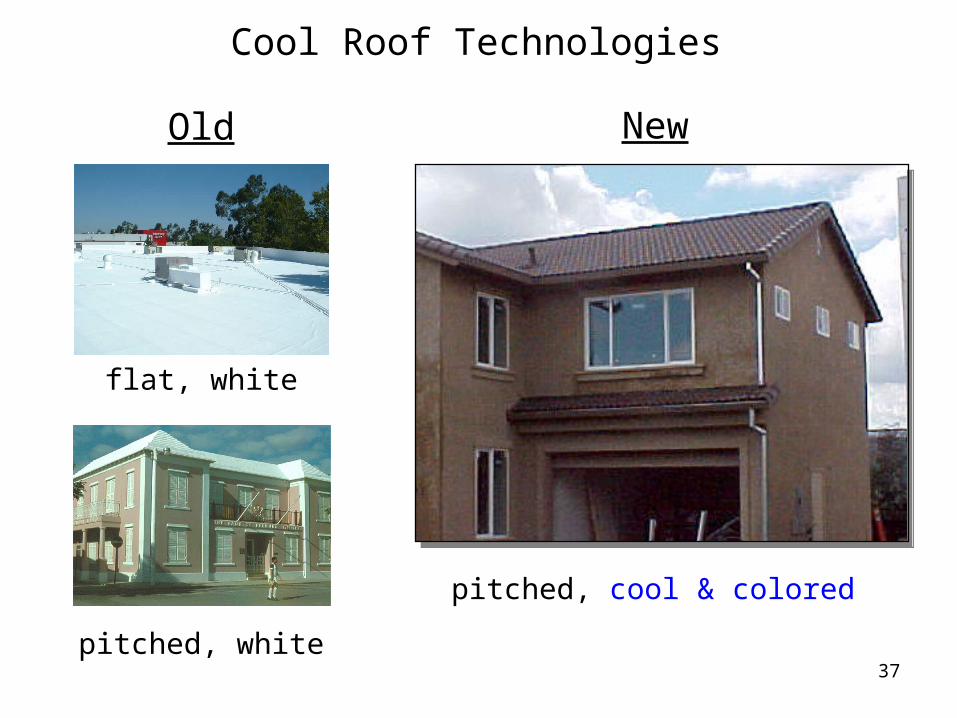
Cool Roof Technologies
flat, white
pitched, white
pitched, cool & colored
Old New
38
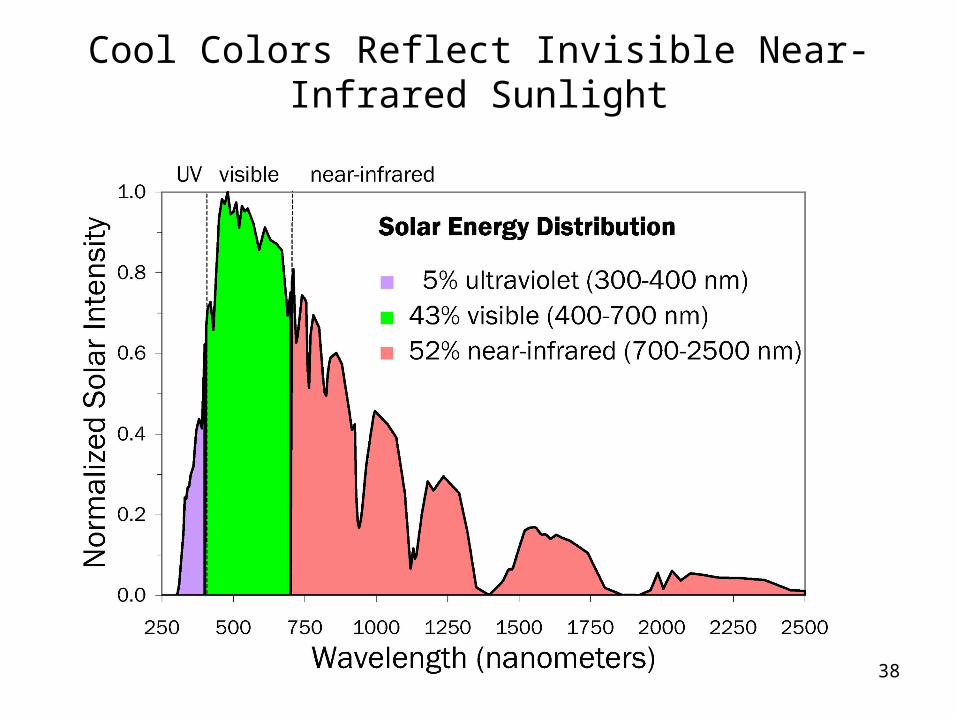
Cool Colors Reflect Invisible Near-Infrared Sunlight
39
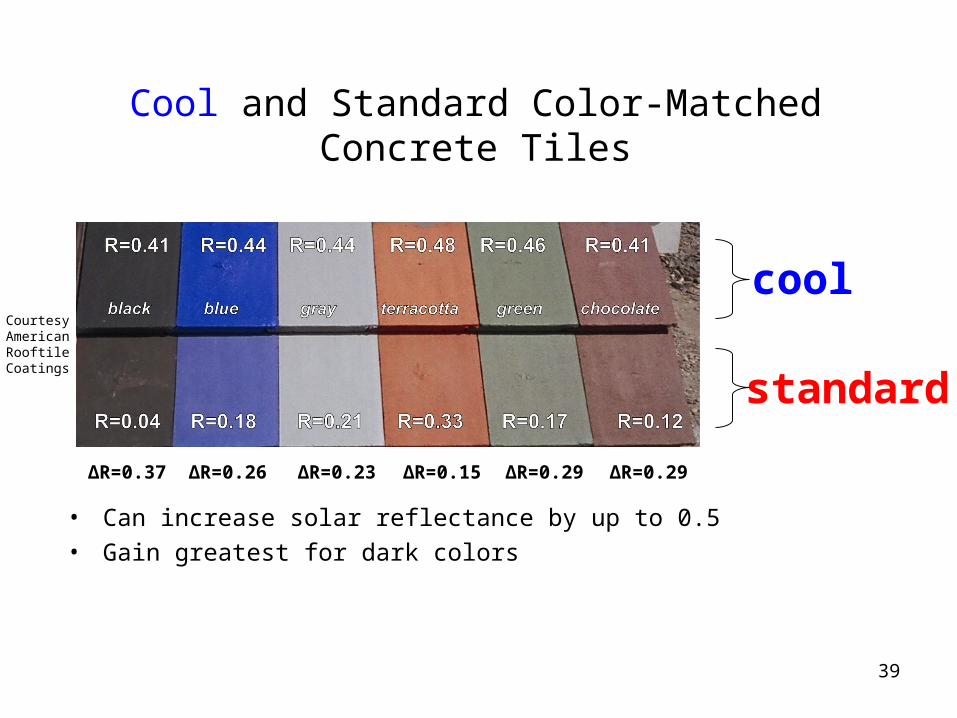
Cool and Standard Color-Matched Concrete Tiles
• Can increase solar reflectance by up to 0.5
• Gain greatest for dark colors
cool
standard
∆R=0.37 ∆R=0.29∆R=0.15∆R=0.23∆R=0.26 ∆R=0.29
CourtesyAmericanRooftile
Coatings
40
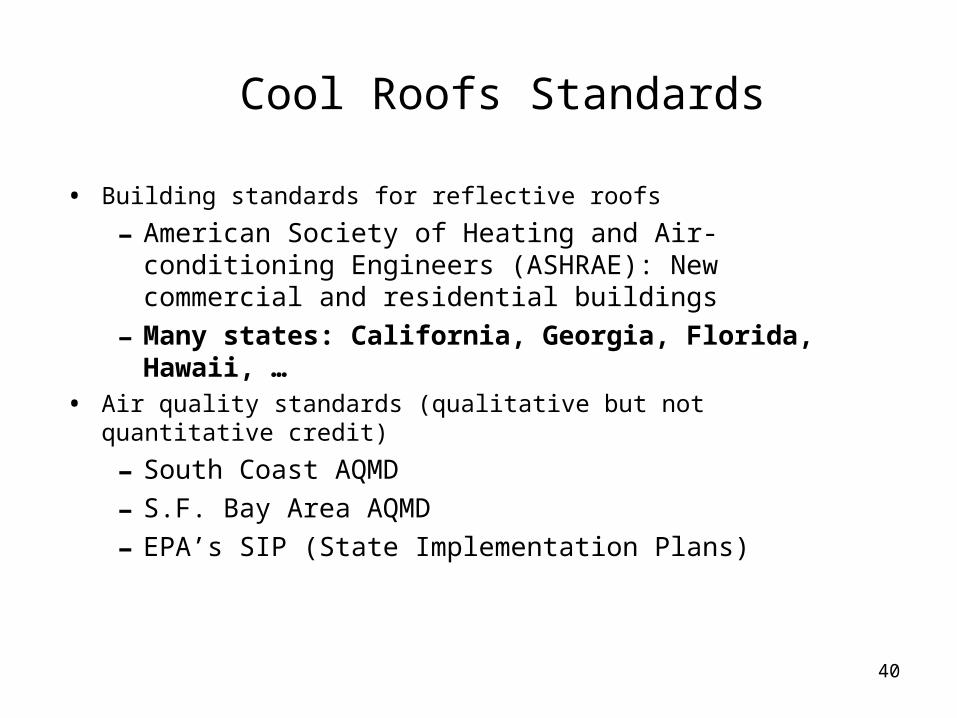
Cool Roofs Standards
• Building standards for reflective roofs
- American Society of Heating and Air-conditioning Engineers (ASHRAE): New commercial and residential buildings
- Many states: California, Georgia, Florida, Hawaii, …• Air quality standards (qualitative but not quantitative credit)
- South Coast AQMD
- S.F. Bay Area AQMD
- EPA’s SIP (State Implementation Plans)

41
From Cool Color Roofs to Cool Color Cars
• Toyota experiment (surface temperature 10K cooler)
• Ford and Fiat are also working on the technology
42
Cool Surfaces also Cool the Globe
• Cool roof standards are designed to reduce a/c demand, save money, and save emissions. In Los Angeles they will eventually save ~$100,000 per hour.
• But higher albedo surfaces (roofs and pavements) directly cool the world (0.01 K) quite independent of avoided CO2. So we
discuss the effect of cool surfaces for tropical, temperate cities.
43
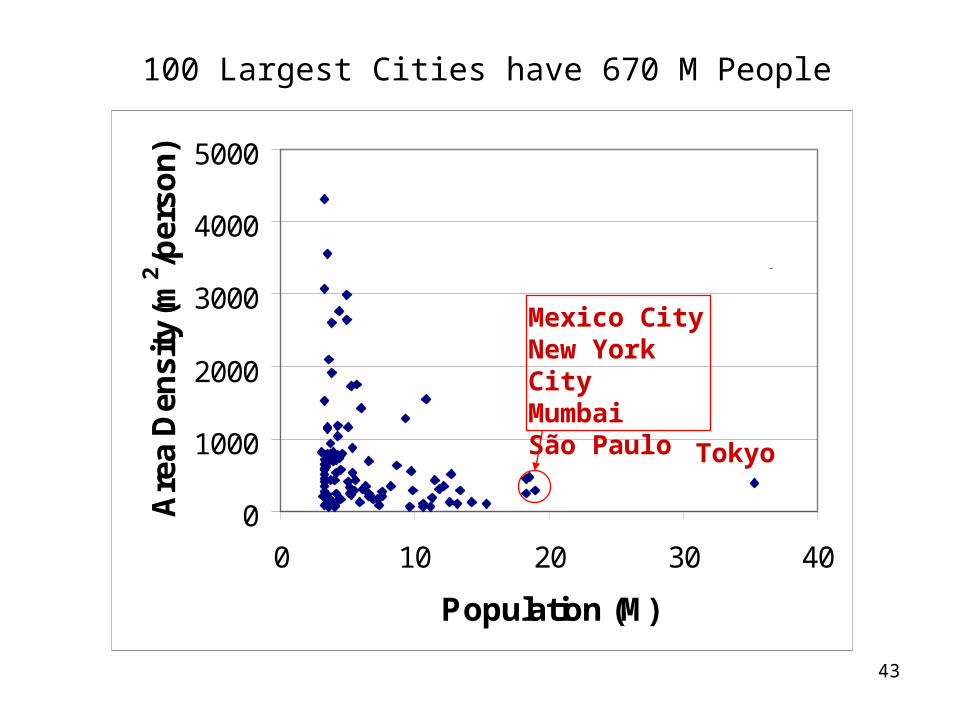
100 Largest Cities have 670 M People
0
1000
2000
3000
4000
5000
0 10 20 30 40
Population (M)
Are
a D
ensi
ty (m
2 /per
son)
Mean = 560 m2/p
Med = 430 m2/p
Tokyo
Mexico CityNew York CityMumbaiSão Paulo
44
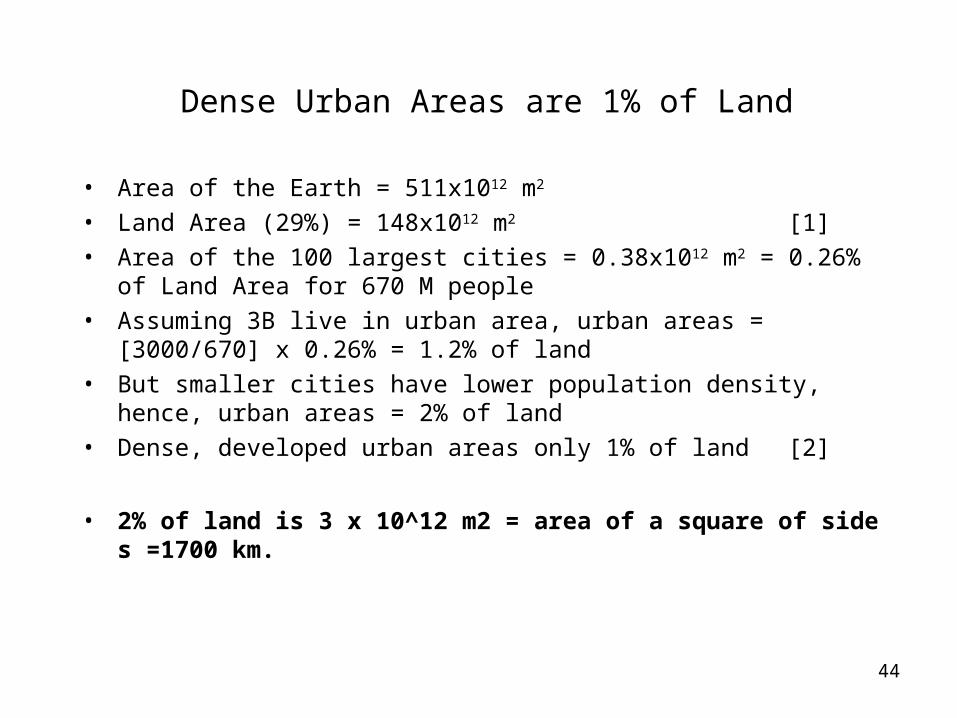
Dense Urban Areas are 1% of Land
• Area of the Earth = 511x1012 m2
• Land Area (29%) = 148x1012 m2 [1]
• Area of the 100 largest cities = 0.38x10¹² m2 = 0.26% of Land Area for 670 M people
• Assuming 3B live in urban area, urban areas = [3000/670] x 0.26% = 1.2% of land
• But smaller cities have lower population density, hence, urban areas = 2% of land
• Dense, developed urban areas only 1% of land [2]
• 2% of land is 3 x 10^12 m2 = area of a square of side s =1700 km.
45
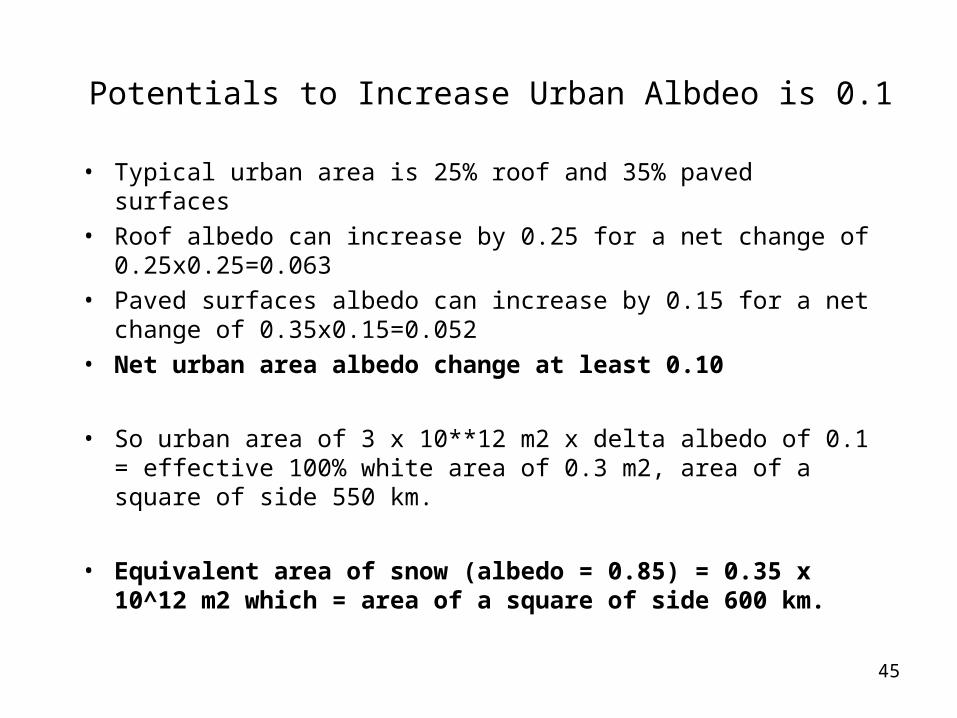
Potentials to Increase Urban Albdeo is 0.1
• Typical urban area is 25% roof and 35% paved surfaces• Roof albedo can increase by 0.25 for a net change of
0.25x0.25=0.063• Paved surfaces albedo can increase by 0.15 for a net change of
0.35x0.15=0.052• Net urban area albedo change at least 0.10
• So urban area of 3 x 10**12 m2 x delta albedo of 0.1 = effective 100% white area of 0.3 m2, area of a square of side 550 km.
• Equivalent area of snow (albedo = 0.85) = 0.35 x 10^12 m2 which = area of a square of side 600 km.
46
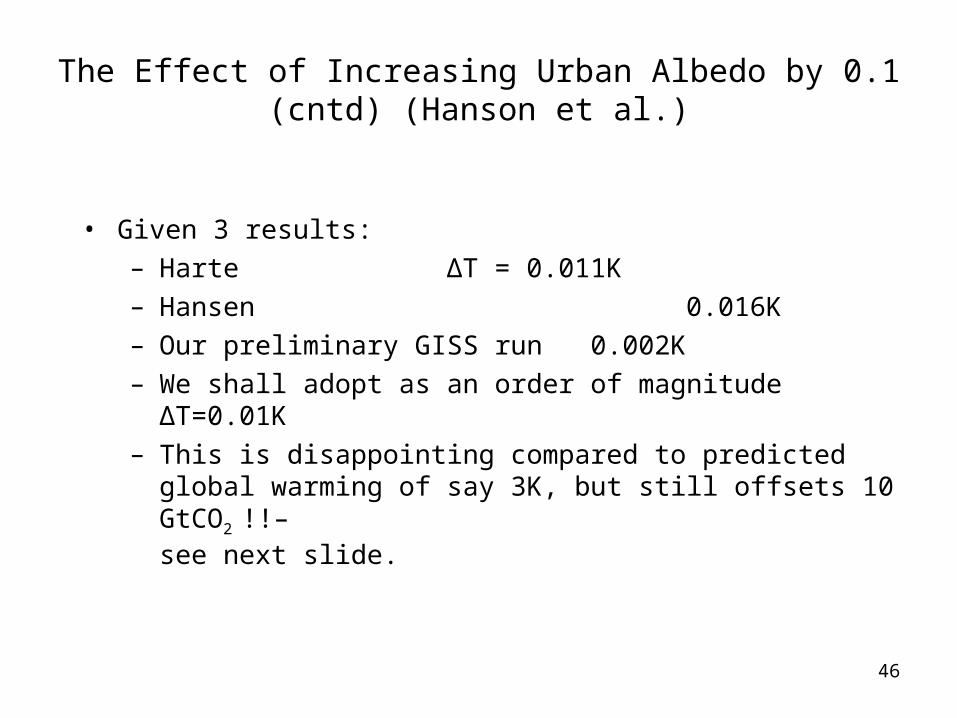
The Effect of Increasing Urban Albedo by 0.1 (cntd) (Hanson et al.)
• Given 3 results:– Harte ΔT = 0.011K– Hansen 0.016K– Our preliminary GISS run 0.002K – We shall adopt as an order of magnitude ΔT=0.01K– This is disappointing compared to predicted global warming of
say 3K, but still offsets 10 GtCO2 !!– see next slide.
47
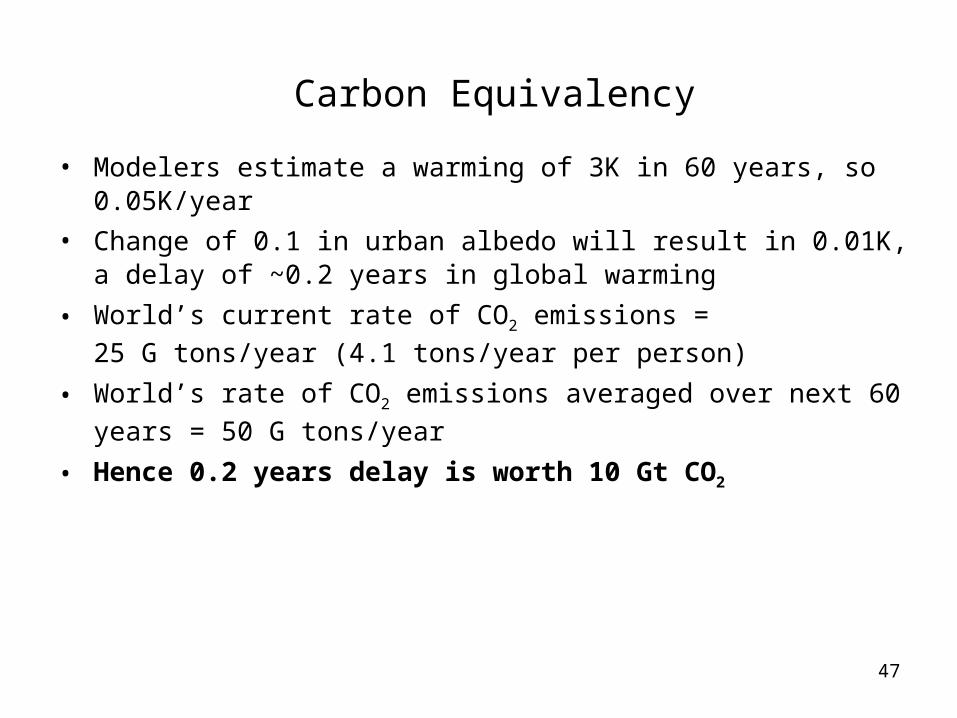
Carbon Equivalency
• Modelers estimate a warming of 3K in 60 years, so 0.05K/year
• Change of 0.1 in urban albedo will result in 0.01K, a delay of ~0.2 years in global warming
• World’s current rate of CO2 emissions =
25 G tons/year (4.1 tons/year per person)
• World’s rate of CO2 emissions averaged over next 60 years = 50 G
tons/year
• Hence 0.2 years delay is worth 10 Gt CO2

48
Equivalent Value of Avoided CO2
• CO2 currently trade at ~$25/ton
• 10Gt worth $250 billion, for changing albedo of roofs and paved surface
• Cooler roofs alone worth $125B
• Cooler roofs also save air conditioning (and provide comfort) worth ten times more
• Let developed countries offer $1 million per large city in a developing country, to trigger a cool roof/pavement program in that city
49
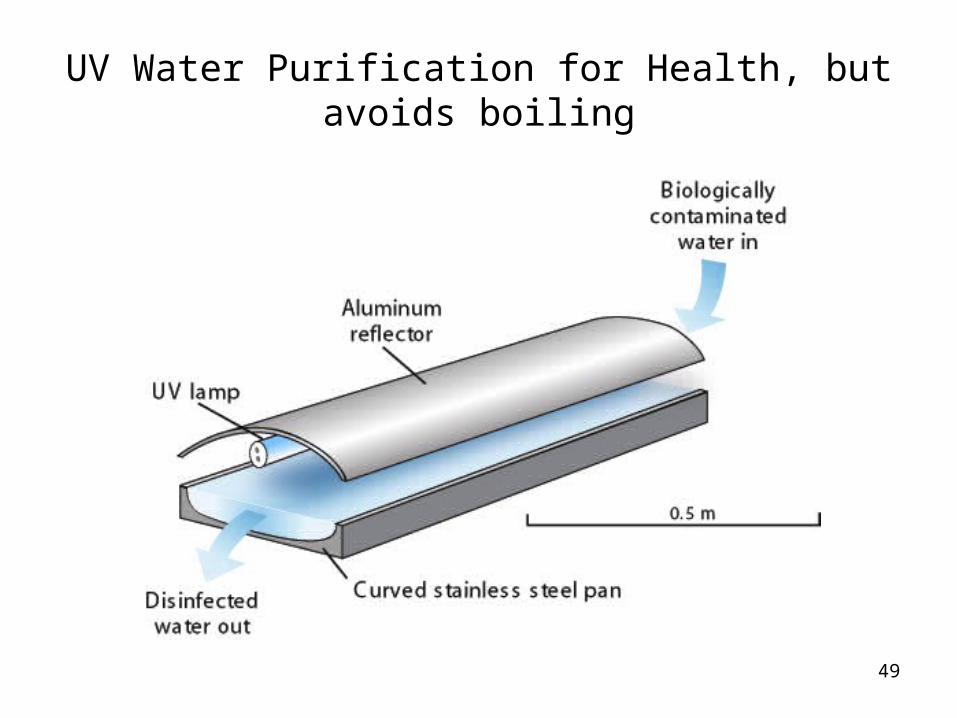
UV Water Purification for Health, but avoids boiling
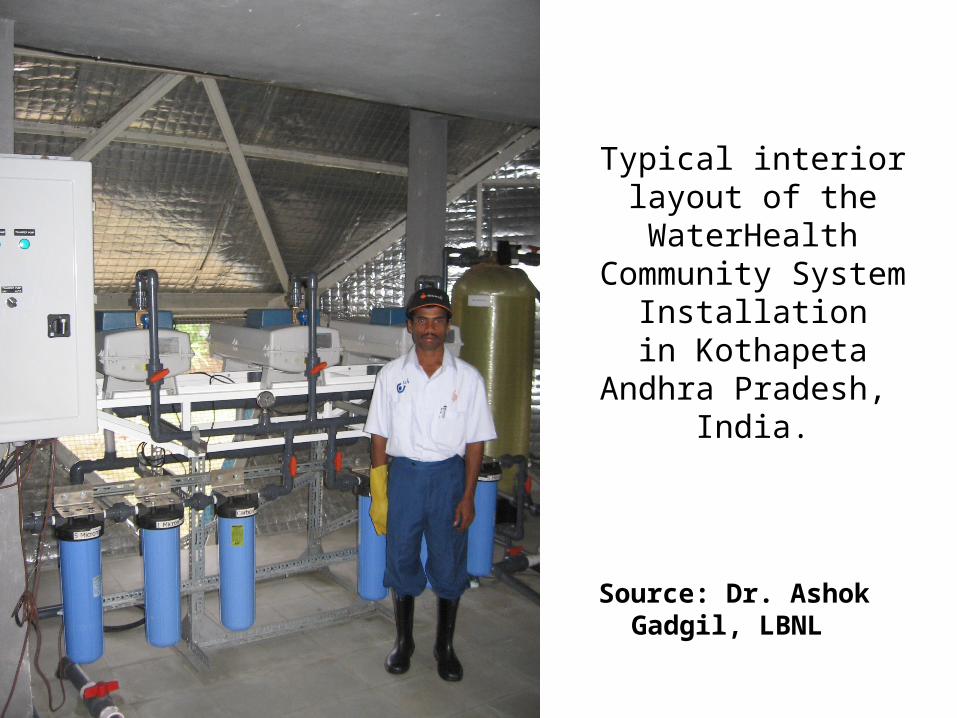
Typical interior layout of the WaterHealth
Community System Installation
in KothapetaAndhra Pradesh,
India.
Source: Dr. Ashok Gadgil, LBNL
51
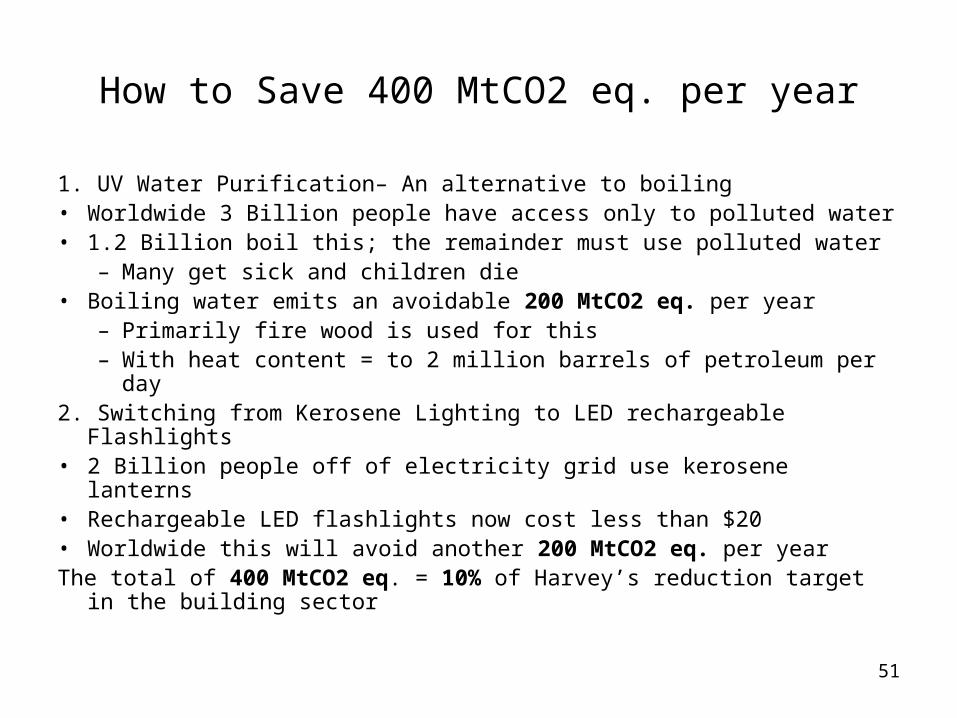
How to Save 400 MtCO2 eq. per year
1. UV Water Purification– An alternative to boiling• Worldwide 3 Billion people have access only to polluted water• 1.2 Billion boil this; the remainder must use polluted water
– Many get sick and children die• Boiling water emits an avoidable 200 MtCO2 eq. per year
– Primarily fire wood is used for this– With heat content = to 2 million barrels of petroleum per day
2. Switching from Kerosene Lighting to LED rechargeable Flashlights• 2 Billion people off of electricity grid use kerosene lanterns• Rechargeable LED flashlights now cost less than $20• Worldwide this will avoid another 200 MtCO2 eq. per yearThe total of 400 MtCO2 eq. = 10% of Harvey’s reduction target in the
building sector

52
Switching from Kerosene Lanterns to Rechargeable LEDs
Evan MillsEnergy Analysis Department
Lawrence Berkeley National [email protected]
+ 1 510 486-6784http://www.ifc.org/led
Commercially available LEDs • 0.1 to 1 watt • Lumens/watts > 100 better than kerosene lanterns• Much better directionality adds to this advantage
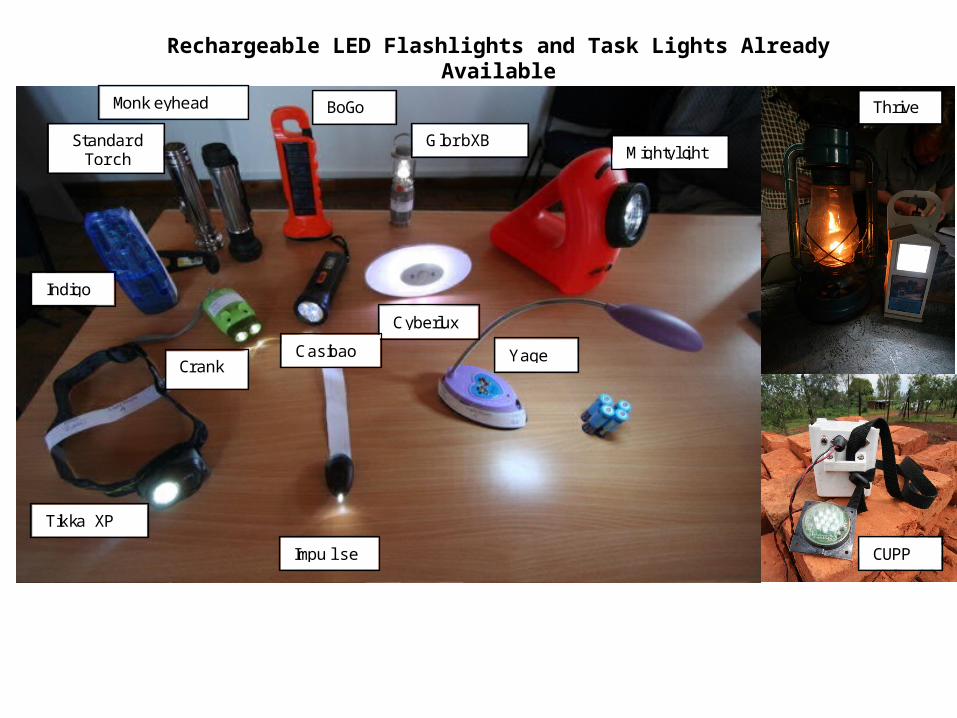
Indigo
Monk eyhead
Standard Torch
Crank
Glorb XB
Cyberlux
Yage
Mightylight
Tikka XP
CUPP
Thrive (right)
BoGo
Impulse
Casibao
Rechargeable LED Flashlights and Task Lights Already Available