international space station modal … space station modal correlation analysis ... (sdms), space...
TRANSCRIPT
INTERNATIONAL SPACE STATION MODAL CORRELATION ANALYSIS
Kristin Fitzpatrick The Boeing Company, 3700 Bay Area Blvd. Houston, Texas
Michael Grygier NASA, Johnson Space Center, Houston, Texas
Michael Laible The Boeing Company, 3700 Bay Area Blvd., Houston, Texas
Sujatha Sugavanam The Boeing Company, 3700 Bay Area Blvd., Houston, Texas
ABSTRACT Modal analyses, model validations and correlations are performed for the different configurations of the International Space Station (ISS). Three Dedicated Thruster Firings (DTF) tests were conducted during ISS Stage ULF4; this paper will focus on the analysis and results of the DTF S4-1A, which occurred on October 11, 2010. The objective of this analysis is to validate and correlate analytical models used to verify the ISS critical interface dynamic loads. During the S4-1A Dedicated Thruster Firing test, on-orbit dynamic measurements were collected using four main ISS instrumentation systems along with a Russian high rate sensor; Internal Wireless Instrumentation System (IWIS), External Wireless Instrumentation System (EWIS), Structural Dynamic Measurement System (SDMS), Space Acceleration Measurement System (SAMS) and Internal Measurement Unit (IMU). ISS external cameras also recorded the movement of one of the main solar array tips, array 1A. Modal analyses were performed on the measured data to extract modal parameters including frequency, damping, and mode shape information. Correlation and comparisons between test and analytical frequencies and mode shapes were performed to assess the accuracy of the analytical models for the configuration under consideration. Based on the frequency comparisons, the accuracy of the mathematical model is assessed and model refinement recommendations are given. 1.0 INTRODUCTION The on-orbit construction of the International Space Station (ISS) began in November 1998, and was completed in July of 2011. The ISS has been designed to operate for at least fifteen years to conduct science and engineering projects. To maintain its structural integrity during its construction and life span, structural loading distributions have been rigorously analyzed through numerical simulations and included in the design of the structure and its mission operations [1, 2, 17]. The accuracy of such analysis results is directly affected by the integrity of structural dynamic mathematical models and estimated input forces. On-orbit dynamic math models of ISS configurations are generated by combining component math models. Each component model is required to be correlated with ground test data. However, it is expected that on-orbit math models will still contain modeling inaccuracies due to differences in boundary conditions, mass distributions, and gravitational fields [2, 9]. Uncertainty factors are used to compensate for inherent inaccuracies in the math models and the estimated input forces [4]. The latter ISS configurations will have greater uncertainties due to the accumulation of component model inaccuracies. Large uncertainties would restrict the ISS mission operations. This problem may be alleviated by correlating on-orbit math models using test data measured in space. On-orbit testing of earlier ISS configurations, with ground testing of new hardware components, will lead to the verification of later, more complex configurations. This “phased configuration verification” allows the use of the same uncertainty factors in predicting structural dynamic loads for all configurations.
https://ntrs.nasa.gov/search.jsp?R=20120016000 2018-05-20T00:31:57+00:00Z
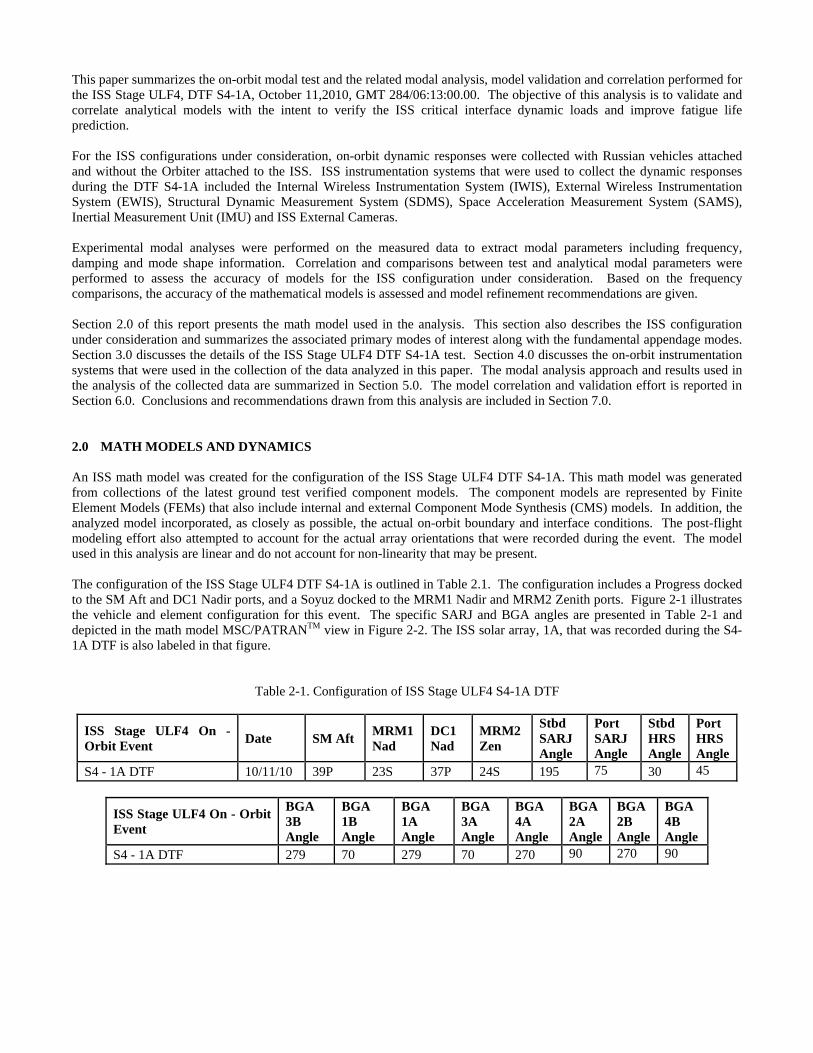
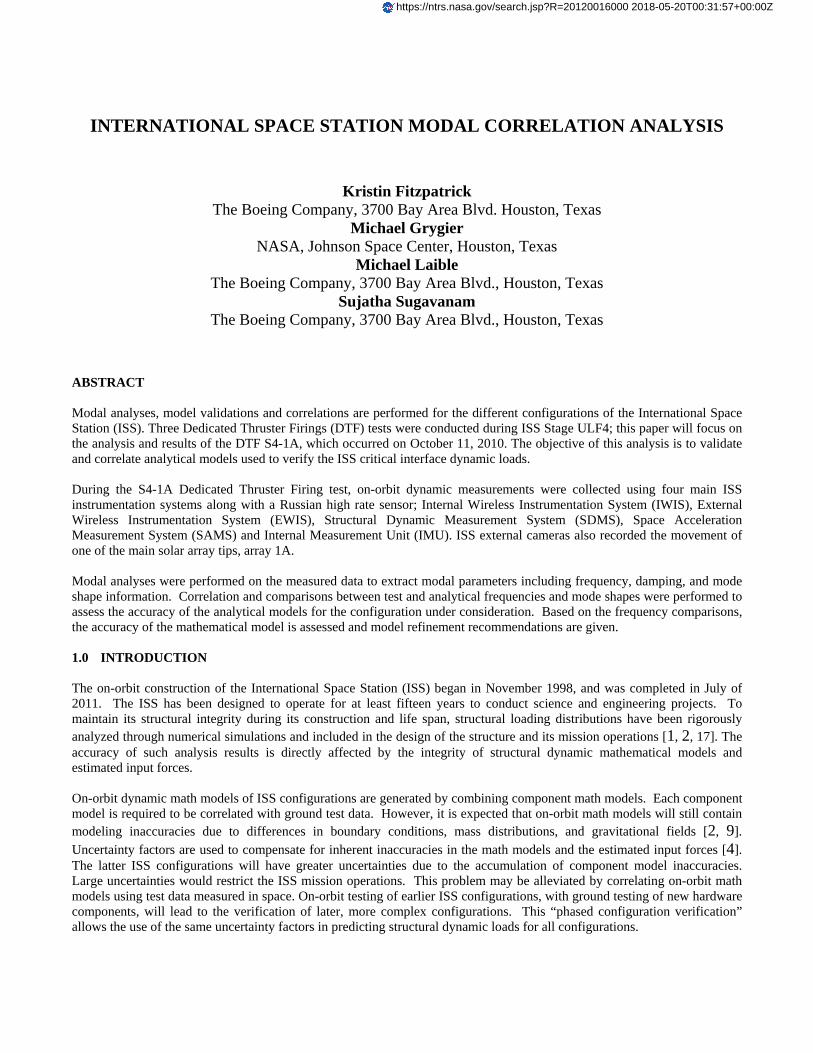
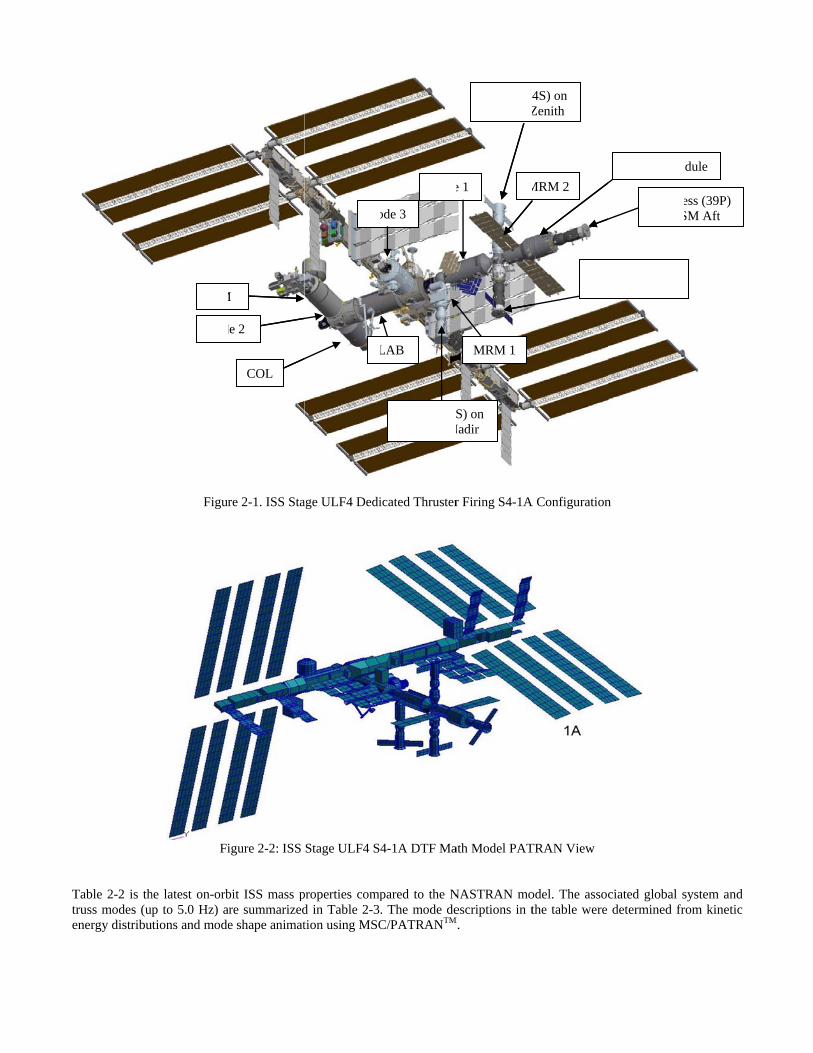
This paper summarizes the on-orbit modal test and the related modal analysis, model validation and correlation performed for the ISS Stage ULF4, DTF S4-1A, October 11,2010, GMT 284/06:13:00.00. The objective of this analysis is to validate and correlate analytical models with the intent to verify the ISS critical interface dynamic loads and improve fatigue life prediction. For the ISS configurations under consideration, on-orbit dynamic responses were collected with Russian vehicles attached and without the Orbiter attached to the ISS. ISS instrumentation systems that were used to collect the dynamic responses during the DTF S4-1A included the Internal Wireless Instrumentation System (IWIS), External Wireless Instrumentation System (EWIS), Structural Dynamic Measurement System (SDMS), Space Acceleration Measurement System (SAMS), Inertial Measurement Unit (IMU) and ISS External Cameras. Experimental modal analyses were performed on the measured data to extract modal parameters including frequency, damping and mode shape information. Correlation and comparisons between test and analytical modal parameters were performed to assess the accuracy of models for the ISS configuration under consideration. Based on the frequency comparisons, the accuracy of the mathematical models is assessed and model refinement recommendations are given. Section 2.0 of this report presents the math model used in the analysis. This section also describes the ISS configuration under consideration and summarizes the associated primary modes of interest along with the fundamental appendage modes. Section 3.0 discusses the details of the ISS Stage ULF4 DTF S4-1A test. Section 4.0 discusses the on-orbit instrumentation systems that were used in the collection of the data analyzed in this paper. The modal analysis approach and results used in the analysis of the collected data are summarized in Section 5.0. The model correlation and validation effort is reported in Section 6.0. Conclusions and recommendations drawn from this analysis are included in Section 7.0. 2.0 MATH MODELS AND DYNAMICS An ISS math model was created for the configuration of the ISS Stage ULF4 DTF S4-1A. This math model was generated from collections of the latest ground test verified component models. The component models are represented by Finite Element Models (FEMs) that also include internal and external Component Mode Synthesis (CMS) models. In addition, the analyzed model incorporated, as closely as possible, the actual on-orbit boundary and interface conditions. The post-flight modeling effort also attempted to account for the actual array orientations that were recorded during the event. The model used in this analysis are linear and do not account for non-linearity that may be present. The configuration of the ISS Stage ULF4 DTF S4-1A is outlined in Table 2.1. The configuration includes a Progress docked to the SM Aft and DC1 Nadir ports, and a Soyuz docked to the MRM1 Nadir and MRM2 Zenith ports. Figure 2-1 illustrates the vehicle and element configuration for this event. The specific SARJ and BGA angles are presented in Table 2-1 and depicted in the math model MSC/PATRANTM view in Figure 2-2. The ISS solar array, 1A, that was recorded during the S4-1A DTF is also labeled in that figure.
Table 2-1. Configuration of ISS Stage ULF4 S4-1A DTF
ISS Stage ULF4 On - Orbit Event
Date SM Aft MRM1 Nad
DC1 Nad
MRM2 Zen
Stbd SARJ Angle
Port SARJ Angle
Stbd HRS Angle
Port HRSAngle
S4 - 1A DTF 10/11/10 39P 23S 37P 24S 195 75 30 45
ISS Stage ULF4 On - Orbit Event
BGA 3B Angle
BGA 1B Angle
BGA 1A Angle
BGA 3A Angle
BGA 4A Angle
BGA 2A Angle
BGA 2B Angle
BGA 4B Angle
S4 - 1A DTF 279 70 279 70 270 90 270 90
Ttre
Table 2-2 is thruss modes (up
energy distribu
Figur
Fi
he latest on-orbp to 5.0 Hz) ations and mode
JEM
Nod
re 2-1. ISS Sta
igure 2-2: ISS
bit ISS mass pare summarizede shape animat
M
de 2
COL
age ULF4 Dedi
Stage ULF4 S
properties compd in Table 2-3tion using MSC
No
L
icated Thruster
4-1A DTF Ma
pared to the N. The mode deC/PATRANTM
Soyuz (23SMRM1 N
ode 3
LAB
Node
r Firing S4-1A
ath Model PAT
NASTRAN moescriptions in t
M.
S) on Nadir
Soyuz (24MRM2 Z
e 1
MRM 1
M
A Configuration
TRAN View
odel. The assocthe table were
Proon
4S) on Zenith
MRM 2
n
ciated global sdetermined fr
Progreon S
ogress (37P) n DC1 Nadir
Service Mo
system and rom kinetic
ess (39P) SM Aft
dule

Table 2-2. Mass Properties: ISS Stage ULF4 S4-1A DTF Configuration DESCRIPTION 24S_AR ISS+37P+23S+39P+24S after 24S docking
Mass (lbs) Center of Gravity (in) Moments of Inertia (Slug- ft2)
X Y Z Ixx Iyy Izz
VIPER Properties 827126 -160.9 -38.4 130.0 84599810 50464111 127527980
Loads Model fv84ds 789386 -161.6 -34.9 127.4 85752622 47993160 123591383
% Diff -4.8% 0.5% -10.1% -2.0% 1.3% -5.1% -3.2%
Table 2-3. Mode Descriptions: ISS Stage ULF4 S4-1A DTF Math Model
Mode # Freq. (Hz) Mode Description
10 0.061 Array OP / Module XZ
17 0.092 Array IP/Station XY
36 0.112 Station XY (Slight)/Array OP
44 0.114 Station XY
57 0.150 HRS Out-of-plane
83 0.173 Truss XY
84 0.197 HRS IP / Module XZ / Truss XYZ
102 0.225 Truss YZ / Module XZ
131 0.272 Station XY (JEM XY)
142 0.285 Station XZ
171 0.362 SM Array IP / COL-JEM YZ
175 0.368 Truss YZ / Module TOR / HRS Torsion
211 0.385 HRS Torsion
245 0.447 Modules-JEM YZ / Truss XYZ
254 0.494 Station Torsion X / Truss YZ
256 0.513 Station Torsion X - JEM XYZ / HRS Accordion / Truss XYZ
276 0.553 Module XY / STBD Truss XY / HRS Accordion
286 0.578 HRS Accordion
288 0.584 PHRS Torsion / RSA Tor X / Truss YZ
297 0.637 EPS Torsion
302 0.665 Station XZ
313 0.720 Truss XY Bending
339 0.793 Module XY / Node 3 YZ / EPS IP
352 0.840 Module RSA YZ
353 0.843 Node 3 YZ / RSA XZ
355 0.888 Station XY / Soyuz MRM1 OP / EPS IP
359 0.928 HRS IP
368 0.994 Truss XZ / Module XZ
371 1.030 Module XY (N3/N1/AL)
382 1.099 RSA XZ
443 1.174 Station XY / JEM EF
484 1.251 JEM XY / Node 3 XY / COL YZ
486 1.310 Module XZ
504 1.425 RSA XZ / COL XY / JEM EF XYZ
511 1.508 JEM YZ / APM YZ / RSA XZ
Mode # Freq. (Hz) Mode Description
540 1.633 Station XY
549 1.672 Truss XY / Station XYZ / RSA YZ
553 1.703 Station XY
625 1.834 SPDM MB2
646 1.956 Truss XY Bending / more…
661 1.983 P3 Torsion
674 2.037 Truss XY / SPDM MB2
723 2.171 Airlock YZ / SM XY
728 2.190 Station XY
803 2.434 Truss COL N2 JEM YZ / SM XY
819 2.560 Module XZ
833 2.754 SM XY / Airlock YZ
834 2.785 SM XY / Airlock YZ / PHRS IP
921 3.458 MRM YZ / N2 N3Airlock XY / S3 P3 Torsion
931 3.722 Station XZ
935 3.769 Truss XYZ
951 4.001 Station XYZ
960 4.103 US LAB XY / Node 2 XY
979 4.264 EPS IP 2nd
1003 4.564 Truss XYZ / Station XY
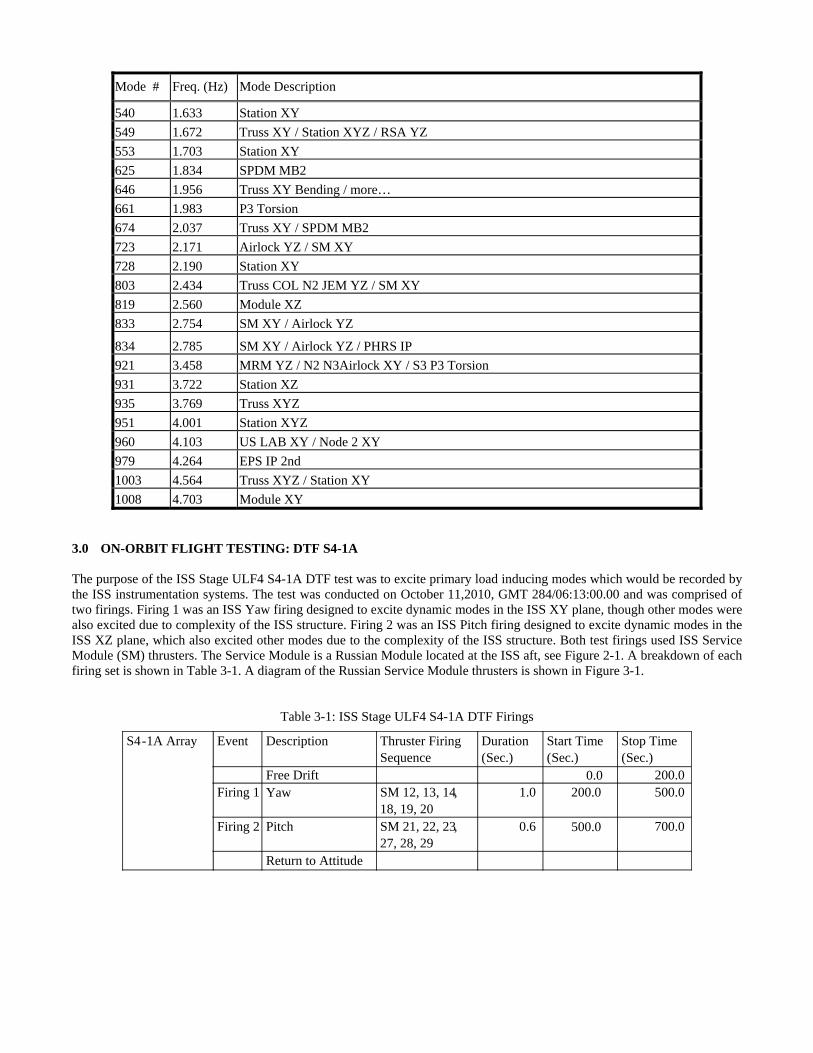
1008 4.703 Module XY 3.0 ON-ORBIT FLIGHT TESTING: DTF S4-1A The purpose of the ISS Stage ULF4 S4-1A DTF test was to excite primary load inducing modes which would be recorded by the ISS instrumentation systems. The test was conducted on October 11,2010, GMT 284/06:13:00.00 and was comprised of two firings. Firing 1 was an ISS Yaw firing designed to excite dynamic modes in the ISS XY plane, though other modes were also excited due to complexity of the ISS structure. Firing 2 was an ISS Pitch firing designed to excite dynamic modes in the ISS XZ plane, which also excited other modes due to the complexity of the ISS structure. Both test firings used ISS Service Module (SM) thrusters. The Service Module is a Russian Module located at the ISS aft, see Figure 2-1. A breakdown of each firing set is shown in Table 3-1. A diagram of the Russian Service Module thrusters is shown in Figure 3-1.
Table 3-1: ISS Stage ULF4 S4-1A DTF Firings
S4 - 1A Array Event Description Thruster Firing Sequence
Duration (Sec.)
Start Time (Sec.)
Stop Time ( Sec.)
Free Drift 0.0 200.0Firing 1 Yaw SM 12, 13, 14,
18, 19, 201.0 200.0 500.0
Firing 2 Pitch SM 21, 22, 23,27, 28, 29
0.6 500.0 700.0
Return to Attitude
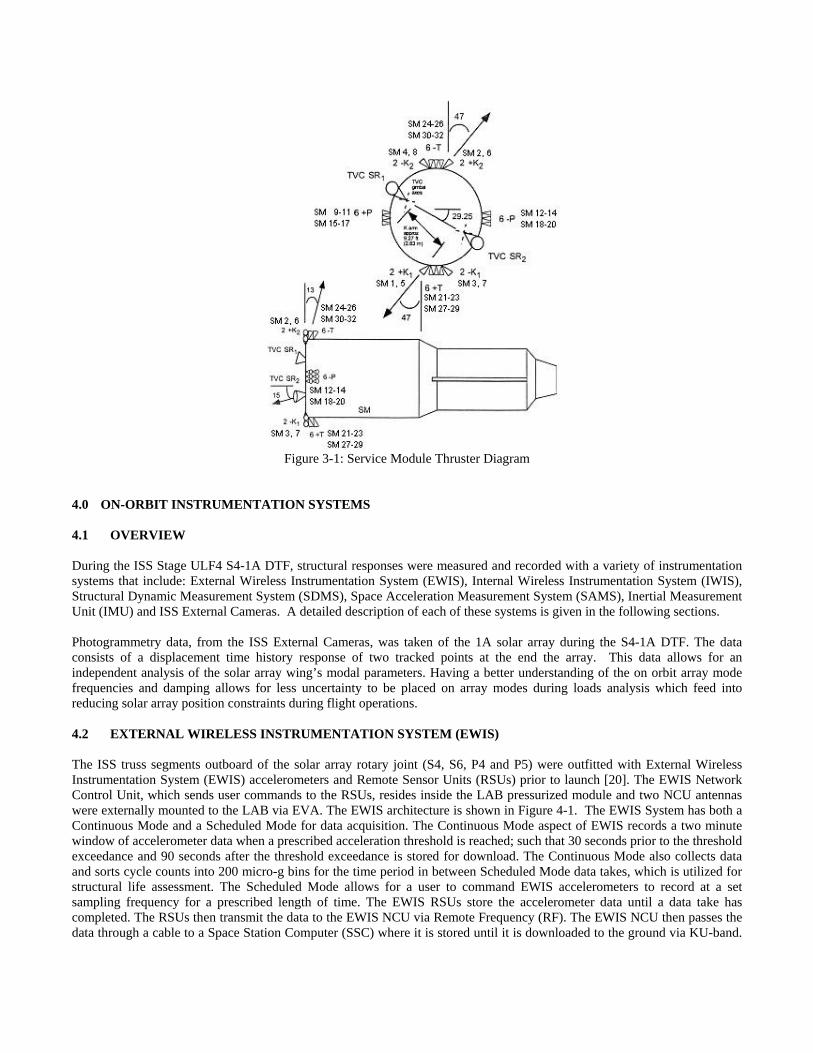
Figure 3-1: Service Module Thruster Diagram
4.0 ON-ORBIT INSTRUMENTATION SYSTEMS 4.1 OVERVIEW During the ISS Stage ULF4 S4-1A DTF, structural responses were measured and recorded with a variety of instrumentation systems that include: External Wireless Instrumentation System (EWIS), Internal Wireless Instrumentation System (IWIS), Structural Dynamic Measurement System (SDMS), Space Acceleration Measurement System (SAMS), Inertial Measurement Unit (IMU) and ISS External Cameras. A detailed description of each of these systems is given in the following sections. Photogrammetry data, from the ISS External Cameras, was taken of the 1A solar array during the S4-1A DTF. The data consists of a displacement time history response of two tracked points at the end the array. This data allows for an independent analysis of the solar array wing’s modal parameters. Having a better understanding of the on orbit array mode frequencies and damping allows for less uncertainty to be placed on array modes during loads analysis which feed into reducing solar array position constraints during flight operations. 4.2 EXTERNAL WIRELESS INSTRUMENTATION SYSTEM (EWIS) The ISS truss segments outboard of the solar array rotary joint (S4, S6, P4 and P5) were outfitted with External Wireless Instrumentation System (EWIS) accelerometers and Remote Sensor Units (RSUs) prior to launch [20]. The EWIS Network Control Unit, which sends user commands to the RSUs, resides inside the LAB pressurized module and two NCU antennas were externally mounted to the LAB via EVA. The EWIS architecture is shown in Figure 4-1. The EWIS System has both a Continuous Mode and a Scheduled Mode for data acquisition. The Continuous Mode aspect of EWIS records a two minute window of accelerometer data when a prescribed acceleration threshold is reached; such that 30 seconds prior to the threshold exceedance and 90 seconds after the threshold exceedance is stored for download. The Continuous Mode also collects data and sorts cycle counts into 200 micro-g bins for the time period in between Scheduled Mode data takes, which is utilized for structural life assessment. The Scheduled Mode allows for a user to command EWIS accelerometers to record at a set sampling frequency for a prescribed length of time. The EWIS RSUs store the accelerometer data until a data take has completed. The RSUs then transmit the data to the EWIS NCU via Remote Frequency (RF). The EWIS NCU then passes the data through a cable to a Space Station Computer (SSC) where it is stored until it is downloaded to the ground via KU-band.
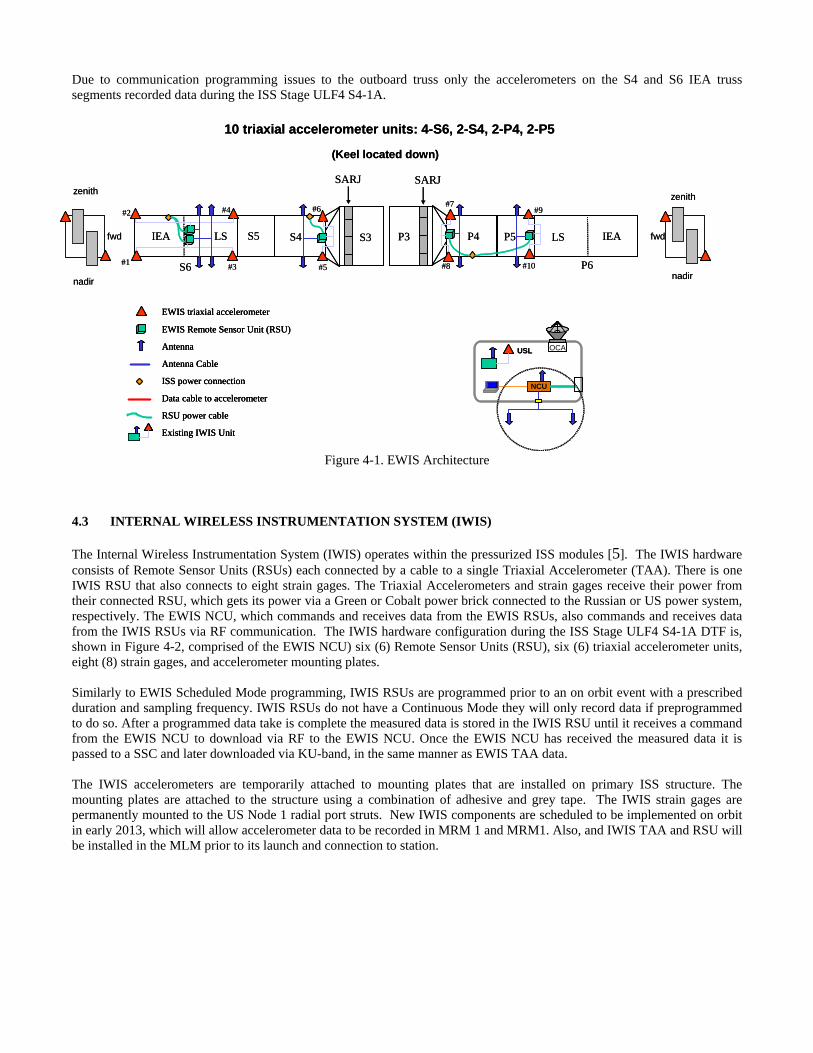
Due to communication programming issues to the outboard truss only the accelerometers on the S4 and S6 IEA truss segments recorded data during the ISS Stage ULF4 S4-1A.
Figure 4-1. EWIS Architecture
4.3 INTERNAL WIRELESS INSTRUMENTATION SYSTEM (IWIS) The Internal Wireless Instrumentation System (IWIS) operates within the pressurized ISS modules [5]. The IWIS hardware consists of Remote Sensor Units (RSUs) each connected by a cable to a single Triaxial Accelerometer (TAA). There is one IWIS RSU that also connects to eight strain gages. The Triaxial Accelerometers and strain gages receive their power from their connected RSU, which gets its power via a Green or Cobalt power brick connected to the Russian or US power system, respectively. The EWIS NCU, which commands and receives data from the EWIS RSUs, also commands and receives data from the IWIS RSUs via RF communication. The IWIS hardware configuration during the ISS Stage ULF4 S4-1A DTF is, shown in Figure 4-2, comprised of the EWIS NCU) six (6) Remote Sensor Units (RSU), six (6) triaxial accelerometer units, eight (8) strain gages, and accelerometer mounting plates. Similarly to EWIS Scheduled Mode programming, IWIS RSUs are programmed prior to an on orbit event with a prescribed duration and sampling frequency. IWIS RSUs do not have a Continuous Mode they will only record data if preprogrammed to do so. After a programmed data take is complete the measured data is stored in the IWIS RSU until it receives a command from the EWIS NCU to download via RF to the EWIS NCU. Once the EWIS NCU has received the measured data it is passed to a SSC and later downloaded via KU-band, in the same manner as EWIS TAA data. The IWIS accelerometers are temporarily attached to mounting plates that are installed on primary ISS structure. The mounting plates are attached to the structure using a combination of adhesive and grey tape. The IWIS strain gages are permanently mounted to the US Node 1 radial port struts. New IWIS components are scheduled to be implemented on orbit in early 2013, which will allow accelerometer data to be recorded in MRM 1 and MRM1. Also, and IWIS TAA and RSU will be installed in the MLM prior to its launch and connection to station.
10 triaxial accelerometer units: 4-S6, 2-S4, 2-P4, 2-P5
(Keel located down)
S4S5
S6
S3
SARJ
LSIEA
#3
#2
#5
#4 #6
#1
P4 P5
P6
P3
SARJ
LS IEA
#9#7
#10#8
zenith
fwd
nadir
zenith
nadir
fwd
USL OCA
NCU
EWIS triaxial accelerometer
EWIS Remote Sensor Unit (RSU)
ISS power connection
Data cable to accelerometer
RSU power cable
Antenna
Antenna Cable
Existing IWIS Unit
EWIS triaxial accelerometer
EWIS Remote Sensor Unit (RSU)
ISS power connection
Data cable to accelerometer
RSU power cable
Antenna
Antenna Cable
Existing IWIS Unit

Figure 4-2: IWIS Sensor Configuration during ISS Stage ULF4 S4-1A DTF.
4.4 STRUCTURAL DYNAMIC MEASUREMENT SYSTEM The Structural Dynamic Measurement System (SDMS) was developed by The Boeing Company for NASA-JSC. The SDMS is intended to measure on-orbit dynamic responses of the ISS Inboard Truss Segment and module-to-truss structure (MTS) struts. SDMS is comprised of 33 accelerometers, 38 strain gage bridges, and two signal conditioning units (SCUs). The accelerometers and strain gages are externally mounted on the five segments of the main inboard truss between the Solar Alpha Rotary Joints (SARJs). The SDMS accelerometers are proof-mass type and their locations are shown in the schematic of the five inboard truss segments shown in Figure 4-3. The accelerometers are mounted in groups of one, two, and three, on the truss primary structure. Each strain gage-bridge uses four strain-gages to form a four-active-arm bridge circuit. A total of 152 strain gages were used to generate all 38 strain-gage bridges. Each strain gage bridge generates a single strain measurement. The general locations of the strain gage bridges are shown in Figure 4-3. Electrical power is provided to the accelerometers and strain gages by two SCUs. The SCUs are also used to amplify, filter, and digitize the signal output by the accelerometers and strain gage bridges. Sensor data is stored on a memory buffer before it is downlinked directly to the ground by telemetry. The SDMS can be fully operated by commands up-linked from the ground.
Figure 4-3: SDMS Accelerometer and Strain Gage Locations
The SDMS has a fixed sampling rate and anti-alias filtering of 40 Hz and 7.5 Hz, respectively. The SDMS system is capable of recording approximately 10.5 minutes of data. The memory buffer is circular so that if over 10.5 minutes of data is recorded, the data will be overwritten gradually starting from the buffer’s beginning. When data recording stops (and over 10.5 minutes of data was collected), the last time step of the data collection immediately precedes the first time step that hasn’t been overwritten. A more comprehensive discussion on the SDMS hardware can be found in [6].
JEM
Z1
PMA1
N3 COF
N2PMA2
PMA3
CUP
FGBSM
MRM1
N1 USL
OCA
A/L
MRM2
IWIS RSU (current)
IWIS Accelerometer
IWIS Strain Gage
ISS Laptop
EWIS NCU
Cobalt Brick/IPCA
Green Brick/IPCA
Cobalt Brick/IPCA(Shared)

4.5 Space Acceleration Measurement System (SAMS) The Space Acceleration Measurement System (SAMS-II), Figure 4-4, provides a continuous measurement of the ISS vibratory acceleration environment from 0.01 to 300 Hz using a distributed, configurable set of tri-axial accelerometers. The accelerometers are housed inside module racks, secondary structure, instead of on the main structure like IWIS. The sensors are in racks in order to provide microgravity data for a variety of science projects, rack system analysis and for the overall ISS microgravity environment. Though these sensors are housed inside module racks, the frequency of interest for ISS loads modal correlation < 5Hz, has been found to have comparable content as the IWIS sensors on the main structure. The SAMS sensors that were recorded and used for the S4-1A DTF analysis are the US Lab sensors, F03 and F04, and JEM sensor, F05.
Figure 4-4: SAMS ISS Hardware
4.6 Russian Inertial Measurement Unit (IMU) The IMU-D (Inertial Measurement Unit) is located in the MRM1 (Mini Research Module), a Russian Pressurized Module connected to the FGB (Functional Cargo Block). The sensor samples at a rate of 2400 Hz. This sensor can measure acceleration +/- 10 mg with a frequency range between 0.01 to 50 Hz. The data for a single event is recorded in 3 audio files, one file for each coordinate direction. The data is downloaded to a Russian ground site and delivered to US NASA personnel. 4.7 ISS PHOTOGRAMMETRIC SYSTEM The ISS photogrammetric system uses EVTCG cameras outside of the ISS structure. The photogrammetric system is intended to be a non-contact instrument to record the dynamic deflections of low frequency space structures such as solar arrays, EPS radiators, and antennas. The Image Science and Analysis Group at NASA-JSC perform the photogrammetric processing of the recorded video footages to generate deflection time response histories. Daylight testing is the optimum condition for photogrammetric processing. Ideally, photogrammetric data processing should involve video footages from at least two video cameras to give a more accurate three-dimensional perspective of deflections. However, single camera approximate processing is also possible using some assumptions on the nature of the deflections. The current ISS video system and data processing method, Figure 4-5, offer a time history with a sampling rate of 15 or 30 Hz and a resolution of 0.1 inches.

Figure 4-5: ISS Cameras used for Structural Dynamics Testing
5.0 MODAL ANALYSIS 5.1 OVERVIEW The test data from all instrumentation systems was prepared for analysis. Time history data was converted, filtered, and plotted as needed. The power spectrum density (PSD) of this data was calculated and plotted to investigate its modal content. An attempt was made to synchronize data sets from different instrument system. This task was complicated by the fact that there is no universal time management across the different instrumentation systems. Each system has a different time keeping and standard that is not synchronized. Modal analysis was then performed on all pre-processed data to determine the structural modal parameters, i.e., frequencies, damping factors, and mode shapes. Modal system identification was also performed separately on the photogrammetry displacement data and MTS strut strain gage data. 5.2 MODAL ANALYSIS PROCEDURE Traditional modal analysis methods using frequency response functions (FRFs) were not used since the input excitation forces were not measured and the duration of free decay data is short. A special modal identification method [7] was used on the accelerometer data, which has been developed for applications to large space structures. It is a time-domain, free-decay method based on the Eigensystem Realization Algorithm (ERA) [8] and a time-domain zooming technique. This method does not require input force measurements and characterizes nonlinearities with a series of linearized modal parameters during the free-decay period. To utilize the time-zooming technique, each data segment was first detrended to remove the constant and linear biases. The detrended data was filtered by a number of bandpass filters to emphasize different frequency ranges. The filtered data was then decimated to reduce the sampling rate. The intent of this combined filtering and decimation process is to emphasize the frequency content of the data in certain bandwidths. This process is comparable to a frequency-domain zooming technique used in the traditional modal analysis methods. It is again noted that the selected modal analysis process is based on a free-decay method and applied to the free-decay portion of the data sets. The ERA modal extraction is applied to several data time windows varying in length. This is performed to extract the most consistent modal content present in the data. The whole process described herein has been implemented in a Boeing proprietary MATLABTM based Graphical User Interface (GUI) software entitled “The Boeing Modal Refinement and Identification Tool” (The Boeing MoReID).

The Boeing Test Analysis Correlation Solutions (BTACS), another Boeing proprietary interactive engineering MATLABTM based GUI, was used to extract modal parameters from the MTS strut strain gage and photogrammetry data. BTACS has a system identification tool that extracts parameters through system realization using the Hankel matrix along with the singular value decomposition method. 5.3 SAMPLE DATA PLOTS The S4-1A Dedicate Thruster Firing Test consisted of two sets of thruster firings. Each set of firings was designed to excite distinct sets of Truss and Module modes. Figure 5-1 through Figure 5-6 show SDMS time history accelerometer data plots for the yaw and pitch firings of the DTF test. Figure 5-1 is SDMS S3 (Starboard Truss Segment) ISS X direction accelerometer data, which shows the Yaw firing (first firing at t=60s) has higher magnitude in the ISS X direction than the pitch firing (second firing at t=360s), as expected. Figures 5-4 through 5-6 are the plots of the SDMS S0 (Center Truss Segment) ISS Z direction accelerometer data, which show a higher acceleration magnitude during the pitch firing.
Figure 5-1. DTF S4-1A S3 ISS X: SDMS: Time History
100 200 300 400 500 600-4
-3
-2
-1
0
1
2
3
4x 10
-4 S3 X direction
Time [sec]
g
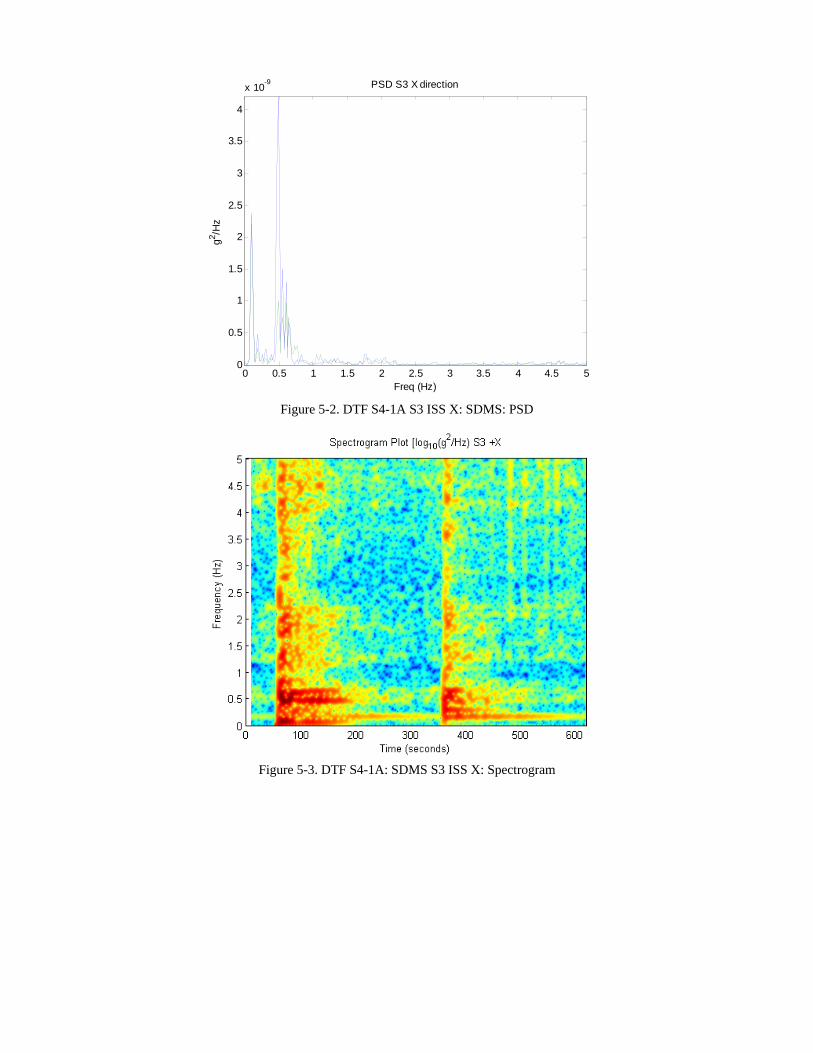
Figure 5-2. DTF S4-1A S3 ISS X: SDMS: PSD
Figure 5-3. DTF S4-1A: SDMS S3 ISS X: Spectrogram
0 0.5 1 1.5 2 2.5 3 3.5 4 4.5 50
0.5
1
1.5
2
2.5
3
3.5
4
x 10-9 PSD S3 X direction
Freq (Hz)
g2 /Hz
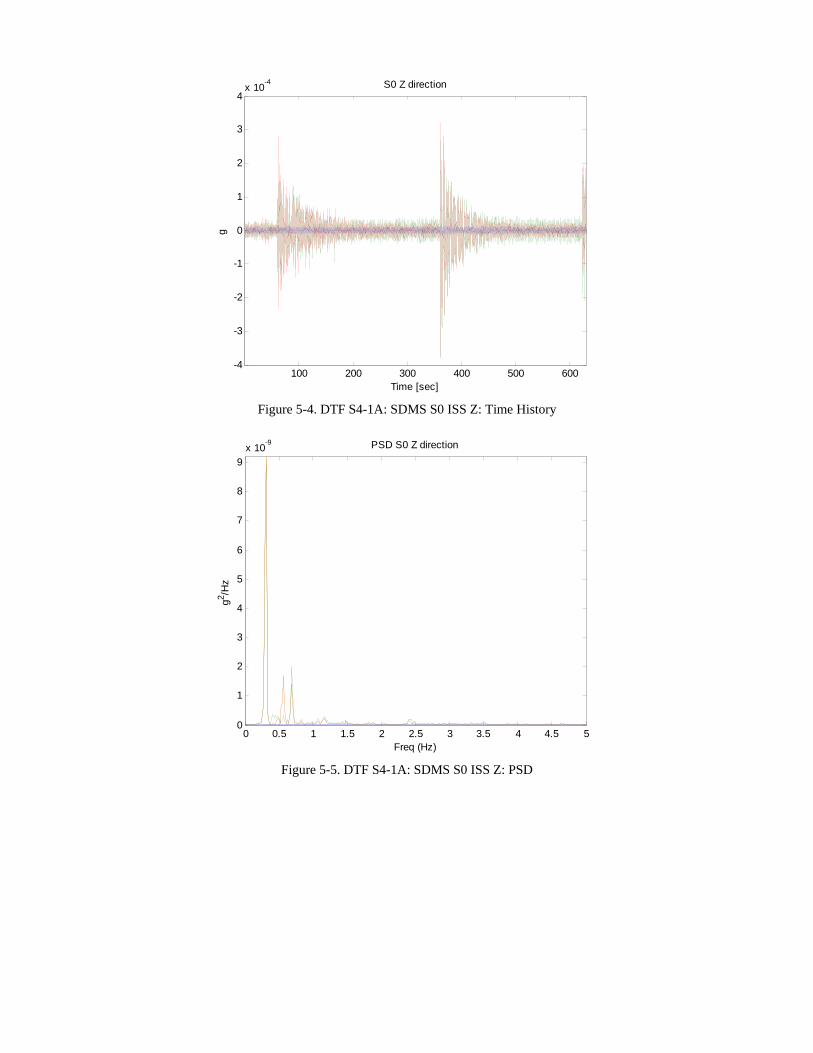
Figure 5-4. DTF S4-1A: SDMS S0 ISS Z: Time History
Figure 5-5. DTF S4-1A: SDMS S0 ISS Z: PSD
100 200 300 400 500 600-4
-3
-2
-1
0
1
2
3
4x 10
-4 S0 Z direction
Time [sec]
g
0 0.5 1 1.5 2 2.5 3 3.5 4 4.5 50
1
2
3
4
5
6
7
8
9x 10
-9 PSD S0 Z direction
Freq (Hz)
g2 /Hz

Figure 5-6. DTF S4-1A: SDMS S0 ISS Z: Spectrogram
6.0 MODEL CORRELATION AND VALIDATION 6.1 OVERVIEW International Space Station integrated loads and dynamics verification and validation procedures are defined in Ref. [9]. Verification procedures are intended to insure that the on-orbit structure satisfies its structural requirements. Among others, these requirements include the verification that the structure can accommodate on-orbit loads. The model of the structure used in the verification of the on-orbit loads must be validated [4]. One of the requirements in the validation plan states that test and analytical modal frequencies agree within 5% for primary modes and within 10% for secondary modes [Error! Reference source not found.]. The model validation plans are intended (i) to prove that the on-orbit models satisfy the validation requirements or (ii) to refine the on-orbit models so that they satisfy the validation requirements. 6.2 MODE CORRELATION AND MODAL ANALYSIS The task of matching test and analytical modes is commonly performed by evaluating the Modal Assurance Criteria (MAC) [10] and the Cross-Orthogonality (XOR) matrices [11]. Both MAC and XOR matrices are indicators that show the level of correlation between test and analytical mode shapes. These indicators are only meaningful with a large number of mode shape measurements spanning a wide spatial distribution. For the ISS, it is desirable to have two sensors in each ISS module; at least one sensor at each side of an interface. This would aid in defining axial and bending modes. Furthermore, the addition of three sensors placed in each ISS module would aid in defining ISS torsion modes. Such criteria are only partially met by modes extracted from the IWIS, SDMS, EWIS, SAMS and IMU-D dynamic measurement systems. In the computation of the XOR matrix, a reduced mass matrix, having degrees-of-freedom (DOFs) consistent with the measurement DOFs, is needed. A reduced mass matrix for this particular problem requires a significant reduction from over several thousand DOFs (residual model) to less than 75 DOFs and was unavailable for this study. The computation of the MAC matrix does not require the use of a reduced mass matrix. Thus, test-analytical mode correspondences based on the MAC was used for the modes extracted from the ISS sensor systems. It should be noted that the damping was very difficult to estimate with the type of on orbit test that was conducted and the type of data that was available. In order to estimate modal damping with high confidence, free decay data created from a test with several input sites is required. The S4-1A DTF had one input site, the SM thrusters, it is not feasible to conduct an on-orbit dynamic test on the ISS with multiple input sites and nominal on-orbit dynamic events (i.e., vehicle dockings, undockings) do not have the characteristics of this ideal data.

Ta TENdd Tau Td 6 Tvth
6 TILObthm
The analytical amplitude abov
The photogramETVCG camerNASA JSC recdata sampled adamping of the
The SDMS MTaccelerometer dunder investiga
The following data of the S4-1
6.3 STAGE
The analytical vehicles, the sohe NASTRAN
6.3.1 S4 - 1A
The Image ScieISS ETVCG caLab. The ISAGOne point was blanket box at he relative dis
mathematical c
model and tesve 2.0 Hz. The
mmetry data tharas was analyzceived the analat 30 Hz. Moda fundamental U
TS Strut Straindata. This dataation can range
sections will g1A DTF.
E ULF-4: Dedi
model was creolar array rotaryN system model
A Photogram
ence and Analyameras. The ca
G used their imon the mast cathe end of the
splacement of correlation betw
st data both exerefore, mode c
at was collectezed independeog video and, al parameters wUS PV Array m
n Gage data thaa was used to ine in frequency f
give results for
icated Thruste
eated in detail y joints (SARJl, Figure 6-1.
Figure
metry Results
ysis Group (ISameras used w
mage processingap located at th
solar array. Ththe SAW tip iween the axial
xhibit high modcorrelation abo
ed on the 1A sently from the using their im
were extracted modes.
at was collectenvestigate a lowfrom 0.08 to 0.
r the photogram
er Firing S4-1
to match the J) angles, the a
e 6-1: NASTRA
s
AG), at NASAwere CP3 locatg software to tre end of the mhe motion of ein each axis, dl and out-of-pl
dal density above 1.5 Hz was
solar array winaccelerometer
age processingfrom this data
ed during the Sw frequency m.11 Hz dependi
mmetry array d
1A – RESULT
ISS configuratarray angles and
AN System Mo
A JSC receivedted on the S1 srack two pointast of the solar
each point was defined by the lane (OP) moti
ove 1.5 Hz. A very difficult.
ng, attached to r data. The Ig software, crea and was used
S4-1A data wasmode that exhibing on the amp
data, the MTS
TS
tion during thed the ISS robo
odel S4-1A DT
d analog videostarboard trussts at the end ofr array. The sectracked in eacplane of the a
ion, the calcul
Also, the data
starboard trusImage Scienceeated discrete dd to assess the
s also analyzedbits nonlinear cplitude of the re
strain gage da
e time of the Sotic arm locatio
TF
taken during ts segment and f the 1A Solar cond tracked pch video sequearray during thations were co
exhibits very
ss segment S4,e and Analysisdisplacement ti
frequency and
d independentlcharacteristics.esponse.
ata and the acc
S4-1A DTF. Ton were all rep
the S4-1A DTFCP13 located Array Wing, F
point was on thence and used the DTF. Due tonducted in a w
low modal
, using ISS s Group at ime history d structural
ly from the The mode
celerometer
The visiting resented in
F from two on the US
Figure 6-2. he tip of the to compute to the high way which

cd Tidwpdidsmfawauv
constrains the adirection is sign
The displacemedentification t
within a set wiplumed the 1Adirection, was adentified in th
shift overtime modal parametfrequency rangarray torsion mwith each otheralong with the used by ISS grvehicle docking
axial position tnificantly less t
ent time histortool of BTACSindow over a
A array and pralso analyzed be Yaw firing dcan be seen iners from the d
ge from 0.064 tmode identifiedr. There was alanalysis condu
round personneg).
Figure 6
Fig
F1
to a fixed valuethan the in-pla
ry data was deS. The BTACprescribed perrovided the bebut did not prodata showed ann the BTACS ata and the anato 0.068 Hz. T
d at 0.096 Hz wlso a second OPucted on other el to select app
6-2: Tracked p
gure 6-3: Time
e of 0. This coane (IP) or out-
trended and thCS system idenriod of time west data set foovide as high an increase in frsystem ID winalytical modal
The first IP mowhich is closelP mode identifarrays, will ai
propriate array
points of 1A, L
e History, 1A A
onstraint is acceof-plane (OP)
he modal paramntification tool
within the dataor identifying quality results
frequency durinndow in Figureparameters ar
ode had a frequy spaced with
fied at 0.146 Hid in reducing y angles to par
eft: Camera Im
Array Mast Cap
eptable given tmotions.
meters were exl includes a m
a set, Figure 6-the modal pars as the data frng the free dece 6-4. The com
re summarized uency range ofthe first IP mo
Hz. The results othe restriction
rk solar arrays
mage, Right: PA
p, Out-of-Plane
F2
that the motion
xtracted and anmethod that ex-3. The first frameters. The rom the first fircay of the arramparison resulin Table 6-1.
f 0.097 to 0.10ode and these of the S4-1A ps in the solar aprior to a dyn
ATRANTM Ima
e, Detrended
n of the array i
nalyzed using xtracts modal pfiring set, Yaw
second firingring. The first
ay motion. Thelts between theThe first OP m
04 Hz. There wmodes appear
photogrammetrarray constrainnamic on orbit
age
in the axial
the system parameters
w direction, g set, Pitch two modes
e frequency e extracted
mode had a was also an
to interact ry analysis, nt matrices; t event (i.e.

Figure 6-4: BTACS Sys ID Results for 1A Photo-g Data of S4-1A DTF F1
Table 6-1: BTACS Sys ID Results/MAC for 1A Photo-g Data of S4-1A DTF F1
On‐Orbit Analytical
Mode Description Time
Freq (Hz)
% Damping
Mode # Freq (Hz) MAC % Freq. Dif.
OP Beg 0.064 8.58 16 0.067 0.975 3.8
‐ Mid 0.066 1.90 ‐ ‐ 0.964 0.7
‐ End 0.068 0.34 ‐ ‐ 0.974 ‐1.1
IP Beg 0.097 2.96 20 0.096 0.953 ‐1.4
‐ Mid 0.100 2.05 ‐ ‐ 0.933 ‐3.9
‐ End 0.104 3.22 ‐ ‐ 0.975 ‐7.5
TOR Constant 0.096 0.81 30 0.1 0.984 4.5
OP Constant 0.146 0.64 60 0.151 0.955 3.6
6.3.2 S4-1A MTS Strut Strain Gage Analysis In 2011 a maneuver was conducted that produced loads that were 25% higher than predicted loads. An investigation into the event found there was controller-structure-interaction; the controller was amplifying an excited structural mode. The mode in question had previously been identified with on orbit data and was found to correlate well with the shape of the corresponding analytical mode, having a MAC > 0.9 repeatedly, but could range in frequency difference from 2% -18%, even during the same ISS stage. The mode is an ISS XY global mode, where the truss and pressurized modules make a scissor like motion about the module-to-truss structure (MTS) struts. The MTS struts connect the pressurized modules to the truss segments of the ISS. The analytical reconstruction of the event produced high bending loads at the Node 1 to Lab interface, consistent with high MTS strut loads. SDMS MTS Strut strain gage data, for several on orbit events, was analyzed using the BTACS system identification tool which includes a method that extracts modal parameters within a set window over a prescribed period of time within the data set. This section will focus on the results of the data collected during the S4-1A DTF. The SDMS MTS Strut strain gage time history data, bandpass filtered 0.03 Hz-0.2 Hz, for the S4-1A DTF is shown in Figure 6-5. The first firing is a yaw firing which excited the low frequency ISS XY mode with more energy than the pitch firing that followed. A visual of the frequency results of the system identification analysis is shown in Figure 6-6. The modal parameters were extracted from 12 time periods throughout the first firing. A modal assurance criterion (MAC) was calculated between each extracted mode. The MAC values between each extracted mode were all above 0.92; confirming that the tool was identifying the same mode over time with a changing frequency. The frequency of the mode shows a dependence on the magnitude of the data that was used for the extraction. The frequency, damping and EMAC value of the extracted modes is presented in Table 6-2: BTACS Sys ID Results for MTS Strain Gage Data of S4-1A DTF F1.
OP
IP
TOR
OP
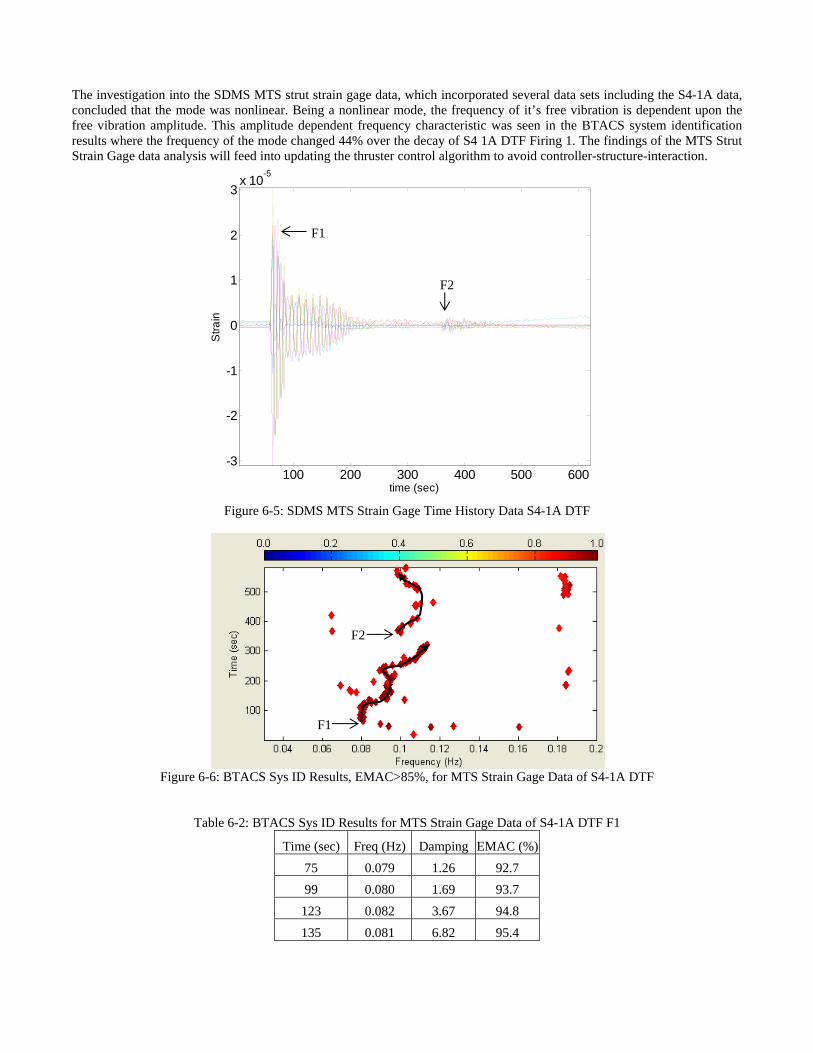
The investigation into the SDMS MTS strut strain gage data, which incorporated several data sets including the S4-1A data, concluded that the mode was nonlinear. Being a nonlinear mode, the frequency of it’s free vibration is dependent upon the free vibration amplitude. This amplitude dependent frequency characteristic was seen in the BTACS system identification results where the frequency of the mode changed 44% over the decay of S4 1A DTF Firing 1. The findings of the MTS Strut Strain Gage data analysis will feed into updating the thruster control algorithm to avoid controller-structure-interaction.
Figure 6-5: SDMS MTS Strain Gage Time History Data S4-1A DTF
Figure 6-6: BTACS Sys ID Results, EMAC>85%, for MTS Strain Gage Data of S4-1A DTF
Table 6-2: BTACS Sys ID Results for MTS Strain Gage Data of S4-1A DTF F1
Time (sec) Freq (Hz) Damping EMAC (%)
75 0.079 1.26 92.7
99 0.080 1.69 93.7
123 0.082 3.67 94.8
135 0.081 6.82 95.4
100 200 300 400 500 600-3
-2
-1
0
1
2
3x 10
-5
time (sec)
Str
ain
F1
F2
F1
F2
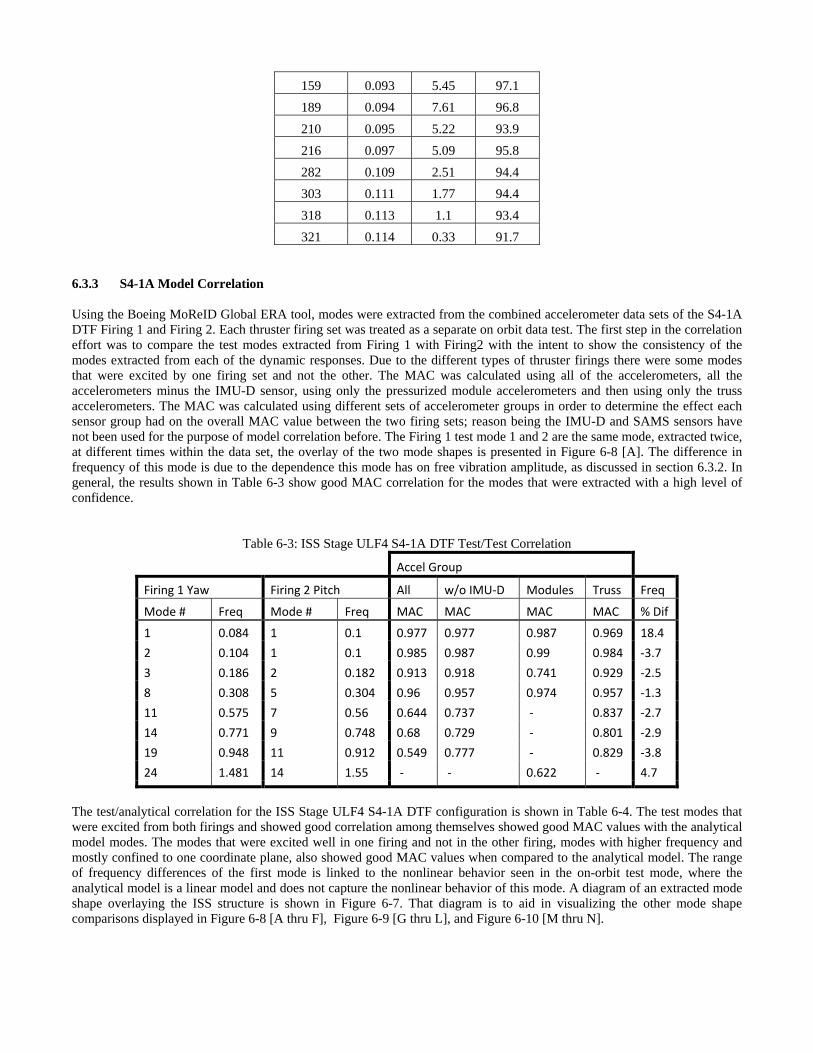
159 0.093 5.45 97.1
189 0.094 7.61 96.8
210 0.095 5.22 93.9
216 0.097 5.09 95.8
282 0.109 2.51 94.4
303 0.111 1.77 94.4
318 0.113 1.1 93.4
321 0.114 0.33 91.7
6.3.3 S4-1A Model Correlation Using the Boeing MoReID Global ERA tool, modes were extracted from the combined accelerometer data sets of the S4-1A DTF Firing 1 and Firing 2. Each thruster firing set was treated as a separate on orbit data test. The first step in the correlation effort was to compare the test modes extracted from Firing 1 with Firing2 with the intent to show the consistency of the modes extracted from each of the dynamic responses. Due to the different types of thruster firings there were some modes that were excited by one firing set and not the other. The MAC was calculated using all of the accelerometers, all the accelerometers minus the IMU-D sensor, using only the pressurized module accelerometers and then using only the truss accelerometers. The MAC was calculated using different sets of accelerometer groups in order to determine the effect each sensor group had on the overall MAC value between the two firing sets; reason being the IMU-D and SAMS sensors have not been used for the purpose of model correlation before. The Firing 1 test mode 1 and 2 are the same mode, extracted twice, at different times within the data set, the overlay of the two mode shapes is presented in Figure 6-8 [A]. The difference in frequency of this mode is due to the dependence this mode has on free vibration amplitude, as discussed in section 6.3.2. In general, the results shown in Table 6-3 show good MAC correlation for the modes that were extracted with a high level of confidence.
Table 6-3: ISS Stage ULF4 S4-1A DTF Test/Test Correlation
Accel Group
Firing 1 Yaw Firing 2 Pitch All w/o IMU‐D Modules Truss Freq
Mode # Freq Mode # Freq MAC MAC MAC MAC % Dif
1 0.084 1 0.1 0.977 0.977 0.987 0.969 18.4
2 0.104 1 0.1 0.985 0.987 0.99 0.984 ‐3.7
3 0.186 2 0.182 0.913 0.918 0.741 0.929 ‐2.5
8 0.308 5 0.304 0.96 0.957 0.974 0.957 ‐1.3
11 0.575 7 0.56 0.644 0.737 ‐ 0.837 ‐2.7
14 0.771 9 0.748 0.68 0.729 ‐ 0.801 ‐2.9
19 0.948 11 0.912 0.549 0.777 ‐ 0.829 ‐3.8
24 1.481 14 1.55 ‐ ‐ 0.622 ‐ 4.7
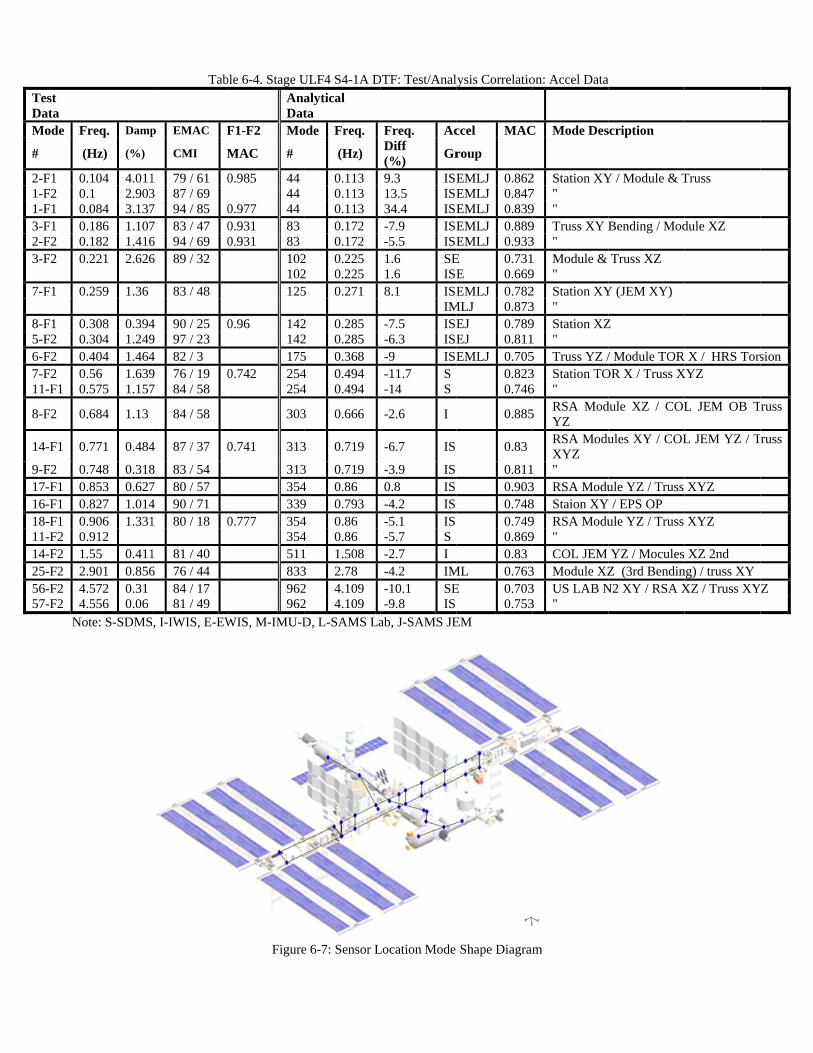
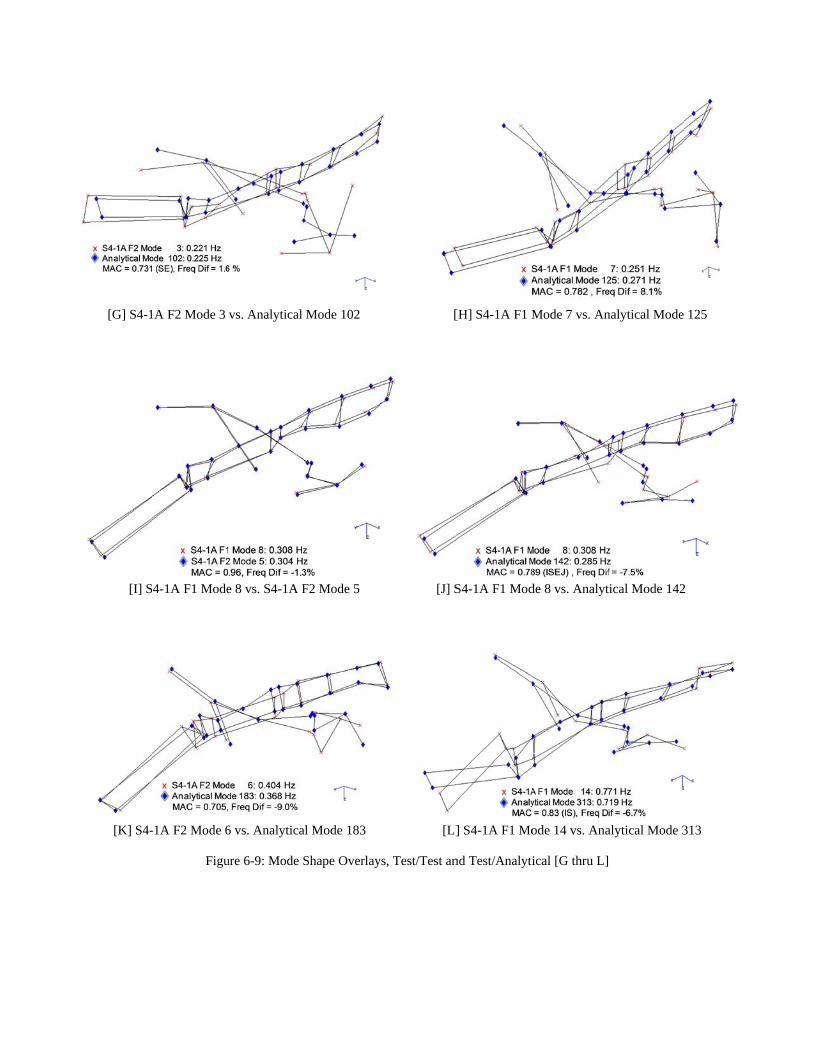
The test/analytical correlation for the ISS Stage ULF4 S4-1A DTF configuration is shown in Table 6-4. The test modes that were excited from both firings and showed good correlation among themselves showed good MAC values with the analytical model modes. The modes that were excited well in one firing and not in the other firing, modes with higher frequency and mostly confined to one coordinate plane, also showed good MAC values when compared to the analytical model. The range of frequency differences of the first mode is linked to the nonlinear behavior seen in the on-orbit test mode, where the analytical model is a linear model and does not capture the nonlinear behavior of this mode. A diagram of an extracted mode shape overlaying the ISS structure is shown in Figure 6-7. That diagram is to aid in visualizing the other mode shape comparisons displayed in Figure 6-8 [A thru F], Figure 6-9 [G thru L], and Figure 6-10 [M thru N].
Test Data Mode
#
2-F1 1-F2 1-F1 3-F1 2-F2 3-F2 7-F1 8-F1 5-F2 6-F2 7-F2 11-F1
8-F2
14-F1
9-F2 17-F1 16-F1 18-F1 11-F2 14-F2 25-F2 56-F2 57-F2
N
Freq. Damp
(Hz) (%)
0.104 4.0110.1 2.9030.084 3.1370.186 1.1070.182 1.4160.221 2.626 0.259 1.36 0.308 0.3940.304 1.2490.404 1.4640.56 1.6390.575 1.157
0.684 1.13
0.771 0.484
0.748 0.3180.853 0.6270.827 1.0140.906 1.3310.912 1.55 0.4112.901 0.8564.572 0.31 4.556 0.06
Note: S-SDMS
Tab
p EMAC F
CMI M
1 79 / 61 03 87 / 69 7 94 / 85 07 83 / 47 06 94 / 69 06 89 / 32
83 / 48
4 90 / 25 09 97 / 23 4 82 / 3 9 76 / 19 07 84 / 58
84 / 58
4 87 / 37 0
8 83 / 54 7 80 / 57 4 90 / 71 1 80 / 18 0
1 81 / 40 6 76 / 44
84 / 17 81 / 49
, I-IWIS, E-EW
ble 6-4. Stage UAnaDat
F1-F2 Mo
MAC #
0.985 44 44
0.977 44 0.931 83 0.931 83
102102125
0.96 142142175
0.742 254254
303
0.741 313
313354339
0.777 354354511833962962
WIS, M-IMU-D
Figure
ULF4 S4-1A Dalytical ta
ode Freq.
(Hz)
0.113 0.113 0.113 0.172 0.172
2 0.225 2 0.225 5 0.271
2 0.285 2 0.285 5 0.368 4 0.494 4 0.494
3 0.666
3 0.719
3 0.719 4 0.86 9 0.793 4 0.86 4 0.86 1 1.508 3 2.78 2 4.109 2 4.109 D, L-SAMS La
e 6-7: Sensor L
DTF: Test/Anal
Freq. AcDiff (%)
Gr
9.3 ISE13.5 ISE34.4 ISE-7.9 ISE-5.5 ISE1.6 SE1.6 ISE8.1 ISE IM-7.5 ISE-6.3 ISE-9 ISE-11.7 S -14 S
-2.6 I
-6.7 IS
-3.9 IS0.8 IS-4.2 IS-5.1 IS-5.7 S-2.7 I -4.2 IM-10.1 SE-9.8 IS
ab, J-SAMS JE
Location Mode
lysis Correlatio
ccel MAC
roup
EMLJ 0.862EMLJ 0.847EMLJ 0.839EMLJ 0.889EMLJ 0.933
E 0.731E 0.669EMLJ 0.782
MLJ 0.873EJ 0.789EJ 0.811EMLJ 0.705
0.8230.746
0.885
0.83
0.8110.9030.7480.7490.8690.83
ML 0.763E 0.703
0.753EM
Shape Diagram
on: Accel Data
C Mode Des
2 Station XY7 " 9 " 9 Truss XY B3 " 1 Module & 9 " 2 Station XY3 " 9 Station XZ1 " 5 Truss YZ /3 Station TO6 "
5 RSA ModYZ RSA ModuXYZ
1 " 3 RSA Modu8 Staion XY9 RSA Modu9 "
COL JEM 3 Module XZ3 US LAB N3 "
m
a
scription
Y / Module & T
Bending / Mod
Truss XZ
Y (JEM XY)
Z
/ Module TOROR X / Truss X
dule XZ / COL
ules XY / COL
ule YZ / Truss Y / EPS OP
ule YZ / Truss
YZ / MoculesZ (3rd Bendin
N2 XY / RSA X
Truss
dule XZ
R X / HRS TorsXYZ
L JEM OB T
L JEM YZ / T
XYZ
XYZ
XZ 2nd ng) / truss XYXZ / Truss XY
sion
russ
russ
Z

[A]
[C] S4-
[E] S4-
S4-1A F1 Mo
1A F1 Mode 1
-1A F1 Mode 3
Figu
de 1 vs.. S4-1A
1 vs. Analytical
3 vs. S4-1A F2
ure 6-8: Mode S
A F1 Mode 2
l Mode 17
2 Mode 2
Shape Overlay
[B
[
[F
ys, Test/Test an
B] S4-1A F1 M
[D] S4-1A F1
F] - S4-1A F2 M
nd Test/Analyti
Mode 1 vs. S4-1
Mode 1 vs. An
Mode 2 vs. An
ical [A thru F]
1A F2 Mode 1
nalytical Mode
nalytical Mode
e 44
83
[G] S4-1
[I] S
[K] S4-
1A F2 Mode 3
4-1A F1 Mode
-1A F2 Mode 6
Figu
vs. Analytical
e 8 vs. S4-1A F
6 vs. Analytica
ure 6-9: Mode S
Mode 102
F2 Mode 5
al Mode 183
Shape Overlay
[
[J] S
[L]
ys, Test/Test an
[H] S4-1A F1 M
S4-1A F1 Mod
] S4-1A F1 Mo
nd Test/Analyti
Mode 7 vs. An
de 8 vs. Analyt
ode 14 vs. Ana
ical [G thru L]
nalytical Mode
tical Mode 142
alytical Mode 3
125
2
313

7 OsaISCdmdtopthpm 7 Tcsc
[M] S4-
7.0 CONCLU
On-orbit structusystems. The manalytical modeInstrumentationSystem (SDMSCameras. The damping of thematrices. The dependent on tho avoid contro
parameters inclhe on orbit con
possible, the acmodes were cor
7.1 DISCU
The analysis sucomponents, wstages, and conconclusions are
From the mSDMS, EWsuccessful structural e
Mode shapis noted thmeasured mode shap
Mode shapfrequencie
-1A F1 Mode 1
Figur
USIONS
ural dynamic main intent of els. The main n System (IWS), Space Accphotogramme
e fundamentalSDMS MTS he free vibratio
oller-structure-iluding, frequennfiguration of ctual on-orbit rrelated and co
SSIONS
ummarized in thwhich could affntinue to ensuree mostly consis
measured and WIS and SAMS
modal identifelements, were
pe information at the test/analmode shapes h
pes be extracted
pes were extrs. This is due
17 vs.. Analytic
re 6-10: Mode
data was collethese analysesinstrumentatio
WIS), External eleration Mea
etry data of the array modes,Strut strain g
on amplitude. Tinteraction. Moncies, dampingthe ISS duringconfigurations
ompared to ana
his report is esfect the abilitye crew safety. stent with the g
analyzed data,S. These instrufication and me useful in mod
proved to be inlysis correlationhave several cd with high con
racted with hito the type of o
cal Mode 354
Shape Overlay
ected during ths was to measuon systems that
Wireless Instsurement Syst
e 1A Solar Arr which will fe
gage data was The results of todal analysis wg factors, and mg the time of ths including arralytical modes
ssential to ensuy to predict stru
The followinggeneral trends t
it was determumentation sys
model validatiodal parameter e
ndispensable inn is a prerequi
components spnfidence.
igher confidenon orbit dynam
[N]
ys, Test/Test an
he ISS Stage Uure dynamic ret were utilized trumentation S
tem (SAMS), Iray Wing was ueed into the d
used to invethat study will
was performed mode shapes. he S4-1A DTFray angles, bouto verify the ac
ure, among otheuctural life cong general concthat were obser
mined that the mstems have theon. The SAMxtractions for t
n matching tessite in any mo
panning a wide
nce than dampmic test and the
] S4-1A F2 Mo
nd Test/Analyt
ULF4 S4-1A Desponses of theduring the dataSystem (EWIInternal Measuused to increa
development ofestigate a low l feed into the u
d on all measurAn analytical F. The develoundary and intccuracy of ana
ers, accurate lonsumption, de
clusions were drved from prev
most effective e appropriate seMS acceleromethe structural f
st and analyticadel validation e area. The M
ping factors be ISS not being
ode 25 vs.. Ana
tical [M thru N
DTF using a ve ISS in order a collections inS), Structural urement Unit
ase the confidenf less restrictivfrequency mo
update of the tred acceleromemath model w
oped models interface conditi
alytical model.
oads and load setermine structdrawn from thevious port-fligh
instrumentatioensor quantity,eters, althoughfrequency rang
al modes usingeffort. The M
MAC correlatio
but with less g a static test su
alytical Mode 8
N]
ariety of instruto validate an
ncluded InternaDynamic Me
(IMU) and ISnce in the freqve solar arrayode whose frethruster controleter data to ext
was developed tncorporated, asions. The ide
spectra predictitural health, vee overall analyht analysis [12-
on systems are, quality and loh mounted on ge of 0-5 Hz.
g the MAC corrMAC is effectiv
on also requir
confidence thubject.
833
umentation nd correlate al Wireless easurement
SS EVTCG quency and y constraint equency is l algorithm tract modal to simulate s closely as ntified test
ions of ISS erify future ysis. These -15,23].
e the IWIS, ocations for
secondary
relation. It ve when the res that the
han natural

The damping factors, for the same mode, vary considerably between different on-orbit dynamic events. A general trend of the variation was difficult to assess from one event to another and from different time segments of the same response.
In general, damping factors identified from the test data are greater than the damping values of 1.0% used in the analysis. The SAMS and MAMS microgravity sensors have proven to be valuable as a structural condition monitoring system.
The SAMS and MAMS data have assisted in several anomaly identifications and resolutions. These sensors also provide good structural frequency information and good information on the response of the ISS due to the applied excitation (crew IVA, reboost, docking, etc.).
The EWIS system, with its trigger mode to monitor for unforeseen dynamic events and its ability to take up to 3 hours of
scheduled mode data has been invaluable for monitoring the vibrations seen on the outboard truss segments along with monitoring the health of the solar array rotary joints (SARJ).
8.0 REFERENCES
1. Kim, H.M., Bartkowicz, T.J., and VanHorn, D.A., "Data Recovery and Model Reduction Methods for Large Structures," Finite Elements in Analysis and Design, Vol. 16, No. 2, pp. 85-98, June 1994.
2. Kim, H.M. and Kaouk, M., Final Report: Mir Structural Dynamics Experiment, The Boeing Company, Contract No. NAS15-10000, December 1998.
3. “Station Development Test Objective (SDTO) Catalog,” SSP 50448, Rev. C, NASA-JSC, March 2007.
4. “Space Station Structural Loads Control Plan”, Boeing Report No. D684-10019-1, March 1994.
5. "Internal Wireless Instrumentation System (IWIS) Interface Definition Document," JSC 28369, Rev. D, Engineering Directorate Avionic Systems Division, NASA-JSC, October 2000.
6. “ISSA PG-1 On-Orbit Instrumentation for SDMS, Rev.1,” Boeing Memorandum A95-J012-SEM-M-9500771R1, May 1995.
7. Kim, H.M., VanHorn, D.A., and Doiron, H.H., “Free-Decay Time-Domain Modal Identification for Large Space Structures,” J. GUIDANCE, Vol. 17, No. 3, pp. 513-519, May 1994.
8. Juang, J.N., Pappa, R.S., “An Eigensystem Realization Algorithm for Modal Parameter Identification and Model Reduction,” J. GUIDANCE, Vol. 8, No. 5, pp. 620-627, 1985.
9. “Integrated Loads and Dynamics Verification Plan”, Boeing Report No. D684-10288-01, Rev. B, August 1999.
10. Targoff, W.P., “Orthogonality Check and Correction of Measured Modes,” AIAA Journal, Vol. 14, No. 2, pp. 164-167, February 1976.
11. Guyan, R.J., “Reduction of Stiffness and Mass Matrices,” AIAA Journal, Vol. 3, No. 2, pp. 380, 1965.
12. “Flight-4A Post-Flight Analysis: Modal Analysis, Model Validation and Correlation,” Boeing MSER Memorandum A92-J332-STN-M-MK-2001-0080, June 2001.
13. “ISS 5A-UF1 Post-Flight Analysis: Modal Analysis, Model Validation and Correlation,” Boeing MSER Memorandum J332-2003-0161, June 2002.
14. “ISS 7P – 5S Post-Flight Analysis: Modal Analysis, Model Validation and Correlation,” Boeing MSER Memorandum J332-2003-0163, July 2003.
15. “ISS 11A – 18P Post-Flight Analysis: Modal Analysis, Model Validation and Correlation,” Boeing MSER Memorandum ISS-HOU-MSER-SIM-050177, October 2005.
16. Wilson, B. “Mission 11A STS-113 Reboost#2 IMU Data Processing Results,” Lockheed Martin Memo 3HEC-ES-2LX-039, December 2002.
17. “DAC-8 Structural Loads Report: On-orbit Transient Loads and Loads Spectra,” Boeing Report D684-10019-02-01-02, Revision E, March 2000.

18. Wellner, N., “Request Photogrammetry of P4 (2A & 4A) Solar Array Tips during SDTO maneuver on GMT 325,” Chit ISS 004361, NASA JSC.
19. Costello, T.,“ISS Instrumentation to Validate the Integrated Math Model,” SSCN 008631 Revision B, September 2004.
20. Foster, R., “EWIS Design Overview,” MSER Presentation, June 2005.
21. McNeill, S.I. “Analysis of INC 14 SAW Photo-G data,” Boeing MSER Memo ISS-HOU-MSER-SIM-060212, December 2006.
22. Fitzpatrick, K., Grygier, M., Bartkowicz, T. “ISS Stage 12A Post-Flight Modal Analysis, Model Validation and Correlation,” IMAC-XXVII, February 2009.
23. “ISS Stage 12A.1 Post-Flight Analysis: Model Analysis, Model Validation and Correlation,” Boeing Engineering Information Document EID684-13643, September 2009.