international tobacco control policy evaluation survey ... · investigator on the itc project, ......
TRANSCRIPT

International Tobacco Control PolicyEvaluation Survey
(ITC 4-Country Survey)
Wave 1 Technical Report
July 2004

2
Acknowledgments
This Wave 1 Technical Report was prepared from documents and other material thatthe ITCPES Research Team has created since the initiation of the ITC Project in July2002. The compilation and condensation of these documents and preparation of thematerial that accompanies those documents was conducted by David Hammond, Co-Investigator on the ITC Project, Geoffrey T. Fong, Chief Principal Investigator, MaryThompson, Co-Investigator and Director of the Data Management and Analysis Team,and Pete Driezen, Data Analyst. We thank the Co-Investigators from the participatingsites across the four countries and the two ITC survey firms, Environics ResearchGroup in Toronto and Roy Morgan Research in Melbourne, for their assistance.
Wave 1 of the ITCPES and other extension projects associated with the ITC Project(e.g., an in vivo puff topography study we conducted in 2003 in support of the ITCSurvey) have been generously supported by a number of organizations. We thank theseorganizations for their support:
Canadian Institutes for Health Research (Canada)Robert Wood Johnson Foundation (U.S.)National Health and Medical Research Council (Australia)Australia Commonwealth Department of Health and Ageing (Australia)Cancer Research U.K. (U.K.)Canadian Tobacco Control Research Initiative (Canada)Health Canada (Canada)American Cancer Society (U.S.)Centre for Behavioural Research and Program Evaluation, National Cancer
Institute of Canada/Canadian Cancer Society (Canada)
Any questions or correspondence regarding this Technical Report should be sent to:
Geoffrey T. Fong, Ph.D.Department of PsychologyUniversity of Waterloo200 University Avenue WestWaterloo, Ontario N2L 3G1 CanadaPhone: 519-888-4567, x3597Mobile: 519-503-4820Fax: 519-746-8631Email: [email protected]

3
Table of Contents
Acknowledgments....................................................................................... 2ITCPES Research Team.............................................................................. 61.0 Introduction .......................................................................................... 72.0 Conceptual Framework for Understanding the Effects of Tobacco
Control Policies.................................................................................. 82.1 Tobacco Control Policies to Be Evaluated and Conceptual Model.......... 8
Figure 1. Conceptual Model for Effects of Tobacco Control Policies .... 8
3.0 Sampling Protocol.............................................................................. 113.1 Overview...................................................................................................... 113.2 Sampling Frame: Canada, United States, and United Kingdom............. 113.3 Sampling Frame: Australia ........................................................................ 123.4 Sampling Design ........................................................................................ 123.5 Selecting Respondents From Within Households................................... 133.6 Statistical Power......................................................................................... 13
3.6.1 Effects of a Policy Change on Proximal Variables........................ 133.6.2 Effects of a Policy Change on Distal Psychosocial Variables ..... 143.6.3 Effects of a Policy Change on Distal Behaviours.......................... 14
4.0 Study Protocol.................................................................................... 154.1 Recruitment Into the Cohort ...................................................................... 154.2 Compensation............................................................................................. 154.3 Calling Protocol .......................................................................................... 164.4 Cohort Replenishment ............................................................................... 16
5.0 Survey Measures................................................................................ 175.1 Survey Questionnaire Development ......................................................... 175.2 Content of the ITCPES Survey .................................................................. 175.3 Pilot Testing ................................................................................................ 18
6.0 Quality Control and Uniformity......................................................... 196.1 Survey Firms............................................................................................... 196.2 Interviewer Training.................................................................................... 195.3 Supervision and Call Monitoring............................................................... 19
7.0 Policy Monitoring ............................................................................... 218.0 Wave 1 Data—Summary of Key Statistics....................................... 22
8.1 Recruitment Call Outcomes....................................................................... 228.2 Recruitment Survey Response Rates....................................................... 22
Table 1. Recruitment Survey Statistics................................................... 238.3 Representativeness.................................................................................... 248.4 Attrition: Main Survey Follow-Up Rates ................................................... 25
Table 2. Main Survey Statistics................................................................ 26

4
8.5 Survey Weights........................................................................................... 268.5.1 Recruitment Weights ....................................................................... 268.5.2 Main Survey Weights ....................................................................... 278.5.3 Descriptive Uses of the Weights..................................................... 278.5.4 Standard Errors for Proportions or Means .................................... 288.5.5 Analytical Uses of the Weights....................................................... 298.5.6 When Should Weights Be Used?.................................................... 30
Appendix A. Sampling Specifications.................................................... 31Appendix B. Recruitment Contact Protocol .......................................... 34Appendix C. Wave 1 Disposition Codes By Country............................ 36Appendix D. Recruitment Survey Outcomes ........................................ 40
Canada ............................................................................................................... 40United States...................................................................................................... 41United Kingdom................................................................................................. 42Australia ............................................................................................................. 43
Appendix E. Intermediate Outcome Frequencies By Country ............ 44Appendix F. Other Computations Involving Disposition Codes......... 45
Computing Estimated Eligibility of Cases of “Unknown Eligibility”............. 45Estimating Eligibility of Non-Contact Cases................................................... 45
Appendix G. Benchmark Surveys .......................................................... 46Canada ............................................................................................................... 46
Canadian Tobacco Use Monitoring Survey (CTUMS), 2002 ................... 46Canadian Community Health Survey (CCHS), 2000–01.......................... 46
Survey on Smoking Behaviour (SSB), 1994–95.............................................. 47United States...................................................................................................... 47
National Health Interview Survey (NHIS), 2001........................................ 47Current Population Survey (CPS), 2002................................................... 47Behavioural Risk Factor Surveillance Systems (BRFSS), 1999 ............ 48
United Kingdom................................................................................................. 48Health Survey for England (HSE), 2001.................................................... 48General Household Survey (GHS), 2001 ................................................. 48
Australia ............................................................................................................. 49National Drug Strategy Household Survey (NDSHS), 2001.................... 49National Tobacco Survey Evaluation Campaign (NTSEC), 2000............ 49National Health Survey, 2001 .................................................................... 49
Appendix H. Demographic Profile of Daily Smokers 18 years andOlder: ITCPES (Unweighted) and National Benchmarks............. 50

5
Appendix I. Key Indicators of Smoking: ITCPES and NationalBenchmarks ..................................................................................... 51
Canada ............................................................................................................... 51United States...................................................................................................... 52United Kingdom................................................................................................. 52Australia ............................................................................................................. 53
Appendix J. Main Survey Follow-up Rates............................................ 54Canada ............................................................................................................... 55United States...................................................................................................... 56United Kingdom................................................................................................. 57Australia ............................................................................................................. 58
References ................................................................................................. 59

6
ITCPES Research Team
CanadaGeoffrey T. Fong, Ph.D. (Chief Principal Investigator), University of WaterlooK. Stephen Brown, Ph.D. University of WaterlooSharon Campbell, Ph.D. Centre for Behavioural Research and Program EvaluationDavid Hammond, M.Sc. University of WaterlooPaul W. McDonald, Ph.D. University of WaterlooMary Thompson, Ph.D. University of WaterlooMark P. Zanna, Ph.D. University of Waterloo
United StatesK. Michael Cummings, Ph.D. (Principal Investigator), Roswell Park Cancer InstituteGary Giovino, Ph.D. Roswell Park Cancer InstituteAndrew Hyland, Ph.D. Roswell Park Cancer InstituteFrank J. Chaloupka, Ph.D. University of Illinois at ChicagoHana Ross, Ph.D. University of Illinois at ChicagoFritz L. Laux, Ph.D. University of Illinois at ChicagoNancy J. Kaufman, M.S. Strategic Vision Group
United KingdomGerard Hastings, Ph.D. (Principal Investigator), University of StrathclydeSusan Anderson, M.Sc. University of StrathclydeAnn McNeill, Ph.D. University College London
AustraliaRon Borland, Ph.D. (Principal Investigator), Victoria Centre for Tobacco ControlMohammad Siahpush, Ph.D. Victoria Centre for Tobacco ControlMelanie Wakefield, Ph.D. Victoria Centre for Tobacco Control
Project SupportTara Elton Marshall, University of WaterlooTaryn Sendzik, University of WaterlooSonya Dal Cin, University of WaterlooCarol Murray, Health Behaviour Research
Group, Univ. of WaterlooCarol West-Seebeck, HBR
Data ManagementRuth Loewen, HBR
Data AnalysisPete Driezen, University of WaterlooAnne Marie Mackintosh, University of
StrathclydeHua Yong, VCTC
Survey FieldworkEnvironics Research Group, Toronto
(Canada & U.S.)—Donna DaskoRoy Morgan Research, Melbourne
(Australia & U.K.)—Bruce Packard

7
1.0 Introduction
In the past decade, significant advances have been made in public health policiesdesigned to reduce the health, economic, and societal costs of tobacco use throughoutthe world. Most notably, the Framework Convention on Tobacco Control (FCTC)—thefirst-ever international public health treaty—was adopted in May 2003 by all 192member states of the World Health Organization, representing 95% of the world’spopulation. The FCTC will require signatories to implement a range of tobacco controlpolicies over the coming years. In this context, it is critical to monitor and evaluate theimplementation of these key health policies.
The International Tobacco Control Policy Evaluation Survey (ITCPES)1 is a prospectivecohort study designed to evaluate the psychosocial and behavioural impact of keynational-level tobacco control policies enacted over a period of four years (2002-2006),in at least one of four countries: the United States, Canada, the United Kingdom, andAustralia. Over 2,000 adult smokers were recruited by probability sampling methods ineach of the four countries. The first two waves were conducted 8 months apart, butbeginning with Wave 3, the survey is being conducted every 12 months. All aspects ofthe study protocol and survey measures are standardized across the four countries.
This report provides a methodological background and key statistical indicators forWave 1 of the ITCPES Study. Wave 1 was conducted between October 28 andDecember 23, 2002 in all four countries. This report provides information on thesampling methods, survey protocol and administration, as well as survey rates,measures of representativeness, and guidelines for data analysis for Wave 1 data.
* The ITCPES is also known as the ITC-4 Country Survey (ITC-4), to distinguish it from
other national-level tobacco control policy evaluation surveys being conducted by theITC Project Research Team (e.g., the ITC-Ireland/UK Survey and the ITC-SE AsiaSurvey).
8
2.0 Conceptual Framework for Understanding theEffects of Tobacco Control Policies
2.1 Tobacco Control Policies to Be Evaluated and Conceptual Model
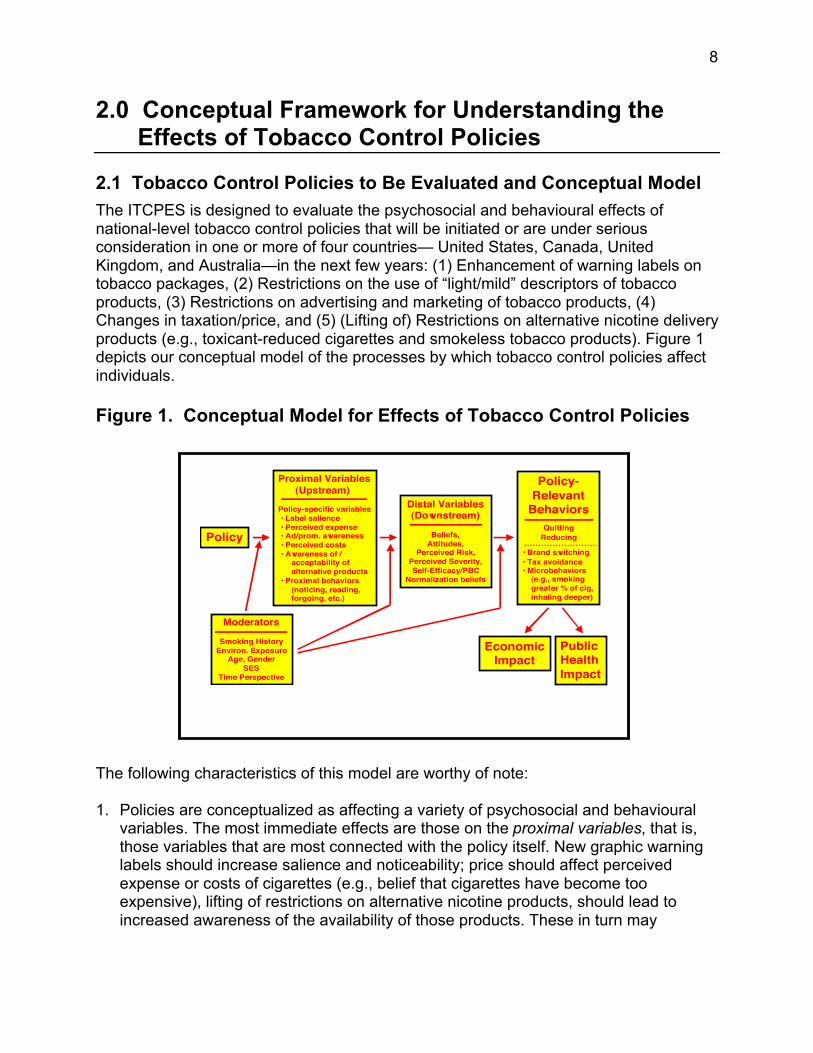
The ITCPES is designed to evaluate the psychosocial and behavioural effects ofnational-level tobacco control policies that will be initiated or are under seriousconsideration in one or more of four countries— United States, Canada, UnitedKingdom, and Australia—in the next few years: (1) Enhancement of warning labels ontobacco packages, (2) Restrictions on the use of “light/mild” descriptors of tobaccoproducts, (3) Restrictions on advertising and marketing of tobacco products, (4)Changes in taxation/price, and (5) (Lifting of) Restrictions on alternative nicotine deliveryproducts (e.g., toxicant-reduced cigarettes and smokeless tobacco products). Figure 1depicts our conceptual model of the processes by which tobacco control policies affectindividuals.
Figure 1. Conceptual Model for Effects of Tobacco Control Policies
The following characteristics of this model are worthy of note:
1. Policies are conceptualized as affecting a variety of psychosocial and behaviouralvariables. The most immediate effects are those on the proximal variables, that is,those variables that are most connected with the policy itself. New graphic warninglabels should increase salience and noticeability; price should affect perceivedexpense or costs of cigarettes (e.g., belief that cigarettes have become tooexpensive), lifting of restrictions on alternative nicotine products, should lead toincreased awareness of the availability of those products. These in turn may
Policy
Proximal Variables (Upstream)
Policy-specific variables • Label salience • Perceived expense • Ad/prom. awareness • Perceived costs • Awareness of / acceptability of alternative products • Proximal behaviors (noticing, reading, forgoing, etc.)
Distal Variables(Downstream)
Beliefs,Attitudes,
Perceived Risk,Perceived Severity,Self-Efficacy/PBC
Normalization beliefs
Moderators
Smoking HistoryEnviron. Exposure
Age, GenderSES
Time Perspective
Policy-Relevant
BehaviorsQuitting
Reducing
• Brand switching• Tax avoidance• Microbehaviors (e.g., smoking greater % of cig, inhaling deeper)
PublicHealthImpact
EconomicImpact

9
increase the likelihood of discrete behaviours such as smokers hesitating, or evenforgoing or stubbing out cigarettes.
2. Distal variables are those that are more distant from the policy, but are those thathave been demonstrated to predict smoking behaviour and changes in smokingbehaviour (e.g., quitting). Among these are variables from well-known psychosocialmodels of health behaviour, including the Theory of Planned Behavior,1 SocialCognitive Theory,2 the Health Belief Model,3 and Protection Motivation Theory.4 Webelieve that policies will affect these distal variables indirectly, through their prioreffects on the proximal variables.
3. One important aim of our project is to understand the psychosocial processes thatexplain how and why a given policy may lead to changes in smoking behaviour. Ourlongitudinal design allows us to explicitly test the causal chain of effects that isdepicted in the model; a repeat cross-sectional design would not.
4. Our conceptual model is a general framework for thinking about policies and theireffects on a broad array of important psychosocial and behavioural variables, andwe understand that there will be important distinctions across different policies in notonly whether those policies are effective, but also how they achieve their effects. Weare explicitly testing those commonalities and differences among policies in thisregard.
5. The behaviours that we are measuring include those that confer benefits (e.g.,quitting) and also important compensatory behaviours that the smoker may engagein that, although responsive to the policy, may not lead to the economic and publichealth benefits that are ultimately the goal of such policies. For example, in responseto price increases, smokers may switch to discount brands, which would confer nopublic health benefit. Our evaluation efforts are thus attempting to provide a morecomplete picture of the effects that may result from the implementation of a tobaccocontrol policy.
6. The general conceptual model is a causal chain model, and as such, suggests thatthe proximal variables play a critical mediating role because they reside between thepolicy and the outcome variables that are so important in public health, for example,quitting behaviour. We assume that policies vary in the psychosocial “routes” thatthey take to affect behaviour. For example, if switching to graphic warning labelseventuates in increased quitting, we hypothesize that this occurs by first increasingtheir salience, noticeability, and the likelihood that smokers will think about themessages that appear. Thus, the first step in the causal chain is from labels toincreases in these label salience variables, that is, in the proximal variablesassociated with labels. We should not expect the same magnitude of change to takeplace in a proximal variable associated with some other policy (if that policy is notalso being affected at the same time); thus, a comparison of changes in proximalvariables that should change (those associated with the policy that has changed)with changes in proximal variables that should not change (those associated with

10
some other policy that has not changed) is the key comparison. This pattern ofresults would provide further indication that changes in downstream variables areindeed associated with the policy that has changed. This strategy is an application ofthe principles of construct validity (specifically, of discriminant validity) that arecentral in making causal inferences from data. It should be noted, too, that thepresence of control proximal variables is the analog to the presence of controlcountries in the ITCPES design. In this way, then, the ITCPES provides bothbetween-country and within-country controls.
The second step is that those changes in the proximal variable should be associatedwith downstream changes in the distal variables (e.g., quit intentions) and ultimatelyto quit attempts. Thus, rather than conceptualizing policy as affecting proximalvariables and also affecting behaviour, we conceptualize policy as affecting proximalvariables, which in turn, affect behaviour. Or put in a different way: policy affectsbehaviour because it causes changes in psychosocial variables that are specific tothat policy. The design of our study then is guided by the possibility of disentanglingthe web of alternative explanations and competing forces through the carefulselection of specific mediators and applying the principles of causal inferencethrough a combination of convergent and discriminant validity.
A more complete description and elaboration of the mediational models that underliethe ITC Project is available upon request.

11
3.0 Sampling Protocol
3.1 Overview
ITCPES participants at Wave 1 are current adult smokers (respondents 18 years orolder who have smoked more than 100 cigarettes in their life and who have smoked atleast once in the past 30 days). Respondents were selected at random from thepopulation of each country using random-digit dialling (RDD) methods within stratadefined by geographic region and community size. In three of the countries—Canada,the U.S., and the U.K.—samples were generated by Survey Sampling International(SSI) using their Random B methodology. In Australia, no comparable sample wasavailable; as a result, a probability sampling frame was created using a similar designas for the other three countries (described below).
3.2 Sampling Frame: Canada, United States, and United Kingdom*
SSI begins with a database of all directory-listed households in the country. Using areacode and exchange data, this file of directory-listed telephone numbers is subjected toan extensive cleaning and validation process to ensure that all exchanges are currentlyvalid, assigned to the correct area code, and falling within an appropriate set ofzip/postal codes. The SSI samples were generated using a database of “workingblocks.” A block (also known as a 100-bank or a bank) is a set of 100 contiguousnumbers identified by the first two digits of the last four digits of a telephone number.For example, in the telephone number 255-4200, 42 is the block. A block is consideredto be working if one or more listed telephone numbers are found in that block.
The SSI samples were generated using random sampling procedures in the U.K. andstratified sampling procedures in the U.S. and Canada. Stratified sampling divides thepopulation of sampling units into subpopulations called strata. A separate sample isthen selected from the sampling units in each stratum. Some details on the proceduresfor generating the samples for each country are provided in Appendix A.
Random B methodology is an SSI term denoting samples of random numbersdistributed across all eligible blocks in proportion to their density of listed telephonehouseholds. All blocks within the specified geographical stratum (e.g., county) areorganized in ascending order by area code, exchange, and block number. Once thequota has been allocated to all regions in the frame, a sampling interval is calculated bysumming the number of listed residential numbers in each eligible block within thecounty and dividing that sum by the number of sampling points assigned to the county.From a random start between zero and the sampling interval, blocks are systematicallyselected in proportion to their density of listed households. Once a block has beenselected, a two-digit number is systematically selected in the range 00-99 and isappended to the exchange and block to form a 10-digit telephone number.
* This overview of Random B methodology has been modified from a description
provided by SSI.

12
3.3 Sampling Frame: Australia
Due to the lack of a commercially available RDD sampling frame in Australia, ourITCPES team worked together with Roy Morgan Research, our survey firm in Australia,to construct a sampling frame from probability sampling methods that we believe is atleast as high in quality as the samples obtained in the other three countries. Briefly, asampling frame of listed residential numbers was generated from one of the ElectronicWhite Pages (EWP) sources. A file of all EWP telephone numbers was then createdand sorted into numerical order. A file of all blocks of n1 numbers containing a minimumof n2 EWP numbers was then created. From this, an equal inclusion probability sampleof appropriate number of blocks was selected. This sample was sufficiently large toavoid the need to repeat the procedure a second time, taking into account the need toreplenish the sample at subsequent waves.
A file of potential numbers for sampled blocks was generated, after which ElectronicYellow Pages (EYP) and non-connected numbers were screened out and all non-eliminated numbers were put in a long list. Roy Morgan Research then conductedautomated pre-screening of large numbers from the stock of generated non-EWP/EYPnumbers beforehand by ringing each number automatically for a short time during theday. Each number in the file was identified as: 1) an EWP number that is not also anEYP (potentially effective) number, 2) an EYP number, 3) a non-connected number, or4) other (potentially effective). Non-connected numbers were identified, reported, anddiscarded by the CATI auto-dial equipment. These eliminated numbers consisted ofunlisted business numbers, fax numbers, dedicated Internet lines, and unlisted secondnumbers of listed-number households in addition to the primary unlisted numbers weincluded in our stock file of numbers.
The stock of telephone numbers to be called was selected from a large equal probabilitysample of the resulting list of numbers. Finally, the order of stock was randomized toproduce numbers to be called within strata determined by state x (metropolitan vs. non-metropolitan)
3.4 Sampling Design
Within each country, the sample was stratified geographically. That is, quotas wereassigned to the numbers of respondents in each of several regions. The numbers in thesampling frame, randomly ordered, were called until these quotas were met. In Canada,the U.K. and the U.S., these quotas were proportional to current estimates of the size ofthe population 18 and over in the region. In Australia, the quotas were proportional toestimated numbers of telephone households. Some additional details of the samplingdesign are presented in Appendix A.

13
3.5 Selecting Respondents From Within Households
Only one respondent was selected from each household. The Next Birthday Method5
was used to select respondents in households with multiple smokers. No substitutionwithin household was permitted, except where the selected respondent was known tobe unavailable for the entire fieldwork procedure, in which case the person in thehousehold whose birthday is next became the respondent.
3.6 Statistical Power
Power calculations were computed for three representative kinds of effects that spanthe length of our conceptual model: (1) the effects of a policy change on proximalvariables, that is, variables such as label salience; (2) the effects of a policy change ondistal variables (that is, those psychosocial variables that have been demonstrated inpast research to be predictors and correlates of smoking behaviour (e.g., intentions toquit); and (3) the effects of a policy change on smoking behaviour itself (e.g., quitattempts, successful quitting).
In our power calculations (at a = .05, 2-tailed), we assumed: (1) simple randomsampling within countries (because ITCPES employs stratified random sampling in twoof the four countries—Canada and the U.S.—the assumption of simple randomsampling yields power estimates that may be conservative), (2) uniform proportionsover the other three countries that have not experienced a policy change against whichthe country that has experienced a policy change is being compared, and (3) thecharacteristics of the attrition and replacement process at each survey wave isindependent of behaviour. In addition, none of these power calculations considers thereduction in error variance due to the addition of appropriate covariates, and this alsomakes the computed power estimates more conservative. Sample size calculations forcomparison of more general time-related contrasts between groups are provided byHedeker et al.6 Please note that our original conception of the ITCPES was for surveywaves to take place every 6 months. The time span between Wave 1 and Wave 2 wasabout 8 months, and Wave 3 and subsequent waves are every 12 months. Thus, someof the power calculations based on 6 months are likely to be conservative.
3.6.1 Effects of a Policy Change on Proximal Variables
In the North American Student Smoking Survey (NASSS7), a longitudinal survey of atotal of 12,000 high school students in Canada and the U.S., among smokers, label-salience variables rose dramatically in Canada compared to the U.S. over the change inlabels: a difference between the two countries of 9% for noticing the warning labels(from a Canadian pre-label level of 85% and a U.S. pre-label level of 70%), 28% forreports of talking to friends about the labels (from a pre-label level of 30% for Canadaand 16% for U.S.), and 15% for perceived effectiveness of the labels in pointing outhealth problems (from a pre-label level of 69% for Canada and 62% for U.S.). Thoseeffect sizes, if obtained in our present study of 1,500 cohort members (75% retention ofour target cohort size of 2,000) in the country with the change in the labels (U.K.

14
between Wave 1 and Wave 2) and the 1,500 respondents in each of the other 3countries without a change in labels would yield statistical power over 99%.
3.6.2 Effects of a Policy Change on Distal Psychosocial Variables
In the NASSS, quitting intentions increased among Canadian smokers, relative to theU.S. smokers—net change = 5.1% (from a pre-label level of 86.6% for Canada and85.1% for U.S.). If this effect size were obtained here, assuming a within-individualcorrelation between successive survey waves of .60, the statistical power would be99%. We will have 80% power to detect a 2.9% increase in the policy country, relativeto the controls, 85% power for a 3.1% increase, and 90% power for a 3.3% increase.
3.6.3 Effects of a Policy Change on Distal Behaviours
Our conceptual model (presented in Figure 1) posits that the effects of policy diminishas one moves further downstream. In the first post-label survey wave of the NASSS,Canadian and American smoking youth did not differ in quit attempts. In the Borlandevaluation of the 1996 enhancement of warning labels in Australia among adults,8 therewas no pre-post difference in quit attempts.
With regard to quit attempts, approximately 44% of smokers attempt to quit in any givenyear.9 Assuming that our survey waves are every 6 months, we assume that half of theyearly rate will attempt to quit within any two survey waves (we assume a correlation of.2 between any two consecutive waves). We will have 80% power to detect a 4.4%increase in quit attempts in the policy country, relative to the three control countries,85% power to detect a 4.7% net increase, and 90% power to detect a 5.1% netincrease. Because our current schedule for survey waves is greater than 6 months,these power calculations are conservative.
With regard to successful quitting, an estimated 3-5% of smokers successfully quit inany one year for at least one year or longer.10 Assuming that the quit rate is 4% for oneyear, and thus 2% for a 6M span between survey waves, we will have 80% power todetect a 1.9% increase in successful quitting in the policy country, relative to the threecontrol countries, and 85% power to detect a 2.1% net increase. Again, because ourcurrent schedule for survey waves is greater than 6 months, these power calculationsare conservative.

15
4.0 Study Protocol
4.1 Recruitment Into the Cohort
At recruitment into the study at Wave 1, all respondents were contacted twice. At thefirst contact, the Recruitment Survey was conducted to screen for eligibility andascertain consent. This Recruitment Survey lasted an average of 9-13 minutes. Duringthe recruitment, qualifying respondents (those at least 18 years old who had smoked atleast 100 cigarettes and were currently smoking at least once a month) were asked toparticipate in a 35-minute survey on smoking being conducted by an international groupof universities and research institutions in four countries. (This 35-minute survey, whichwas typically conducted one week after the recruitment call, is known as the MainSurvey. Respondents were told they would receive a small payment to thank them fortheir time and were assured that their responses would be kept strictly confidential.Where necessary, additional information was provided on the study, the survey firm,and the research institutions. Interviewers arranged with respondents who agreed toparticipate in the survey to set up a time for the administration of the Main Survey.Respondents were also provided with contact information in case they had concernsabout ethics or privacy. Finally, respondents were told that they would be contacted inapproximately 6 months time to complete a second 35-minute survey, for which theywould receive a second payment. A complete description of the Recruitment and MainSurveys is provided in Section 5.0.
4.2 Compensation
A compensation letter, containing the compensation, was mailed immediately after therecruitment call, so that it would arrive before participants were called back to completethe Main Survey, which lasted an average of 35-40 minutes. The compensation letteralso included information about the ITC research team and provided contact informationfor two individuals: (1) the Principal Investigator in the participant’s country, and (2) theperson in the participant’s country to whom concerns about ethics/privacy should beaddressed.
The amount of compensation was roughly standardized across each of the fourcountries: $10 U.S., $15 CDN, $15 AUS, or a £7 voucher for Boots shops in the U.K.Over 90% of respondents in each of the four countries had received this compensationone week later, by the time of the Main Survey call. A second cheque or voucher wasmailed to respondents who had yet to receive the incentive at this time. Respondentswho had not received compensation by the time of the Main Survey call were given theoption of completing the survey at that time or at a later date, after the incentive hadarrived. This kind of pre-survey incentive (that is, compensating respondents beforethey have completed the survey) has been shown in randomized experiments toincrease response rates by over 10%.11,12,13

16
4.3 Calling Protocol
Several steps were undertaken to maximize response rates. First, to avoid any call-scheduling bias, recruitment calls were conducted at numerous times of the day (e.g.,morning, afternoon, and evening) and different days of the week (e.g., weekday vs.weekend). Second, once respondents had completed the Recruitment Survey, everyeffort was made to follow them up for the Main Survey. In the event that appointmentsscheduled for the Main Survey were not kept, follow-up calls were made later in thesame day, at similar times of the following day, and then on different days at differenttimes. Up to 25 call attempts were made to follow-up respondents for the Main Surveyin accordance with this schedule. In addition, respondents could complete the MainSurvey during 2 or more calls if necessary. Respondents indicating a desire to terminatethe Main Survey were reminded of the importance of their participation and an offer wasmade to complete the survey at another time. Appendix B provides a detaileddescription of the calling protocol used in all countries.
4.4 Cohort Replenishment
Once a respondent is included in the cohort at Recruitment, every effort is made to trackand recontact him/her at subsequent waves (see Appendix B). At subsequent waves,however, some proportion of the 2,000 respondents in the initial cohort will fail tocomplete the survey. This will be due to any of a number of factors such as: (a) failureto contact by phone, (b) moved away and no forwarding number, (c) refusal, (d) missedsurvey call appointment and subsequent inability to contact.
In order to ensure that the number of completed surveys at each wave is at least 2,000in each country, respondents lost to attrition are replaced. The number of new recruitsnecessary to replenish lost panel members is estimated after every week of therecontact phases of Waves 2 and beyond. The rate of attrition is used to guide thenumber of potential recontact respondents that will be recruited starting at Week 3 ofthe survey period. Replenishment needs are reviewed and updated every week until theend of the survey period. Sampling procedures and calling protocol for replenishment atsubsequent waves are identical to those at Wave 1 Recruitment. Finally, data fromcontinuing and replenished respondents are conducted to assess the influence of “time-in-sample” on the outcome variables. Panel attrition at each wave is being modeled asdepending on age, gender, education, and health status from previous wave(s). This
enables the construction of attrition weights14,15 to adjust for respondents who havedropped out.

17
5.0 Survey Measures
All Wave 1 survey measures are available upon request. They are also availablethrough the ITCPES website:
http://www.itcproject.org
This includes all “raw” measures, as well as a set of key variables (e.g., demographicvariables, daily consumption, and measures of dependence) that have been derivedfrom the raw data and standardized for data analysis.
5.1 Survey Questionnaire Development
The ITCPES Survey was developed by an transdisciplinary team of tobacco controlexperts across the four countries, with backgrounds in psychology, public health,epidemiology, economics, community medicine, marketing, sociology, andstatistics/biostatistics. The survey instrument was developed through a series of morethan 30 teleconferences and extensive written communications among members of theITCPES research team, including senior representatives from Environics ResearchGroup and Roy Morgan Research. First, critical domains and policy areas wereidentified. Next, international benchmarks and standardized measures were identifiedfrom which ITCPES measures were drawn and revised, where necessary.Representatives from the survey firms contributed to this process and helped to refinethe structure and content of the survey, taking into account interviewer demands andsurvey administration issues.
5.2 Content of the ITCPES Survey
The ITCPES Survey is standardized across the four countries: respondents in eachcountry are asked the same questions, except for minor variations in wording to accountfor national differences in colloquial speech (e.g., “at the cinema” in the U.K. vs. “at themovies” in the other three countries) and slight differences on a few questions, omittingresponse options that do not pertain in some countries (e.g., elimination of “militarycommissaries” in the U.K. and Australia as a source of cigarettes).
The ITCPES Survey includes questions from the following domains:
1. Demographic variables, including age, gender, income, education
2. Smoking behaviour, including measures of dependency, quit history, andalternative tobacco use
3. Warning Labels, including label salience and perceived effectiveness
4. Advertising and Promotion, including self-reported exposure to both messagespromoting tobacco products and messages about the dangers of smoking

18
5. Light / Mild Brand Descriptors, including beliefs about the relative risk of suchbrands
6. Taxation and Purchase Behaviour, including brand information, pricing, andpurchasing sources
7. Stop-Smoking Medications and Alternative Nicotine Products, including PotentialReduced-Exposure Products (PREPs)
8. Cessation and Quitting Behaviour
9. Key Psychosocial Measures, including intentions to quit, perceived risk,denormalization beliefs, self-exempting beliefs, knowledge of health risks, andother potential moderators (e.g., time perspective and impulsivity).
The survey was developed in English and subsequently translated to French foradministration in francophone regions of Canada (i.e., Quebec and New Brunswick).The Environics call centre in Montreal administered survey calls to francophone regionsin Canada and upon request from respondents in other parts of Canada. All interviewsin the three other countries were administered in English.
Overall, the Recruitment Survey took an average of 9-13 minutes to complete and theMain Survey took an average of 35–40 minutes to complete (see Tables 1 and 2 foraverage completion times by country).
5.3 Pilot Testing
A pilot survey was conducted in September 2002 to test the study protocol and surveyinstrument. Approximately 125 participants were recruited in each of the four countriesand completed both the Recruitment Survey and the Main Survey. Pilot participants didnot participate in the panel study. This Pilot Survey went very smoothly, requiring onlyminor changes to be made in the protocol and in the survey instrument itself.

19
6.0 Quality Control and Uniformity
6.1 Survey Firms
The survey was conducted in Canada and the U.S. by Environics Research Group andin the U.K. and Australia by Roy Morgan Research. Both are prominent survey firmswho have extensive experience in random-digit-dialled (RDD) phone surveys of thiskind, including international health surveys and tobacco-specific research. Seniorrepresentatives from each firm participated in the survey and protocol design for thesurvey in order to ensure standardization across both firms and to consider technicalimplications.
The survey administration and calling protocol was standardized across both surveyfirms. All calling specifications, final questionnaires, and daily reports were reviewedand monitored by the ITCPES Research Team at the University of Waterloo to maintainconsistency across survey firms and ITCPES countries (see Quality Assurance, below).In Canada and the U.S., interviews were conducted with Dash Computer AssistedTelephone Interviewing (CATI) software (Version 2.9). Interviews in Australia and theU.K. were conducted using Bellview CATI software (Version 6.11).
6.2 Interviewer Training
All interviewers were experienced calling staff who had been trained in the use of theCATI software at each survey firm. All interviewers also received additional trainingspecific to the ITCPES Project. This training included extensive interviewer briefing onthe questionnaire itself, with any questions or necessary clarifications being addressed.Interviewer training emphasized issues such as correct coding of callbackappointments, proper recording of addresses in each country as well as the importanceof maximizing the likelihood that the Wave 1 respondents would continue to participatein the ITCPES Project in the future. In addition, all interviewers conducted supervised“practice” calls prior to the commencing the survey. Interviewer training was conductedby senior research staff and supervised by Principal Investigators at each of the twofirms (Geoffrey Fong attended the Environics interviewer training and Ron Borlandattended the Roy Morgan interviewer training).
5.3 Supervision and Call Monitoring
Supervisors at each of the call centres monitored interviewers at all times. Supervisorswere able to listen in on the interview and simultaneously patch into the interviewer’sterminal, watching for any errors in coding of the responses. Any errors that weredetected were then revised upon the completion of the interview. Supervisors alsoensured that all probes, clarifications, etc., were executed in the proper manner, withany errors brought immediately to the interviewer’s attention. Approximately 10-15% ofinterviews were monitored in this fashion, in accordance with Canadian Association ofMarketing Research Organization (CAMRO) guidelines. In addition, during Wave 1recruitment, all contact information provided by the respondent was thoroughly double-

20
checked by a supervisor, for every recruit. In any cases of incomplete addresses,telephone numbers, etc., the respondent was immediately called back by the supervisorso that the correct information could be obtained. Address-checking software was alsoused to confirm the accuracy of this information, with Internet checks (electronic whitepages) conducted on unobtainable /non-contact numbers.
The progress and performance of the survey firms was monitored by the University ofWaterloo Data Management and Analysis Team and the Chief Principal Investigatorthrough regular contact with senior representatives at each firm. To this end, the surveyfirms provided daily status reports as well as weekly summaries. Daily reports includedupdates on the number of respondents recruited by sex, age ethnicity, geography,patterns of non-response, and survey length. The survey firms also reported data on thecompensation mailing process, including the proportion of respondents called for thesurvey stage that have received their compensation by that time (one week later). Aspart of the weekly summaries, field operations managers also compiled difficulties andinformed the research team on a daily basis, as necessary.
Patterns of nonresponse are analyzed at the conclusion of each wave, with changesimplemented to maximize quality control (Analysis section).16

21
7.0 Policy Monitoring
Tobacco control policies at the national level were assessed in each of the fourcountries prior to administering the Wave 1 survey. Regular contact has beenestablished with key tobacco control informants in each country (both governmental—atboth federal and state/provincial levels, and non-governmental), in order to track avariety of relevant features of the tobacco control landscape, such as per capita publicspending on tobacco control and state/provincial and federal tobacco controlcampaigns. These input variables act as covariates in analyses that are designed toestimate policy effects, using methodology as described by Stephens et al. (2001).17
A policy monitoring team has been established in each country to assess key policiesthat occur at the sub-national state or provincial level. The ITCPES monitoring teamsconduct a policy review at each subsequent wave to assess any changes in relevanttobacco control policies in any of the four countries. The monitoring tool and policyreviews are available upon request.
Finally, respondents are also used as key informants for monitoring theenvironment—both policy and industry—that may exert an influence on them. Thesurvey includes questions that ask respondents to report on price changes (e.g.,discounts, coupons, and other pricing strategies), tobacco advertising and promotions(some items are mentioned in the section on Advertising/Promotion), and both reportsof the presence or absence of clean air policies. The simultaneous collection ofinformation about the policy environment and about tobacco industry initiatives withrespondent reports on such activities provides a rich set of data for assessing thesensitivity of respondents to the tobacco control environment—both for and against.This has provided possibilities for validity studies on monitoring.

22
8.0 Wave 1 Data—Summary of Key Statistics
8.1 Recruitment Call Outcomes
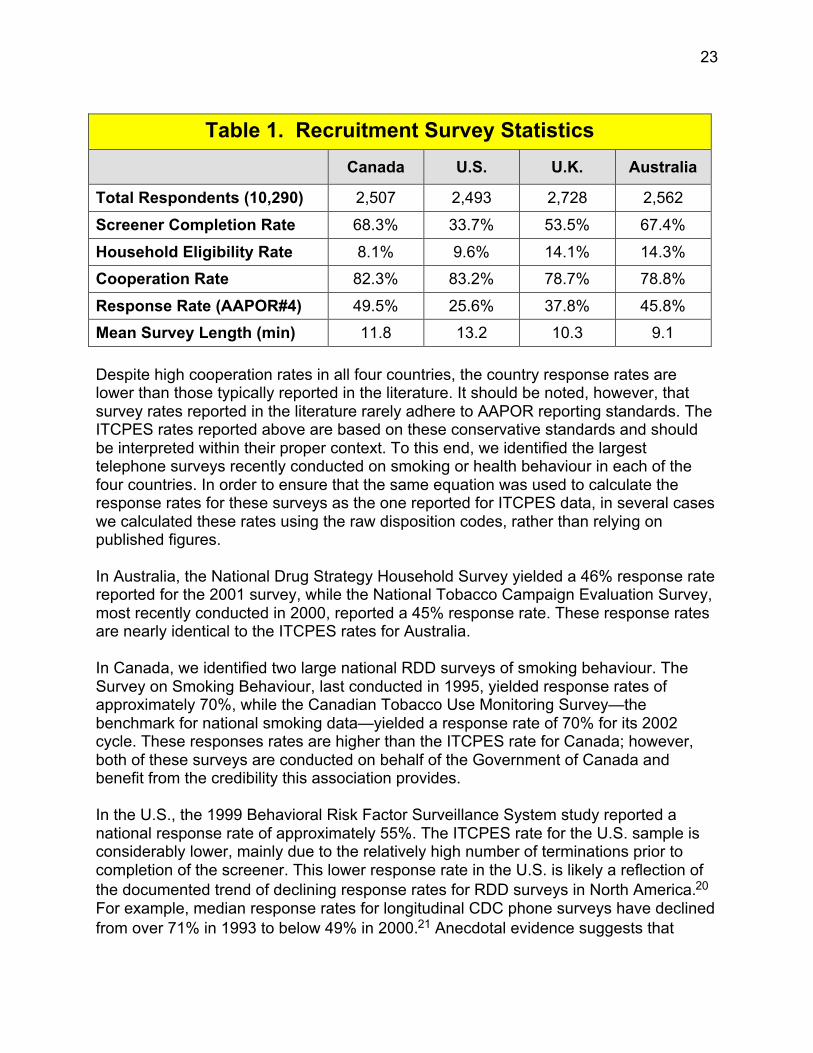
Wave 1 Recruitment Survey calls began on October 28, 2002, with all Main Surveyinterviews completed by December 23, 2002. All call attempts were assigned anAmerican Association for Public Opinion Research (AAPOR) disposition code.18 A list offinal disposition codes and their definitions are provided in Appendix C. Table 1presents statistics on survey length and sample size at Recruitment for each of the fourcountries.
8.2 Recruitment Survey Response Rates
Outcome rates were calculated for each country according to AAPOR18 and Council ofAmerican Survey Research Organizations (CASRO)19 standards. A flowchart ofprincipal recruitment outcomes is provided in Appendix D. Note that differences indisposition rates between countries may be function of: 1) the respondent, 2)differences in the classification of outcomes across interviewers and research firms, aswell as 3) cultural norms and differences in the phone systems between countries.
Table 1 also presents the AAPOR Response Rate #4 for each country. This responserate has 2 distinguishing features: 1) partial interviews are included as respondents(partial respondents were defined as respondents who skipped at least one question,but who completed all screener and smoking behaviour questions and a minimum of80% of the entire survey); and 2) the proportion of cases of unknown eligibility that areactually eligible is estimated. The ITCPES sample design involves multi-stage screening(CASRO Sample Type IV), yielding eligible units, ineligible units, and units for whicheligibility is not ascertained. Given that smoking prevalence in each of the four countriesis 20-30%, the majority of initial respondents are ineligible for the survey. As a result,estimating the number of cases of unknown eligibility is critical to calculating anaccurate response rate. For cases of unknown eligibility (e.g., household contacts thatwere terminated before screening was complete), we estimated the proportion that waseligible using the country-specific eligibility rates (see Appendix E and Appendix F).Respondents with insufficient language or cognitive skills were considered ineligible, aswere numbers that could not be identified as households after 5 call attempts.
23
Table 1. Recruitment Survey Statistics
Canada U.S. U.K. Australia
Total Respondents (10,290) 2,507 2,493 2,728 2,562
Screener Completion Rate 68.3% 33.7% 53.5% 67.4%
Household Eligibility Rate 8.1% 9.6% 14.1% 14.3%
Cooperation Rate 82.3% 83.2% 78.7% 78.8%
Response Rate (AAPOR#4) 49.5% 25.6% 37.8% 45.8%
Mean Survey Length (min) 11.8 13.2 10.3 9.1
Despite high cooperation rates in all four countries, the country response rates arelower than those typically reported in the literature. It should be noted, however, thatsurvey rates reported in the literature rarely adhere to AAPOR reporting standards. TheITCPES rates reported above are based on these conservative standards and shouldbe interpreted within their proper context. To this end, we identified the largesttelephone surveys recently conducted on smoking or health behaviour in each of thefour countries. In order to ensure that the same equation was used to calculate theresponse rates for these surveys as the one reported for ITCPES data, in several caseswe calculated these rates using the raw disposition codes, rather than relying onpublished figures.
In Australia, the National Drug Strategy Household Survey yielded a 46% response ratereported for the 2001 survey, while the National Tobacco Campaign Evaluation Survey,most recently conducted in 2000, reported a 45% response rate. These response ratesare nearly identical to the ITCPES rates for Australia.
In Canada, we identified two large national RDD surveys of smoking behaviour. TheSurvey on Smoking Behaviour, last conducted in 1995, yielded response rates ofapproximately 70%, while the Canadian Tobacco Use Monitoring Survey—thebenchmark for national smoking data—yielded a response rate of 70% for its 2002cycle. These responses rates are higher than the ITCPES rate for Canada; however,both of these surveys are conducted on behalf of the Government of Canada andbenefit from the credibility this association provides.
In the U.S., the 1999 Behavioral Risk Factor Surveillance System study reported anational response rate of approximately 55%. The ITCPES rate for the U.S. sample isconsiderably lower, mainly due to the relatively high number of terminations prior tocompletion of the screener. This lower response rate in the U.S. is likely a reflection ofthe documented trend of declining response rates for RDD surveys in North America.20
For example, median response rates for longitudinal CDC phone surveys have declinedfrom over 71% in 1993 to below 49% in 2000.21 Anecdotal evidence suggests that

24
response rates from more recent surveys, yet to be published, have declined evenfurther.
In contrast to the other 3 countries, RDD telephone surveys in the U.K. are relativelyrare, with the majority of social and health research conducted using face-to-face or in-person methodology. We were able to identify only a single RDD survey related tosmoking: the “Tobacco in London: Attitudes Towards Smoking” survey. This survey wasconducted in 2001 with a final sample over 9,000 and yielded a response rate ofapproximately 10%. In contrast, an RDD survey examining parental involvement oneducation by the Department for Education and Skills conducted in 2001 reported acooperation rate of approximately 56%. Within this context, the ITCPES U.K. responserate seems to fare well against the available, albeit limited, standards.
8.3 Representativeness
Non-contact and non-response should not affect data quality to the extent that theyoccur randomly. In other words, low response rates will only lead to a biased sample tothe extent that non-respondents differ from respondents. As a result, large differences inresponse rates have been found to have only minor effects on data accuracy.21,22,23
Indeed, differences in response rates as large as 45% have been found to yield apredicted difference in smoking prevalence estimates of only 1.5%.21
Examining the weights and various summaries of the weights can be useful inassessing the representativeness of the ITCPES sample. The weights are intended toreduce biases from uneven representation, so that a unit with a higher-than-averageweight can be thought of as having come from an under-represented region ordemographic group. A full description of the weights is provided in Section 8.5.
Appendix G presents brief descriptions of the national benchmark surveys to which theITCPES sample characteristics are compared and from which we took estimatedpopulation values to compute the ITCPES weights. Appendix H presents thedemographic profiles of the ITCPES sample and the national benchmark surveys. AsAppendix H indicates, there is generally good correspondence between thedemographic characteristics of the ITCPES sample and those of the nationalbenchmarks. And the weighting of the ITCPES data serves to close/eliminate thedifferences. Section 7.5 provides a more detailed account of these differences as theyrelate to the survey weights.
Weighting will not typically eliminate all biases. For example, weights will notnecessarily correct for biases except in characteristics that are highly associated withthe variables used to weight the sample (in this case, gender, age, and region).For this reason, we also undertook a comparison of key measures of smoking statusfrom the ITCPES with the national benchmark surveys of adult smokers. These data arepresented in Appendix I. As these data indicate, ITCPES data for these key indicators ofsmoking are generally similar to the benchmark surveys, with slightly higher measuresof daily consumption and addiction in the ITCPES sample.

25
Considering that non-response has been associated with lower socio-economicstatus,24 and given that there is an inverse relationship between tobacco use andSES,25 the ITCPES data might be expected to yield a sample of lighter, less-addictedsmokers than surveys with higher response rates, such as the national benchmarks inthe Canada and the U.S., for example. However, the data presented in Appendix Isuggest that the ITCPES was successful in surveying traditionally hard-to-reachrespondents. Further, the differences between ITCPES and national benchmarks aremodest and often no greater than the differences between national benchmarksthemselves. Indeed, the variability among these benchmark surveys within each countryis worth noting. For example, the two Australian benchmarks yield a difference in dailyconsumption of 2 cigarettes per day. Although we have made every effort to identifycomparable measures and survey dates, it is also worth noting that the exact wording ofcertain questions and different survey dates might also account for some of thesedifferences between benchmarks estimates and those of the ITCPES. Overall, it wouldappear that the ITCPES sample is providing reasonable and valid estimates, in line withthe best available measures in each country.
8.4 Attrition: Main Survey Follow-Up Rates
Overall attrition from recruitment to Main Surveys varied from a 10.2% to 14.4% (seeTable 2). Appendix J presents the flowchart of Main Survey follow-up outcomes for eachof the four countries. As expected, attrition rates were higher for males in every broadage group (except for the 50+ group in the U.K.); attrition rates tended to be higher forrespondents in large urban areas; attrition rates were somewhat higher in the 18-34 agegroup for both sexes; and attrition was higher for non-white people in Canada and theU.S. The dependence of attrition on educational attainment was minor and notconsistent across the four countries. Attrition was higher for those who rated their healthas “poor” in Canada and Australia, but not in the U.S. or the U.K. On the basis of theseresults, we decided not to incorporate education or perceived health in the adjustmentsfor the Main Survey weights. Nevertheless it is important to consider the determinants ofattrition when analyzing the survey results. A detailed analysis of attrition from theRecruitment Survey to the Main Survey has been conducted and is available onrequest. Based upon this analysis, predictors of attrition that could affect some analysesare marital status (single respondents are more often lost to follow up) and quit attempthistory (with those who have never attempted to quit being more likely to be lost).

26
Table 2. Main Survey Statistics
Canada U.S. U.K. Australia
Total Respondents (9,058) 2,214 2,138 2,401 2,305
Refusal Rate 4.6% 4.7% 6.5% 3.7%
Non-Contact Rate 7.4% 9.8% 5.6% 6.6%
Follow-Up Rate 88.0% 85.6% 88.0% 89.8%
Mean Survey Length (min) 43.4 44.6 38.6 38.7
8.5 Survey Weights
The sampling design was selected to provide a random, unbiased sample of adultsmokers within each geographic stratum. However, even with the most carefullydesigned and administered sampling, the outcome is subject to practical limitations: notall selected households will yield a response within the fieldwork constraints and not allpersons selected will agree to be interviewed or successfully complete an interview. Aswith all surveys, the ITCPES sample is subject to disproportionate selection andundercoverage of population subgroups. In order to adjust for disproportionate selectionof adult smokers in subgroups, weights have been calculated for each respondent.Where estimates in ITCPES results are derived from the sample, they are based on theweighted samples, unless stated otherwise. The following describes the procedures forcalculating these weights.
8.5.1 Recruitment Weights
1. Each household was given a multiple phone factor wt1 = 1 if it had one personalphone line, and wt1 = 1/2 if it had more than one personal phone line (sincetheoretically the latter households had at least twice as much chance of beingcontacted).
2. Each respondent’s wt1 was then multiplied by an adjustment factor = 1 if that personwas the only adult smoker in the house, and 2 if that person was one of 2 or moreadult smokers in the house.
3. The result was then multiplied by a factor to produce wt4 for each respondent, sothat the sum of the wt4 values for respondents in a stratum was proportional to thegeneral population for the stratum. This compensates for differential achievedsampling fractions from stratum to stratum. General population stratum numberscorresponding to strata actually used in the sampling design were available forCanada, the U.K. and Australia, but not in the U.S. In the U.S., wt4 was constructedto produce sums proportional to the general populations of the larger states andregional groups of smaller states + DC. There are a few respondents for which the

27
variable “state” was missing or ambiguous; such respondents received an averagevalue of wt4.
4. Finally, the weights wt4 were adjusted so that estimates of total numbers of smokersin age-sex groups (and white/non-white groups in the U.S.) agreed with currentprevalence numbers, mainly current daily smokers, in these groups. The groupsused differed from country to country: In the U.K., population estimates were drawnfrom census figures, while prevalence for sex*stratum and prevalence by sex*agegroup was estimated from the General Household Survey (2001). In Australia, weused census estimates for population estimates and data from the National HealthSurvey, 2001 for estimating prevalence within state*sex*age groups. In the U.S.,population estimates were drawn from census data, while prevalence by sex*agegroup*white/non-white were taken from proportions from the 1998-1999 CurrentPopulation Survey applied to a prevalence number estimate from the NationalHealth Interview Survey (2002). For Canada, weights were constructed forregion*sex*age groups from 2001 Canadian Community Health Survey prevalencedata that were already weighted with current census estimates.
8.5.2 Main Survey Weights
A separate set of weights was created for the subset of those recruits who alsocompleted the Main Survey at least partially (N = 9,046 respondents). Starting from therecruitment weights, Steps 3 and 4 (described above) were repeated with the subset ofMain Survey respondents. Respondents who did not complete the Main Survey wereassigned a weight of 0. As noted above, based upon our analysis of attrition betweenthe Recruitment Survey and Main Survey, it was decided not to incorporate othervariables, such as education and perceived health status in the adjustment for the MainSurvey weights.
8.5.3 Descriptive Uses of the Weights
The weight for any respondent can be interpreted as the number of people in thepopulation that we deem that respondent to represent. Thus the recruitment weight for arecruited respondent would vary from respondent to respondent, but would be of theorder of (stratum population size)/(stratum recruitment sample size). The sum of therecruitment weights over all recruited respondents will be the same as the populationsize (which we estimate from other sources). The Main Survey weight for a Main Surveyrespondent will be a little higher than the recruitment weight for the same respondent.This is because the recruitment weights for those who drop out between theRecruitment Survey and the Main Survey are re-distributed to those who stay in thesample.
Either set of weights might be used in computing estimates of proportions and meansfor purposes of “description” of attributes of the smoker population in each country. Forexample, recruitment weights could be used in estimating the proportion of smokersaged 45 and over who smoke at least 20 cigarettes per day, or the mean number ofcigarettes smoked per day by women with at least secondary school graduation. (For

28
the latter, take the sum of weights*consumption for women in the country who have atleast secondary school graduation, and divide by the sum of the same weights. SASand SPSS will do this with appropriate instructions.) The weights should not be used toestimate numbers, such as the number of daily or occasional smokers who intend toquit in a given period, because the weights have been “benchmarked” to approximatenumbers of daily smokers from other sources, which typically refer to time periods otherthan the time period for Wave 1 of the ITC survey (end of 2002). For example, the sumof the recruitment weights (or the main weights) for the Canadian part of the sample isequal to the number of daily smokers aged 18 and over in the provinces of Canada asestimated from the Canadian Community Health Survey (CCHS) of 2001. Because ourdata were collected over a year after the benchmark CCHS survey of 2001, we cannotuse our data to estimate the number of smokers or any other population value.
It should be noted that proportions estimated using these weights (e.g., estimatedproportion of smokers in category A = sum of weights for smokers in category A/sum ofweights for all smokers in sample) are not standardized across countries with respect todemographic variables. (Standardized proportions are easily calculated as appropriateweighted averages of e.g., age-sex group proportions.)
8.5.4 Standard Errors for Proportions or Means
Where a survey sample cannot be considered a true “simple random sample”consideration must be given to the “design effect.” Departure from “simple randomsampling” may sometimes be due to specific requirements of the survey or the nature ofthe attributes or population being measured, as well as to the practical limitations of fieldsampling operations. The standard errors must be adjusted for the design effect.
Rough—and likely conservative—standard errors for the proportions or means may beobtained from the corresponding unweighted (simple random sampling) analysis, bymultiplying by the square root of F where F=[n*(sum of squares of weights) / (sum ofweights)**2]. Here n refers to the size of the sample subgroup of interest, and the sumsare taken over that same sample subgroup. The factor F is 1 + the square of thecoefficient of variation of the weights in the sample subgroup. (The coefficient ofvariation of a positive variable is its standard deviation divided by its mean.)
For all four countries the full sample coefficient of variation of the recruitment weights isapproximately .45, and the coefficient of variation of the Main Survey weights is about.48. The factor F for the latter is 1.2304, and thus, the variability of the weights may beregarded very crudely as inflating standard errors by a factor equal to the square root of1.2304, or 1.109. However, the point of using the weights for descriptive aims is toreduce sampling bias. The reduction in bias should compensate at least in part for thegain in variability.
For ITCPES results, bootstrap weights for the data can be used to adjust standarderrors. With bootstrap weights, the analysis is run many times (or “replicated” manytimes), but each time, all output is ignored except the estimates of the coefficients of

29
interest. The variability of a slope coefficient, for example, is measured through itsobserved variation from bootstrap sample to bootstrap sample.26
8.5.5 Analytical Uses of the Weights
The weights may also be used in modelling, for example in logistic regressions. Theusual rationale is that the results will then measure relevant attributes of the actualpopulation at hand. Some software packages that use weights in analysis produceunrealistic p-values, because the software “erroneously” takes the sum of the weights tobe the sample size. If using such software it may be advisable as a “quick fix” to rescalethe weights so that they sum to the sample size.
The method of rescaling the weights (and even the necessity to do it) depends on thesoftware being used and the analysis desired. Some software (e.g., SAS) allows aredefinition of the weight variable so that it sums to the appropriate subsample size,before the main analysis is run. This can be done manually in SPSS, as follows:
1. Calculate the actual (i.e. unweighted) size of the subsample (e.g., Canadian womenaged 18-34 at Main Survey). Call this N1.
2. Calculate the “subpopulation size estimate” by summing the Main Survey weightsfor that subsample. Call this W1.
3. The rescaled weights = original weights * N1 / W1
Alternatively, for some analyses the output can be corrected. For example, if thesoftware “erroneously” takes the sum of the weights to be the sample size, we cancorrect standard errors for means and proportions as indicated earlier, or lessconservatively by multiplying by the square root of (sum of weights in denominator ofweighted mean or proportion divided by denominator of unweighted mean orproportion); we can correct a chi-square statistic by multiplying by (unweighted samplesize for the frequency table divided by apparent (weighted) sample size for thefrequency table).
If the software allows weighted linear regression, as SAS does, the output is usuallyadjusted automatically, and no rescaling is needed, for an analysis of data from a singlecountry. For logistic regression, weighted, SAS allows a “norm” option to rescale theweights automatically.
Rescaling the ordinary weights provides only crude corrections for test statistics incontexts such as logistic regression. Estimation and testing from ITCPES can be refinedusing bootstrap weights, described above.
Please note that the prescriptions above assume that data from just one country arebeing used in the analysis. In an analysis from a sample pooled across countries,additional care must be taken, since the population sizes (and hence the averageweights) differ widely from country to country. Using the weights as given will cause the

30
largest country to dominate the analysis, and will make estimation very inefficient.Scaling the weights so that they sum to the appropriate subsample sizes withincountries will eliminate this problem.
8.5.6 When Should Weights Be Used?
For descriptive purposes the use of the weights is necessary, but when the aims areanalytic the answer is not so clear. Where possible, modelling analyses should be runboth with the weights and without. If the estimates of coefficients or the results of testsagree reasonably well, the weighted analysis can be presented (with standard errorsand p-values corrected where necessary). “Agreeing reasonably well” might meanagreeing to within a standard error or two, or, more generally, when the weighted andunweighted analyses yield the same analytic conclusions. If the estimates disagreesubstantially, it is likely that the model is inadequate in the sense of leaving outimportant explanatory variables associated with the weights. In that case, neither theweighted nor the unweighted analysis is well-supported.
Because the weights tend to add variability, it is possible to have the situation wherecoefficient estimates agree, but appear non-significant in a weighted analysis andsignificant in an unweighted analysis. When this occurs, both analyses should bereported. In all cases, diagnostic checking of models is important, and may includeexamination of the influence of high or low weights on the analysis.

31
Appendix A. Sampling Specifications
Survey FirmDescription
Environics Roy MorganComments
Source of samples Canada: SSIU.S.: SSI
U.K.: SSIAustralia: EWP/RDDSampling plan (see nextsection)
Sampling frame Canada and U.S.:directories used toproduce cleaned-updatabase of workingblocks
U.K. and Australia:directories used toproduce cleaned-updatabase of workingblocks
Stratification & allocation(of blocks) in productionof number stock
Canada: Censusdivision; allocationproportional to censusdivision’s share of totalhouseholdsU.S.: Counties;allocation proportional tocensus-estimatednumber of telephonehouseholds
Australia: Not stratifiedU.K.: Not stratified
Stock = Source of numbers fromwhich each survey firm draws itssamples. In the case of the SSIsamples, these have already gonethrough a process whereby thesamples are prepared as indicated.For Australia, the stock is createdfrom EWP/RDD sampling procedures

32
Survey FirmDescription
Environics Roy MorganComments
Number stock generationfrom working blocks
Canada and U.S.:Systematic, with interval= listed units divided bydesired sample size;listed units chosen, thenlast two digitsrandomized
U.K.: Listed numbers inworking blocks are linedup; sampling issystematic, with interval= listed units divided bydesired sample size;listed units chosen, lasttwo digits randomized;rechosen if a businessnumberAustralia: see below
Organization of numberscalled from stock
Canada: stratified byprovince x communitysizeU.S.: stratified by fourcategories of communitysize (A - largestmetropolitan areas; B -those not in A but inmetropolitan areas withmore than 85,000households; C -- thosenot in A or B that havemore than 20,000households; D -- theremainder) withinregion.
U.K.: Stratified byregion: North East,Yorkshire/Humber, EastMidlands, Eastern,London, South East,South West, WestMidlands, North West,Wales, Scotland,Northern IrelandAustralia: Stratified bystate x (metropolitan vs.non-metropolitan)
Canada and U.S..: Respondentsample allocated proportionally tostratum sizes based on census
U.K.: Respondent sample allocatedproportionally to stratum sizesbased on census
Australia: Respondent sampleallocated proportionally topotentially effective numbers innumbers stock.
In all 4 countries: to obtain numbers tobe called from numbers stock:numbers stock is stratified and theorder of numbers is randomizedwithin strata

33
Survey FirmDescription
Environics Roy MorganComments
Cell phones Not to be called Not to be called Cell phones are not present in the SSIsamples (Canada, U.S., U.K.) Theyare not present in Australia samples ifthey are not “listed” in EWP.
Selection of respondentwithin household
Adult (18 years old orolder) smoker with nextbirthday: currentsmokers who are eitherdaily or occasionalsmokers and who havesmoked at least 100cigarettes in their life
Adult (18 years old orolder) smoker with nextbirthday: currentsmokers who are eitherdaily or occasionalsmokers and who havesmoked at least 100cigarettes in their life
Smoker with next birthday; if does notsatisfy refined definition when askedscreening questions, go to smokerwith next birthday in same household.
If target person refuses, eliminatehousehold (i.e., don’t ask for anotherperson)
Retention in waves afterWave 1
Respondents areretained until they havereported being non-smokers in twoconsecutive waves
Respondents areretained until they havereported being non-smokers in twoconsecutive waves
Respondents reportinghaving quit at Wave 2 (orat any post-baseline waveafter entry into the panel)
Administer quit versionof Main Survey and thenrecontact at next wave
Administer quit versionof Main Survey and thenrecontact at next wave
Respondents with two consecutivewaves of status as a quitter areremoved from panel
Respondents who report being aquitter at one wave but thenrelapse at the next are retained inthe panel.
Respondents reporting quitting atsubsequent waves or by calls tosurvey firm’s toll-free number aregiven the quit version of the surveyif still eligible.

34
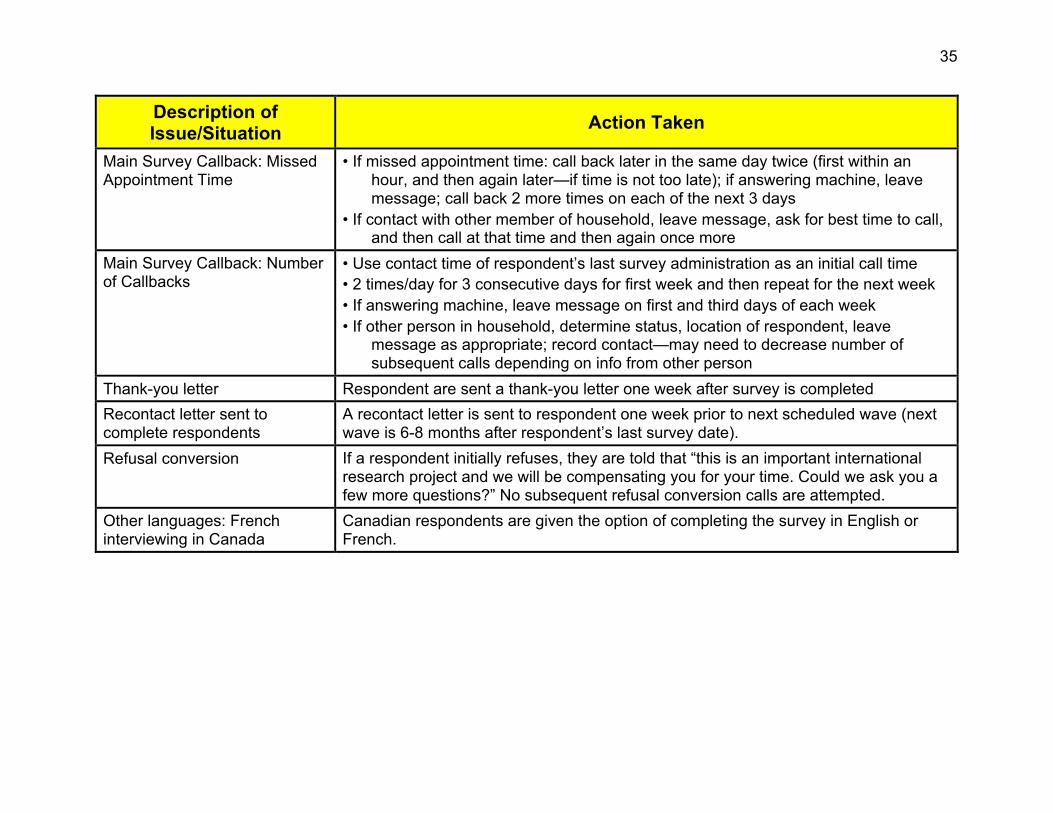
Appendix B. Recruitment Contact Protocol
Description ofIssue/Situation
Action Taken
Answering machines Messages are not left on telephone answering devices. If calls were forwarded to ahousehold number, the interviewer proceeds with script as usual. Changed numbersat recruitment are discarded.
Respondent is seriously ill orhas passed away
Both firms have considerable experience in dealing with this situation. They will usediscretion and tact, per their usual procedures, which are comparable across firms.
Respondent has a close familymember who has beendiagnosed with smoking-relateddisease
Both firms have considerable experience in dealing with this situation. They will usediscretion and tact, per their usual procedures, which are comparable across firms. Itshould be noted that the interviewer scripts allow for the possibility that therespondent still wants to participate.
Respondent showspsychological distress
Both firms have considerable experience in dealing with this situation. They will usediscretion and tact, per their usual procedures, which are comparable across firms.Interviewers will discern whether the respondent can indeed participate in the surveyat that time or at another time.
Respondent asks abouttreatment options
We will not provide information about treatment options: (1) our interviewers are nottrained health professionals and do not have expertise of any kind in treatment fornicotine addiction; (2) providing treatment options would affect the behaviour of ourpanel, thereby potentially confounding our ability to evaluate national-level tobaccocontrol policies; (3) this is not a clinical study—to offer/recommend treatment optionswould change the nature of the study.
Number of call attempts:recruitment call
• If phone rings, but no answer and no machine: total of 5 call attempts.• If phone rings, but no answer, but answering machine: total of 7 call attempts.• If phone is constantly busy: 7 call-backs.• If a non-adult (<18 years old) answers and no adult home: total of 7 call attempts
35
Description ofIssue/Situation
Action Taken
Main Survey Callback: MissedAppointment Time
• If missed appointment time: call back later in the same day twice (first within anhour, and then again later—if time is not too late); if answering machine, leavemessage; call back 2 more times on each of the next 3 days
• If contact with other member of household, leave message, ask for best time to call,and then call at that time and then again once more
Main Survey Callback: Numberof Callbacks
• Use contact time of respondent’s last survey administration as an initial call time• 2 times/day for 3 consecutive days for first week and then repeat for the next week• If answering machine, leave message on first and third days of each week• If other person in household, determine status, location of respondent, leave
message as appropriate; record contact—may need to decrease number ofsubsequent calls depending on info from other person
Thank-you letter Respondent are sent a thank-you letter one week after survey is completed
Recontact letter sent tocomplete respondents
A recontact letter is sent to respondent one week prior to next scheduled wave (nextwave is 6-8 months after respondent’s last survey date).
Refusal conversion If a respondent initially refuses, they are told that “this is an important internationalresearch project and we will be compensating you for your time. Could we ask you afew more questions?” No subsequent refusal conversion calls are attempted.
Other languages: Frenchinterviewing in Canada
Canadian respondents are given the option of completing the survey in English orFrench.

36
Appendix C. Wave 1 Disposition Codes By Country
DispositionCode
AAPORCode Description Canada U.S. U.K. Aus.
CS 00 4.30 Not in service 13,747 25,806 3,746 23,973
CS 01 4.20 FAX/modem 3,757 9,175 324 5,445
CS 02 4.40 TCI fault 952 1,936 1 —
CS 03 4.50 Non-residential (business, institution) 4,712 15,347 263 8,982
CS 04 4.42 Cell phone/mobile 200 171 31 143
CS 08 1.2Eligible respondent smoker completes screenerbut hangs up before end of the RecruitmentSurvey.
19 16 19 3
CS 09 1.1Eligible respondent smoker completesrecruitment script with no skips
2,454 2,389 2,606 2,449
CS 10 2.21Appointment type 0: appointment made withinitial respondent for next birthday adult smoker;no adult available
156 800 78 2
CS 11 2.21Appointment type 1: soft callback when no adultavailable 130 378 151 62
CS 12 2.21Appointment type 2: appointment with nextbirthday respondent to complete screener
68 60 — —
CS 13 2.21Appointment type 3: appt made with initialrespondent for next birthday adult smoker; initialrespondent has completed intro
41 30 41 2

37
DispositionCode
AAPORCode Description Canada U.S. U.K. Aus.
CS 18 3.21
Initial respondent refuses; initial respondent isasked to give household size and number ofsmokers but refuses again at some point beforecompleting this
3,289 3,648 9,220 3,506
CS 19 4.7 No household member 18 or older 365 670 469 276
CS 20 4.7No adult household member smokes cigarettes;household size given 16,483 24,903 18,938 17,355
CS 21 4.7Initial respondent volunteers no adult householdmember smokes cigarettes; household sizerefused
— — 1,001 818
CS 22 3.24Initial respondent refuses but answers Q1d, Q1e;>0 smokers
130 124 184 245
CS 24 4.7No adult household member smokes, number ofadults household members unknown (child wasthe initial respondent)
17,550 1,629 237 399
CS 27 3.25Next birthday smoker refuses to participate inscreener 71 73 57 72
CS 28 3.25Initial respondent completes intro but refuses toget next birthday smoker
78 89 574 731
CS 30 3.25 Next birthday smoker refuses to give age 41 20 239 118
CS 32 4.7Next birthday smoker proves to be too young; noothers left to try
3 8 9 7
CS 33 4.7Next birthday smoker has not smoked100 cigarettes; no others left to try 38 75 51 39
CS 34 4.7Next birthday smoker does not smoke at leastonce a month; no others left to try
15 29 11 17

38
DispositionCode
AAPORCode Description Canada U.S. U.K. Aus.
CS 35 2.111 Eligible respondent smoker refuses 257 245 591 556
CS 40 3.13 Rings only, 5 consecutive attempts 2,939 4,444 5,630 8,585
CS 41 3.12Busy/engaged at least once, no ans. machine, nocontact, 7 attempts 680 1,611 784 2,535
CS 42 3.13Ans. machine at least once, not clear if resid ornon-residential, no contact, 7 attempts
3,017 6,641 152 391
CS 43 3.29Ans. machine at least once, residential, nocontact, 7 attempts
— — — —
CS 44 3.19 Number reached but unknown if residential 137 615 1,824 670
CS 80 3.21 Initial respondent hangs up before screener 11,636 50,318 4,821 3,585
CS 81 3.25 Next birthday smoker hangs up during screener 155 183 7 8
CS 82 2.12Eligible respondent smoker hangs up duringQ11- Q22
236 134 54 42
CS 83 1.2Eligible respondent smoker skips (refuses/can’tanswer) one or more questions in Q11 - Q22 22 90 59 69
CS 84 1.2Eligible respondent smoker completes up to Q22,skips (refuses/can’t answer) one or more laterquestions, reaches end of recruitment script
31 21 63 48
CS 90 3.23Termination, initial respondent has languageproblem
828 2,226 365 1,187
CS 91 3.22Termination, initial respondent isphysically/mentally incompetent 189 282 368 255
CS 92 3.29 Termination, other problem with initial respondent 504 1,178 4,753 743
CS 93 2.33Termination in screener, next birthday smokerhas language problem 21 47 15 51

39
DispositionCode
AAPORCode Description Canada U.S. U.K. Aus.
CS 94 2.32Termination in screener, next birthday smokerphysically/mentally incompetent 12 27 13 6
CS 95 2.35 Termination in screener, other problem 72 61 58 89
TOTALS 85,035 155,499 57,807 83,464
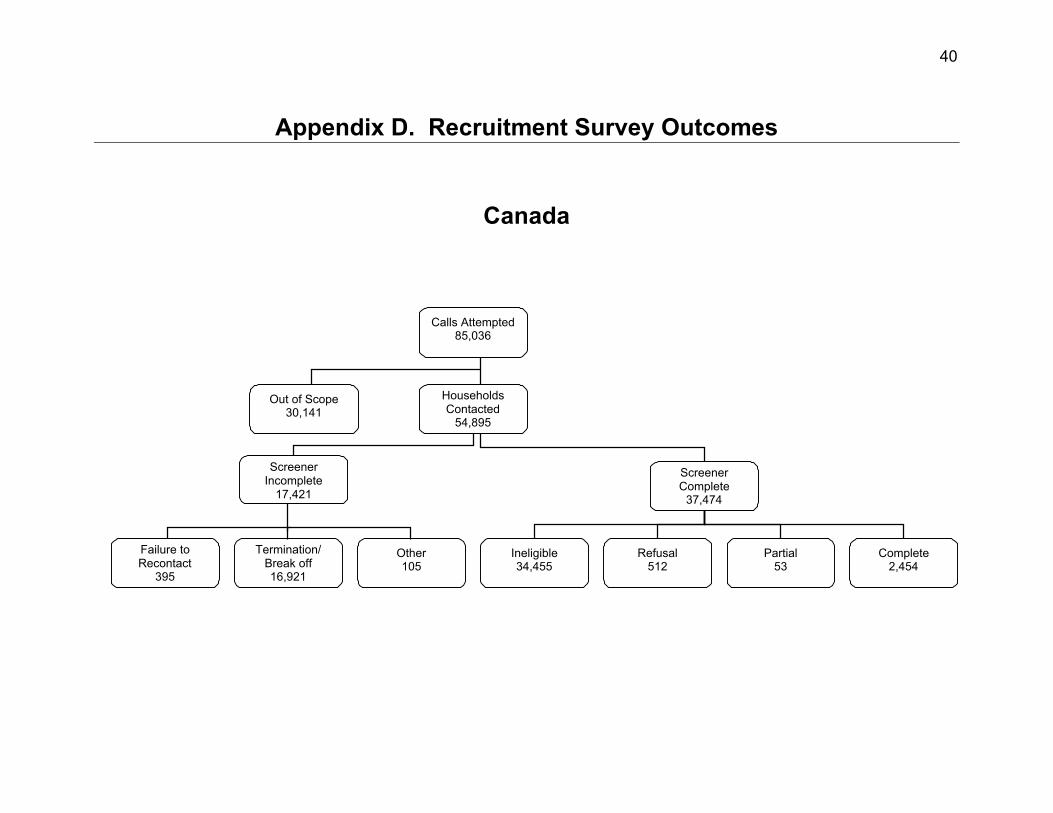
40
Appendix D. Recruitment Survey Outcomes
Canada
Calls Attempted85,036
Out of Scope30,141
HouseholdsContacted
54,895
ScreenerComplete
37,474
Failure toRecontact
395
Termination/Break off16,921
Other105
Ineligible34,455
Refusal512
Partial53
Complete2,454
ScreenerIncomplete
17,421
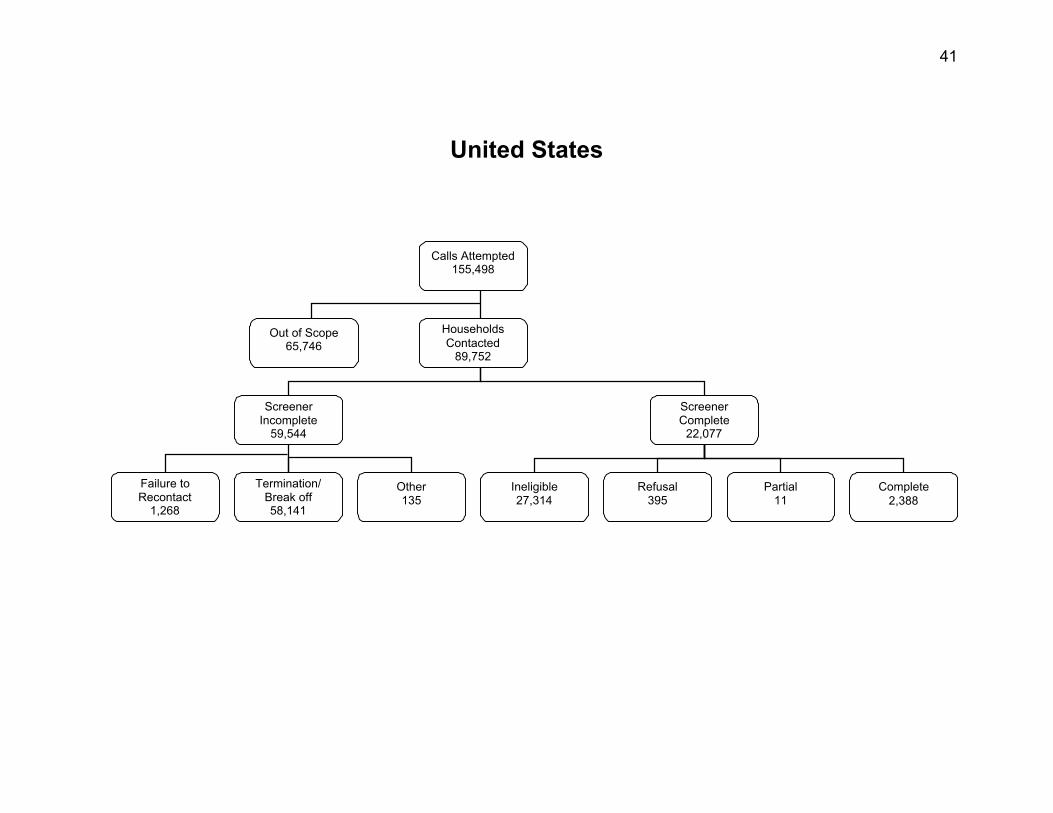
41
United States
Calls Attempted155,498
Out of Scope65,746
HouseholdsContacted
89,752
ScreenerComplete
22,077
Failure toRecontact
1,268
Termination/Break off58,141
Other135
Ineligible27,314
Refusal395
Partial11
Complete2,388
ScreenerIncomplete
59,544

42
United Kingdom
Calls Attempted57,807
Out of Scope12,755
HouseholdsContacted
45,052
ScreenerComplete
24,108
Failure toRecontact
270
Termination/Break off20,588
Other86
Ineligible20,716
Refusal664
Partial122
Complete2,606
ScreenerIncomplete
20,944

43
Australia
Calls Attempted83,464
Out of Scope50,724
HouseholdsContacted
32,740
ScreenerComplete
22,078
Failure toRecontact
66
Termination/Break off10,450
Other146
Ineligible18,911
Refusal601
Partial117
Complete2,449
ScreenerIncomplete
10,662

44
Appendix E. Intermediate Outcome Frequencies By Country
Intermediate Outcome Frequencies Canada U.S. U.K. Aus.
Completed Interviews (I)(CS09) 2,454 2,388 2,606 2,449
Partial Interviews (P)(CS84)
53 111 122 117
Refusal and break-off (R)(CS08+CS35+CS82)
512 395 664 601
Non-Contact (NC)(CS10+CS11+CS12+CS13)
395 1,268 270 66
Other (O)(CS93+CS94+CS95)
105 135 86 146
Total Ineligible(CS00+CS01+CS02+CS03+CS04+CS19+CS20+CS21+
CS24+CS32+CS33+CS34)57,822 79,749 25,081 57,454
Unknown Eligibility–Household (UH)(CS40+CS41+CS42+CS44)
6,773 13,311 8,390 12,181
Unknown Eligibility–Other (UO) Total(CS18+CS80+CS90+CS01+CS92+CS43+CS44)
16,922 58,141 20,588 10,450
UO.1—Adult smoker, screener incomplete(CS22+CS27+CS28+CS30+CS81)
476 489 1,061 1,174
UO.2—Not known if smoker in household(CS18+CS43+CS80+CS90+CS91+CS92)
16,446 57,652 19,527 9,276

45
Appendix F. Other Computations Involving Disposition Codes
Computing Estimated Eligibility of Cases of “Unknown Eligibility”
Description Canada U.S. U.K. Aus.
Total “Screener Eligibles” (CS82+83+08+84+09) 2,785 2,739 2,860 2,680
Total cases found to be ineligible after screener(CS30+32+33+34)
98 132 310 181
Proportion of Total “Screener Eligibles”found to be eligible 0.97 0.95 0.89 0.93
Estimated number of UO.1 Eligibles(U0.1*proportion above)
458 465 946 1,095
Estimated number of eligible respondents fromcases of unknown eligibility 1,783 5,990 3,693 2,425
Estimating Eligibility of Non-Contact Cases
Description Canada U.S. U.K. Aus.
CS11 * Eligibility rate 10 36 21 9
CS10,12,13 * .96 256 847 106 4
Revised Total of Non-Contacts 266 883 127 13

46
Appendix G. Benchmark Surveys
Canada
Canadian Tobacco Use Monitoring Survey (CTUMS), 2002
CTUMS provides data on tobacco use and related issues from over 10,000 respondentsper year. The primary objective of the survey is to track changes in smoking status,especially for populations most at risk, such as the 15-24 year olds. The survey allowsHealth Canada to estimate smoking prevalence by province-sex-age groups on a semi-annual basis. The sample design is a special two-phase stratified random sample oftelephone numbers. The two-phase design is used in order to increase therepresentation in the sample of individuals belonging to the 15-19 and 20-24 agegroups. In the first phase, households are selected using Random Digit Dialling. In thesecond phase, one or two individuals (or none) are selected based upon householdcomposition. Data are collected using computer-assisted telephone interviewing (CATI).
Canadian Community Health Survey (CCHS), 2000–01
The CCHS is conducted by Statistics Canada to provide timely cross-sectionalestimates of health determinants, health status, and health system utilization at a sub-provincial level (health region or combination of health regions). Each two-yearcollection cycle is comprised of two distinct surveys: a health region-level survey in thefirst year with a total sample of 130,000 and a provincial-level survey in the second yearwith a total sample of 30,000. Both computer-assisted personal and telephoneinterviews are used. The target population of the CCHS includes household residents inall provinces and territories; with the principal exclusion of populations on IndianReserves, Canadian Forces Bases, and some remote areas. One randomly selectedrespondent is interviewed per household, although planned over sampling of youthswas conducted in a second member of certain households being interviewed. For thefirst collection cycle, only those 12 years of age and over were eligible for selection.

47
Survey on Smoking Behaviour (SSB), 1994–95
The major objectives of the SSB were to assess the national prevalence of smoking andto measure attitudes towards tobacco use. The first cycle was administered betweenApril 20 and June 1, 1994 as a random digit dialed (RDD) survey, The target populationfor the Survey on Smoking in Canada was all persons 15 years of age. Individuals aged15-24 or 65+ had 50 times the chance of being selected over people aged 25-64.Second, households with only 25-64 year-olds present were sub-sampled.
United States
National Health Interview Survey (NHIS), 2001
The NHIS is a multi-purpose health survey conducted by the National Center for HealthStatistics (NCHS), Centers for Disease Control and Prevention (CDC), and is theprincipal source of information on the health of the civilian, noninstitutionalized,household population of the United States. HIS data are collected through a personalhousehold interview by Census interviewers. From each family in the NHIS, one sampleadult and one sample child (if any children underage 18 are present) are randomlyselected, and information on each is collected. The U.S. Census Bureau is the datacollection agent for the NHIS. Further information is available at:http://www.cdc.gov/nchs/nhis.htm
Current Population Survey (CPS), 200227
The Current Population Survey (CPS) is a monthly survey of about 50,000 householdsconducted by the Bureau of the Census for the Bureau of Labor Statistics. The CPS isthe primary source of information on the labor force characteristics of the U.S.population. The sample is selected to represent the civilian noninstitutional population.Respondents are interviewed to obtain information about the employment status of eachmember of the household 15 years of age and older. The sample provides estimates forthe nation as a whole and serves as part of model-based estimates for individual statesand other geographic areas.

48
Behavioural Risk Factor Surveillance Systems (BRFSS), 1999 28,29
The Behavioral Risk Factor Surveillance System (BRFSS) is a collaborative project ofthe Centers for Disease Control and Prevention (CDC), and U.S. states and territories.The BRFSS, administered and supported by CDC’s Behavioral Surveillance Branch, isan ongoing data collection program designed to measure behavioural risk factors in theadult population 18 years of age or older living in households. The objective of theBRFSS is to collect uniform, state-specific data on preventive health practices and riskbehaviours that are linked to chronic diseases, injuries, and preventable infectiousdiseases in the adult population. Data are collected from a random sample of adults(one per household) through a computer-assisted telephone survey.
United Kingdom
Health Survey for England (HSE), 2001
The HSE is a face-to-face survey designed to provide data at both national and regionallevel about the population living in private households in England. The sample for the2001 survey included a cross-section of the population living in private households forwhich over 13,680 addresses were drawn from the Postcode Address File (PAF). Allpersons in the private household including those under 2 were eligible for inclusion inthe survey. At addresses where there were more than two children under 16, twochildren were selected at random. Information was obtained directly from persons aged13 and over. Information about children aged 0-12 was obtained from a parent, with thechild present. For all informants, there was a computer-assisted interview by aninterviewer with each eligible person (Stage 1), followed by a nurse visit (Stage 2) whoundertook a number of measurements and in some cases obtained a blood sample or asaliva sample.
General Household Survey (GHS), 2001 30
The General Household Survey (GHS) is a multi-purpose face-to-face survey carriedout by the Social Survey Division of the Office for National Statistics (ONS) whichcollects information on a range of topics from people living in private households inGreat Britain. The survey consists of two elements: the Continuous Survey and trailers.The main aim of the survey is to collect data on a range of core topics, including health.A sample of approximately 13,000 addresses is selected each year from the PostcodeAddress File. All adults aged 16 and over are interviewed in each respondinghousehold. Demographic and health information is also collected about children in thehousehold.

49
Australia
National Drug Strategy Household Survey (NDSHS), 2001
The NDSHS is managed by the Australian Institute of Health and Welfare on behalf ofthe Commonwealth Department of Health and Ageing, and conducted by Roy MorganResearch. The 2001 Survey, which was the seventh in a series, provides data aboutawareness, attitudes and behaviour relating to drug use, including alcohol and tobaccoas well as illicit drugs. The 2001 Survey, as well as utilizing the personal interview andself-completion methodologies adopted in past surveys, also incorporated a samplewho were interviewed using Computer Assisted Telephone Interviewing (CATI). Allrespondents were aged 14 and over. In each household the selected respondent wasthe person with the next birthday. The questionnaire included both questions aboutgeneral attitudes to drugs and more sensitive questions about personal drug usage andrequired approximately 25 minutes to complete.
National Tobacco Survey Evaluation Campaign (NTSEC), 2000
The evaluation surveys were conducted by the Commonwealth Department of Healthand Aged Care and conducted by the Roy Morgan Research Centre. The secondfollow-up survey was conducted following the same methods as the first follow-up andbenchmark surveys. An enumeration survey was conducted to identify the smokingstatus of all adults in the household and to enable selection of subjects. All participantswere asked about their cigarette smoking to confirm categorization of participants intosmokers, recent quitters and others. The telephone questionnaire included questionsabout participants’ awareness of advertising about health, recent learning aboutsmoking and health, and agreement and disagreement with a range of opinionstatements relating to smoking and health.
National Health Survey, 2001
The National Health Survey (NHS) was conducted by the Bureau of Statistics (ABS)from February to November 2001. Approximately 26,900 people from all states andterritories and across all age groups were included.
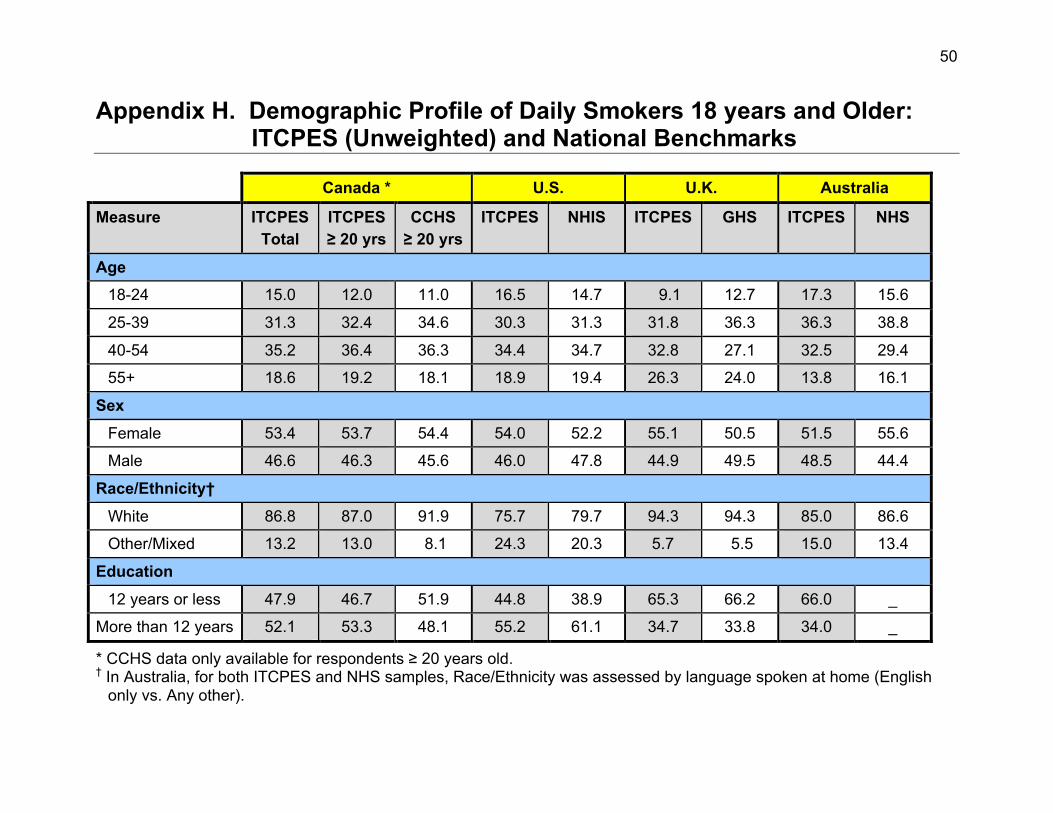
50
Appendix H. Demographic Profile of Daily Smokers 18 years and Older:ITCPES (Unweighted) and National Benchmarks
Canada * U.S. U.K. Australia
Measure ITCPESTotal
ITCPES≥ 20 yrs
CCHS≥ 20 yrs
ITCPES NHIS ITCPES GHS ITCPES NHS
Age
18-24 15.0 12.0 11.0 16.5 14.7 9.1 12.7 17.3 15.6
25-39 31.3 32.4 34.6 30.3 31.3 31.8 36.3 36.3 38.8
40-54 35.2 36.4 36.3 34.4 34.7 32.8 27.1 32.5 29.4
55+ 18.6 19.2 18.1 18.9 19.4 26.3 24.0 13.8 16.1
Sex
Female 53.4 53.7 54.4 54.0 52.2 55.1 50.5 51.5 55.6
Male 46.6 46.3 45.6 46.0 47.8 44.9 49.5 48.5 44.4
Race/Ethnicity†
White 86.8 87.0 91.9 75.7 79.7 94.3 94.3 85.0 86.6
Other/Mixed 13.2 13.0 8.1 24.3 20.3 5.7 5.5 15.0 13.4
Education
12 years or less 47.9 46.7 51.9 44.8 38.9 65.3 66.2 66.0 _
More than 12 years 52.1 53.3 48.1 55.2 61.1 34.7 33.8 34.0 _
* CCHS data only available for respondents ≥ 20 years old.† In Australia, for both ITCPES and NHS samples, Race/Ethnicity was assessed by language spoken at home (English
only vs. Any other).

51
Appendix I. Key Indicators of Smoking: ITCPES and National Benchmarks
Canada
ITCPES CTUMS (2002) ITCPES (≥ 20 years) CCHS (2001)*
Measure M F Total M F Total M F Total M F Total
Cigarettes per day 17.5 14.8 16.0 18.1 14.9 16.6 17.6 14.9 16.2 18.5 15.5 17.1
% quit attempt inlast 12 months
46.8 47.7 47.3 43.8% 46.0% 44.9 45.7 46.8 46.3 38.2 38.2 38.2
% Seriouslyconsidering orplanning to quit innext 6 months†
46.2 43.4 44.7 62.1% 56.5% 59.4 — — — — — —
% having firstcigarette of daywithin 5 min ofwaking
18.3 21.6 20.1 26.6% 24.4% 25.6 — — — — — —
* CCHS data includes only respondents 20 years and older† Differences in question wording: ITCPES = “planning to quit”; CTUMS = “considering quitting”

52
United States
ITCPES (2002) NHIS (2001)
Measure Male Female Total Male Female Total
Cigarettes per day 19.5 16.5 17.9 19.5 16.2 17.9
% quit attempt in last12 months
44.5 45.5 45.0 40.1 41.1 40.6
United Kingdom
ITCPES (U.K. Total) GHS (2001) ITCPES (England) HSE (2001; England)
Measure M F Total M F Total M F Total M F Total
Cigarettes per day 18.0 15.8 16.8 15.3 13.5 14.4 18.6 17.0 17.8 15.6 13.4 14.4
% having firstcigarette of daywithin 15 min ofwaking
41.2 36.8 38.7 32.8 33.0 32.9 32.7 27.3 30.1 34.0 30.2 31.9

53
Australia
ITCPES (2002) NTCES (2002) NDDS (2001)
Measure Male Female Total Male Female Total Male Female Total
Cigarettes per day 19.4 16.6 17.9 17.4 16.2 16.7 19.5 17.8 18.7
% ever tried to quit 82.9 83.3 83.1 80.3 80.0 80.1 — — —
% tried to quit inpast year 44.2 45.8 45.0 — — — 39.5 38.4 39.0
% seriouslyconsidering or planningto quit in next month*
13.4 11.0 12.2 15.8 17.0 16.5 10.6 8.9 10.8
* Differences in question wording: ITCPES and NDDS = “planning to quit”; NTCES = “considering quitting”

54
Appendix J. Main Survey Follow-up Rates
Definitions for not contacted and contacted:
NOT CONTACTED:• Not in service/line problem• Rings only• Busy• Answering machine/fax/modem
CONTACTED:• Respondent has died• Respondent calls to withdraw• Household refusal to get respondent• Respondent unavailable this wave• Respondent refuses before Qxx is finished• All questions answered• All questions asked, respondent refused one or more questions• Interruption, never completed• Respondent completes all but income
OF THOSE CONTACTEDNOT CONTACTED
o Respondent has diedo Respondent calls to withdrawo Respondent unavailable this waveo Rescheduled, appointment not kepto Interviewer termination
REFUSALo Respondent refuses before Qxx is finishedo Household refusal to get respondent
COMPLETEo All questions answeredo All questions asked, respondent refused one or more questionso Interruption, never completedo Respondent completes all but income

55
Canada
Total Recruited2,507
Not Contacted124
Contacted2,383
Not Contacted66
Completed2,214
Refused104
Failure to Complete(Final Disposition)
294

56
United States
Total Recruited2493
Not Contacted164
Refused107
Complete2141
Not Contacted81
Contacted2329
Smoking StatusKnown2138
Smoking StatusUnknown
3
Failure to Complete(Final Disposition)
352

57
United Kingdom
Total Recruited2,728
Not Contacted57
Contacted2,671
Not Contacted94
Completed2,401
Refused176
Failure to Complete(Final Disposition)
327

58
Australia
Total Recruited2,562
Not Contacted53
Contacted2,509
Not Contacted114
Completed2,305
Refused90
Failure to Complete(Final Disposition)
257

59
References
1 Ajzen, I. (1991). The theory of planned behavior. Organizational Behavior and HumanDecision Processes, 50, 179-211.
2 Bandura, A. (1986). Social foundations of thought and action: A social-cognitivetheory. Englewood Cliffs, NJ: Prentice-Hall.
3 Becker, M.H. (Ed.) (1974). The health belief model and personal health behavior.Thorofare, NJ: Charles B. Slack.
4 Rogers, R., & Prentice-Dunn, S. (1997). Protection Motivation Theory. In D. Gochman(Ed.), Handbook of health behavior research: Vol. 1. Determinants of healthbehavior: Personal and social (pp. 113-132). New York: Plenum.
5 Binson, D., Canchola, J.A., & Catania, J.A. (2000). Random selection in a nationaltelephone survey: a comparison of the Kish, next-birthday, and last-birthdaymethods. Journal of Official Statistics, 16, 53-60.
6 Hedeker, D., Gibbons, R. D. & Waternaux, C. (1999) Sample size estimation forlongitudinal designs with attrition: Comparing time-related contrasts between twogroups. Journal of Educational and Behavioural Statistics, 24, 70-93.
7 Fong, G.T., Cameron, A.J.R., Brown, K.S., Campbell, H.S., Zanna, M.P., Murnaghan,D., MacDonald, M.M., Madill, C., Driezen, P., & Clayton, R.R. (2002, November).Effects of the Canadian Graphic Warning Labels Among High School Students: AQuasi-Experimental Longitudinal Survey. Paper presented at the 2002 NationalConference on Tobacco or Health, San Francisco.
8 Borland, R. (1997). Tobacco health warnings and smoking-related cognitions andbehaviours. Addiction, 92, 1427-1435.
9 Environics Research Group (2001, July). The effects of health warning messages oncigarette packages, Wave 3. Report prepared for Health Canada. [Results of arepresentative sample survey of Canadian adult smokers.]
10 U.S. Department of Health and Human Services (2000). Reducing Tobacco Use: AReport of the Surgeon General. Atlanta, GA: U.S. Department of Health andHuman Services, Centers for Disease Control and Prevention, National Center forChronic Disease Prevention and Health Promotion, Office on Smoking and Health.
11 Singer, E., van Hoewyk, J., & Maher, M. P. (2000). Experiments with incentives intelephone surveys. Public Opinion Quarterly, 64, 171-188.
12 Lynn, P., Taylor, B., & Brook, L. (1997). Incentives, information and number ofcontacts: Testing the effects of these factors on response to a panel survey.Survey Methods Centre Newsletter 17. National Centre for Social Research,London, UK.
13 Martin, E., Abreu, D., & Winters, F. (2001). Money and motive: effects of incentiveson panel attrition in the survey of income and program participation. Journal ofOfficial Statistics, 17, 267-284.
14 Duncan, G.J., & Kalton, G. (1987). Issues of design and analysis of surveys acrosstime. International Statistical Review, 55, 97-117.

60
15 Lepkowski, J.M. (1988). The treatment of wave nonresponse in panel surveys. InKasprzyk, D., Duncan, G., & Singh, M.P. (eds.). Panel survey design and analysis.New York: Wiley.
16 Weeks, M.F., Kulka, R.A., & Pierson, S.A. (1987). Optimal call scheduling for atelephone survey. Public Opinion Quarterly, 51, 540-549.
17 Stephens, T., Pederson, L., Koval, J., & Macnab, J. (2001). Comprehensive tobaccocontrol policies and the smoking behaviour of Canadian adults. Tobacco Control,10, 317-322.
18 American Association for Public Opinion Research (2000). Standard Definitions:Final Dispositions of Case Codes and Outcome Rates for Surveys. Lenexa,Kansas: AAPOR. a
19 Council of American Survey Research Organizations (1982). On the definition ofresponse rates: A Special Report of the CASRO Task Force on Completion Rates.Port Jefferson, NY: CASRO. b
20 Flynn, C.A., Biener, L., & Roman, A.M. (2002, November). Consequences ofdeclining response rates for estimating population smoking prevalence. Paperpresented at the National Conference on Tobacco or Health. San Francisco, CA. c
21 Wortley, P., & Mariolis, P. (2002, March). Impact of response rates on estimates ofsmoking prevalence: comparison of state-specific estimates from the BRFSS andthe CPS Tobacco Use Supplement. Paper presented at the meeting of theAmerican Association for Public Opinion Research (AAPOR). d
22 Keeter, S., Miller, C., Kohut, A., Groves, R.M., & Presser, S. (2000). Consequencesof reducing nonresponse in a national telephone survey. Public Opinion Quarterly,64, 125-148. g
23 Curtin, R., Presser, S., & Singer, E. (2000). The effects of response rate changes onthe index of consumer sentiment. Public Opinion Quarterly, 64, 413-428. h
24 Koch, A., & Prost,R. (Eds) (1998). Nonresponse in survey research. Proceedings ofthe Eight International Workshop on Household Survey Nonresponse. Mannheim,Germany: ZUMA.
25 U.S.Department of Health and Human Services (2000). Reducing tobacco use: Areport of the Surgeon General. Atlanta, Georgia: U.S. Department of Health andHuman Services, Centers for Disease Control and Prevention, National Center forChronic Disease Prevention and Health Promotion, Office on Smoking and Health.
26 Lohr, S.L. (1999). Sampling: Design and Analysis. Pacific Grover, CA: DuxburyPress.
27 U.S. Dept. of Commerce, Bureau of the Census (2001). CURRENT POPULATIONSURVEY, FEBRUARY 2001: CONTINGENT WORK SUPPLEMENT [Computerfile]. Washington, DC: U.S. Dept. of Commerce, Bureau of the Census [producer],2001. Ann Arbor, MI: Inter-University Consortium for Political and Social Research[distributor], 2001.
28 Centers for Disease Control and Prevention (1999). Behavioral Risk FactorSurveillance System Survey Data. Atlanta, Georgia: U.S. Department of Healthand Human Services, Centers for Disease Control and Prevention.

61
29 Centers for Disease Control and Prevention (1999). Behavioral Risk FactorSurveillance System Survey Questionnaire. Atlanta, Georgia: U.S. Department ofHealth and Human Services, Centers for Disease Control and Prevention.
30 Office for National Statistics. Social Survey Division, General Household Survey,2001-2002 [computer file]. 2nd Edition. Colchester, Essex: UK Data Archive[distributor], July 2003. SN: 4646.