international trade barriers and regional employment: the
TRANSCRIPT

International trade barriers and regional employment: the case of a no‑deal BrexitHans‑Ulrich Brautzsch1 and Oliver Holtemöller1,2*
1 IntroductionThe British people has voted to leave the European Union (EU) by applying article 50 of the Treaty on European Union in June 2016. The United Kingdom (UK) has left the EU on January 31, 2020. However, the UK had still unlimited access to the Single Market until December 31, 2020. For most of the time during the year 2020, it has not been clear whether Brexit will lead to tariffs on trade between the UK and the remaining EU (EU-27). Without the last-minute agreement between the EU and the UK of December 24, 2020 (Trade and Cooperation Agreement, TCA), exports from the remaining EU mem-ber countries to the UK would have become subject to tariffs according to World Trade Organization standards (WTO-Scenario) as of January 1, 2021.
Abstract
We use the World Input–Output Database (WIOD) combined with regional sectoral employment data to estimate the potential regional employment effects of interna‑tional trade barriers. We study the case of a no‑deal Brexit in which imports to the United Kingdom (UK) from the European Union (EU) would be subject to tariffs and non‑tariff trade costs. First, we derive the decline in UK final goods imports from the EU from industry‑specific international trade elasticities, tariffs and non‑tariff trade costs. Using input–output analysis, we estimate the potential output and employment effects for 56 industries and 43 countries on the national level. The absolute effects would be largest in big EU countries which have close trade relationships with the UK, such as Germany and France. However, there would also be large countries outside the EU which would be heavily affected via global value chains, such as China, for exam‑ple. The relative effects (in percent of total employment) would be largest in Ireland followed by Belgium. In a second step, we split up the national effects on the NUTS‑2 level for EU member states and additionally on the county (NUTS‑3) level for Ger‑many. The share of affected workers varies between 0.03% and 3.4% among European NUTS‑2 regions and between 0.15% and 0.4% among German counties. A general result is that indirect effects via global value chains, i.e., trade in intermediate inputs, are more important than direct effects via final demand.
Keywords: Brexit, Employment, European Union, International trade, Tariffs, Trade barriers
JEL Classification: C67, D57, F16, R15
Open Access
© The Author(s) 2021. This article is licensed under a Creative Commons Attribution 4.0 International License, which permits use, sharing, adaptation, distribution and reproduction in any medium or format, as long as you give appropriate credit to the original author(s) and the source, provide a link to the Creative Commons licence, and indicate if changes were made. The images or other third party material in this article are included in the article’s Creative Commons licence, unless indicated otherwise in a credit line to the material. If material is not included in the article’s Creative Commons licence and your intended use is not permitted by statutory regulation or exceeds the permitted use, you will need to obtain permission directly from the copyright holder. To view a copy of this licence, visit http:// creat iveco mmons. org/ licen ses/ by/4. 0/.
RESEARCH
Brautzsch and Holtemöller Economic Structures (2021) 10:11 https://doi.org/10.1186/s40008‑021‑00241‑9
*Correspondence: oliver.holtemoeller@iwh‑halle.de 2 Martin Luther University Halle‑Wittenberg, 06108 Halle (Saale), GermanyFull list of author information is available at the end of the article

Page 2 of 25Brautzsch and Holtemöller Economic Structures (2021) 10:11
We analyze the regional employment effects of tariffs and non-tariff trade barriers. In general, tariffs reduce international trade and result in more unemployment (Furceri et al. 2018) and increase prices for consumers (Amiti et al. 2019). However, sign and magnitude of the effect can depend on the nature and the persistence of the trade shock. In this paper, we add to the literature on employment effects of trade shocks by stud-ying the employment effects in more than 40 countries (both EU member states and other countries) due to increasing trade costs in case of a Brexit, where there is no agree-ment in place for trade between the UK and the EU (WTO-Scenario). In particular, we show how the regional distribution of the effects within the EU can be estimated using regional sectoral employment data.
The UK is an important trading partner for EU-27 countries. After the U.S., the UK has been the second largest destination outside the EU of goods and services exports from EU-27 countries in 2020 accounting for about 14% of total EU-27 exports.1 A degrada-tion of the trading framework between EU-27 and UK may have important economic consequences on production and employment in EU-27 countries and regions. Because product groups are not all affected in the same way and because of regional agglomera-tion of production, regions within the EU-27 will face heterogeneous consequences from Brexit. It is important to understand this heterogeneity to develop appropriate policy responses.
If the negotiations between the EU and the UK had failed, a no-deal Brexit would have implied that exports from the remaining EU member countries to the UK would be sub-ject to tariffs. Even without formal tariffs, there are non-tariff trade costs, which con-sist of organizational cost (waiting, e.g.) at the borders and of substantial paperwork for the producers to document that rules of origin are complied to. Accordingly, the Brit-ish demand for EU products is likely to decrease due to these trade costs. We study the international potential employment effects of the decline in British import demand. To quantify these effects we take into account that production of final goods depends on intermediate inputs. Not only firms that directly export goods or services to UK are affected by Brexit but also firms that deliver intermediate inputs to these firms. Similar to studies which assess the impact of Brexit on production on the national level, we use input–output analysis in a first stage to quantify the countries and industries that are most affected by a decline in UK import demand from EU-27 due to a no-deal Brexit. Assuming that existing production structures and final goods prices need time to adapt to the changing trade framework between UK and EU-27, input–output analysis can be informative about potential short-term effects due to the decline in UK import demand from EU-27 and thereby complement results from general-equilibrium models which in general are more informative about the long-run.
British firms are also affected themselves due to their participation in global value chains. The results that we report for the UK only refer to the effects of less intermediate input production for foreign firms that export to the UK. It should be stressed that the results that we present are partial effects of a negative trade shock. We do not consider macroeconomic general equilibrium effects. We do not aim to estimate the total effects
1 https:// ec. europa. eu/ euros tat/ stati stics- expla ined/ index. php/ Extra- EU_ trade_ in_ goods.
Page 3 of 25Brautzsch and Holtemöller Economic Structures (2021) 10:11
of Brexit on employment in the UK or in any other country. Trade diversion is also not considered. Moreover, it is not only international trade in goods and services that will be affected by Brexit.2 Overall, our results are more informative for the EU-27 countries than for the UK, because the aspects that are not covered here are much more important for the UK than for the EU-27 countries.
We use the World Input–Output Database (WIOD) to document (i) which industries, (ii) in which countries will be affected most by a decline of British imports from EU member countries and (iii) what the according regional and sectoral employment effects will be. For the EU, we provide a regional breakdown on the NUTS-2 level; for Germany, we additionally provide a detailed regional breakdown on the NUTS-3 (county) level. Chen et al. (2018) also provide a regional breakdown of Brexit exposure on the NUTS-2 level; however, they do not look at employment but only at GDP and labour income, which can be directly inferred from the World Input–Output Database. Our contribu-tion is to combine WIOD with regional and sectoral employment data.
The paper is organized as follows. First, we describe the data and our methodology in Sect. 2. Then, we explain the results by country, by industry and by region in Sect. 3. Finally, we provide conclusions in Sect. 4.
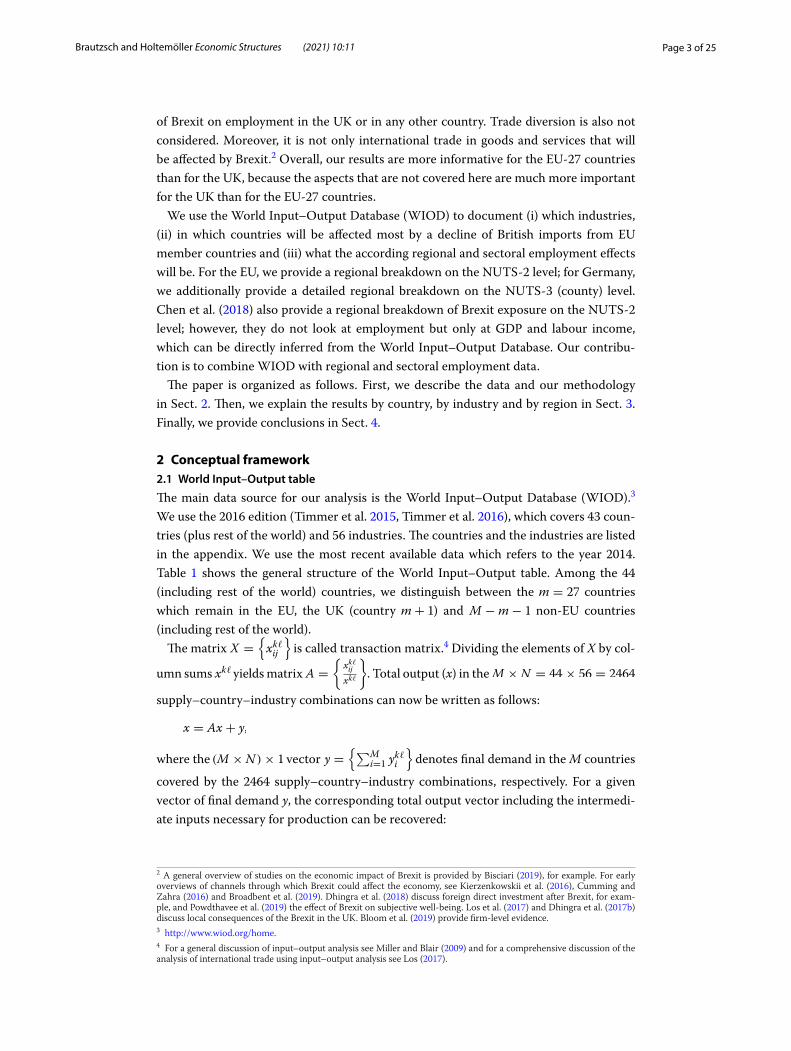
2 Conceptual framework2.1 World Input–Output table
The main data source for our analysis is the World Input–Output Database (WIOD).3 We use the 2016 edition (Timmer et al. 2015, Timmer et al. 2016), which covers 43 coun-tries (plus rest of the world) and 56 industries. The countries and the industries are listed in the appendix. We use the most recent available data which refers to the year 2014. Table 1 shows the general structure of the World Input–Output table. Among the 44 (including rest of the world) countries, we distinguish between the m = 27 countries which remain in the EU, the UK (country m+ 1 ) and M −m− 1 non-EU countries (including rest of the world).
The matrix X =
{
xkℓij
}
is called transaction matrix.4 Dividing the elements of X by col-
umn sums xkℓ yields matrix A =
{
xkℓij
xkℓ
}
. Total output (x) in the M × N = 44 × 56 = 2464
supply–country–industry combinations can now be written as follows:
where the (M × N )× 1 vector y ={
∑Mi=1 y
kℓi
}
denotes final demand in the M countries
covered by the 2464 supply–country–industry combinations, respectively. For a given vector of final demand y, the corresponding total output vector including the intermedi-ate inputs necessary for production can be recovered:
x = Ax + y,
2 A general overview of studies on the economic impact of Brexit is provided by Bisciari (2019), for example. For early overviews of channels through which Brexit could affect the economy, see Kierzenkowskii et al. (2016), Cumming and Zahra (2016) and Broadbent et al. (2019). Dhingra et al. (2018) discuss foreign direct investment after Brexit, for exam-ple, and Powdthavee et al. (2019) the effect of Brexit on subjective well-being. Los et al. (2017) and Dhingra et al. (2017b) discuss local consequences of the Brexit in the UK. Bloom et al. (2019) provide firm-level evidence.3 http:// www. wiod. org/ home.4 For a general discussion of input–output analysis see Miller and Blair (2009) and for a comprehensive discussion of the analysis of international trade using input–output analysis see Los (2017).

Page 4 of 25Brautzsch and Holtemöller Economic Structures (2021) 10:11
Tabl
e 1
Styl
ized
Wor
ld In
put–
Out
put t
able
Sour
ce: O
wn
exhi
bitio
n. xkℓ
ij d
enot
es in
term
edia
te in
puts
use
d in
cou
ntry
i an
d in
dust
ry j
and
supp
lied
by in
dust
ry ℓ
in c
ount
ry k
. ykℓ
i d
enot
es fi
nal d
eman
d in
cou
ntry
i fr
om in
dust
ry ℓ
in c
ount
ry k
. The
last
row
and
co
lum
n sh
ow c
olum
n an
d ro
w s
ums,
resp
ectiv
ely
Inte
rmed
iate
use
Fina
l use
Tota
l use
Coun
try
1.
Coun
try
MCo
untr
ies
Indu
stri
esIn
dust
ries
1.
N.
1.
N1
.M
(x)
Supp
lyEU
‑In
d. 1
x11
11
x11
1N
x11
M1
x11
MN
y11
1y11
Mx11
Coun
try
.
(1)
Ind.
Nx1N
11
x1N
1N
x1N
M1
x1N
MN
y1N
1y1N
Mx1N
EU‑
Ind.
1xm1
11
xm1
1N
xm1
M1
xm1
MN
ym1
1ym1
Mxm1
Coun
try
.
(m)
Ind.
NxmN
11
xmN
1N
xmN
M1
xmN
MN
ymN
1ymN
MxmN
Uni
ted
Ind.
1xm+1,1
11
xm+1,1
1N
xm+1,1
M1
xm+1,1
MN
ym+1,1
1ym+1,1
Mxm+1,1
King
dom
.
( m+
1)In
d. N
xm+1,N
11
xm+1,N
1N
xm+1,N
M1
xm+1,N
MN
ym+1,N
1ym+1,N
Mxm+1,N
Non
‑EU
Ind.
1xm+2,1
11
xm+2,1
1N
xm+2,1
M1
xm+2,1
MN
ym+2,1
1ym+2,1
Mxm+2,1
Coun
try
.
( m+
2)
Ind.
Nxm+2,N
11
xm+2,N
1N
xm+2,N
M1
xm+2,N
MN
ym+2,N
1ym+2,N
Mxm+2,N
Non
‑EU
Ind.
1xM1
11
xM1
1N
xM1
M1
xM1
MN
yM1
1yM1
MxM,1
Coun
try
.
(M)
Ind.
NxMN
11
xMN
1N
xMN
M1
xMN
MN
yMN
1yMN
MxM,N
Valu
e ad
ded
by la
bour
and
cap
ital
Gro
ss o
utpu
t ( x′
)x11
x1N
xM,1
xM,N

Page 5 of 25Brautzsch and Holtemöller Economic Structures (2021) 10:11
where (I − A)−1 is called inverse Leontief matrix. Accordingly, changes in final demand �y affect total output:
2.2 British final import demand and EU gross output after Brexit
For both intermediate inputs and final use, the EU is quantitatively the most important trading partner of the UK. Figure 1 shows that the UK imports more goods and services from the EU than from all other trading partners together (exports to the UK by country are reported in Table 7 in the appendix).
The potential consequences of Brexit on British import demand from the remain-ing EU countries depend on the exit scenario.5 Without a formal agreement, trade between the UK and the EU would follow World Trade Organization rules after Brexit. This implies that tariffs would apply between the UK and the EU. Cars and car parts, for example, would be taxed at 10%. Agricultural tariffs are even higher. Average tariffs imposed on final goods imported to the UK are estimated to amount to 8.6% (Cappari-ello et al. 2018). Non-tariff costs would also increase.6 Higher import prices will lead to less import demand. We use the post-Brexit tariffs, trade elasticities and non-tariff trade barrier estimates provided by Cappariello et al. (2018) and Cappariello et al. (2020) to estimate the country-sector specific trade effects of tariffs and non-tariff trade bar-riers on final goods imported from the remaining EU countries to the UK. Denote the sector-specific tariff for final goods imports by τ ℓy , the absolute sector-specific trade elas-ticity by ǫℓ , and the sector-specific non-tariff trade barrier ad-valorem equivalent by µℓ
x = (I − A)−1y,
�x = (I − A)−1�y.
Fig. 1 UK imports from EU and non‑EU countries in 2014. Source: World Input–Output Database, data for 2014, and own calculations. NACE sectors are defined in Tables 5 and 6 in the appendix
5 IJtsma et al. (2018) provide insights in the position of the UK in global value chains and discuss the implications for the UK’s post-Brexit trade policy.6 Dhingra et al. (2017a) estimate the increase in non-tariff costs to amount to about 8% in case of a no-deal Brexit. This figure is also used in the Brexit simulations by Vandenbussche et al. (2019).

Page 6 of 25Brautzsch and Holtemöller Economic Structures (2021) 10:11
( ℓ = 1, . . . , 56) . Then, the change in final import demand triggered by a no-deal Brexit is given by
for k ∈{EU-27}. The according sector-specific percentage reductions in UK imports are provided in Tables 8 and 9 in the appendix. Averaging over all remaining EU countries and all industries, the reduction in UK imports of final demand goods from remaining EU countries amounts to 41% (see Table 10 in the appendix).
These magnitudes are a little bit lower than the long-run effects reported by Hantzsche et al. (2018) who estimate that a no-deal Brexit would reduce bilateral trade between the UK and the EU by 56% in the long-run and that about half of this effect would occur immediately. Other estimates of the change in UK imports have a similar order of mag-nitude; Dhingra et al. (2017a) report a short-run estimate of 34% (including intermediate inputs) based on a trade model which considers the respective tariffs to be expected in the various industries and Campos and Timini (2019) estimate from a gravity model that trade would drop by 30%. Vandenbussche et al. (2019) also use WIOD data and derive the change in trade flows from sector-specific trade elasticities and the change in (tar-iff and non-tariff) trade barriers which results in substantially larger effects than our approach.
2.3 Employment effects
To quantify the employment effects that are associated with changes in total output ( �x ) we use employment data from the Social–Economic Accounts provided by the World Input–Output Database.7 Similar to Los et al. (2015) and Feenstra and Sasahara (2018), we construct coefficients bkℓ which indicate how many employed persons produce one unit of output in a given industry, using employment by country and industry ( nkℓ):
and a corresponding (k × ℓ)× 1 vector b ={
bkℓ}
. The change in employment by coun-try and industry triggered by a decline in British final imports from remaining EU mem-ber countries including all effects through provision of intermediate inputs is given by:
where ∗ denotes elementwise multiplication.The employment effect can be decomposed into a direct and an indirect effect. The
direct effect refers to the first-round effect of lower British imports without taking into account that affected firms will demand fewer intermediate inputs from other firms. The direct employment effect is then given by
�ykℓm+1 = −
(
ǫℓ × τ ℓy +µℓ
1+ µℓ
)
× ykℓm+1,
bkℓ =nkℓ
xkℓ
�b = b ∗�x,
7 A different approach is followed by Vandenbussche et al. (2019) who apply employment elasticities which measure the drop in employment after a 1% decrease in value added.

Page 7 of 25Brautzsch and Holtemöller Economic Structures (2021) 10:11
Finally, we can calculate the indirect effect:
2.4 Regional disaggregation
Using the distribution of employment by industry, we allocate the industry-specific employment effects to the NUTS-2 regions and, for Germany, to its 401 German coun-ties. However, employment by industry and region is only available for more general sectors not for the 56 industries covered by the World Input–Output Database. Employ-ment data for NUTS-2 regions is available for sectors A, B–E, F, G–I, J, K, L, M–N, O–Q, R–U from Eurostat and for sectors A, B–E, F, G–J, K–N, O–T on the German county level from the working group “Regional Accounts” of the statistical offices of the 16 German states, the Federal Statistical Office and the German Association of Cities and Towns. We group the 56 industries accordingly.8
Let the number of affected employed persons in a sub-country region k and industry ℓ be denoted by nkℓ and the total number of affected employed persons in the sectors A, B–E, F, ... by n·ℓ . Then, the number of affected employed persons in a region is given by
where wkℓ is the share of region k in total employment in industry ℓ . Finally, the corre-sponding share of affected persons in region k is nkℓ/nk , where nk denotes total employ-ment in region k.
3 Results and discussion3.1 Output effects by country
Output effects of the decline in British imports are shown in Table 2. The results fall within the range of previous studies. For Germany, for example, Vandenbussche et al. (2019) estimate a loss in value added due to a no-deal Brexit of 1.76%, while our results indicate a loss in gross output of 0.61% and in value added of 0.49%, respectively. Fel-bermayr et al. (2017) discuss the effects of Brexit on individual industries and estimate a no-deal-Brexit-induced decline in German GDP by about 0.2%. Note that direct effects for non-EU countries (including UK) are zero, because the respective trade regimes do not change after Brexit. However, non-EU countries are affected via intermediate inputs delivered to firms in EU countries which export goods and services to the UK.
3.2 Potential employment effects by country
If final import demand from the UK declines by 41% as implied by sector-specific elas-ticities and increased trading costs, then in total about one million employed persons are affected in 43 countries (without rest of the world), of which only 280,000 persons
�bD = b ∗�y.
�bInd = �b−�bD.
nkℓ = n·ℓ × wkℓ,
8 The NUTS-2 level employment data published by Eurostat does not sum up to the same country–industry employ-ment figures in the World Input–Output Database. Therefore, we scale data on the NUTS-2 level by country–industry-specific factors to yield identical sums on the country–industry level for both data sources.

Page 8 of 25Brautzsch and Holtemöller Economic Structures (2021) 10:11
Table 2 Output effects of a decline in UK import demand for final goods from the EU (no‑deal Brexit) by country
The table shows estimated direct and indirect output effects of a decline in British final goods imports due to tariffs and non‑tariff trade costs after a no‑deal Brexit derived from input–output analysis. General‑equilibrium effects and other relevant channels such as trade diversion are not included. Source: World Input–Output Database, data for 2014, own calculations
Country Direct Indirect Total Total
In relation to gross output (in %) In relation to value added (in%)
AUS 0.00 0.01 0.01 0.01
AUT 0.10 0.21 0.31 0.24
BEL 0.46 0.37 0.83 0.62
BGR 0.07 0.16 0.23 0.20
BRA 0.00 0.02 0.02 0.01
CAN 0.00 0.01 0.01 0.01
CHE 0.00 0.08 0.08 0.07
CHN 0.00 0.02 0.02 0.01
CYP 0.15 0.44 0.59 0.47
CZE 0.26 0.42 0.68 0.52
DEU 0.29 0.32 0.61 0.49
DNK 0.28 0.26 0.54 0.39
ESP 0.21 0.24 0.45 0.31
EST 0.06 0.12 0.18 0.16
FIN 0.04 0.11 0.16 0.12
FRA 0.18 0.22 0.40 0.30
GBR 0.00 0.08 0.08 0.07
GRC 0.06 0.06 0.13 0.11
HRV 0.09 0.13 0.22 0.21
HUN 0.22 0.34 0.56 0.42
IDN 0.00 0.02 0.02 0.01
IND 0.00 0.01 0.01 0.01
IRL 1.82 0.56 2.38 1.87
ITA 0.15 0.24 0.38 0.29
JPN 0.00 0.01 0.01 0.01
KOR 0.00 0.03 0.03 0.02
LTU 0.11 0.15 0.27 0.22
LUX 0.15 0.34 0.50 0.39
LVA 0.06 0.13 0.19 0.16
MEX 0.00 0.01 0.01 0.01
MLT 4.25 1.73 5.98 5.09
NLD 0.29 0.34 0.63 0.51
NOR 0.00 0.08 0.08 0.08
POL 0.23 0.35 0.58 0.50
PRT 0.17 0.20 0.37 0.26
ROU 0.09 0.18 0.28 0.24
RUS 0.00 0.04 0.04 0.04
SVK 0.44 0.46 0.90 0.64
SVN 0.06 0.20 0.26 0.21
SWE 0.11 0.19 0.30 0.25
TUR 0.00 0.06 0.06 0.05
TWN 0.00 0.04 0.04 0.03
USA 0.00 0.02 0.02 0.02
EU‑27 0.25 0.27 0.53 0.40

Page 9 of 25Brautzsch and Holtemöller Economic Structures (2021) 10:11
in firms within the European Union that directly export final goods to the UK. About 730,000 persons will be affected by second-round effects that hit firms delivering inter-mediate inputs.
The overall effect on absolute employment is largest for Germany (Fig. 2a), where about 176,000 persons are potentially affected (see also Table 3).
The absolute effect is also relatively large for China (about 91,000 persons) although there are no direct effects, because China is not a member country of the EU. However, China will be affected via intermediate inputs of firms that export to the UK. Relative to total employment, Malta and Ireland are heavily affected. In these two countries, exports to the UK amount to 13.5% (Malta) and 7.3% (Ireland) of total production (see Table 7 in the appendix). In Malta, the reduction of trade with the UK may potentially affect 3.4% and in Ireland 1.9% of all employed persons (Fig. 2b).
Overall, the variation in the relative employment effects is mainly driven by the het-erogeneity in the output effects: in a scatter plot (Fig. 3) of relative total-output effect and relative employment effect, the observations lie very close to a fitted regression line.
In countries above the regression line, the employment effect is relatively large com-pared to the output effect; this implies that the affected sectors exhibit a relatively low labor productivity. On the other hand, in countries below the regression line, labor
0
50
100
150
DE
UC
HN
FRA
PO
LIT
AIN
DE
SP
NLD IRL
BE
LU
SA
CZE
RO
UID
NG
BR
BR
AR
US
PR
TH
UN
TUR
SV
KS
WE
DN
KAU
TB
GR
MLT
JPN
GR
CTW
NKO
RH
RV
CH
ELT
UFI
NC
AN
ME
XS
VN
CY
PLV
ALU
XN
OR
ES
TAU
S
1000
per
sons
Indirect Direct
Employment effects(a)
0
50
100
150
DE
UC
HN
FRA
PO
LIT
AIN
DE
SP
NLD IRL
BE
LU
SA
CZE
RO
UID
NG
BR
BR
AR
US
PR
TH
UN
TUR
SV
KS
WE
DN
KAU
TB
GR
MLT
JPN
GR
CTW
NKO
RH
RV
CH
ELT
UFI
NC
AN
ME
XS
VN
CY
PLV
ALU
XN
OR
ES
TAU
S
1000
per
sons
Indirect Direct
Employment effects(b)
Fig. 2 Potential employment effects of a decline in UK import demand for final goods from the EU (no‑deal Brexit). a Absolute effect and b Relative effect. The figures shows estimated direct and indirect employment effects of a decline in British final goods imports due to tariffs and non‑tariff trade costs after a no‑deal Brexit derived from input–output analysis. General‑equilibrium effects and other relevant channels such as trade diversion are not included. Source: World Input–Output Database, data for 2014, and own calculations

Page 10 of 25Brautzsch and Holtemöller Economic Structures (2021) 10:11
Table 3 Potential employment effects of a decline in UK import demand for final goods from the EU (no‑deal Brexit)
The table shows estimated direct and indirect output effects of a decline in British final goods imports due to tariffs and non‑tariff trade costs after a no‑deal Brexit derived from input–output analysis. General‑equilibrium effects and other relevant channels such as trade diversion are not included. Source: World Input–Output Database, data for 2014, own calculations
Country Affected persons Total Share of affected persons
Direct (1000 pers.)
Indirect (1000 pers.)
Sum (1000 pers.)
Employment (1000 pers.)
Direct (%) Indirect (%) Sum (%)
AUS 0.000 0.751 0.751 11,863 0.000 0.006 0.006
AUT 2.773 6.624 9.397 4268 0.065 0.155 0.220
BEL 13.338 14.837 28.175 4547 0.293 0.326 0.620
BGR 2.401 5.857 8.258 3602 0.067 0.163 0.229
BRA 0.000 18.711 18.711 104,029 0.000 0.018 0.018
CAN 0.000 2.298 2.298 18,449 0.000 0.012 0.012
CHE 0.000 3.129 3.129 5084 0.000 0.062 0.062
CHN 0.000 90.862 90.862 858,368 0.000 0.011 0.011
CYP 0.431 1.082 1.513 357 0.121 0.303 0.424
CZE 7.906 17.813 25.719 5111 0.155 0.349 0.503
DEU 63.068 113.281 176.349 42,706 0.148 0.265 0.413
DNK 4.505 5.805 10.310 2765 0.163 0.210 0.373
ESP 23.463 32.456 55.918 17,966 0.131 0.181 0.311
EST 0.411 0.572 0.983 620 0.066 0.092 0.159
FIN 0.726 2.091 2.818 2502 0.029 0.084 0.113
FRA 31.536 49.104 80.640 27,295 0.116 0.180 0.295
GBR 0.000 21.754 21.754 30,726 0.000 0.071 0.071
GRC 1.622 2.378 4.000 3965 0.041 0.060 0.101
HRV 1.848 1.887 3.736 1569 0.118 0.120 0.238
HUN 5.420 10.251 15.671 4235 0.128 0.242 0.370
IDN 0.000 22.484 22.484 168,808 0.000 0.013 0.013
IND 0.000 59.128 59.128 658,776 0.000 0.009 0.009
IRL 26.168 9.356 35.524 1914 1.367 0.489 1.856
ITA 23.917 48.262 72.179 24,371 0.098 0.198 0.296
JPN 0.000 5.112 5.112 61,232 0.000 0.008 0.008
KOR 0.000 3.861 3.861 24,446 0.000 0.016 0.016
LTU 1.148 1.738 2.886 1319 0.087 0.132 0.219
LUX 0.367 0.996 1.364 403 0.091 0.247 0.338
LVA 0.411 1.019 1.430 900 0.046 0.113 0.159
MEX 0.000 2.283 2.283 38,997 0.000 0.006 0.006
MLT 3.296 3.181 6.478 190 1.735 1.674 3.409
NLD 15.484 22.897 38.381 8727 0.177 0.262 0.440
NOR 0.000 1.137 1.137 2747 0.000 0.041 0.041
POL 29.122 49.445 78.567 15,577 0.187 0.317 0.504
PRT 7.133 8.543 15.676 4546 0.157 0.188 0.345
ROU 8.423 14.844 23.267 8805 0.096 0.169 0.264
RUS 0.000 17.501 17.501 74,286 0.000 0.024 0.024
SVK 4.158 7.418 11.577 2227 0.187 0.333 0.520
SVN 0.438 1.490 1.928 941 0.047 0.158 0.205
SWE 4.044 7.045 11.090 4750 0.085 0.148 0.233
TUR 0.000 14.249 14.249 32,326 0.000 0.044 0.044
TWN 0.000 3.998 3.998 20,207 0.000 0.020 0.020
USA 0.000 26.222 26.222 155,769 0.000 0.017 0.017
EU‑27 283.556 440.273 723.832 196,178 0.145 0.224 0.367

Page 11 of 25Brautzsch and Holtemöller Economic Structures (2021) 10:11
productivity in affected sectors is high, as in Slovakia, for example, where manufacturing of cars is the most affected sector.
3.3 Potential employment effects by industry
Which industries are affected most varies from country to country (see Table 11 in the appendix). Figure 4 shows country-specific heat maps of the employment effects. Light colored squares indicate that the effect is relatively small in an industry, while dark colored squares indicate a relatively large effect (based on the absolute total employment effect by country and industry).
In some countries, such as Bulgaria or Brazil, for example, agriculture is heavily affected. In other countries, such as Czech Republic and Germany, the effects are larg-est in manufacturing industries. In France and in the Netherlands, wholesale trade shows the strongest exposure. In the United States, administrative and support ser-vices are strongly affected. Note that the UK itself is also affected due to intermediate inputs exported by UK firms to non-UK firms which deliver to firms exporting from the remaining EU to the UK directly or indirectly via global value chains.
AUS
AUT
BEL
BGR
BRACAN
CHE
CHN
CYP
CZE
DEU
DNK
ESP
EST
FIN
FRA
GBRGRC
HRV
HUN
IDNIND
ITA
JPNKOR
LTU
LUX
LVA
MEX
NLD
NOR
POL
PRT
ROU
RUS
SVK
SVNSWE
TURTWNUSAUUUUUUUUUUUUUUUUUUUUUUUUUUUUUUUUUUUUUUUUUUUUUUUUUUUUUUUUUUUUUUUUUUUUUUUUUUUUUUUUUUUUUUUUR
CH
ST
FIN
GBRCHECHE
GRCRFF
SSSTSTSS ATTTT
AUTTUAA
ELL
CYP
CZECZE
DEYPYP
DNKDN
ESPFRA
NKNKNN
TFAFRFRFF
LUU
NLDL
RU
SVNSVTUTU WEAAUTUT
TURNONOWAATRRRRRARARARAUUAAAARRRRRRRRRRRRRRRRRRRRRRRRRRRRRRRRRRRRRRRRRRRRRRRRRUUUUUUUUUUUUUUUUUUUUUUUUUUUUUUUUUUUUUUUUUUUUUUUUUUUUUUUUUUUUUUUUUUUUUUUUUUUUUUSUUSUUSUSUSSSSUUUUSUSSSSSSSUUUUUUUUUUUUUUUUSUUSUUSUUSUSSSSUUUUSSSSSSSSUUUUUUUUUUUUSUUSUSUUSSSSUUUUSSSSSSSSUUUUUUUUUUUUUUUUUUUSSSSSSSSSSSSSSSSSSSSSSRRRRRRRRRRRRRRRRRRRRRRRRRRRRRRRRRRRRRRRRRRRRRRRRRRRRRRRRRRRRRRRRRRRRRRRRRRRRRRRRRRRRRRRRRRRRRRRRRRRRRRRRRRRRRRRRRRRRRRRRRRRRUSUUSUUSSUUUUUUUUUUUUUUUUUUUUUUUUUSSSSUUUUUUUUUUUUUUUUUUUUURRRRRRRRRRRRRRRRRRRRRRRRRRRRRRRRRRRRRRRRRRRRRRRRRRRRRRRRRRRRRRRRRRRRRRRRRRRRRRRRRRRRRRRRRRRRRRRRRRRRRRRRRRRRRRRRSSSSSSSSSSSSSSSSSSSSSSSSSSSSSSSSSSSSSSSSSSSSSSSSSSSSSSSSSSSRRRRRRRRRRRRRRRRRRRRRRRRRRRRRRRRRRRRRRRRRRRRRRRRRRRRRRRRRRRSSSSSSSSAAAAAAAAUSUUSUUSUSUSSSSUUUUSUSSSSSSSUUUUUUUUUUUUUUUUSUUSUUSUUSUSSSSUUUUUSUSSSSSSSUUUUUUUUUUUUUUUUUSSSSSSSSSSSSSSSSSSSSSSSSSSSSUUUUUUUUUUUUUUUUUUUUUUUUUUUUUUUUUUUUUUUUUUUUUSSSSSSSSSSSSSSSSSSSSSSSSSSSSSSSSSSSSSSSSSSSSSSSSSSSSSSSSSSSSSSSSSSSSSSSSSSSSSSSSSSSSSSSSSSSSSSSSSSSSSSSSSSSSSSSSSSSSSSSSSSSSSSRARAAARAARARARARAAAARARARARAARARRARRARARAAAARARRARAARAARARRARRARAAARAARARAARAARARAARRRRRRRRRAAAARARARRRRRRRRRAARRARRAARRAARRRRRRRRRRAARRAARRAARRAARRRRRRRRRRAARRARRAARRAARRRRRRRRRRRRRRRRRRRRRRAARRAARRARRAARRRRRRRRRRRRRRRRRRRRRRAAAA
0.00
0.25
0.50
0.75
1.00
0.00 0.25 0.50 0.75 1.00Total output (%)
Em
ploy
men
t (%
)
Fig. 3 Negative output and potential employment effects of a decline in UK import demand for final goods from the EU (no‑deal Brexit). Source: World Input–Output Database, data for 2014, and own calculations. We restrict the range to (0,1) on both axes which implies that two outliers, Malta (output: 5.98%, employment: 3.41%) and Ireland (output: 2.38%, employment: 1.86%), are not shown. However, these two countries are not excluded from the calculation of the regression line

Page 12 of 25Brautzsch and Holtemöller Economic Structures (2021) 10:11
The industry-specific relative effects are large in Belgium, Malta and Ireland. While many sectors are strongly affected in Ireland and Malta, manufacturing is strongly affected in Belgium (manufacturing of cars 7.5%, textiles 4.2%, other transport equip-ment 4.0%). In most other countries, relative effects are large in some specific industries, such as the car industry in Germany (3.2%) and Spain (3.6%) or manufacturing of textiles in the Netherlands (3.8%) and in Sweden (3.3%).9
3.4 Regional employment effects
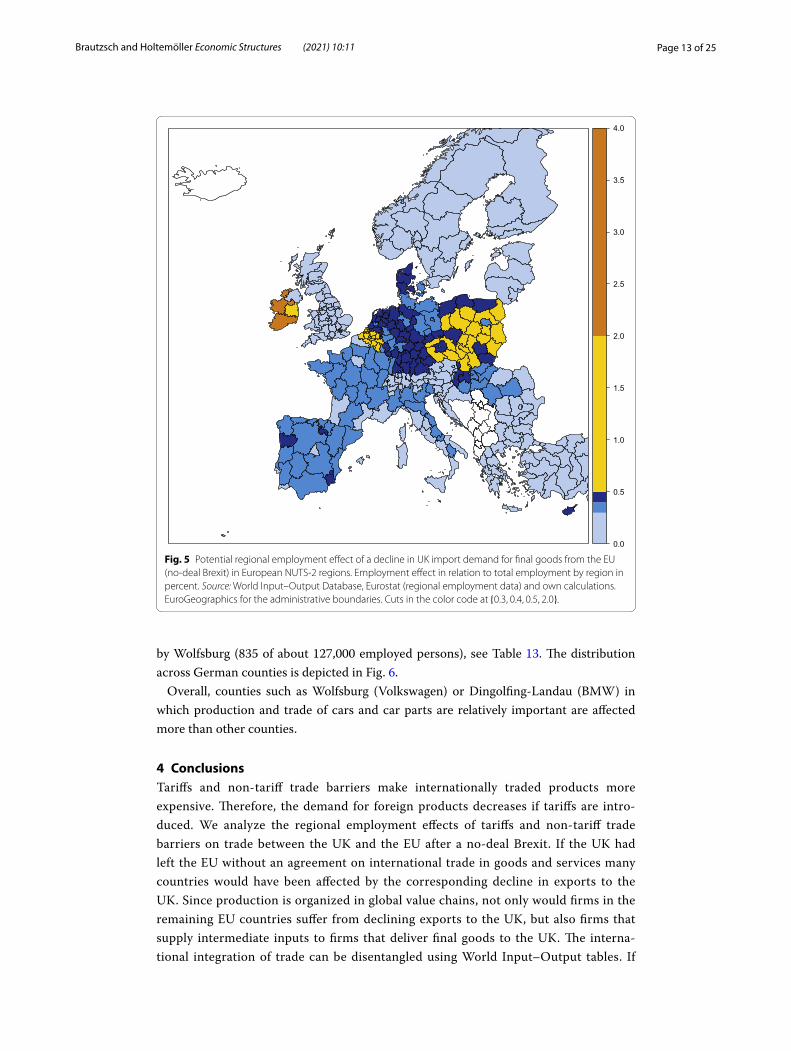
The share of affected workers if final import demand by the UK decreases due to a no-deal Brexit varies between 0.03% and 3.4% among European NUTS-2 regions and between 0.15% and 0.4% among German counties. Besides Malta and the regions in Ireland, Belgian provinces, the region Západné Slovensko (sector B–E) in the Slovak Republic, the regions Severovýchod (B–E), Strední Morava (B–E) and Jihozápad (B–E) in the Czech Republic as well as regions in Poland exhibit a relatively large employ-ment exposure (see Table 12 in the appendix). Overall, while in Malta, Ireland, Belgium, Slovak Republic and Poland almost the whole country exhibits a similar exposure, the effects are more concentrated in some regions in Italy and Spain, see Fig. 5.
Within Germany, the county which is affected most in terms of relative employ-ment effect is Dingolfing-Landau (449 of about 67,000 employed persons) followed
AUSAUTBELBGRBRACANCHECHNCYPCZEDEUDNKESPESTFIN
FRAGBRGRCHRVHUNIDNINDIRLITA
JPNKORLTULUXLVA
MEXMLTNLDNORPOLPRTROURUSSVKSVNSWETURTWNUSA
1 2 3 4 5 6 7 8 9 10 11 12 13 14 15 16 17 18 19 20 21 22 23 24 25 26 27 28 29 30 31 32 33 34 35 36 37 38 39 40 41 42 43 44 45 46 47 48 49 50 51 52 53 54 55 56Industry
Cou
ntry
1020304050
Rank
Fig. 4 Absolute total potential employment effects of a decline in UK import demand for final goods from the EU (no‑deal Brexit) by country and industry. Light color: relative small effect, dark color: relative large effect. Based on ranked absolute total (direct and indirect) employment effects by country of a decline in British final goods imports due to tariffs and non‑tariff trade costs after a no‑deal Brexit derived from input–output analysis. General‑equilibrium effects and other relevant channels such as trade diversion are not included. Source: World Input–Output Database, data for 2014, and own calculations
9 Aichele and Felbermayr (2015) also find that the car industry is the most-affected industry in Germany.
Page 13 of 25Brautzsch and Holtemöller Economic Structures (2021) 10:11
by Wolfsburg (835 of about 127,000 employed persons), see Table 13. The distribution across German counties is depicted in Fig. 6.
Overall, counties such as Wolfsburg (Volkswagen) or Dingolfing-Landau (BMW) in which production and trade of cars and car parts are relatively important are affected more than other counties.
4 ConclusionsTariffs and non-tariff trade barriers make internationally traded products more expensive. Therefore, the demand for foreign products decreases if tariffs are intro-duced. We analyze the regional employment effects of tariffs and non-tariff trade barriers on trade between the UK and the EU after a no-deal Brexit. If the UK had left the EU without an agreement on international trade in goods and services many countries would have been affected by the corresponding decline in exports to the UK. Since production is organized in global value chains, not only would firms in the remaining EU countries suffer from declining exports to the UK, but also firms that supply intermediate inputs to firms that deliver final goods to the UK. The interna-tional integration of trade can be disentangled using World Input–Output tables. If
0.0
0.5
1.0
1.5
2.0
2.5
3.0
3.5
4.0
Fig. 5 Potential regional employment effect of a decline in UK import demand for final goods from the EU (no‑deal Brexit) in European NUTS‑2 regions. Employment effect in relation to total employment by region in percent. Source: World Input–Output Database, Eurostat (regional employment data) and own calculations. EuroGeographics for the administrative boundaries. Cuts in the color code at {0.3, 0.4, 0.5, 2.0}.

Page 14 of 25Brautzsch and Holtemöller Economic Structures (2021) 10:11
final import demand from the UK declines by 41% as implied by sector-specific elas-ticities and increased trading costs, then in total about one million employed persons are affected in 43 countries (without rest of the world), of which only 280,000 persons in firms within the European Union that directly export final goods to the UK. About 730,000 persons would be be affected by second-round effects that hit firms deliver-ing intermediate inputs.
The motor vehicle industry would be the most affected industry (both manufac-ture and trade). In Germany alone, about 35,600 persons in the motor vehicle indus-try (2.1% of total employment in motor vehicle manufacturing and trade) would be directly or indirectly affected. Accordingly, within Germany important motor vehicle
0.25
0.30
0.35
0.40
0.45
0.50
0.55
0.60
0.65
Fig. 6 Potential regional employment effects of a decline in UK import demand for final goods from the EU (no‑deal Brexit) in German counties. Employment effect in relation to total employment by county in percent. Source: World Input–Output Database, VGR der Länder (regional employment data) and own calculations.

Page 15 of 25Brautzsch and Holtemöller Economic Structures (2021) 10:11
manufacturing places would be most exposed to employment risks after a no-deal Brexit. However, there would also be considerable absolute effects in non-EU coun-tries, such as China or India. The relative effect (in relation to total employment) in these countries would be rather low.
Our quantitative effects depend crucially on the assumption about the decline in UK final demand from the EU. The actual decline can be smaller or larger than assumed here. The results from the input–output analysis are linear in the size of the initial shock. If the decline in UK final demand from the EU is smaller, then our abso-lute figures and shares in total employment have to be adjusted proportionally. The relative distribution of the effects over countries and industries, however, would be unaffected by this. This also holds true for the regional distribution within countries.
AppendixSee Tables 4, 5, 6, 7, 8, 9, 10, 11, 12, 13.
Table 4 Countries in the World Input–Output Database
Remaining EU member countries after Brexit are marked by an asterisk
Acronym Country Acronym Country Acronym Country
AUS Australia FRA France* MLT Malta*
AUT Austria* GBR United Kingdom NLD Netherlands*
BEL Belgium* GRC Greece* NOR Norway
BGR Bulgaria* HRV Croatia* POL Poland*
BRA Brazil HUN Hungary* PRT Portugal*
CAN Canada IND India ROU Romania*
CHE Switzerland IDN Indonesia RUS Russian Federation
CHN China IRL Ireland* SVK Slovakia*
CYP Cyprus* ITA Italy* SVN Slovenia*
CZE Czech Republic* JPN Japan SWE Sweden*
DEU Germany* KOR South Korea TUR Turkey
DNK Denmark* LTU Lithuania* TWN Taiwan
ESP Spain* LUX Luxembourg* USA United States
EST Estonia* LVA Latvia*
FIN Finland* MEX Mexico

Page 16 of 25Brautzsch and Holtemöller Economic Structures (2021) 10:11
Table 5 Industry classification (A–F)
Source: European Commission (2008)
No. NACE Code Description
A Agriculture, forestry and fishing
1 A01 Crop and animal production, hunting and related service activities
2 A02 Forestry and logging
3 A03 Fishing and aquaculture
B, C, D, E Manufacturing, mining and quarrying and other industry
4 B Mining and quarrying
5 C10–C12 Manufacture of food products, beverages and tobacco products
6 C13–C15 Manufacture of textiles, wearing apparel and leather products
7 C16 Manufacture of wood and of products of wood and cork, except furniture; manufacture of articles of straw and plaiting materials
8 C17 Manufacture of paper and paper products
9 C18 Printing and reproduction of recorded media
10 C19 Manufacture of coke and refined petroleum products
11 C20 Manufacture of chemicals and chemical products
12 C21 Manufacture of basic pharmaceutical products and pharmaceutical preparations
13 C22 Manufacture of rubber and plastic products
14 C23 Manufacture of other non‑metallic mineral products
15 C24 Manufacture of basic metals
16 C25 Manufacture of fabricated metal products, except machinery and equipment
17 C26 Manufacture of computer, electronic and optical products
18 C27 Manufacture of electrical equipment
19 C28 Manufacture of machinery and equipment n.e.c.
20 C29 Manufacture of motor vehicles, trailers and semi‑trailers
21 C30 Manufacture of other transport equipment
22 C31_C32 Manufacture of furniture; other manufacturing
23 C33 Repair and installation of machinery and equipment
24 D35 Electricity, gas, steam and air conditioning supply
25 E36 Water collection, treatment and supply
26 E37–E39 Sewerage; waste collection, treatment and disposal activities; materials recovery; remediation activities and other waste management services
F Construction
27 F Construction

Page 17 of 25Brautzsch and Holtemöller Economic Structures (2021) 10:11
Table 6 Industry classification (G–U)
Source: European Commission (2008).
No. NACE code Description
G–T Trade and services
28 G45 Wholesale and retail trade and repair of motor vehicles and motorcycles
29 G46 Wholesale trade, except of motor vehicles and motorcycles
30 G47 Retail trade, except of motor vehicles and motorcycles
31 H49 Land transport and transport via pipelines
32 H50 Water transport
33 H51 Air transport
34 H52 Warehousing and support activities for transportation
35 H53 Postal and courier activities
36 I Accommodation and food service activities
37 J58 Publishing activities
38 J59_J60 Motion picture, video and television programme production, sound recording and music publishing activities; programming and broadcasting activities
39 J61 Telecommunications
40 J62_J63 Computer programming, consultancy and related activities; information service activities
41 K64 Financial service activities, except insurance and pension funding
42 K65 Insurance, reinsurance and pension funding, except compulsory social security
43 K66 Activities auxiliary to financial services and insurance activities
44 L68 Real estate activities
45 M69_M70 Legal and accounting activities; activities of head offices; management consultancy activities
46 M71 Architectural and engineering activities; technical testing and analysis
47 M72 Scientific research and development
48 M73 Advertising and market research
49 M74_M75 Other professional, scientific and technical activities; veterinary activities
50 N Administrative and support service activities
51 O84 Public administration and defense; compulsory social security
52 P85 Education
53 Q Human health and social work activities
54 R_S Other service activities
55 T Activities of households as employers; undifferentiated goods‑ and services‑producing activities of households for own use
56 U Activities of extraterritorial organizations and bodies

Page 18 of 25Brautzsch and Holtemöller Economic Structures (2021) 10:11
Table 7 Exports to the UK by country
Source: World Input–Output Database, intermediate and final use in destination country, data for 2014, own calculations
Country Exports to UK (Million USD)
Total exports (Million USD)
Total output (Million USD)
Share of exports to UK
In total exports(%)
In total output(%)
AUS 3,736 287,162 2,723,737 1.30 0.14
AUT 5,452 210,995 809,631 2.58 0.67
BEL 27,883 383,014 1,110,756 7.28 2.51
BGR 767 31,698 122,873 2.42 0.62
BRA 4,779 270,263 4,103,502 1.77 0.12
CAN 13,649 563,511 3,252,175 2.42 0.42
CHE 12,649 352,570 1,398,665 3.59 0.90
CHN 51,850 2,425,464 31,745,102 2.14 0.16
CYP 352 9,347 39,448 3.77 0.89
CZE 6,825 161,570 492,772 4.22 1.38
DEU 103,347 1,682,253 7,066,741 6.14 1.46
DNK 10,686 170,293 614,582 6.28 1.74
ESP 21,498 389,005 2,567,905 5.53 0.84
EST 458 18,266 54,483 2.50 0.84
FIN 4288 100,453 513,658 4.27 0.83
FRA 60,107 75,9654 5,020,134 7.91 1.20
GRC 1779 5,6261 375,244 3.16 0.47
HRV 548 23,269 97,419 2.35 0.56
HUN 4521 116,445 284,430 3.88 1.59
IDN 2056 210,599 1,714,343 0.98 0.12
IND 12,221 369,456 398,3527 3.31 0.31
IRL 37,295 262,751 509,477 14.19 7.32
ITA 33,780 588,585 4,075,402 5.74 0.83
JPN 9647 817,514 8,668,736 1.18 0.11
KOR 7848 697,935 3,403,854 1.12 0.23
LTU 1266 32,723 85,668 3.87 1.48
LUX 3209 118,439 211,968 2.71 1.51
LVA 669 14,719 64,726 4.54 1.03
MEX 2094 368,185 2,130,489 0.57 0.10
MLT 3914 13,420 28,915 29.16 13.53
NLD 43,525 575,068 1,671,177 7.57 2.60
NOR 25,676 188,131 835,079 13.65 3.07
POL 14,176 251,642 1,105,444 5.63 1.28
PRT 3805 76,633 414,281 4.97 0.92
ROU 2160 77,648 398,280 2.78 0.54
RUS 9321 493,789 3,381,079 1.89 0.28
SVK 4635 82,119 229,289 5.64 2.02
SVN 574 30,812 94,238 1.86 0.61
SWE 12,119 235,354 1,018,189 5.15 1.19
TUR 12,805 249,783 1,494,428 5.13 0.86
TWN 4896 369,923 1,220,629 1.32 0.40
USA 73,796 1,927,091 30,971,023 3.83 0.24

Page 19 of 25Brautzsch and Holtemöller Economic Structures (2021) 10:11
Table 8 Industry‑specific tariffs, elasticities, non‑tariff trade barriers, and reductions in trade volumes (A–F)
Source: Tariffs ( τ ℓ ) from Cappariello et al. (2018), Table B.8, elasticities ( ǫℓ ) and ad‑valorem non‑tariff trade barrier ( µℓ ) under WTO rule (MFN NTB) from Cappariello et al. (2020), Table 4. MFN NTB denotes by how much trade is inflated in the Single Market compared to non‑EU. Reduction in trade calculated as
(
ǫℓ × τ ℓ +µℓ
1+µℓ
)
No. NACE Code Tariff Tariff Elasticity MFN Reduction ReductionFinal (%) Intermediate (%) NTB (%) Final (%) Intermediate (%)
1 A01 7.8 1.0 1.96 47.0 47.3 33.9
2 A02 10.4 0.2 1.87 30.0 42.5 23.5
3 A03 10.0 4.2 3.58 3.0 38.7 17.9
4 B 0.0 0.0 3.58 3.0 2.9 2.9
5 C10–C12 18.7 11.2 1.63 34.0 55.9 43.6
6 C13–C15 9.9 6.2 3.58 10.0 44.5 31.3
7 C16 1.6 2.2 3.58 8.0 13.1 15.3
8 C17 1.6 0.0 1.04 33.0 26.5 24.8
9 C18 0.0 0.3 2.04 3.0 2.9 3.5
10 C19 0.0 2.4 6.04 6.0 5.7 20.2
11 C20 2.3 4.8 3.78 19.0 24.7 34.1
12 C21 0.0 0.7 7.63 17.0 14.5 19.9
13 C22 5.8 5.3 2.82 28.0 38.2 36.8
14 C23 10.1 3.1 1.42 35.0 40.3 30.3
15 C24 0.0 2.2 4.72 14.0 12.3 22.7
16 C25 3.1 2.8 1.84 35.0 31.6 31.1
17 C26 2.5 1.4 5.73 8.0 21.7 15.4
18 C27 2.7 2.5 6.42 14.0 29.6 28.3
19 C28 1.7 1.9 7.51 8.0 20.2 21.7
20 C29 10.0 5.9 4.39 19.0 59.9 41.9
21 C30 5.2 3.0 5.17 9.0 35.1 23.8
22 C31–C32 1.5 1.3 3.42 2.0 7.1 6.4
23 C33 0.0 0.0 1.56 117.0 53.9 53.9
24 D35 0.0 0.0 1.56 68.0 40.5 40.5
25 E36 0.0 0.0 1.56 3.0 2.9 2.9
26 E37–E39 0.0 0.0 1.56 56.0 35.9 35.9
27 F 0.0 0.0 1.56 74.0 42.5 42.5

Page 20 of 25Brautzsch and Holtemöller Economic Structures (2021) 10:11
Table 9 Industry‑specific tariffs, elasticities, non‑tariff trade barriers, and reductions in trade volumes (G–U)
Source: Tariffs ( τ ℓy and τ ℓx ) from Cappariello et al. (2018), Table B.8, elasticities ( ǫℓ ) and ad‑valorem non‑tariff trade barrier ( µℓ ) under WTO rule (MFN NTB) from Cappariello et al. (2020), Table 4. MFN NTB denotes by how much trade is inflated in the Single Market compared to non‑EU. Reduction in trade calculated as
(
ǫℓ × τ ℓ +µℓ
1+µℓ
)
No. NACE code Tariff Tariff Elasticity MFN Reduction ReductionFinal (%) Intermediate (%) NTB (%) Final (%) Intermediate (%)
28 G45 0.0 0.0 1.56 113.0 53.1 53.1
29 G46 0.0 0.0 1.56 94.0 48.5 48.5
30 G47 0.0 0.0 1.56 117.0 53.9 53.9
31 H49 0.0 0.0 1.56 50.0 33.3 33.3
32 H50 0.0 0.0 1.56 74.0 42.5 42.5
33 H51 0.0 0.0 1.56 29.0 22.5 22.5
34 H52 0.0 0.0 1.56 18.0 15.3 15.3
35 H53 0.0 0.0 1.56 44.0 30.6 30.6
36 I 0.0 0.0 1.56 45.0 31.0 31.0
37 J58 0.0 0.0 1.56 21.0 17.4 17.4
38 J59–J60 0.0 0.0 1.56 21.0 17.4 17.4
39 J61 0.0 0.0 1.56 15.0 13.0 13.0
40 J62–J63 0.0 0.0 1.56 72.0 41.9 41.9
41 K64 0.0 0.0 1.56 65.0 39.4 39.4
42 K65 0.0 0.0 1.56 45.0 31.0 31.0
43 K66 0.0 0.0 1.56 55.0 35.5 35.5
44 L68 0.0 0.0 1.56 41.0 29.1 29.1
45 M69–M70 0.0 0.0 1.56 23.0 18.7 18.7
46 M71 0.0 0.0 1.56 99.0 49.7 49.7
47 M72 0.0 0.0 1.56 37.0 27.0 27.0
48 M73 0.0 0.0 1.56 18.0 15.3 15.3
49 M74–M75 0.0 0.0 1.56 57.0 36.3 36.3
50 N 0.0 0.0 1.56 28.0 21.9 21.9
51 O84 0.0 0.0 1.56 28.0 21.9 21.9
52 P85 0.0 0.0 1.56 58.0 36.7 36.7
53 Q 0.0 0.0 1.56 32.0 24.2 24.2
54 R–S 0.0 0.0 1.56 119.0 54.3 54.3
55 T 0.0 0.0 1.56 45.0 31.0 31.0
56 U 0.0 0.0 1.56 28.0 21.9 21.9

Page 21 of 25Brautzsch and Holtemöller Economic Structures (2021) 10:11
Table 10 Decline in UK import demand for final goods from the EU (no‑deal Brexit) by country
Source: World Input–Output Database and own calculations
Country Reduction in exports to UK
In relation to all exports (in %) In relation to gross output (in %)
MLT 49.51 4.25
IRL 45.09 1.82
BEL 42.76 0.46
SVK 39.66 0.44
DEU 43.59 0.29
NLD 36.73 0.29
DNK 38.70 0.28
CZE 40.24 0.26
POL 38.60 0.23
HUN 35.23 0.22
ESP 45.37 0.21
FRA 37.70 0.18
PRT 40.64 0.17
LUX 35.94 0.15
CYP 38.45 0.15
ITA 36.36 0.15
SWE 28.73 0.11
LTU 21.82 0.11
AUT 36.19 0.10
ROU 36.37 0.09
HRV 40.69 0.09
BGR 32.06 0.07
SVN 27.95 0.06
GRC 36.01 0.06
EST 30.28 0.06
LVA 28.05 0.06
FIN 20.55 0.04
Total 40.64 0.25

Page 22 of 25Brautzsch and Holtemöller Economic Structures (2021) 10:11
Table 11 Potential employment effects of a decline in UK import demand for final goods from the EU (no‑deal Brexit) by country and industry (30 most affected country–industry combinations)
Ordered by absolute employment effect. Source: World Input–Output Database, data for 2014, own calculations
No. Country Industry Direct (1000 pers.)
Indirect (1000 pers.)
Sum (1000 pers.) Tot. Empl. (1000 pers.)
Share (%)
1 DEU 20 21.863 5.599 27.462 846 3.246
2 IND 1 0.000 24.232 24.232 253,883 0.010
3 CHN 1 0.000 15.233 15.233 175,119 0.009
4 DEU 50 0.259 14.738 14.997 3,010 0.498
5 POL 1 2.505 12.482 14.987 1,640 0.914
6 DEU 29 6.997 7.271 14.268 1,878 0.760
7 DEU 5 9.557 2.910 12.466 927 1.345
8 CHN 29 0.000 11.966 11.966 79,834 0.015
9 IRL 1 10.196 0.868 11.064 80 13.830
10 BRA 1 0.000 10.959 10.959 13,128 0.083
11 IDN 1 0.000 10.363 10.363 40,597 0.026
12 POL 30 6.107 4.164 10.271 1,430 0.718
13 FRA 29 5.449 4.243 9.691 1,110 0.873
14 ESP 1 5.340 3.983 9.324 667 1.398
15 ITA 6 5.691 3.475 9.166 515 1.780
16 IRL 5 8.411 0.109 8.521 54 15.779
17 FRA 50 0.814 7.520 8.334 2,059 0.405
18 FRA 1 1.705 6.500 8.205 715 1.148
19 DEU 28 0.979 7.121 8.100 824 0.983
20 FRA 5 6.047 2.027 8.074 607 1.330
21 USA 50 0.000 7.792 7.792 12,808 0.061
22 CHN 6 0.000 7.481 7.481 32,739 0.023
23 ITA 1 1.192 6.255 7.447 839 0.888
24 DEU 16 1.213 6.214 7.427 901 0.824
25 DEU 1 1.244 6.111 7.355 606 1.214
26 IND 6 0.000 7.291 7.291 21,927 0.033
27 DEU 30 0.629 6.569 7.199 3,209 0.224
28 DEU 19 3.672 3.496 7.168 1,129 0.635
29 POL 5 4.797 2.149 6.946 541 1.284
30 DEU 45 0.028 6.233 6.261 1,287 0.487

Page 23 of 25Brautzsch and Holtemöller Economic Structures (2021) 10:11
Table 12 Potential employment effects of a decline in UK import demand for final goods from the EU (no‑deal Brexit) by NUTS‑2 region (30 most affected regions)
Ordered by share of affected persons. Source: World Input–Output Database, Eurostat (regional employment data) and own calculations
No. NUTS-2 Country Region Affected persons (1000 pers.)
Total employment (1000 pers.)
Share of affected persons (%)
1 MT0 MLT Malta 6.478 190 3.409
2 IE4 IRL Northern and Western 8.009 335 2.385
3 IE5 IRL Southern 13.961 634 2.202
4 IE6 IRL Eastern and Midland 13.553 944 1.436
5 BE25 BEL Prov. West‑Vlaanderen 3.477 503 0.691
6 BE22 BEL Prov. Limburg (BE) 2.401 362 0.662
7 BE23 BEL Prov. Oost‑Vlaanderen 4.293 650 0.660
8 BE21 BEL Prov. Antwerpen 5.005 762 0.656
9 BE34 BEL Prov. Luxembourg (BE) 0.717 113 0.632
10 BE32 BEL Prov. Hainaut 2.726 455 0.598
11 BE31 BEL Prov. Brabant wallon 0.960 165 0.581
12 BE24 BEL Prov. Vlaams‑Brabant 2.859 494 0.579
13 BE33 BEL Prov. Liège 2.286 397 0.575
14 SK2 SVK Západné Slovensko 4.479 785 0.570
15 CZ5 CZE Severovýchod 3.986 717 0.556
16 PL92 POL Mazowiecki regionalny 6.256 1,136 0.551
17 CZ7 CZE Strední Morava 3.113 566 0.549
18 PL72 POL Swietokrzyskie 3.077 562 0.547
19 PL41 POL Wielkopolskie 7.076 1,310 0.540
20 BE10 BEL Région de Bruxelles‑Capitale 2.417 448 0.538
21 BE35 BEL Prov. Namur 1.035 193 0.535
22 PL82 POL Podkarpackie 4.076 763 0.534
23 CZ8 CZE Moravskoslezsko 2.994 562 0.532
24 PL84 POL Podlaskie 2.408 453 0.531
25 CZ3 CZE Jihozápad 3.165 596 0.531
26 PL71 POL Lódzkie 6.638 1,256 0.528
27 PL61 POL Kujawsko‑Pomorskie 4.000 767 0.521
28 PL81 POL Lubelskie 5.014 966 0.519
29 PL52 POL Opolskie 1.835 355 0.516
30 CZ6 CZE Jihovýchod 4.178 813 0.513

Page 24 of 25Brautzsch and Holtemöller Economic Structures (2021) 10:11
AcknowledgementsWe thank Martina Kämpfe, Axel Lindner and three anonymous reviewers for helpful comments.
Authors’ contributionsBoth authors have developed the research idea and the concept of the project together. Both authors have worked on the computer code for the calculations and have written parts of the manuscript. Both authors read and approved the final manuscript.
FundingThis project has been funded by the regular budget of the Halle Institute for Economic Research (IWH).
Availability of data and materialsThe data used for this project are publicly available and are described in section 2 Data and methodology.
Declarations
Competing interestsThe authors declare that they have no competing interests.
Table 13 Potential employment effects of a decline in UK import demand for final goods from the EU (no‑deal Brexit) in German counties (30 most affected counties)
Ordered by share of affected persons. Source: World Input–Output Database, data for 2014, VGR der Länder (regional employment data for 2014 as of August 2017) and own calculations
No. County Affected persons (1000 pers.)
Total employment (1000 pers.)
Share of affected persons (%)
1 Dingolfing‑Landau 449 67,339 0.667
2 Wolfsburg 835 127,082 0.657
3 Tuttlingen 517 83,025 0.622
4 Salzgitter 343 56,968 0.602
5 Enzkreis 464 79,546 0.583
6 Germersheim 340 58,924 0.577
7 Erlangen‑Höchstadt 345 59,896 0.577
8 Hohenlohekreis 397 69,060 0.574
9 Olpe 441 76,972 0.572
10 Ingolstadt 675 118,072 0.572
11 Heilbronn 940 164,491 0.571
12 Coburg 212 37,232 0.571
13 Biberach 601 105,286 0.570
14 Rastatt 640 113,006 0.566
15 Kronach 188 33,395 0.564
16 Donau‑Ries 442 79,760 0.554
17 Märkischer Kreis 1182 214,231 0.552
18 Unterallgäu 370 67,096 0.551
19 Böblingen 1223 222,007 0.551
20 Neustadt a.d.Waldnaab 209 38,039 0.548
21 Rottweil 409 74,578 0.548
22 Hof 261 47,707 0.546
23 Haßberge 213 39,142 0.544
24 Main‑Spessart 330 60,787 0.544
25 Saale‑Orla‑Kreis 219 40,305 0.543
26 Ludwigshafen am Rhein 669 123,478 0.542
27 Schweinfurt 354 65,896 0.538
28 Wartburgkreis 281 52,533 0.535
29 Bodenseekreis 640 120,470 0.531
30 Lindau (Bodensee) 227 42,759 0.531

Page 25 of 25Brautzsch and Holtemöller Economic Structures (2021) 10:11
Author details1 Halle Institute for Economic Research (IWH), Kleine Maerkerstrasse 8, 06108 Halle (Saale), Germany. 2 Martin Luther University Halle‑Wittenberg, 06108 Halle (Saale), Germany.
Received: 21 May 2019 Revised: 28 June 2021 Accepted: 1 July 2021
ReferencesAichele R, Felbermayr G (2015) Kosten und Nutzen eines Austritts des Vereinigten Königreichs aus der Europäischen Union.
Global Economic Dynamics, BertelsmannStiftung, GüterslohAmiti M, Redding SJ, Weinstein D (2019) The impact of the 2018 trade war on U.S. prices and welfare. NBER Working Paper
25672, National Bureau of Economic Research, CambridgeBisciari P (2019) A survey of the long‑term impact of Brexit on the UK and the EU27 economies. NBB Working Paper 366,
National Bank of Belgium, BrusselsBloom N, Bunn P, Chen S, Mizen P, Smietanka P, Thwaites G (2019) The impact of Brexit on UK firms. NBER Working Paper
26218, National Bureau of Economic Research, CambridgeBroadbent B, DiPace F, Drechsel T, Harrison R, Tenreyro S, (2019) The Brexit vote, productivity growth and macroeconomic
adjustments in the United Kingdom. CEPR Discussion Paper 13993, Centre for Economic Policy Research, LondonCampos RG, Timini J (2019) An estimation of the effects of Brexit on trade and migration. Banco de Espana Occasional Paper
1912, Banco de Espana, MadridCappariello R, Damjanovic M, Mancini M, Vergara Caffarelli F (2018) EU‑UK global value chain trade and the indirect costs of
Brexit. Occasional Paper 468, Bank of ItalyCappariello R, Gunnella V, Franco‑Bedoya S, Ottaviano GIP (2020) Rising protectionism and global value chains: Quantifying
the general equilibrium effects. ECB Working Paper 2360, European Central Bank, Frankfurt (Main)Chen W, Los B, McCann P, Ortega‑Argilés R, Thissen M, van Oort F (2018) The continental divide? Economic exposure to Brexit
in regions and countries on both sides of the channel. Papers Reg Sci 97(1):25–54Cumming DJ, Zahra SA (2016) International business and entrepreneurship implications of Brexit. Br J Manag 27(4):687–692Dhingra S, Huang H, Ottaviano G, Pessoa JP, Sampson T, Reenen JV (2017a) The costs and benefits of leaving the EU: trade
effects. Econ Policy 32:651–705Dhingra S, Machin S, Overman H (2017b) Local economic effects of Brexit. Natl Inst Econ Rev 242(1):R24–R36Dhingra S, Ottaviano G, Rappoport V, Sampson T, Thomas C (2018) UK trade and FDI: a post‑Brexit perspective. Papers Reg Sci
97(1):9–24European Commission, 2008. NACE Rev. 2 Statistical classification of economic activities. Eurostat Methodologies and
Working PapersFeenstra RC, Sasahara A (2018) The ‘china shock’, exports and U.S. employment: A global input‑output analysis. Rev Int
Econ 26:1053–1083Felbermayr G, Gröschl J, Heiland I, Braml M, Steininger M (2017) Ökonomische Effekte eines Brexit auf die deutsche und
europäische Wirtschaft. ifo Forschungsbericht 85, ifo Institut, MünchenFurceri D, Hannan SA, Ostry JD, Rose AK (2018) Macroeconomic consequences of tariffs. Working Paper 25402, National
Bureau of Economic ResearchHantzsche A, Kara A, Young G (2018) The Economic Effects of the Government’s Proposed Brexit Deal. National Institute
of Economic and Social Research, LondonIJtsma, P., Levell, P., Los, B., Timmer, M. P. (2018) The UK’s participation in global value chains and its implications for post‑
Brexit trade policy. Fiscal Studies 39(4):651–683Kierzenkowskii R, Paini N, Rusticellii E, Zwart S (2016) The economic consequences of Brexit: A taxing decision. OECD
Economic Policy Papers 16, Organization for Economic Cooperation and Development, ParisLos B (2017) Input‑output analysis of international trade. In: ten Raa T (ed) Handbook of input‑output analysis. Edward
Elgar, Cheltenham and Northampton, pp 277–328Los B, McCann P, Springford J, Thissen M (2017) The mismatch between local voting and the local economic conse‑
quences of Brexit. Reg Stud 51(5):786–799Los B, Timmer MP, de Vries GJ (2015) How important are exports for job growth in China?: A demand side analysis. J Comp
Econ 43(1):19–32Miller RE, Blair PD (2009) Input‑output analysis. Foundations and extensions, 2nd edn. Cambridge University Press, New
York and CambridgePowdthavee N, Plagnol AC, Frijters P, Clark AE (2019) Who got the Brexit blues? The effect of Brexit on subjective wellbe‑
ing in the UK. Economica 86(343):471–494Timmer MP, Dietzenbacher E, Los B, Stehrer R, de Vries GJ (2015) An illustrated user guide to the World‑Input‑Output
Database: the case of global automotive production. Rev Int Econ 23:575–605Timmer, M. P., Los, B., Stehrer, R., de Vries, G. J., 2016. An anatomy of the global trade slowdown based on the WIOD 2016
release. Groningen Growth and Development Centre Research Memorandum 162, University of Groningen, GroningenVandenbussche, H., Connell, W., Simons, W., 2019. Global value chains, trade shocks and jobs: An application to Brexit. CESifo
Working Paper 7473, Munich Society for the Promotion of Economic Research – CESifo GmbH, Munich
Publisher’s NoteSpringer Nature remains neutral with regard to jurisdictional claims in published maps and institutional affiliations.