international transport, climate change and trade 2.47 mb - ictsd
TRANSCRIPT

ICTSD Global Platform on Climate Change, Trade Policies and Sustainable Energy
Background Paper
ICTSD Programme on Trade and EnvironmentOctober 2010
International Transport,Climate Change and TradeWhat are the Options for RegulatingEmissions from Aviation and Shippingand what will be their Impact on Trade?
Trade and Sustainable Energy Series

l ICTSD Programme on Trade and Environment
ICTSD Global Platform on Climate Change, Trade Policies and Sustainable Energy
International Transport, Climate Change and TradeWhat are the Options for Regulating Emissions from Aviation and Shipping and what will be their Impact on Trade?
Background Paper
October 2010

ii International Transport, Climate Change and Trade
Published by
International Centre for Trade and Sustainable Development (ICTSD)International Environment House 27 Chemin de Balexert, 1219 Geneva, SwitzerlandTel: +41 22 917 8492 Fax: +41 22 917 8093E-mail: [email protected] Internet: www.ictsd.org
Chief Executive: Ricardo Meléndez-Ortiz Programmes Director: Christophe Bellmann Programme Officer : Joachim Monkelbaan
Acknowledgments
This paper was produced under The ICTSD Global Platform on Climate Change, Trade Policies and Sustainable Energy - An initiative supported by DANIDA (Denmark); Ministry of Foreign Affairs of Finland; the Department for International Development (U.K.); the Ministry for Foreign Affairs of Sweden; the Ministry of Foreign Affairs of Norway; Oxfam Novib; and ICTSD’s institutional partners and project supporters such as the Commonwealth Secretariat, the Netherlands Directorate-General of Development Cooperation (DGIS), the Swedish International Development Cooperation Agency (SIDA); and the Inter American Development Bank (IADB).
The author of this paper is Joachim Monkelbaan from ICTSD. The author would like to thank Sergio Marchi, Marie Chamay and Christophe Bellmann from ICTSD for their comments as well as various experts for their valuable inputs notably Andre Stochniol from IMERS, Jasper Faber from CE Delft, Haifeng Wang from the International Council on Clean Transportation , and Bill Hemmings from Transport & Environment.
ICTSD welcomes feedback on this document. These can be forwarded to Joachim Monkelbaan, [email protected]
Citation: ICTSD (2010). International Transport, Climate Change and Trade - What are the options for regulating emissions from aviation and shipping and what will be their impact on trade?, ICTSD Background Paper, International Centre for Trade and Sustainable Development, Geneva, Switzerland.
Copyright © ICTSD, 2010. Readers are encouraged to quote this material for educational and nonprofit purposes, provided the source is acknowledged.
This work is licensed under the Creative Commons Attribution-Non-commercial-No-Derivative Works 3.0 License. To view a copy of this license, visit http://creativecommons.org/licenses/by-nc-nd/3.0/ or send a letter to Creative Commons, 171 Second Street, Suite 300, San Francisco,California, 94105, USA.
The views expressed in this publication are those of the author and do not necessarily reflect the views of ICTSD or the funding institutions.
1992-1675

iiiICTSD Programme on Trade and Environment
TABLE OF CONTENTS
LIST OF ABBREVIATIONS AND ACRONYMS v
FOREWORD vi
INTRODuCTION vii
OBjECTIVES OF ThIS BACkgROuND PAPER viii
1. ThE IMPORTANCE OF AVIATION AND MARITIME TRANSPORT FOR TRADE AND CLIMATE ChANgE 1
1.1 Maritime Transport Emissions 1
1.2 Aviation Emissions 3
2. gOVERNANCE OF INTERNATIONAL TRANSPORT IN ThE FACE OF CLIMATE ChANgE 5
2.1 Institutional ggovernance of International Transport and Climate Change 5
2.2 InstitutionalPrinciples:CommonbutDifferentiated Responsibilities and Equal Treatment 6
3. REguLATORY OPTIONS FOR INTERNATIONAL TRANSPORT IN ThE FACE OF CLIMATE ChANgE 8
3.1 Maritime 8
3.2 Regulatory Options in the Aviation Sector 13
4. ECONOMIC IMPACTS OF BuNkERS REguLATION ON INTERNATIONAL TRADE 16
4.1 Maritime 16
4.2 Economic Impacts on Aviation 26
5. hOW TO OFFSET COSTS OF TRANSPORT REguLATION FOR VuLNERABLE COuNTRIES? 29
5.1 Policy Options 29
5.2 The International Maritime Emissions Reduction Scheme: use of Revenues 32
5.3 HowtoOffsettheImpactofCivilAviationRegulation? 33
5.4 HowtoOffsetcostsofTransportClimateRegulation:Conclusion 33
6. COMPLIANCE WITh INTERNATIONAL LAW 34 6.1 AviationintheEUETS:inConflictWithChicagoConvention,OpenSkies
and kyoto Protocol Rules? 34
6.2 AviationintheEUETS:inConflictWithWTORules? 34
6.3 WTO Law and International Emissions Trading: Is There Potential forConflict? 36
6.4 united Nations Convention on the Law of the Sea (uNCLOS) 36
6.5 Cross-references to International Trade in the Climate Change Regime 36

iv International Transport, Climate Change and Trade
7. SuMMARY AND RECOMMENDATIONS FOR FuRThER RESEARCh 37 7.1 how to get the Support from Developing Countries? 37
7.2 how to Implement Maritime Emissions Trading in the Eu ETS? 38
7.3 The Way Forward 38
ENDNOTES 40
REFERENCES 44
ANNEx A: OVERVIEW OF LATEST PROPOSALS FOR MARkET-BASED INSTRuMENTS IN ThE ShIPPINg SECTOR AND ThEIR IMPACTS ON TRADE 46
ANNEx B: ANALYSIS OF IMPACT ON TRADE IN SELECTED gOODS: IRON ORE, CRuDE OIL, gRAINS, AND CLOThINg AND FuRNITuRE 53
ANNEx C: ASSIgNINg EMISSIONS FROM ShIPS 56
ANNEx D: AVIATION IN ThE Eu ETS 58

vICTSD Programme on Trade and Environment
LIST OF ABBREVIATIONS AND ACRONYMS
AA Aviation Allowance
AAU Assigned Amount Unit
AWG-LCA Ad Hoc Working Group on Long-term Cooperative Action under the Convention
BaU Business as Usual
BRIC Brazil, Russia, India, and China
CBDR Common but differentiated responsibilities
CO2 Carbon dioxide
EEDI Energy Efficiency Design Index
ETS Emissions Trading Scheme
EU European Union
GDP Gross Domestic Product
GHG Greenhouse Gas
Gt Giga tonne (one billion tonnes)
IATA International Air Transport Association
ICAO International Civil Aviation Organization
ICS International Chamber of Shipping
IMO International Maritime Organization
IPCC Intergovernmental Panel on Climate Change
KP Kyoto Protocol
MBIs Market-based Instruments
MEPC Marine Environment Protection Committee
METS Maritime emissions trading scheme
Mt Mega tonne (one million tonnes)
QERCs Quantified emission reduction commitments
SIDS Small Island Developing States
UNFCCC United Nations Framework Convention on Climate Change
WTO World Trade Organization
WWF World Wide Fund For Nature

vi International Transport, Climate Change and Trade
International transport, both aviation and maritime shipping, is a critical element of the global economy and trade. At the same time, it is also one of the main drivers of human-induced climate change.
This background paper is intended to explore the many aspects of regulating international transport emissions in the context of trade. The global effort to address climate change will require the regulation of greenhouse gas emissions from the international transport sector. However, regulation can translate to higher costs of moving people, resources and goods around the globe. Developing countries can be particularly affected by higher transport costs. On the other hand, regulating emissions from maritime and air transport could potentially generate resources to finance climate change adaptation and mitigation measures.
Many political considerations play a role in the negotiations on regulation of international transport amidst the wider climate change negotiations. One example is the reconciliation of the IMO’s specific principle of “no favourable treatment” and the fundamental ICAO principle of non-discrimination with the UNFCCC’s principle of “common but differentiated responsibilities”.
Despite the climate change governance challenges that maritime shipping and aviation face, many regulatory options have been proposed, each with distinct economic impacts. Market-based instruments to regulate emissions will impact international trade because they impose an additional financial burden on transport, which could result in reduced imports and exports. Similarly, there are several options to reduce the undesired economic impacts of a climate mitigation policy on developing countries.
Joachim Monkelbaan is Global Platform Programme Officer with ICTSD. He earned a Master of International Law and Economics at the World Trade Institute (WTI) in Bern, and a Master of European Law and Languages from Maastricht University in Maastricht. In the past, Mr. Monkelbaan worked for the International Center for Small Hydro Power (IC-SHP) in Hangzhou, China, for the International Union for the Conservation of Nature (IUCN) in Switzerland, for the Dutch Ministry of Economic Affairs, and for international law firms.
The views expressed in this paper are those of the author and do not necessarily reflect the views of ICTSD or the funding institutions.
The Global Platform is aimed at contributing to effective international co-operation towards addressing climate change. It does so by advancing analytical capacity of stakeholders and their interaction with policy makers such that effective solutions can be identifi ed and agreed by the international community.
FOREWORD
Ricardo Meléndez-Ortiz Chief Executive, ICTSD

viiICTSD Programme on Trade and Environment
While international transport (aviation and maritime shipping) is an important driver of trade, it is also the fastest growing source of greenhouse gas (GHG) emissions. The regulation of emissions from international transport, through either emissions trading, a levy or efficiency requirements, would potentially mean raised costs for moving goods and people around the globe. This has implications for trade. Developing countries situated in remote locations and with a large trade exposure, such as some small island developing states (SIDS), would be particularly affected by higher transport costs.
The impacts of regulating emissions from international transport may depend on the type of regulation and the accompanying measures. For example, economic instruments to reduce the emissions of maritime and air transport may also generate resources to finance adaptation and mitigation measures in developing countries. Therefore, a global climate policy that includes international maritime and air transport could offer opportunities for developing countries.
Until now, the inclusion of international transport emissions in a global climate policy framework has proven to be a difficult issue. The international transport sector is a truly global industry. Its GHG emissions, and their responsibility for reducing them, do not fall directly within the jurisdiction of any single country. The fact that a global solution is necessary to tackle emissions from the international transport sector meaningfully makes it an interesting test case for sectoral approaches that could be applied to other industries.
Throughout this paper, the regulation of international shipping and aviation is treated together where the situation is sufficiently similar for both industries. However, there are clear differences between shipping and aviation on key points; in these cases each sector is looked at individually. While the shipping industry is composed of many players, the aviation industry is characterized by its concentration into three global alliances in which the many individual airlines increasingly cooperate very closely. In theory, fuel use for aviation should be easier to track as most aircraft have to refuel at each landing – certainly at each second landing, while ships have the capacity to tanker fuel for months at a time. In practice, ships need to register the amount of fuel on board for safety reasons, so it should also be possible to track their fuel use.
Lastly, air transport is many times more carbon-intensive than maritime transport and according to the International Council on Clean Transportation, over the past ten years there have not been any notable fuel efficiency gains for airplanes;1 however, enormous gains in efficiency are feasible in maritime transport by simply using newer engines and lowering cruising speeds.
INTRODuCTION

viii International Transport, Climate Change and Trade
The purpose of this background paper is to give an overview of the regulation of international transport (aviation, shipping) in the face of climate change. This paper attempts to inform the different stakeholders in international transport on the direct relationship between international transport, trade and climate change. It also tries to give a clear insight into the economic impacts of transport regulation and the possible ways to offset these impacts for vulnerable countries. Thus, this paper aims to contribute to the discussion on the design and impacts of market-based solutions and other regulation instruments.
To achieve these goals, this paper is structured as follows:
Chapter 1 will give an overview of the importance of shipping and aviation for both trade and climate change.
Chapter 2 describes the institutions involved in the governance of international transport emissions in order to integrate international transport in a wider climate policy framework. This chapter sketches the historical background of aviation and shipping emissions and their regulation, and describes the positions of different countries involved in relevant forums like the International Maritime Organization (IMO), International Civil Aviation Organization (ICAO) and the United Nations Framework Convention on Climate Change (UNFCCC). Additionally, this chapter addresses the current trends in the global governance of international transport and its political economy.
The main options for regulating emissions from international transport are market-based instruments, such as cap-and-trade, levies and hybrid schemes. Chapter 3 will discuss these and other regulatory options. It will also delineate country proposals from the US, Denmark, Germany, the UK, and Norway.
Regulating emissions from international transport will certainly have an economic impact on trade. Chapter 4 presents an overview of how the proposals for climate policy instruments could affect the costs of aviation and maritime transport. This chapter takes a closer look at what the economic effects on trade, competitiveness and food security will be for far-off and trade-intensive nations. Finally, this chapter also addresses the commodities with the largest cost increase; the increase in import values gives an indication of which country groups’ exports would be affected most by a climate policy instrument.
Chapter 5 will look at how transport regulation costs for developing countries can be offset. Several mechanisms such as rebates, route-based exceptions and size thresholds are considered.
Regulating emissions from international transport will not only have economic impacts, but also has to be measured against the norms of established legal frameworks such as World Trade Organization (WTO) law. Chapter 6 will address the legal feasibility of emission regulation scenarios.
Finally, this paper provides policy recommendations, and next steps for action in Chapter 7.
OBjECTIVES OF ThIS BACkgROuND pApER

1ICTSD Programme on Trade and Environment
More than ninety percent of world trade is transported by sea and seaborne trade has been rapidly growing over the past 20 years (see Figure 1).2 At the same time, ships emit large quantities of CO2. The CO2 emissions from the international maritime industry doubled between 1994 and 2007. Emissions from shipping are projected to rise rapidly and possibly even triple by 2050 (Lee et al., 2009),
despite potentially significant efficiency improvements. According to the IMO, in 2007 global CO2 emissions from shipping were 1,006 Mt of CO2, equal to 2,7 percent of global anthropogenic CO2 emissions (see Figure 2), more than the emissions of whole countries like Canada, Germany, or the UK.3
Europe, North East Asia and North America are not surprisingly the regions with the biggest emissions from shipping.
ThE IMpORTANCE OF AVIATION AND MARITIME TRANSpORT FOR TRADE AND CLIMATE ChANgE
1.1 Maritime Transport Emissions
34000
32000
30000
28000
26000
24000
22000
20000
1989
1999
2000
2001
2002
2003
2004
2005
2006
2007
2008
Figure 1: World seaborne trade (billion tonne-miles)
Source: International Chamber of Shipping
Figure 2: The division of global CO2 emissions by sector
Source: Buhaug, Faber et al., 2nd IMO GHG study 2009
Manufacturing Industries and Construction 18,2%Other Transport (Road) 21,3%Rail 0,5%International aviation 1,9%International Shipping 2,7%Domestic shipping & fishing 0,6%Electricity and Heat Production 35,0%Other Energy Industries 4,6%Other 15,3%

2 International Transport, Climate Change and Trade
The scope for reducing emissions from maritime transport
Currently, not all cost-effective measures to reduce maritime emissions have been taken. Various studies indicate that there is a considerable potential to reduce emissions in the shipping sector.4 A significant share of emissions can even be reduced at a net profit. For the global shipping market, the total emissions could be reduced by up to 20 percent in a cost-effective way. Measures that turn out to be among the most cost-effective are propeller maintenance, hull coating and maintenance, wind energy and retrofit hull measures such as transverse thruster openings (Buhaug et al., 2009). DNV, a Norwegian maritime risk management company, estimates a cost-effective potential of up to 15 percent below current levels with technologies such as boiler consumption reduction, engine monitoring and optimising trim.
The Marginal Abatement Cost Curves (MACCs) in Figure 3 provide an assessment of the
level of emissions reduction which a range of measures could deliver at a given point in time, against a projected baseline level of emissions. They show how much CO2 each measure could save (the level of abatement potential) and the associated cost per tonne of CO2. For example, up to 16 percent of maritime emissions can be avoided below the baseline level in 2030 at negative cost by taking only technical measures and almost a third of emissions can be avoided at negative costs by taking both technical and operational measures. This technically means that only taking measures to avoid even higher emissions carries costs for the industry. In reality, there are reasons why these measures are not being adopted already. Some reasons such as split incentives5 and postponing investment in the expectation of future technology improvements have been touched upon, and it is likely that in many cases there is a non-negative cost or barrier to adopting these measures that has not been taken account of in the calculations.
Table 1: Emissions from shipping and climate impacts of different regions in 2006
Region
Arriving ships Departing ships
Fuel use (Mt)
CO2 emissions
(Mt)
Percentage of global CO2 emissions (5)
Fuel use (Mt)
CO2 emissions
(Mt)
Percentage of global CO2 emissions (5)
North America 38.3 120.2 12% 37.5 117.5 12%
Central America 17.2 53.3 5% 16.6 51.6 5%
South America 18.5 58.5 6% 20.2 64.2 6%
Europe 88.6 276.7 27% 90.9 284.1 28%
Africa 21.5 67.6 7% 21.9 69.2 7%
Middle Eastern Gulf 19.5 62.4 6% 20.5 66 7%
Indian subcontinent 7.5 23.6 2% 7.07 22.3 2%
Far East Asia 36.8 115.8 12% 36 113.1 11%
North East Asia 61.6 193.6 19% 58.8 184.6 18%
Oceania 11.0 34.8 3% 11.3 36 4%
Totals 320.4 1,006.5 100% 320.8 1,008.6 100%
Source: CE Delft et al., 2010

3ICTSD Programme on Trade and Environment
Figure 3: MACC curves for all measures and for technical measures only, 2030, 9 percent interest rate and fuel price of US$ 700 per tonne
Source: CE Delft, 2009
Marginal Co2 Abatement Costs for the Maritime Transport SectorYear 2030, $700/tonne fuel, Interest rate 9%
Technical and operationalmeasures
Technical measures
Maximum Abatement Potential (%)
Cost
Eff
icie
ncy
(200
7Eu
ro /
tonn
e CO
2) 150
100
50
0
-50
-100
-150
-200
0% 10% 20% 30% 40%
As the recent volcano eruptions in Iceland have shown, aviation is of considerable importance to trade.6 Aviation plays a key role in the world economy; it supports 8 percent of global economic activity and carries 40 percent of the value of freight.7 At the same time, according to
the Intergovernmental Panel on Climate Change (IPCC) 2,5 percent of global emissions originate from aviation8 and that percentage is growing with a doubling of emissions from international aviation between 1990 and 2010.9 In the worst case scenario of the IPCC, emissions from aviation will almost quintuple, from 0,3 Gt CO2 per year now to 1,5 Gt CO2 per year in 2050.
1.2 Aviation Emissions
Figure 4: Comparison of CO2 emissions between different modes of transport
Source: NTM, Sweden
0 100 200 300 600Crams per tonne-km
Air freight 747-400 1,200 km flight
Cargo vessel over 9,000 dwt
Cargo vessel 2,000-8,000 dwt
Heavy truck with trailer
152150
400
540500
Marginal CO2 Abatement Costs for the Maritime Transport Sector Year 2030, $700/tonne fuel, Interest rate 9%
Grams of CO2 per tonne-km

4 International Transport, Climate Change and Trade
Aviation has by far the greatest climate impact of any mode of transport, whether measured per passenger kilometre, per tonne kilometre (see Figure 4), per dollar spent, or per hour traveled. There are two ways to measure the climate impact of aviation; the first is based only on CO2 emissions while the second takes non- CO2 effects into account. The latter, called the multiplier effect, suggests that it is highly likely that the net impact of non- CO2 effects – particularly contrails and other induced cloud formation – increases the global warming impact of aviation beyond that suggested by CO2 emission alone. Although the precise scale of the additional impact is unclear and there are considerable scientific uncertainties yet to be resolved, the current consensus is that the climatic impact of aviation emissions is double (and according to the IPCC up to four times) that of its CO2 emissions alone. This implies that aviation is responsible for 4,9 percent of the climate change impact attributable to human activities.10
CO2 emissions are directly linked to fuel consumption. Every litre of jet fuel burnt
leads to 2,5 kg of CO2 emitted in the air. In terms of fuel efficiency, it is hard to compare the most recent airplanes with the ones that flew half a century ago. Passenger comfort aboard has increased considerably and while the old propeller engines were more efficient than the current jet engines, jet aircraft are twice as fast. According to the most recent research, the average fuel efficiency of new passenger aircraft has approximately doubled since 1960,11 less than previous estimates.
However, new aircraft efficiency has improved substantially in only two of the last five decades, and stagnated in recent years. On average, fuel efficiency has remained flat on a seat-km basis and improved only 0.29 percent annually on a ton-km basis since 2000.12 Adaptations to airplane design such as adding winglets13 have delivered only marginal improvements in efficiency. At the same time, many segments of the aviation industry including manufacturers, airlines and airports are subsidised and enjoy tax exemptions (notably the lack of value added tax (VAT) on international tickets and taxes on kerosene).

5ICTSD Programme on Trade and Environment
2. gOVERNANCE OF ShIppINg AND AVIATION IN ThE FACE OF CLIMATE ChANgE
The Kyoto Protocol contains separate provisions for reducing GHG emissions from international aviation and shipping and treats these sectors in a different way to domestic sources because of their international character. Domestic aviation and shipping emissions are included in national targets for developed (under the UNFCCC denoted ‘Annex I’) countries with an overall reduction target in total emissions from all sources of 5,2 percent for 2008-2012 (compared with 1990 levels).
Article 2.2 of the Kyoto Protocol treats emissions from international aviation and shipping separately from emissions from other sectors:
“Parties included in Annex I shall pursue limitation or reduction of emissions of green-house gases not controlled by the Montreal Protocol14 from aviation and marine bunker fuels, working through the International Civil Aviation Organization and the International Maritime Organization, respectively”.
Individual countries were not given responsi-bility for cutting emissions from aviation and shipping. In the run-up to the Kyoto Protocol, no agreement could be reached on the allocation of aviation and maritime emissions to countries. Instead, the Kyoto Protocol calls on Annex I countries to limit or reduce emissions ‘working through the International Civil Aviation Organization and the International Maritime Organization’.
ICAO and IMO are both specialized UN agencies. The IMO’s primary purpose is to develop and maintain a comprehensive regulatory framework for shipping and its mandate today includes safety, environmental concerns, legal matters, technical co-operation, maritime security and the efficiency of shipping.
The IMO works with clear rules of procedure. While decisions are generally taken by consensus, IMO rules of procedure allow for majority decisions. ICAO codifies the principles and techniques of international air navigation and fosters the planning and development of international air transport to ensure safe and orderly growth.
ICAO and IMO also regularly report progress on their work. ‘Bunker fuels’ or ‘bunkers’, as the issue of international transport is referred to in the climate negotiations, also remains in the negotiations under the UNFCCC. Bunker fuel is technically any type of fuel oil used aboard ships. Mostly it is the heavier, dirtier variant. In the climate negotiations, fuel used in airplanes is also called bunker fuel or ‘bunkers’.
An important question is this: will ICAO and the IMO address the question of emission targets successfully? Target setting is currently not on the IMO agenda. However, proposals about possible methodologies how to set targets through the IMO have already been submitted. ICAO made clear at the Copenhagen Climate Change Conference that it believes the annual 2 percent fleet efficiency improvement goal is a target in itself – possibly to be supplemented by the carbon neutral growth in 2020 concept of the International Air Transport Association (IATA, also see p. 14).15 While it is understandable that the complicated issue of international transport and climate change is delegated to more specialised forums, it is hard to avoid the impression that the split responsibility for international transport between the UNFCCC and the IMO/ICAO does not simplify the negotiating process; lack of progress in one forum can be used as an excuse for a standstill in the other and vice versa. In the best possible scenario though, the UNFCCC would set the emissions targets for aviation and shipping, and leave the practical implementation of these targets to IMO and ICAO respectively.
2.1 Institutional governance of International Transport and Climate Change

6 International Transport, Climate Change and Trade
Much of the deadlock over tackling bunker emissions on a global scale has revolved around how to apply to aviation and shipping the differing guiding principles of the institutions that govern bunkers emissions. A key issue is reconciling the IMO’s specific precept of No Favorable Treatment (i.e., all ships are regulated equally regardless of where the ship is owned or registered) and the fundamental ICAO principle of non-discrimination with the UNFCCC’s principle of Common But Differentiated Responsibilities (CBDR) which is valid for the wider climate change negotiations. This attempt at reconciliation has been challenging and has hampered discussions.
The CBDR principle was established under the UNFCCC.16 The practical consequences of CBDR are that different obligations are imposed on the Parties to the UNFCCC, depending on their level of development. The prime example of this is the Kyoto Protocol, where only countries listed in its Annex I (developed countries and countries with economy in transition) have quantified emissions reduction obligations under the agreement. In practice this means that the developed countries, who have the biggest capability to reduce GHG emissions, should take the lead in the fight against climate change.
The principle of CBDR was at the heart of the negotiations on transport at the Copenhagen Climate Conference as developed countries claimed that any of their actions against climate change would remain futile if the bigger developing countries did not do enough to mitigate their emissions. The developed countries argue that developing countries account for more than 70 percent of current maritime emissions and that more than 80 percent of shipping capacity is registered in non-Annex I countries (UNCTAD, 2007). And of course ship owners can take the pragmatic decision to shift their flags from Annex I to non-Annex I countries if they feel the developed country’s regulation harms their
interests. Developing countries respond that historical emissions, which originate primarily from developed countries, should be taken into account, and that it is the responsibility of developed countries to take the lead in addressing maritime emissions.
Therefore, some developing country Parties have resisted the notion of a global appro-ach, claiming that this approach is a way for developed countries to neglect their responsibility for historic emissions and, instead, impose emissions reduction obliga-tions on non-Annex II Parties (developing countries). They argue that the largest share of emissions from international shipping has originated from the cumulative emissions in historical development of developed countries; therefore, it is the responsibility of developed countries to take the lead in addressing maritime emissions.
In the climate change negotiations many developing countries have insisted that any CO2 emissions reduction required measures or standards do not apply to them at all because of CBDR. This illustrates that the debate is not only about the principle of CBDR itself but also about the way it is applied. Some countries interpret CBDR as a principle that obliges developing countries to take on mitigation efforts within their capacity; others interpret the principle to mean that developing countries do not have to take any climate change mitigation action.
This debate is generic for the climate change negotiations. In the international transport debate specifically, developed countries point to the global nature of the aviation and maritime sectors, and the fact that IMO and ICAO have historically developed policies that treat operators of all nationalities equally.
The Sub-Division for Legal Affairs in IMO identified no potential conflicts between the CBDR principle in the Kyoto Protocol and the Equal Treatment principle under IMO. Therefore, the IMO Legal Affairs Division points out17 that the Equal Treatment principle should guide future ship emission reduction
2.2 Institutional principles: Common but Differentiated Responsibilities and Equal Treatment

7ICTSD Programme on Trade and Environment
negotiations; however, this is certainly not the end of the discussion.
In addition in 2008 the IMO’s Marine Environ-ment Protection Committee (MEPC)18 decided, by overwhelming majority, to take the principles listed below as its reference for further debate on GHG emissions from international shipping. A coherent and comprehensive future IMO framework should be:
1. effective in contributing to the reduction of total global greenhouse gas emissions;
2. binding and equally applicable to all flag States in order to avoid evasion;
3. cost-effective;
4. able to limit, or at least, effectively mini-mise competitive distortion;
5. based on sustainable environmental deve-lopment without penalising global trade and growth;
6. based on a goal-based approach and not prescribe specific methods;
7. supportive of promoting and facilitating technical innovation and R&D in the entire shipping sector;
8. accommodating to leading technologies in the field of energy efficiency; and
9. practical, transparent, fraud-free and easy to administer.
A few developing countries expressed reservations regarding principles 2 and 4, which suggest equal treatment. Behind the whole debate lie major political and economic considerations. Developing countries are reluctant to set a precedent that requires them to reduce GHG emissions at the same levels and costs as developed countries. As will be discussed in Chapter 4, compliance with emission reduction regulations also generates costs and, due to higher transport costs, may influence international trade.

8 International Transport, Climate Change and Trade
3. REguLATORY OpTIONS FOR INTERNATIONAL TRANSpORT IN ThE FACE OF CLIMATE ChANgE
Simply put, there are currently three main types of policy for GHG reduction in the IMO debate:
1. market-based instruments19 (MBIs) addressing CO2 emissions directly;
2. mandatory, technical policy options, aimed at improving the design efficiency of the fleet;
3. operational efficiency requirements.
Below, the most important policy options will be assessed in more detail.
3.1.1 Market-based instruments
Market-based instruments (MBIs, sometimes also referred to as Market-based measures or MBMs) are proposed as the most comprehensive approach by the IMO to address climate change. The measures currently proposed include emissions trading schemes (ETS)20 the fuel levy proposed by the Danish delegation at the IMO and an energy efficiency credit trading scheme proposed by the United States.
Emissions Trading Schemes (ETS)
Emissions trading is one of the flexible mechanisms approved by the Kyoto Protocol and represents cooperation between two or more countries, companies or organizations that have emissions reduction commitments. Any company that has reduced its emissions below the determined commitment can sell its surplus units to another company that may find it more difficult to reduce its emissions and meet its reduction commitment.
There are two emissions trading scheme options for international shipping. The first option is to include shipping emissions in national inventories of GHG emissions, which requires an allocation of emissions to countries. However,
it is highly unlikely that countries could agree on an allocation method. The second option is to include shipping emissions under auspices of the IMO, rather than in national inventories. A cap on total emissions from international shipping should be established and ship owners would have to buy emission allowances to cover their emissions. If this cap on emissions from international shipping includes only the ships registered in participant countries, there would be an incentive to register ships in non-participant countries instead. For this reason, it would be essential to establish a method whereby the policy was applied globally and irrespective of the flag of the carrier.
The European Union proposal for a maritime emissions trading system
A sectoral approach consists of a combination of policies and measures developed to enhance efficient, sector-by-sector GHG mitigation within the UN framework. The European Union (EU) is in favour of including shipping emissions in such an approach. However this was not achieved at Copenhagen. In the event that no international agreement that includes international maritime emissions in its reduction targets has been approved by the EU by 31 December 2011, the European Commission has to make a proposal to include international maritime emissions in the European Community reduction commitment, with the aim of the proposed act entering into force by 2013.21
Germany and some other EU countries have proposed a special global cap-and-trade scheme for the maritime sector, the Maritime Emissions Trading Scheme (METS). The METS proposes an open ETS, which sets global caps for shipping sector emissions and would allow ship owners to trade outside the international maritime sector. This could mean that a ship owner can sell excess credits or purchase credits outside the maritime sector.
3.1 Maritime

9ICTSD Programme on Trade and Environment
The US Energy Efficiency Market-Based Mechanism
The US government MBI proposal to IMO is for a closed trading system for the trading of energy efficiency credits (instead of a cap on in-sector emissions), with trading limited to the maritime sector. These credits would be earned through employment of certified technologies and/or operational measures, or through the purchase or trade of these credits. All revenues generated by this trading are automatically recycled back into the shipping industry.
The US proposal differs from the EU and German METS proposal in that it is a closed hybrid ETS, which will supposedly a) not cap growth of the maritime shipping industry; b) be efficient in realizing CO2 reductions within in the maritime sector; c) be predictable and stable; and d) likely have low net costs to this sector through the first years of the scheme. However, due to the higher costs of mitigation in the shipping sector, this approach is unlikely to be able to meet an ambitious reduction target for the sector in a cost-effective manner. The EU METS will allow for trading outside the sector and therefore the price of CO2 emissions credits will be determined by the larger market. Also, the US scheme does not generate any climate finance and expects developing countries to finance emissions mitigation for their own fleet. Thus the US proposal appears to be less equitable, with the UNFCCC Annex I countries investing and earning credits to sell to poorer developing countries.
A tax or ‘levy’
Under a global levy scheme on marine bunker fuel, all ships engaged in international voyages would be subjected to a bunker levy established at a given cost level per ton of fuel bunkered. A carbon charge on bunker fuels would increase fuel costs for the vessels, which are a large proportion of shipping costs and play an important role in the decisions of ship builders and owners. A carbon charge on bunker fuels might reduce bunker demand and associated CO2 emissions through the following measures:
• energy efficiency improvements in ships engines and ship design;
• changes in operating practices including load factors, routing and sailing speeds;
• switching to different vessel types;
• switching to alternative fuel.
However, to implement such a change globally, countries would need to reach some sort of agreement; should they fail to do so, these bunker charges could be easily evaded.
An example of a levy scheme is the ‘Inter-national Fund for Greenhouse Gas Emissions from Ships’.22 The levy would be on fuels bunkered and depends on the difference between actual emissions and an emissions target. In the Danish proposal, the levy feeds into a fund and is spent on offsets, adaptation and R&D. According to the basic proposal, the GHG Fund should be established as a separate legal entity under the structure of a new IMO convention.23
The environmental effectiveness of a levy depends on the availability and price of offsets, the quality of offsets, and the level of the levy. Given the current price of offsets, the levy is unlikely to result in large emission reductions in the shipping sector, at least in the short term. In order to be environmentally effective, the revenues of the tax have to be spent at least partially on emission reductions. Emission reductions in non-Annex 1 countries seem to be the best way to improve a levy’s environmental effectiveness.
The costs of a levy are likely to be lower than full auctioning in an emissions trading scheme. This is because the levy would be set by politicians whereas in an ETS the carbon price is set by the market. Thus the shipping industry favours a levy. In addition, the costs of a levy are predictable over a 4-year period.
The geographical scope of a levy basis determines the amount of emissions under the scheme and thus its environmental effectiveness. As ships are moveable objects, any geographical scope

10 International Transport, Climate Change and Trade
can be avoided in principle, thereby reducing the environmental impact of a levy. Moreover, there are legal and practical considerations in setting the scope. For ships with multiple bills of lading (container ships, general cargo ships), it is not possible to unequivocally determine a port of loading. Hence, for these ships, some avoidance might occur.
Cap-levy-and-trade scheme (hybrid)
In a so called ‘cap-levy-and-trade’ scheme a cap on CO2 emissions from the maritime sector is established in line with a UNFCCC-decision. Parties ensure that all their ships pay a levy to an administrative entity based on documented fuel consumption. An international Maritime GHG fund is established for adaptation projects in developing countries. Shipping operators pay a levy on the fuel and also must buy CO2 credits (including from the CDM) to offset emissions above the cap.
International Maritime Emissions Reduction Scheme (IMERS)
IMERS is a proposal for a levy on fuel for international shipping, which differentiates responsibilities between developed and developing countries. Under the proposal a carbon levy is applied to fuel used by ships for delivering cargo to destinations that have made commitments to reduce emissions – i.e. Annex I countries to the UNFCCC. This levy would be set at the average market carbon price level. It is based on ship fuel use and a ratio of carried cargo to Annex I countries. In this way, responsibilities are differentiated between developing and developed countries. The liability for the levy is with the fuel purchaser, and stays with the ship. One hundred percent of revenue raised would be spent on climate change action. This would be applied worldwide (hence fulfilling the demand for a level playing field) and collected centrally – bypassing national coffers. It is projected that it would raise more than US$10 billion each year. Those funds could be used for adaptation and emissions reduction in developing countries.
Please see Annex A for a full overview of the latest proposals for MBIs in the IMO.
3.1.2 A mandatory efficiency limit
There are two potential indicators for a ship’s efficiency: the Energy Efficiency Operational Indicator (EEOI, proposed by Japan) and the Energy Efficiency Design Index (EEDI, proposed by Japan and Norway). The EEDI is aimed at the construction and design of new ships, while the EEOI relates to the use and daily functioning of ships. The unit of both the EEDI and the EEOI is grams of CO2 per capacity-mile.
The EEDI may be developed into a good indicator for a ship’s design efficiency, and the intention of the IMO is to make the EEDI mandatory for new ships globally starting in 2020. Some say that the EEDI should apply it to all ships and it should be used to force in fuel efficiency improvements.
The EEOI may not be a suitable basic para-meter for a mandatory policy for the following reasons:
• the value of the EEOI varies greatly over the business cycle, and depends furthermore on the density of cargo, origin and destination, weather, etc. This means that in some trades, times or locations, a mandatory value would easily be met whereas in other trades, times or locations, the same value would be unattainable. This could be considered to be inequitable;
• it is hard if not impossible to compare the EEOI across ship types such as bulkers, tankers, and container ships;
• the IMO has endorsed the use of the EEOI as a voluntary measure to evaluate the performance of ships by ship owners and operators, not as a mandatory policy; however, a mandatory application of the EEOI has not been ruled out completely.
The World Shipping Council24 proposes a combination between EEDI and levy. In this

11ICTSD Programme on Trade and Environment
scenario, ships that do not reach the standard would be subject to higher fuel charges.
3.1.3 Regulatory options for the maritime industry: conclusions
Given the large size of the international maritime sector bunkers inventory and projections for growth, significant in-sector reductions will be necessary to meet any meaningful global long-term climate stabilization goals. Reducing emissions in-sector through policy-driven technological changes and operational measures (e.g. speed reduction) coupled with a market-based trading mechanism seems necessary, possible, and cost-effective.
Market-based policy options are likely to be most effective environmentally. They will also be cost-effective if the administrative burden can be kept low.
Operational policy options may also have a high level of environmental effectiveness and can be cost-effective if administrative burdens can be kept low.
Technical policy options, aimed at improving the design efficiency of the fleet may be less environmentally effective and are less cost-effective (many technical measures are expensive). They will, however, have a low administrative burden.
Voluntary measures are often very cost-effective but not so environmentally effective because of free-riders.
A combination of policies will naturally lead to a higher administrative burden and reduce cost-effectiveness when markets are functioning well. They could be beneficial though when market failures exist.
In conclusion, one can say that emissions trading for maritime transport and the emissions levy with hypothesised revenues are best capable of reaching the primary policy objective of reducing CO2 emissions of maritime transport. Emissions trading is feasible to implement. The emissions levy may be harder to implement as it requires consensus amongst member states on both the implementation of the levy and the revenue projections.
In the case of maritime shipping, the policy instrument for emissions reduction is predomi-nantly determined by the amount of economic and environmental impact certainty that each instrument provides. With a levy, the economic impacts are more predictable, while the environmental impacts are more uncertain, due to the fact that there is no cap on emissions. With tradable permits, an emissions cap is determined but the economic impacts are less predictable.25 Tables 2 and 3 reflect these insights.
Table 2: Summary table of achievements of policy objectives by policy instruments
TypeBase
Market basedInstruments
Standards Voluntarymeasures
Maritime GHGemissions
Operationalefficiency
Design efficiency
Most effectiveMost cost-effective
Less effectiveLess cost-effective
Not so effectiveVery cost-effective
Source: Faber, 2009

12 International Transport, Climate Change and Trade
Table 3: Summary table of achievements of policy objectives by policy instruments
Policy instrument
Primary policy objective: reduce CO2 emissions of maritime
transport
Secondary policy objective: remove the market failures and barriers that
prevent cost-effective abatement options from being implemented
A cap-and-trade system for maritime transport emissions
The emissions are capped. An increase of emissions from maritime transport over the cap will be compensated by a reduction of emissions in another sector. The price of allowances will provide an incentive to reduce emissions in the maritime transport sector, but by 2030, the impact on shipping emissions is likely to be small. Some avoidance will occur in some segments of shipping.
No or very limited impact beyond business-as-usual emissions.
An emissions tax with hypothecated revenues
The emissions tax creates an incentive to reduce CO2 emissions. By 2030,there will be a limited impact on shipping emissions, but the use of the revenues to support mitigation efforts elsewhere would reduce overall emissions. Some avoidance will occur in some segments of shipping.
CO2 emissions become valuable, thus attracting the attention of the ship owner.
Monitoring and reporting requirements draw ship owners attention to emissions and to emissions abatement measures.
A mandatory efficiency limit for ships in EU ports
In principle, the efficiency of ships would be improved, but emissions can continue to rise if demand growth outpaces efficiency improvement rate. The effect can be significantly reduced by avoidance of the system.
In principle, the efficiency limit would create an incentive to improve the EEDI of non-compliant ships through buying more newly built fuel-efficient ships or improving the EEDI of existing ships through technical retrofits. It also creates an incentive to avoid the system by deploying compliant ships in Europe and non-compliant ships in other parts of the world. It would not increase attention for measures not reflected in the EEDI.
A baseline-and-credit system based on an efficiency index
In principle, the efficiency of ships would be improved, but emissions can continue to rise if demand growth outpaces efficiency improvement rate. The effect can be significantly reduced by avoidance of the system.
A baseline-and-credit scheme would be more flexible than a mandatory limit and create incentives to improve the EEDI of all ships through buying more newly built fuel-efficient ships or improving the EEDI of existing ships through technical retrofits. However, it also creates an incentive to avoid the system by deploying compliant ships in Europe and noncompliant ships in other parts of the world.
The system would not increase attention for measures not reflected in the EEDI.

13ICTSD Programme on Trade and Environment
For aviation, the situation is more clear-cut than in the maritime sector: technology standards and emissions trading seem the most likely measures. Until now, the only example of international aviation being included in emissions trading is the EU ETS.26
3.2.1 EU ETS
EU ETS measures will be applied from 1 January 2012 to all airlines regardless of their country of origin in order to avoid discrimination on the basis of nationality.27 The idea is that the scheme will form the foundations of a wider, global model. More details on the EU ETS are given in Annex D.
3.2.2 Work within the International Civil Aviation Organization (ICAO)
In 2007, the ICAO established an organisation called GIACC (Group on International Aviation
and Climate Change), with the aim of developing proposals to tackle emission reductions. How-ever, GIACC is now considering only ‘aspirational goals’ based on improved fuel efficiency. Industry insiders have said a global aviation ETS brokered within ICAO is still a “long way off”28 - although those countries currently planning such schemes of their own could possibly work with others, and ICAO’s Committee on Aviation Environmental Protection (CAEP) is addressing how this might operate. The principle of CBDR continues to cause dissent in ICAO as well.
3.2.3 The International Air Transport Asso-ciation (IATA)
IATA has been very critical of the EU proposal to include aviation in the EU ETS and has instead suggested the adoption of a global, voluntary target of making airlines zero carbon by 202029 (see Figure 5 on the next page) – though institutions like the Tyndall Centre have questioned whether the fuel technology to do so will exist by then.30
3.2 Regulatory Options in the Aviation Sector
Table 3: Continued
Policy instrument
Primary policy objective: reduce CO2 emissions of maritime
transport
Secondary policy objective: remove the market failures and barriers that
prevent cost-effective abatement options from being implemented
Voluntary action
No or very limited impact beyond business-as-usual emissions.
The energy efficiency management plan might
Draw attention of ship owners imple-menting it to take cost-effective options to reduce emissions.

14 International Transport, Climate Change and Trade
Figure 5: The ‘carbon-neutral growth’ scenario from IATA; in this scenario aviation’s net CO2 emissions will remain flat after 2020 even as demand grows
Source: IATA
Carbon-neutral growth from 2020 - where emissions reductions will be achievedThe top (dashed) line shows where emissions would be if there was no new technology or fleet replacement, based on forecast passenger growth. Each segment adds to emissions reduction potential. Economic measures kick-in 2020 to make up any shortfall in emissions reductions and provide for a cap in net emissions from 2020 – this scenario is referred to as ‘carbon neutral growth’ by the airline industry. Please note that although aviation will be included in the EU ETS from 2012, the airline industry expects this economic measure to have an influence on cutting emissions only from 2020.
1800
1600
1400
1200
1000
800
600
400
2000
2004
2008
2012
2016
2020
2024
Fleet replacement
Infrastructure measures
Operational measuresTechnology retrofits
Biofuels
Economicmeasures
No new technology
Mill
ion
tonn
es C
Oem
issio
ns2
A pamphlet from the aviation industry: a global sectoral approach for aviation
According to the aviation industry, aviation is the ultimate global activity: it provides an interconnected network of air services spanning the entire globe, with aircraft – and their emissions – crossing continents and national jurisdictions on a daily basis. Even flights that are purely within a State’s boundaries can have implications for international aviation, as domestic flights often serve as critical feeders for the international network. To avoid a patchwork of conflicting and potentially overlapping national and regional policies, the aviation industry thinks that a framework for measures addressing CO2 emissions from aviation must be developed at a global level.
Further, although aviation is a relatively homogenous sector in terms of technology and efficiency levels, it is also a highly competitive, research and development-intensive sector, largely characterised by low entry barriers, thin revenue margins and high risk exposure. The aviation sector has many characteristics that make the development of policy mechanisms to further reduce emissions more challenging than for other fossil fuel consuming sectors.
Given the nature of the aviation sector, plus the fact that its emissions cannot easily be attributed to any particular State’s economy, the aviation industry recommends that

15ICTSD Programme on Trade and Environment
3.2.4 The International Air Passenger Adaptation Levy (IAPAL)
Following the example of the French solidarity levy to combat HIV/AIDS, the LDC Group proposes an adaptation solidarity levy on international air passengers to provide more adequate funding for climate change adaptation activities in the poorest and most vulnerable countries and communities.31
In line with the French levy, the LDC Group proposal is to establish a small passenger charge for international flights - differentiated with respect to the class of travel - to raise between US$8 billion and US$10 billion annually for adaptation in the first five years of operation, and considerably more in the longer term. This would constitute a step towards ensuring adequate financing for developing country adaptation costs.
The levy is to benefit the Kyoto Protocol Adaptation Fund, which currently is replenished
by a two percent solidarity levy on the share of proceeds from the CDM. The levy would be universal in the sense of covering all international air travel and collected by airlines at the point of ticket sale. Being international and dependent only on the evolution of the air travel demand - and not on bilateral replenishment – the funds raised would truly be “new and additional”,32 as well as more predictable than traditional funding mechanisms.
The proposed levy is likely to have no significant effect on passenger numbers – less than a tenth of the expected annual growth rate – and hence would have a minimal impact on tourism-dependent economies. By contrast, it can have positive impacts on the development of the poorest and most vulnerable countries and communities, by addressing climate change impacts through timely and adequate adaptation measures funded by the revenue raised through the levy. On the other hand, however, the levy will have a very small impact on the mitigation of emissions from aviation.
multilateral collaborative action by all States through a global sectoral approach. This approach would encompass all air transport operators, and would be the most appropriate mechanism to effectively address CO2 emissions from aviation in the post-Kyoto framework.
To be effective, the aviation industry thinks that regulatory efforts to limit or reduce CO2 emissions from aviation should address all parts of the aviation supply chain, from the manufacturing of the aircraft to starting and landing routes and procedures and other operational measures. In addition to aircraft operators this includes, for example, aircraft manufacturers, fuel suppliers, air navigation service providers and airports, who directly influence aviation’s environmental performance through the design and deployment of the products and services they supply.
Governments can establish the right legal and fiscal frameworks to facilitate and increase investment in cost-effective CO2 emissions reduction measures, including new aircraft and engine technologies, more efficient infrastructure and low-carbon sustainable alternative jet fuels, and to enable the full and unrestricted access of the aviation sector to the global carbon market and use of available mitigation measures outside the sector. What the aviation, and also the shipping industry, probably needs most is certainty about what type of regulation to expect.
Source: http://www.enviro.aero/Content/Upload/File/GlobalAviationPositionPaper_October2009.pdf

16 International Transport, Climate Change and Trade
4. IMpACTS OF BuNkER EMISSION REguLATION ON INTERNATIONAL TRADE
What are the potential consequences of air and maritime climate change mitigation policies on trade? Market-based instruments –such as a levy or a cap-and-trade scheme – impose an additional financial burden on transport, which may result in reduced imports and exports. If a climate policy results in an increase in the price of transport, ship and aircraft owners and operators could respond by increasing fuel efficiency through technical or operational measures that reduce emissions and subsequent costs.
These technical and operational measures to reduce emissions will have a payback; the lifespan of the equipment will determine whether this payback is positive or negative. However, the payback calculation can only be made if carbon has a price.
In general, the cost of investment in emissions mitigation will be passed on to customers, who would respond by paying for higher costs
or lowering their demand. For developing countries, this could result in direct economic impacts, such as higher costs of food imports, and indirect impacts, such as changed incentives for fragmentation of production and value chains.
Table 4 shows the total emissions from maritime transport per region (first column), CO emissions on routes to the different regions (second column), cost increase of maritime transport at a carbon price of US$30 per tonne of CO2 (third column) and to put this into perspective the cost increase of maritime transport measures in percentage of GDP at a carbon price of US$30 per tonne of CO2 (fourth column). For Africa and Southeast Asia the cost increase of maritime transport would be the highest. The regulation of maritime transport can lead to increasing costs of imports and exports.
4.1 Maritime
Table 4: Emissions, costs and benefits for different regions and country groups
Region of destination
CO2 emissions on routes to regions
Mt CO2
First order estimate of
cost increase of maritime
transport, in US$ bin. (CO2 US$ 15-
30 per tonne)
First order estimate of
cost increase of maritime
transport, as % of GDP (CO2 US$ 15-
30 per tonne)
Benefits from using 67% of
auction revenues to compensate
developing countries, in US$ billions, based on value of imports
Region
North America 120 1.8-3.6 0.01-0.02% Almost none*
Central America and Caribbean
53 0.8-1.6 0.01-0.01% 0.9-1.8
South America 59 0.9-1.8 0.05-0.09% 0.7-1.5
Europe 277 4.2-8.3 0.02-0.05% Almost none*
Africa 68 1.0-2.0 0.1-0.2% 0.7-1.3
Middle Eastern Gulf, Red Sea
62 0.9-1.9 0.08-0.15% 1.0-2.1
Indian Subcontinent 24 0.4-0.7 0.03-0.06% 0.6-1.1
North East Asia 194 2.9-5.8 0.03-0.06% 5.1-10.2**
South East Asia 116 1.7-3.5 0.17-0.35% 1.5-3.1
Australia 35 0.5-1.0 0.06-0.13% Almost none*
World 1006 15.1-30.2 0.03-0.06%

17ICTSD Programme on Trade and Environment
Turning to country groups, Table 5 shows that the cost increase in maritime transport at an allowance price of US$ 15-30 per tonne of CO2 would vary from 0.02-0.04 percent of GDP for
Annex I countries to 0.07-0.15 percent of GDP for most groups of developing countries. For SIDS, however, the impact would be considerably higher at 0.45-0.89 percent of GDP.
Table 5: Cost increase of maritime transport to groups of countries
4.1.1 Cost increase of imports
The increased costs of shipping borne by the end consumers of traded goods and the price increase in consumer goods depends on several factors, including:
• elasticity of demand: the lower the elasticity of demand for maritime shipping, the higher the share of the additional costs related to climate policy that will have to be borne by the consumers;
• design of the policy – specifically, in an ETS, whether allowances are allocated using an auction or, at least partially, distributed for free;
• the share of maritime shipping costs that is transferred to the price of a good that the consumer pays.
In order to investigate the potential impact of climate policy in maritime shipping on consumer prices, a few typical examples of goods transported by maritime ships have been analysed. Table 6 shows the expected increase of the price of imports given the assumptions for the year 2010. The last three columns show an estimate of percentage increase in the price of imports resulting from increase in shipping costs due to a carbon price (through a fuel levy or emissions trading) of € 7, € 25 and € 45 per tonne of CO2 respectively.
* Comprises mainly but not exclusively developed countries. ** Comprises mainly but not exclusively developing countries.Source: Faber et al., 2010
Region of destination
CO2 emissions on routes to regions
Mt CO2
First order estimate of
cost increase of maritime
transport, in US$ bin. (CO2 US$ 15-
30 per tonne)
First order estimate of
cost increase of maritime
transport, as % of GDP (CO2 US$ 15-
30 per tonne)
Benefits from using 67% of
auction revenues to compensate
developing countries, in US$ billions, based on value of imports
Country Groups
Annex I countries 469 7.0-14.1 0.02-0.04% None
Non-Annex I countries
582 8.7-17.5 0.08-0.15% 10-20
G77 465 7.0-13.9 0.07-0.14% 6.7-13.4
Least Developed Countries
13 0.2-0.4 0.06-0.12% 0.3-0.5
Small Island Developing States
99 1.5-3.0 0.45-0.89% 0.7-1.5

18 International Transport, Climate Change and Trade
From these numbers it appears that the expected increase in the value of imports due to CO2 policy in maritime shipping can be substantial for raw materials. The reason is that a relatively high share of the value of raw materials can be attributed to maritime transport costs.
The increase in consumer prices, rather than the increase in the value of imports, is more useful in measuring the economic impact of a policy. Percentage increase in consumer prices will, on average, be lower than the increase in the value of imports because consumer prices are, as a general rule, higher per unit (due to value added in the importing country). Therefore, one can treat the percentage price increase estimated for the value of imports
as a higher bound estimate for the increase in consumer prices. The difference between the expected percentage increase between import prices and consumer prices will be the highest for manufactured goods, as these are most likely subjected to several transactions resulting in price mark-up before they reach the consumer.
Where there is a larger market share for domestic production, the less likely it is that the exporter would be able to pass an increase in transportation costs through to the end consumer due to competition from domestic producers. Conversely, where there is little or no domestic production, the exporter is more likely to be able to pass the increased costs on to the end consumer.
Table 7: Increase in import value of two selected imports
Source: OECD Maritime Transport Costs Database, Faber et al., 2010
Commodity Exporter Year
Ad valorem maritime transport
costs
Transport mode
Transport costs increase
(allowance price US$ 15-30)
Increase in import
value
Coffee Brazil 2006 0.02 Container 8-16% 0.1-0.3%
Cereals Argentina 2005 0.30 Clean Bulk 4-11% 1-3%
2006 0.23 Clean Bulk 4-11% 1-3%
Table 6: Estimated percentage increase in value of the world’s total imports for different types of commodities for the year 2010 and fuel price US$ 600 per tonne
Source: CE Delft, 2009
Type of commodity
Ship type*
Average transport costs ad
valorem (%)
Average value of goods (US$/
tonne)
Percentage increase in value of goods for a CO2 price of (in
euros/tone), price7 25 45
Agriculture HB 10.89 740.50 0.33% 1.09% 1.85%
Raw materials CB 24.16 134.89 0.72% 2.90% 5.32%
Crude oil VLCC 4.03 448.88 0.12% 0.44% 0.81%
Manufactures C 5.11 3403.91 0.26% 0.87% 1.58%
*CB - Capesize bulker. *HB - Handy Size Bulker. *VLLC - Very Large Crude Carrier. *C - Container Vessel.

19ICTSD Programme on Trade and Environment
4.1.2 Impacts of rising maritime transport costs on food import costs
UNCTAD estimates33 that total freight costs (for all modes of transport) as a percentage of the value of imports is lower in developed countries than in developing countries. Some countries, particularly SIDS, since they are often remote and exposed to trade, are highly dependent on maritime transport for their food imports. Islands import most of their food by sea, with the possible exception of perishables
which may be imported by air. Table 8 presents a selection of countries where food imports account for a large share of GDP. Furthermore, the table indicates the increase in the costs of food imports assuming a tax level or emissions trading price of US$30 per tonne of CO2 and that all CO2 emissions will be covered by the scheme (this tax level corresponds to roughly US$90 per tonne of fuel). The table shows that as a share of GDP, increased costs of food imports range from 0.03–0.6 percent for a carbon price of US$30 per tonne of CO2.
Table 8: Food imports relative to GDP in selected developing countries
CountryShare of food
imports in GDP, 1999-2004 (%)
Increase in costs of food imports (% of food imports by
value) at US$30/ton of CO2
Increase in costs of food imports (as a % of GDP)
Sao Tome and Principe
28.02 0.37-0.62 0.10-0.17
Cape Verde 15.94 0.18-0.30 0.03-0.05
Tonga 12.77 0.33-0.55 0.04-0.07
Dominica 11.52 0.11-0.18 0.01-0.02
Samoa 11.23 0.32-0.53 0.04-0.06
Saint Lucia 10.95 0.03-0.06 0.003-0.007
4.1.3 Impacts of rising maritime transport costs on exports
In some countries, export-oriented industries account for a larger share of GDP than in others. A considerable proportion of these exports are transported by sea, certainly if measured on the basis of weight. In a global scheme with a level playing field for all participants, costs incurred due to a climate policy could, and generally would, be passed on to the clients of transport, thereby leaving most of the profit margin of agricultural producers intact. In a level playing field, the profit mark-up34 would not absorb the additional costs incurred due to a climate policy. However, climate policies that increase the costs of transport may result in lower demand for exports from these countries, and thus lower export countries’ overall profit.
The impact of maritime cost increases on exports is hard to assess. In the short term, they are unlikely to have an impact on the exports of manufactured goods because transport
costs make up only a small fraction of total costs. Even if these costs were transferred to consumer prices, it is unlikely that this would affect demand significantly. However, higher transport costs may have a larger impact on exports of raw materials because transport costs make up a larger proportion of their total costs. In the longer run, higher transport costs could influence decisions to relocate production so that it is closer to markets or to halt the current trend of fragmentation of production and value chains. However, it has to be noted that many factors affect the choice of production locations, such as relative costs of inputs of labour and materials.
The largest impact of climate policies on corporate profits would result from the impact of higher costs on the demand for transported goods. The shift in demand can be calculated by applying the price elasticity of demand to the cost increase. Assuming an elasticity of -0.25,35 a 6–7 percent rise in transport costs could result in a reduction in the level of
Source: FAO Statistical Yearbook 2005-2006, table C. 13 and CE Delft, 2008.

20 International Transport, Climate Change and Trade
maritime transport, which is predicted to grow at over 3 percent per year if there would be no increase in transport costs (Buhaug et al., 2009). A small transport cost increase could result in a substantial decline in yearly growth of the level of maritime transport. The reduction in exports is likely to be lower than the reduction in transport, because a share of the transport reduction will result from logistics improvements and other measures to reduce emissions, such as lowering speeds.
Some countries are more export-oriented than others. As a result, a significant share of their GDP may be in export-oriented industries. A large share of exports is transported by sea, especially if measured on a weight basis. Climate policies that increase the costs of maritime transport may result in lower demand for exports from these countries. Raw materials (a main export product of many developing countries) are likely to see the biggest increase in price due to transport costs.
Increased freight costs will have a larger impact where goods have a low value to weight ratio, as the increase in freight cost is a larger share of the final cost than for higher value added products. The impact on producers in exporting and importing countries will vary, depending on market shares and price elasticities.
4.1.4 Impacts of EU policies on countries that are geographically distant and economically vulnerable
EU policies addressing emissions from mari-time transport can affect countries outside
the EU in different ways. As described previously, transport costs are likely to rise which might adversely affect national economies, especially in countries heavily dependent on maritime transport. On the other hand reduced GHG emissions from shipping will reduce the negative impacts of climate change and might spur innovation and efficiency enhancements in the shipping sector. About 33 percent of the business-as-usual emissions in 2030 could be abated cost-effectively; EU legislation could raise awareness and knowledge of actors in the shipping sector and help utilise this potential. This would not only reduce emissions within the scope of any EU policies but also reduce fuel consumption and associated costs worldwide due to the global nature of the sector.
The recommended scope of EU policy includes emissions of ships travelling to EU ports between the port of laden and arrival in the EU. From this follows that imports from the EU by third countries would only be affected indirectly if at all, e.g. if goods from a non-EU country would be shipped via an EU harbour. Despite this other scopes are discussed and the analysis therefore assesses three different trade flows: (1) imports from the EU-27, (2) exports to the EU-27, and (3) the sum of these imports and exports. Table 9 gives an overview of the relevance of maritime trade with the EU for the three country groups as well as for all countries worldwide. It can be seen that for the three country groups maritime trade with the EU is about twice as important as the global average.
Table 9: Overview of maritime exports between different country groups and the EU (average 2000-2008 values)
Source: CE Delft, 2009 Note: Due to data gaps the table only includes information from 31 out of the 51 SIDS, 45 out of the 49 LDCs and 28 out of the 31 LLDCs. 150 countries are included under ‘all countries’.
GDP (billion)
Maritime imports from EU-27
Maritime exports to EU-27
Maritime imports & exports
Billion € % of GDP Billion € % of GDP Billion € % of GDP
SIDS 251.0 14.6 5.8% 8.0 3.2% 22.5 9.0%
LDC 383.3 13.7 3.6% 16.0 4.2% 29.7 7.7%
LLDC 304.9 4.0 1.3% 17.9 5.9% 21.9 7.2%
All countries 31105.4 543.1 1.7% 727.1 2.3% 1270.2 4.1%

21ICTSD Programme on Trade and Environment
For SIDS, least developed countries and landlocked developing countries, possible negative economic consequences have been assessed. These three country groups might be greatly affected due to their specific geographic locations as well as their sizes and economic potentials. The impacts have been assessed for exports from SIDS, LDCs and landlocked developing countries (LLDCs) to the EU-27 and imports from the EU-27 to these countries under three different impact scenarios (high, medium and low impacts, see Table 10)
The high impacts scenario is most likely a strong overestimation of potential impacts. A high impact scenario signifies that the effect of climate policy has a high impact on the sector, i.e. a low fuel price together with a high carbon price to mention two parameters. In the calculation of the potential impacts, the
following assumptions have been made:
• due to the small absolute quantity of exports there will be very limited direct shipping between EU ports and SIDSs, LDCs or LLDCs if at all; in most cases cargo will be transhipped at least once to larger vessels. Only emissions of the last ship which unloads the cargo in an EU harbour would be covered by such a scheme; for an accurate calculation of economic impacts information on actual trade routes would be necessary. However, that data is not publicly available. In this calculation a range of 40 to 80 percent of total carbon emissions are assumed to be within the scope of EU policy;
• transport costs compared to product value vary wildly, according to UNCTAD estimates.
Table 10: Overview of the different impact scenarios
Note: The low impact scenario signifies that the additional effect of policies addressing GHG emissions from shipping is small, i.e. in a world with high fuel prices and low carbon prices. Despite this, the sector would have lower total costs in the high impact scenario because the overall cost for fuel and carbon is lower than in the low impact scenario. Source: CE Delft, 2009
Inpu
t
Parameter UnitImpact scenario
Low Medium HighFuel price (US$/t fuel) 1,050 700 350
Carbon cost (€/t CO2) 22 55 100
Shipping efficiency improvement (%) 45% 33% 23%
Share of emissions within the scope (%) 40% 60% 80%
Fuel cost compared to overall costs (%) 50% 40% 30%
Transport costs compared to product value (%) 30% 8% 4%
Elasticity of demand (-) -0.2 -0.3 -0.8
Cal
cula
tion
Price increase of fuel combustion (%) 3.6% 20.0% 97.1%
Price increase of transport costs (%) 1.0% 5.4% 22.4%
Price increase of end user goods (%) 0.3% 0.4% 0.9%
Change of exports (%) -0.2% -1.6% -17.9%
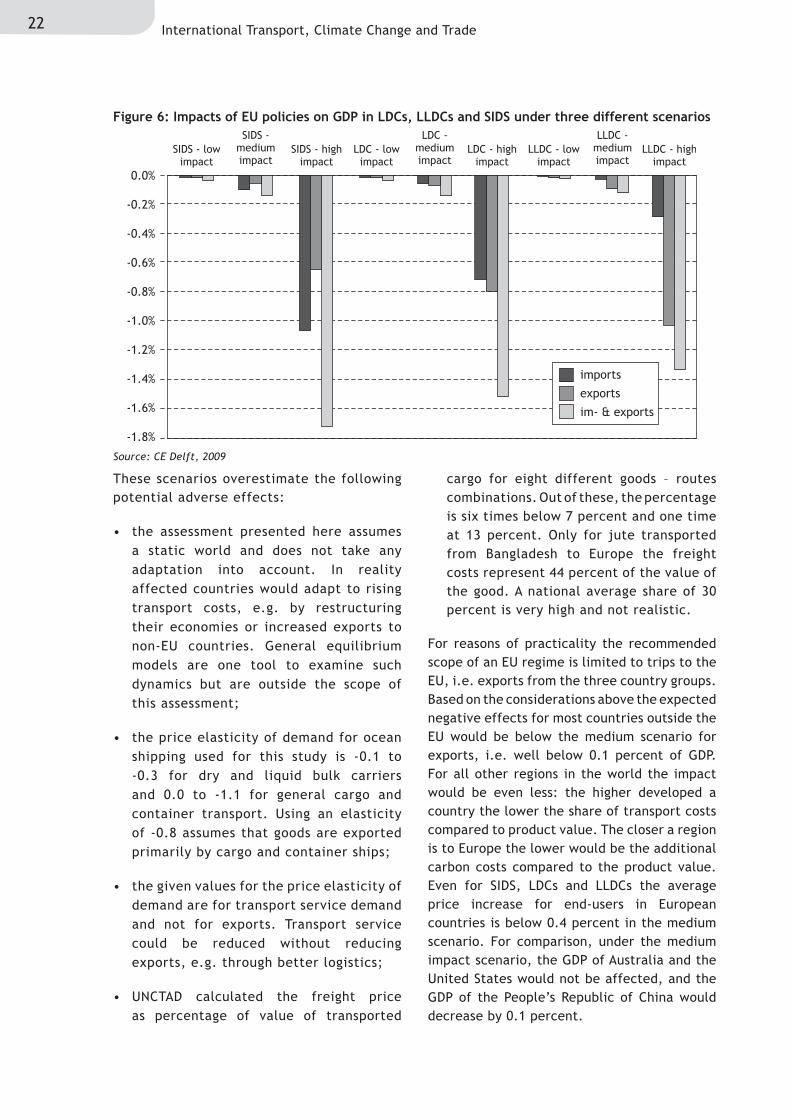
Using the values in table 10, the impacts on national economies of SIDSs, LDCs and LLDCs can be estimated (Figure 6). In the high impact scenario potential reductions in maritime trade with the EU would exceed 0.2 percent of the GDP. Overall there is little
difference between the country groups, especially if imports and exports are used for the assessment basis. However, SIDSs clearly have a negative maritime trade balance with EU Member States whereas LLDCs export more by shipping to the EU than they import.
22 International Transport, Climate Change and Trade
These scenarios overestimate the following potential adverse effects:
• the assessment presented here assumes a static world and does not take any adaptation into account. In reality affected countries would adapt to rising transport costs, e.g. by restructuring their economies or increased exports to non-EU countries. General equilibrium models are one tool to examine such dynamics but are outside the scope of this assessment;
• the price elasticity of demand for ocean shipping used for this study is -0.1 to -0.3 for dry and liquid bulk carriers and 0.0 to -1.1 for general cargo and container transport. Using an elasticity of -0.8 assumes that goods are exported primarily by cargo and container ships;
• the given values for the price elasticity of demand are for transport service demand and not for exports. Transport service could be reduced without reducing exports, e.g. through better logistics;
• UNCTAD calculated the freight price as percentage of value of transported
cargo for eight different goods – routes combinations. Out of these, the percentage is six times below 7 percent and one time at 13 percent. Only for jute transported from Bangladesh to Europe the freight costs represent 44 percent of the value of the good. A national average share of 30 percent is very high and not realistic.
For reasons of practicality the recommended scope of an EU regime is limited to trips to the EU, i.e. exports from the three country groups. Based on the considerations above the expected negative effects for most countries outside the EU would be below the medium scenario for exports, i.e. well below 0.1 percent of GDP. For all other regions in the world the impact would be even less: the higher developed a country the lower the share of transport costs compared to product value. The closer a region is to Europe the lower would be the additional carbon costs compared to the product value. Even for SIDS, LDCs and LLDCs the average price increase for end-users in European countries is below 0.4 percent in the medium scenario. For comparison, under the medium impact scenario, the GDP of Australia and the United States would not be affected, and the GDP of the People’s Republic of China would decrease by 0.1 percent.
Figure 6: Impacts of EU policies on GDP in LDCs, LLDCs and SIDS under three different scenarios
Source: CE Delft, 2009
0.0%
-0.2%
-0.4%
-0.6%
-0.8%
-1.0%
-1.2%
-1.4%
-1.6%
-1.8%
SIDS - lowimpact
SIDS -mediumimpact
SIDS - highimpact
LDC - lowimpact
LDC -mediumimpact
LDC - highimpact
LLDC - lowimpact
LLDC -mediumimpact
LLDC - highimpact
importsexportsim- & exports

23ICTSD Programme on Trade and Environment
Table 11: Importance of cruise tourism - the Caribbean as an example
DestinationCruise Passenger Arrivals, including day visits (2005)
Total Arrivals of Tourists who stay at least one night (2005)
Bahamas 3,349,998 1,514,532
Cozumel (Mexico) 2,519,179 276,515
US Virgin Islands 1,912,539 697,033
Cayman Islands 1,798,999 167,801
St Maarten 1,488,461 467,861
Puerto Rico 1,315,079 1,449,785
Jamaica 1,135,843 1,478,663
Belize 800,331 236,573
Barbados 563,588 547,534
Aruba 552,819 732,514
Source: Caribbean Tourism Organization.
Including maritime transport in a global climate policy regime could increase the costs of cruise travel and if this cost increase were to be passed through in prices, it could lower demand. This would not be primarily due to the price elasticity of demand, as most studies36 find tourism demand to be price inelastic (price elasticities of -0.4 to -0.8, although there are notable exceptions). More important is the choice tourists face: cross-elasticities in tourism demand seem to be high (Maloney and Montes Rojas, 2005), implying that demand shifts easily from one destination to another. Cross-elasticities between modes of transport are not reported, but if these are as high as between destinations, one would expect a shift in demand to other modes of transport. However, these other modes also have emissions, and if these are also included in climate policy,
relative prices of cruises are not expected to change much. The relative price of cruise holidays would only rise if maritime transport is included in climate policy, while aviation and car travel are omitted from policy.
4.1.6 Impacts on shipbuilding
Including maritime transport in a climate policy is likely to result in a demand for ships with lower CO2 emissions, which can be achieved either by modifying existing ships or replacing them with new ships. As a consequence, emission mitigation policy for maritime shipping is likely to have a positive effect on demand for shipyard services. As Figure 7 shows, most of the major shipyards are in Asia and two of them are non-Annex I countries.
4.1.5 Impacts on tourism
For some states, a significant share of GDP is earned in the tourism sector, and many tourists arrive by ship. Table 11 shows that for some tourist destinations in the Caribbean, cruise
passengers arrivals exceed arrivals by other means by up to a factor of ten. And although arrivals are a very crude approximation of economic value, it is clear that the tourism sectors in these countries and regions are focused on cruise passengers.

24 International Transport, Climate Change and Trade
4.1.7 Impact on competitiveness in the shipping market
Faber et al. (2010) analysed whether the introduction of a maritime emissions trading scheme (METS) would be likely to create distortions at the maritime shipping market. Under a METS scenario, owners of smaller and older ships would be placed in a disadvantageous position and would be more at risk of going out of business. However, even if such a phenomenon is likely to happen, this does not mean that the maritime shipping market would stop being competitive. On the contrary, this would only prove that the market works very well, by promoting more competitive and
economically efficient market players. While there may be a need to protect ship owners of particular types of ships (e.g. small ships) against the market consequences of this mechanism, the motives for such protection would not involve market distortion.
It is also worth noting that the climate policy instrument is in its essence aimed at eliminating (or at least alleviating) a market failure – that is, a failure to reflect social and environmental costs related to pollution in market prices. Thus, instead of creating distortions, successful introduction of an METS would rather help to deal with an unwanted external effect at the maritime shipping market related to global warming.
A case study commissioned by the Indian National Shipowners Association (INSA) looked at the impact of proposed market-based mechanisms on ships registered under the Indian flag. The goal of the study was to analyse the impact of MBI proposals on the cost of operating old and new ships. Oil tankers, gas carriers, and bulk carriers over 15,000 DWT of differing ages were selected for the study due to the reliability of the EEDI formula for those ship types and sizes. INSA had hypothesized that the greatest cost impact to their ships would come through implementing technology measures to lower GHG emissions. Upgrading ships with new technology would have the following implications for a shipowner:
• incur upfront capital costs to invest in more fuel-efficient design or equipment;
• change the operating cost structure;
Box 1: Impact of MBIs on Indian ship operators
Figure 7: Ship deliveries
Source : Lloyds register
40,000
35,000
30,000
25,000
20,000
15,000
10,000
5,000
0
1000 GT
1980 1984 1988 1992 1996 2000 2004
All other countries
China
Korea
Japan

25ICTSD Programme on Trade and Environment
• affect overall life-cycle profitability of the ship; and
• lower fuel consumption, resulting in cost savings.
1. Implementation of technical and operational measures to reduce fuel consumption would result in substantial savings, taking into account the projected increase in bunker fuel price and would reduce GHG emissions from the reduction in fuel consumption. This will depend where on the abatement cost curve the measures are and whether they are applicable to a particular ship. As an example of potential increases in fuel prices, the industry is expected to switch from HFO to more costly distillate fuel in 2020 due to changes in sulphur limits under the revised MARPOL Annex VI. This fuel switch is estimated to result in increased cost burdens that are 60 - 90% higher than current costs due to the higher cost of distillate fuel. In such a scenario, any efficiency improvements that help to reduce fuel consumption would also result in cost savings.
2. The Study also finds that newer ships will benefit more from efficiency measures than older ships. This is because the savings are calculated over the life span of the ship. Efficiency measures still resulted in cost savings for older ships; however, since older ships have fewer years left in service, their total resultant savings are estimated to be lower than those for newer ships.
3. In general, all market-based measures would increase the cost burden on old, fuel-inefficient ships since they consume more fuel than more efficient ships. The financial burden would increase with the increasing cost of offsetting emissions or an increased stringency of vessel efficiency standards. However, if abatement measures are introduced, the burden could be reduced.
4. The challenges that would be faced by the industry in implementing carbon mitigation measures include:
a.) Access to technology: especially for those shipping companies that do not have access to new technologies or the means to finance the acquisition of new technologies.
b.) Access to finance: This may be especially true for shipping companies in the developing world, which may find it harder to access the financing needed to implement carbon mitigation technologies than those in the developed world.
Box 1: Continued
4.1.8 Conclusions
The costs of any MBI vary between regions and country groups. They also depend on the price of allowances or levies. As an initial study of the impacts of MBIs, the maximum costs were estimated for three geographical regions. It was estimated that the cost increase of imports and other maritime services would be above 0.1 percent of GDP at an allowance price of US$ 30 per tonne of CO2.
The three regions that are most negatively affected are the Middle Eastern Gulf region, Africa and South East Asia. Overall the cost increase is likely to be lower than the estimates
for several reasons. First of all, ship owners and operators could improve the efficiency of maritime transport. Secondly, the cost increase will partly be offset by a substitution of imports by domestic production. Thirdly, ship movements to developing countries are often in ballast, with the most obvious example being crude tankers. The transport of crude is typically from developing countries to developed countries. The freight rates are set so that developed countries pay for both the transport and the return voyage. Hence, developed countries will pay for the cost increase on both legs of the voyage. Additionally, for South East Asia, the cost increase may be inflated by taking into

26 International Transport, Climate Change and Trade
Table 12: Overview of the three selected policy options for including aviation in the EU ETS
Source: CE Delft, 2005
Design element Option 1 Option 2 Option 3Coverage of climate impacts
CO2 and multiplier for non-CO2 climate impacts
CO2 only (with flanking instruments for other impacts)
CO2 only (with flanking instruments for other impacts)
Geographical scope
Intra-EU Emissions of departing flights from EU airports
EU airports
Trading entity Aircraft operator Aircraft operator Aircraft operator
Decision on allocation rules
Uniform approach set at EU level
Uniform approach set at EU level
Uniform approach set at EU level
Interplay with Kyoto Protocol
Aviation buys allowances from other sectors above a historic baseline
Unrestricted trading based on AAUs borrowed from other sectors
Trading with other sectors based on a gateway mechanism
Allocation method
Baseline Benchmarked allocation Auctioning
Monitoring method
Actual trip fuel reported by aircraft operator
Actual trip fuel reported by aircraft operator
EUROCONTROL data (ex ante and radar)
In all three policy options, Intra-EU routes are included in the EU ETS. However, the extent of the price increases introduced on these routes varies significantly between the three options. If an allowance price of € 30 per tonne of CO2 is assumed, in the case of Option 1 for every
tonne of CO2 an airline must in fact pay € 60. This is because of the assumed multiplier of 2, to account for non- CO2 climate impacts.38 In Option 2 the cost increase on Intra-EU routes is far more limited, because the non-CO2 effects are not taken into account.
account Singapore, a major shipping hub and bunker port. Lastly, when there is trade in two directions, trade is often unbalanced. A freight rate in the direction where demand is highest is typically higher than a freight rate in the other direction. It is likely that developed countries will pay a larger share of the cost increases (Faber et al., 2010).
As with all environmental regulations, in the end a balance must be struck between minimising the costs of regulations and building in sufficient incentives to promote R&D and pollution reduction.
Please see Annex A for an overview of the latest MBI proposals in the IMO and an appreciation of their impact on trade.
Please also refer to Annex B for an analysis
of the impact on trade in iron ore, crude oil, grains, and clothing and furniture.
Including aviation in the EU ETS is currently the best-assessed measure on aviation climate regulation. Hence this chapter will mostly focus on the economic and trade impacts of including aviation in the EU ETS as a case study for aviation emissions regulation. Also, the economic impact of a “climate levy” on flight tickets will be addressed.
4.2.1 Impact on transport volume
The EU study ‘Giving wings to emission trading’37 identifies 3 main policy options for including aviation in the EU ETS:
4.2 Economic impacts on aviation

27ICTSD Programme on Trade and Environment
Table 13: Impacts on transport volume on the EU market of the three selected Options (opportunity costs not passed on)
Source: CE Delft, 2005
EffectEffects relative to BaU case 2012
Option 1 Option 2 Option 3EU Non-EU EU Non-EU EU Non-EU
Allowance price €10 per tonne
Aircraft km -0.2% 0.0% -0.2% 0.0% -0.6% -0.1%
Revenue Tonne Km -0.1% 0.0% -0.1% 0.0% -0.5% -0.1%
Allowance price €30 per tonne
Aircraft km -0.4% 0.0% -0.3% 0.0% -1.8% -0.2%
Revenue Tonne Km -0.2% 0.0% -0.4% 0.0% -1.4% -0.2%
Table 14 below shows impacts on transport volume if opportunity costs are fully passed on in passengers’ ticket prices. Again it should be
stressed that in this case aircraft operators are faced with higher demand effects, but will raise at the same time so-called windfall profits.
Table 14: Impacts on transport volume on the EU market of the three selected Options (opportunity costs are fully passed on)
Source: CE Delft, 2005
EffectEffects relative to BaU case 2012
Option 1 Option 2 Option 3EU Non-EU EU Non-EU EU Non-EU
Allowance price €10 per tonne
Aircraft km -0.9% 0.0% -0.8% -0.1% -0.6% -0.1%
Revenue Tonne Km -0.5% 0.0% -0.7% -0.1% -0.5% -0.1%
Allowance price €30 per tonne
Aircraft km -2.4% 0.0% -2.3% -0.3% -1.8% -0.2%
Revenue Tonne Km -1.3% 0.0% -2.1% -0.4% -1.4% -0.2%
4.2.2 Change of competitive position of EU carriers vs. non-EU carriers
Besides examining general economic impacts, this study also looked specifically at potential economic distortions. Of particular concern were the effects on competition between EU and non-EU carriers.
The main conclusion is that none of the policy options considered in this study will damage the competitive position of EU airlines relative to non-EU airlines significantly. This is because all the options assume that the
scheme in question covers all the commercial aircraft operators flying a particular route, irrespective of nationality or type of operation. This implies that European and non-European airlines receive equal treatment under all the proposed policy options for including aviation in the EU ETS, which is not the case for other sectors already covered by the system. Most of their non-EU based competitors (e.g. the US steel industry) based outside the EU do not face similar cost increases as they are obviously not covered by the EU emissions trading scheme.
Furthermore, two alternative scenarios have been run for Options 1 and 2: one in which the opportunity costs of grandfathered permits are not passed on in ticket prices, and the other with opportunity costs passed on in their entirety.
Given the variation in the policy-induced cost increases across the three Options, there is a clear variation in effects. This is shown in Table 13 (for the scenario in which opportunity costs are not passed on).

28 International Transport, Climate Change and Trade
Consequently, both EU and non-EU carriers with the same emissions level would face the same cost increase on the same flight stage within the geographical scope concerned. However, as some airlines achieve a greater share of their turnover in the EU than others, it is important to know whether carriers will respond to this cost increase through price increases or reduced profit margins. None of the studies analysed in this report identify any convincing arguments for avoiding passing higher air fares on to customers. As a first-order effect, therefore, no distortion in competition among airline companies is expected. Moreover, model calculations show that the profit margins of EU and non-EU carriers would remain constant after introduction of the three policy options.
Besides profit margins, the competitive position of carriers might also be affected by changes in the size of their home market. Obviously, one second-order effect of including aviation in the ETS might be a slow-down in the growth of the European air transport market, caused by increased air fares compared to the business-as-usual scenario. A smaller home market for European carriers compared with their non-European counterparts might reduce economies of scale and thereby weaken the competitive position of European airlines. As shown above an allowance price range from € 10 to € 30 per tonne of CO2 would decrease air transport volume on the EU market by 0.1 percent to 0.2 percent under Option 1, by 0.1 percent to 0.4 percent under Option 2 and by 0.5 percent to 1.4 percent under Option 3, compared with a baseline growth of 17 percent between 2008 and 2012. Based on this impact on market size, it is clear that the introduction of all three policy options would not have a significant effect on economies of scale and thus the operating efficiency of EU carriers significantly, relative to non-EU carriers.
One possible distortion could still occur. Non-EU carriers will only be affected by inclusion of aviation in the EU ETS on a relatively small proportion of their flights, viz. flights to and from the EU. The response of non-EU based carriers might be to deploy their newest and cleanest aircraft on routes falling under the scheme, diverting older aircraft to other routes. This may then give non-EU carriers a competitive
advantage over EU carriers, because in order to keep abreast of their competitors the latter would need to buy new aircraft for all routes to and from the EU.
Although aviation is an international business, it is less vulnerable to economic distortions than other international sectors in the EU ETS. There are two reasons for this. First, the ‘product’ in the aviation industry, transport, is by definition geographically-bounded (to a major extent), with passengers and freight having relatively fixed origins and in many cases also relatively fixed destinations. An increase in the cost of European flights will not lead a Frenchman with business in Denmark, say, to buy a ticket from Los Angeles to Washington instead. In comparison, the steel sector, for instance, would appear to be more vulnerable, as the only relevant aspect here is the cost associated with producing the steel and transporting it to its place of use. Therefore, changes in taxation among countries could easily lead buyers to opt for steel produced outside the EU. A second reason is that, although recognising the ongoing liberalisation process in the aviation sector, the air transport market is highly regulated by bilateral air service agreements that limit competition from airlines outside the EU.
What would be the impact on tourism of a climate levy on flight tickets, particularly in the most vulnerable countries?
Tourists travelling to most vulnerable countries mostly come from developed countries, usually on long-haul flights. Demand for long-haul flights has a limited response to changes in prices. Even if a slight drop in demand is experienced, it is not likely to significantly affect the upward trend in tourist arrivals in most vulnerable countries. Between 1996 and 2006, tourist arrivals in Africa and South Asia increased at annual rates of 6 percent and 6.6 percent respectively, in a period when oil prices were also increasing. Maldives saw a 96 percent increase in tourist arrivals between 1995 and 2004, and experienced 96.4 percent occupancy rates in its hotels and resorts in 2007. In practice, therefore, a small levy is not likely to deter passengers from travelling, nor will it have any noticeable impact on emissions.

29ICTSD Programme on Trade and Environment
5. hOW TO OFFSET COSTS OF TRANSpORT CLIMATE REguLATION FOR VuLNERABLE COuNTRIES?
There are two main options for reducing the undesired economic impacts of a climate mitigation policy on developing countries: (i) limiting the scope of that policy; and (ii) using the revenues from economic instruments such as a levy and emission allowance auction rights to offset the costs of the climate mitigation measures for developing countries.
Aviation and shipping are inherently global industries. Airlines and shipping operators around the world are at an increasingly similar level of development. Their emissions reduction policies should be global as well, in order to minimise the risk of distortion and carbon leakage, as well as to respect the principles of equal treatment of operators that apply in IMO and ICAO. Under global emissions trading schemes, or levies on fuel or emissions, obligations would fall not on Parties but rather on private entities operating largely in international waters or airspace.
Global sectoral approaches seem appropriate in the international transport sectors, given their trans-boundary nature. Implementation of such a co-operative sectoral approach to bunker emissions would be a modality of Article 4.1(c) of the UNFCCC,39 the article that mentions common but differentiated responsibilities. However, Article 4.1 stipulates that sectoral approaches should take into account Parties’ common but differentiated responsibilities, and Article 4.3 of the UNFCCC states that developed country Parties should meet the incremental costs that developing country Parties must incur in order to participate in such schemes.
Schemes must be designed with these pro-visions and CBDR in mind. Two ‘equity safeguards’ have been proposed to ensure that global policies are in line with the principles of the Convention: 1. the transfer of revenues to developing countries and 2. limiting the scope of mitigation policy.
Transfer of revenues to developing countries:
Some countries, in partnership with the WWF and IMERS have suggested including international aviation and marine emissions in a climate mitigation instrument as a deliberate mechanism for raising funds to finance adaptation and mitigation in developing countries (UNFCCC, 2007 and 2008b).40
“Innovative sources of finance” (para. 8 of the Copenhagen Accord) must be tapped so that developed countries can make good on their promise to help developing countries with climate change mitigation and adaptation. These financing sources are the key to establishing a US$100 billion a year long-term fund by 2020. It is commonly accepted41 that revenues raised from regulating aviation and maritime transport would qualify as these innovative sources of finance. The Advisory Group on Climate Change Finance (AGF), for example, is looking at different mechanisms for raising the US$100 billion per annum by 2020 that was referred to in the Copenhagen Accord. Raising finance from mechanisms used to tackle emissions from bunker fuels is on this list of options.
Further progress on bunker fuel emissions with the UNFCCC process may hinge on the key but divisive issue of finance. In order to ensure that developing countries, and especially the most vulnerable, benefit from global sectoral approaches, policies should be designed to raise revenue, either through auctioning of permits under an ETS, or via levies. This revenue should then be spent exclusively in developing countries. The revenue could be used for compensating the increased costs of imported goods and for adaptation to climate change and technology transfer under programmes already operated by IMO and ICAO.
There is a considerable scope for reducing the economic impact on non-Annex I countries by using revenues from climate regulation in the shipping and aviation sectors, while leaving
5.1 policy Options

30 International Transport, Climate Change and Trade
room to fund other causes. There are several ways to do so, each with advantages and disadvantages:
• direct compensation – in this case, a co-untry that faces an increase in import costs of a certain amount would receive the equivalent sum from these revenues. This result would enable these countries to reduce taxes; countries could also invest the money in mitigation and adaptation. This option would only yield additional climate benefits if countries decided to use those revenues for that purpose. In practice, it could be hard to measure the impact on costs of imports, as information on emissions for routes to countries would be required. Collecting such data from ship owners could impose a large administrative burden on them. Moreover, it may be hard to include land-locked countries in such a scheme;
• compensation based on import shares – in this case, countries would get compensation in proportion to their share of global imports (assuming that the importer bears the cost). Nigeria and Liberia made this proposal to UNFCCC COP1542 but withdrew it later. Again, this method would enable these countries to reduce taxes, for instance; countries could also invest the money in mitigation and adaptation. This option would not be a direct compensation for increased costs and some countries may receive more and others less than the additional costs they
incur. For example, countries whose imports are transported in less efficient ships (smaller, older and/or faster ships) would receive less while other countries would receive more. This option would not yield additional climate benefits, nor would it be related to the need for climate finance. In practice, it would be easier to implement than the previous option as trade-data is regularly collected. The option could also be extended to land-locked countries. Table 4 on p. 16 provides a quantitative synopsis of how compensation might work if developing countries were compensated on the basis of their share in global imports;
• compensation based on need for climate finance – in this case, countries would receive compensation in proportion to their need for climate finance, perhaps based on their nationally appropriate mitigation actions (NAMA) and national adaptation programmes of action43 (NAPAs) or other types of adaptation plans. The purpose of this compensation would not be to reduce taxes directly, but rather to prevent the need for a rise in taxes by providing non-tax income that can be spent on adaptation and mitigation. This option would not be a direct compensation for increased costs and some countries may receive more and others less than the additional costs they incur. In practice, it could be implemented if it could build on existing procedures for drafting and approving of plans and programmes.
Table 15: Value of imports as share of the global total, 2004–2008 average
Table 15 indicates that LDCs could receive 1.0 percent of the funds collected (US$ 225 million) and SIDS 2.6 percent (US$ 585 million). This is less than the first-order economic impact on these countries; therefore, a scaling factor should be contemplated (Faber et al., 2010).Source: WTO
Country group Share of global imports
Annex I countries 66.9%
Non- Annex I countries 33.1%
G77 22.2%
Least Developed Countries 0.8%
Small Islands and Developing States 2.5%

31ICTSD Programme on Trade and Environment
In summary, directly compensating countries for their higher import prices would be complex, on an administrative level. A compensation based on the quantity of imports would create net beneficiaries and net contributors; however, it would probably be more feasible from an administrative point of view. Compensation based on climate financing needs would also create net beneficiaries and net contributors, but it would be more in line with the general objective of an ETS.
In order to ensure transparency and predic-tability, revenues from MBIs could be collected and managed by an international body with equitable representation, rather than by national governments. These funds can help
expand participation in a post-Kyoto accord. As such several of the proposed MBIs may be more effective in raising revenues to help achieve a global climate change “deal” than for reducing CO2 emissions from the maritime sector.
Table 16 below estimates the potential revenue from an ETS or a levy under two scenarios, assuming a price of US$30 per tonne of CO2. (In the case of a levy, if set to reflect the carbon content of the fuel at US$30 per tonne of CO2, revenues would be the same, since all emissions would effectively be charged at US$30 per tonne of CO2, and a proportion of this revenue would then be used to buy offset credits down to the cap).
Table 16: Potential revenues from global mitigation policies in the shipping and aviation sectors
WWF, 2009
Cap, ie allowances auctioned (MtCO2)
Auction revenue in
2020
Purchase of market credits in
2020 (MtCO2)
Value of market credit purchase in
2020 (US$bn)Cap
1990 -40% 470 $14.1 bn 1160 US$34.8 bn
1990 levels 783 $23.5 bn 847 US$25.4 bn
As can be seen from Table 16, policies to tackle emissions from the two sectors could make a significant contribution to meeting international climate financing commitments.
Please refer to Annex D for an overview of emissions, benefits and costs of a carbon price on shipping fuel for different regions and country groups
The sectors would also finance additional mitigation via the carbon markets. As the majority of international transport emissions are related to Annex I activity, though the majority of carbon market-finance activity is in non-Annex I countries, this would also represent a net flow of finance from developed to developing countries.
Limiting the scope of the emissions mitigation policy
There are various options available to limit the scope of a climate mitigation policy
with regard to international aviation and maritime transport.
First, in principle, market-based options could be applied to carriers from Annex I countries or ships registered in Annex I countries only, in accordance with the CBDR principle. Accordingly, the developed country Parties should take the lead in combating climate change and the adverse effects thereof. Since Annex I and non-Annex I country carriers may compete on the same routes, this could lead to unequal competition. Although the UNFCCC requires developed countries to take the lead in combating climate change and the adverse effects thereof, it is doubtful whether the international community would accept unequal competition within the aviation and maritime sectors. In particular, unequal competition could be considered unacceptable between carriers from developed countries, which are subject to emission reduction obligations under the Kyoto Protocol, and carriers from ‘developing’ economies, such

32 International Transport, Climate Change and Trade
as Singapore and Hong Kong, which have highly competitive airlines. Furthermore, particularly in maritime transport, simply specifying that ships having an Annex I country flag would need to reduce their emissions while other ships would not likely be ineffectual, as ships can easily change flags (also see Annex A). This result would amount to carbon leakage (there is an increase in CO2 emissions in one country as a result of an emissions reduction by a second country with a strict climate policy).
Therefore, a more realistic option would be to limit the scope of a climate policy for international aviation and maritime transport by applying de minimis thresholds. The effect of these thresholds should be to exempt traffic to and/or from SIDS and LDCs (since these emissions are a tiny fraction of the problem). Note again that policies should not exempt operators registered in SIDS and LDCs, as many ships trading largely between developed countries fly flags of third countries – often SIDS or LDCs.
In practice, as specified already for the inclusion of aviation in the EU ETS, a series of interlocking thresholds would be applied, which would be the subject of detailed negotiation. Options include thresholds that exempt:
• routes to and/or from the most vulnerable developing countries;
• operators who fly less than a given frequency or transport less than a given tonnage of goods;
• aircraft/ships below a certain size.
Finally, to address the food security issue, one could think of the exclusion of certain cargo types such as food.
One proposal that gives a detailed account of how revenues could be spent is the International Maritime Emissions Reduction Scheme (IMERS, also see section 3.1.1.6 on p. 17). The total revenue collected by IMERS depends on its parameters, especially the target, the carbon price and emissions pathways. For a levy of US$27 per tonne of fuel, the receipts would be approximately US $ 10 billion per annum. In emissions trading proposals, where all permits are auctioned, this figure is in the order of US$ 30-45 billion per annum. Revenues would be divided as follows under IMERS:
5.2 The International Maritime Emissions Reduction Scheme: use of Revenues
Table 17: Division of revenues under IMERS
Source: Stochniol, 2008
Total revenue
42% Adaptation32% LDCs
8% SiDs
60% Other developing countries and EITs
42% Mitigation50% REDD
50% JI/CDM
16% Technology50% Short-term technology transfer
50% Long-term R&D
Table 18 below presents the costs and benefits of IMERS for different country groups, assuming that the costs of IMERS are the additional costs of imports. Developed countries would pay the lion’s share of total revenue, though receiving little from the funds. In contrast, all other country groups receive more than what they
must pay in costs. For these country groups, the components for which they receive funds differ. The LDCs and SIDS would benefit most from the scheme due to the significant adaptation financing built in to the system. In contrast, the BRIC countries will benefit mostly from the CDM /JI investments and REDD funding.

33ICTSD Programme on Trade and Environment
Table 18: Costs and benefits of IMERS for different country groups
Source: Stochniol, 2008
Country groupShare of revenue
paymentShare of revenue
receipts
Developed Countries 59% 5%
Economies in Transition (without Russia) 2% 3%
BRIC 16% 30%
Least Developed Countries 1% 15%
Small Islands and Developing States 1% 4%
Other Developing Countries 22% 44%
It is not self-evident how to allocate the emissions of international flights to countries, which makes it difficult to argue on the basis of the principle of common but differentiated responsibilities between countries. This is why the passenger levy is primarily seen as a solidarity levy, based on the personal capability of airline passengers to compensate the poorest and most vulnerable people for the impacts caused by these international emissions.
As a solidarity levy, it is clear that anybody who can afford to fly business or first class is sufficiently capable to pay this compensation. As for economy class travel, there may be circumstances – such as in the case of relatively poor migrant workers – where an exemption might be justified. However, the best way to deal with such cases would be for the relevant government to pay the levy on behalf of these passengers from sources such as international climate change finance or budget support ODA. In the case of Bangladesh, for example, this would currently amount to US$40 million per
annum, or about 1 percent of remittances or 3 percent of ODA.
There are several ways to mitigate undesired impacts on developing countries. The most promising seems to be compensation using the revenues from MBIs, which can take many forms. After compensation, there would still be sufficient funds to finance other causes. The most direct compensation would require ship and airplane operators to monitor and report emissions per voyage, which could be administratively complex. Indirect forms of compensation would overcompensate some, while leaving others undercompensated. Still, they would be easier to implement from an administrative point of view. In addition, it would be feasible to exempt ships and airplanes that travel exclusively to and from certain isolated regions. Other options seem to have important drawbacks. Excluding routes could lead to avoidance of the scheme which would reduce its environmental effectiveness. Excluding certain cargoes would be administratively very complex as ship owners would have to allocate emissions to different cargoes.
5.3 how to Offset the Impact of Civil Aviation Regulation?
5.4 how to Offset Costs of Transport Climate Regulation: Conclusion

34 International Transport, Climate Change and Trade
6. COMpLIANCE WITh INTERNATIONAL LAW
The Convention on International Civil Aviation, also known as the Chicago Convention, established the International Civil Aviation Organization (ICAO). The ICAO is a specialised agency of the United Nations that is charged with coordinating and regulating international air travel. The Convention establishes rules of airspace, aircraft registration and safety, and details the rights of the signatories in relation to air travel. Should the obligation to purchase emissions allowances be perceived as a tax, the Chicago Convention could be a stumbling block, given that it prohibits the taxation of fuel on board an arriving flight. A subsequent web of bilateral deals exempts taxes on all aviation fuel.
Under the rules of the Chicago Convention,44 it has been questioned whether or not Europe can impose a cap-and-trade scheme on either EU or non-EU airlines. Any signatory to the Chicago Convention may apply non-discriminatory rules to the aircraft of other states operating within its airspace. The fact that the rules apply to all airlines, EU-based or not, shows that this practice is in compliance of this requirement. Were it only applied to EU-based airlines, this practice would actually breach the rules of the Convention.
According to several non-EU airlines, extending the EU ETS to aviation still breaches the Chicago Convention, because no nation or bloc can unilaterally extend its jurisdiction over flights into another nation’s territory. According to them, a jet taking off from Houston for London would have to surrender allowances covering emissions for the entire flight, including the portion in which the plane flew in US airspace. The applicants are not against the concept of economic measures per se – however, they are ‘’deeply concerned by Europe’s regional approach which will distort competition and lead to carbon leakage.’’45 The ETS is not set to distort competition though. It merely requires
an operator to surrender permits covering flight fuel burn when it lands.
The Air Transport Association of America (ATA) and three major US airlines – American, Continental and United – already filed an application in the UK Administrative Court in December 2009, in which they asked that the court conduct a judicial review of the UK Department of Energy and Climate Change (DECC),46 particulalrly concerning the Aviation Greenhouse Gas Emissions Trading Scheme Regulations 2009. Under the EU ETS, the UK is the administering state for the three US airlines. The UK court has referred the legal action to the European Court of Justice as it involves EU legislation. The European Court of Justice has allowed a group of environmental NGOs from Europe and the USA to act as interveners. The NGOs argue that the ATA case has no basis in law.
An example of a bilateral agreement that the ATA claims is being infringed upon is the US-EU Air Transport Agreement (the ‘Open Skies Agreement’), signed in 2007. Also, ATA claims that the ETS is in conflict with Article 2.2 of the Kyoto Protocol and UNFCCC negotiating texts; these agreements ask Parties to “work through” the International Civil Aviation Organization.
The General Agreement on Tariffs and Trade (GATT) prohibits differentiated treatments of goods based on their country of origin. As the proposed emission charges are not linked to the country of origin or to any specific goods directly, and do not need to refer to Article XX of the GATT (the “exemptions clause”), which allows for exemptions to WTO rules on the grounds of environmental protection.
Article XX of the GATT specifically allows non-discriminatory measures for environmental protection. Again, the non-discriminatory
6.1 Aviation in the Eu ETS: in Conflict With Chicago Convention, Open Skies and kyoto protocol Rules?
6.2 Aviation in the Eu ETS: in Conflict With WTO Rules?47

35ICTSD Programme on Trade and Environment
aspect implies that aviation’s inclusion in the EU ETS must include all airlines operating within the EU regardless of their country of origin. The environmental protection aspect of Article XX would seemingly endorse the EU’s approach in including the aviation sector in the EU ETS as a means of achieving this.48
In 2007 the EU ETS reportedly would soon become the subject of a WTO trade dispute.
Referring to the differences over the reach of the European emissions trading scheme, C. Boyden Gray, then US ambassador to the EU, said “[t]he Europeans are confident of their legal authority and people on the other side are equally confident of their position. It sounds like a lawsuit to me. I don’t see how it’s going to get resolved politically”.49 Since then, however, the US has been quiet on more specific WTO-related measures.
Box: Relevant requirements of the GATT 1994
WTO Agreement, preamble:
“Recognizing that their relations in the field of trade and economic endeavour should be conducted with a view to […] allowing for the optimal use of the world’s resources in accordance with the objective of sustainable development, seeking both to protect and preserve the environment and to enhance the means for doing so in a manner consistent with [members’] respective needs and concerns at different levels of economic development”
Article III – National Treatment
Article III.1 requires that internal taxes and other internal charges, and laws, regulations and requirements affecting the marketing of products are not applied to imported or domestic products so as to afford protection to domestic production (emphasis added).
Article III.4 stipulates that imported products shall be accorded treatment no less favourable than that accorded to “like” domestic products in respect of all laws, regulations and requirements affecting the internal sale, offering for sale, purchase, transport, distribution or use of products (emphasis added).
Article V – Freedom of transit
Goods (including baggage), and also vessels and other means of transport, are in transit across the territory of a contracting party when the passage across such territory is only a portion of a complete journey beginning and terminating beyond the frontier of the contracting party across whose territory the traffic passes. There shall be freedom of transit through the territory of each contracting party. No distinction shall be made which is based on the flag of vessels, the place of origin, departure, entry, exit or destination, or on any circumstances relating to the ownership of goods, of vessels or of other means of transport.
Article XX – General Exceptions
Requires that measures are not applied in a manner which would constitute a means of arbitrary or unjustifiable discrimination between countries where the same conditions prevail, or a disguised restriction on international trade. Apart of this nothing in GATT-Agreement shall be construed to prevent the adoption or enforcement of measures:
b) necessary to protect human, animal or plant life or health; ….
g) relating to the conservation of exhaustible natural resources if such measures are made effective in conjunction with restrictions on domestic production or consumption.

36 International Transport, Climate Change and Trade
Rules for the allocation and trade of emission units may also constrain the import of energy products generated by combustion of fossil fuels. Such climate measures could be in violation of WTO rules that seek to guarantee non-discrimination and market access. Within WTO law, considerable “legal leeway” exists with regards to climate measures; an analysis of the possibility of this “leeway” is therefore necessary. This analysis should include whether international emissions trading falls within the scope of WTO agreements, whether it might violate substantive rules of these WTO agreements, and if so, whether it could be permitted by exemption clauses (Voigt, 2008).
The United Nations Convention on the Law of the Sea (UNCLOS) defines the rights and responsibilities of nations in their use of the world’s oceans. It codifies the principle of international customary law. UNCLOS aims to balance interests of international community and global commons, and therefore codifies the dominance of international law over national law with respect to the high seas.
The following articles are most relevant: 89 (invalidity of claims of sovereignty over the high seas), 136 (common heritage of mankind), 137 (legal status of the area), and 203 (preferential treatment for developing countries). Regarding air pollution articles 212 and 222 are most relevant. The practical outcome of these articles is that ‘innocent
passage’ prohibits states from regulating the emissions of ships that sail through their waters, but not of ships entering their ports, given that states have sovereignty over their ports.
UNCLOS does not explicitly regulate equitable division of revenues raised from international emission charges proposed. However, it describes the final rules for the preferential treatment of developing countries (funds, technical assistance, specialized services) and deals with the similar problem of unclear sovereignty, with regards to minerals discovered in the sea bed under the high seas. The revenue from exploitation of these minerals should be distributed equitably (Article 140: Benefit of mankind). Thus, UNCLOS could provide a legal framework for supra-national approaches.
Article 3(5) of UNFCCC states:
“The Parties should cooperate to promote a supportive and open international economic system that would lead to sustainable economic growth and development in all Parties, particularly developing country Parties, thus enabling them better to address the problems of climate change. Measures taken to combat climate change, including unilateral ones, should not constitute a means of arbitrary or unjustifiable discrimination or a disguised restriction on international trade”.
This reinforces the non-discrimination beginnings that are at the heart of WTO trade policy.
6.3 WTO Law and International Emissions Trading: Is There potential for Conflict?
6.4 united Nations Convention on the Law of the Sea (uNCLOS)
6.5 Cross-references to International Trade in the Climate Change Regime

37ICTSD Programme on Trade and Environment
7. SuMMARY AND RECOMMENDATIONS FOR FuRThER RESEARCh
Given that nothing concrete has come out of Copenhagen for either aviation or maritime emissions reductions, many challenges remain for these two sectors. Without a clear steer to ICAO or IMO, the bunkers issue could remain in policy limbo for the foreseeable future.
From an industry perspective, there may now be an increased risk of the ‘patchwork quilt’ of policies that airlines and the shipping industry have been so keen to avoid, as individual countries or regions implement their own measures to deal with emissions. As stated previously, a global sectoral approach supported by ambitious targets is probably the most cohesive way forward and would achieve the best results.
The reduction cost analyses in this paper provide insights into two key issues: (1) CO2 reduction costs are rather small for most countries50 when compared with transport costs and export value; and (2) the reluctance of major developing world countries to accept binding CO2 reduction regulations is the result of policy strategy in the overall climate negotiations, rather than out of pure economic concerns.
With these facts in mind, policy makers need to consider policy options that will involve the most participants and consider the interests of both developed and developing countries. The following institutional arrangements could be viable options:
(1) Make it clear that what happens in IMO carries no weight in regard to what happens in the broader international climate negotiations and vice versa. In other words, if developing countries agree to reduce CO2 from ships, that precedent does not apply to climate negotiations in other fields. Those developing
countries do not need to make a binding promise generally just because they made a commitment under the IMO or ICAO. On the other hand, the CBDR principle in the UNFCCC does not override the equal treatment principle in the IMO and ICAO either.
(2) Alternatively, the IMO and ICAO can wait until a clearer picture emerges from global climate negotiations and until major developing countries accept binding agreement in global CO2 reduction. Under this approach, however, the IMO and ICAO will meet pressure from every corner and may lose some authority in the ship-based CO2 reduction regime.
(3) A middle road is to turn to voluntary CO2 reduction and avoid seeking binding commitments from developing countries. While this method may attract more participants, it also has its limitations. Specifically, the voluntary reduction method may not be capable of meeting the reduction target set by other stakeholders and UNFCCC.
In addition to these three options, the World Wildlife Fund, other environmental NGOs and the International Maritime Emission Reduction Scheme (or IMERS, see section 3.1.1 on p.17) have proposed the application of market-based instruments with the consideration of CBDR. This would be a compromise in the conflict between CBDR and the No Favorable Treatment principle. The market-based policy instruments generate revenues, and these revenues are then distributed to different country groups. Developed countries would pay the reduction costs, though only receiving a limited amount of these revenues. Other countries would receive more funds than they generate. The LDCs and SIDS would receive the largest shares. The BRIC countries (Brazil, Russia, India, and China) would receive more than they have paid as well. However, major developing countries tend to oppose this proposal.
7.1 how to get the Support from Developing Countries?

38 International Transport, Climate Change and Trade
For large countries, especially China, India, and Brazil, the extra cost of climate regulation is so small that other strategic concerns prevail. They may not want to set the precedent in international climate change negotiations of reducing CO2 at the same level as the developed world. Instead, they may want to assure the right of development and make the developed world take the lead. Therefore, current proposals designed to rebate the amount of money dedicated to CO2 reduction to those developing countries does not address these main political and strategic concerns (Wang, 2010).
One question is how to allocate emission allowances: by free allocation or by auctioning them.
Auctioning allowances has the following economic advantages:
• it promotes economic efficiency if the auction revenues are used to reduce distortionary taxes;
• it avoids the windfall gains associated with free allocation, and;
• it has positive effects on industry dynamics as it treats new entrants, closing entities, growing and declining entities alike.
However, there are two reasons to allocate allowances for free:
• ensure equal treatment of industries covered by the EU ETS (such as power stations);
• temporarily allocate allowances freely in order to give a sector time to adjust to new circumstances.
The IMO’s approach would involve a global emissions trading system. The EU ETS is designed to help the EU to control its
emissions. The EU’s purpose is not to grow it globally. If other countries develop their own schemes the EU says they would harmonise the systems. For example, trade between the Maritime Emissions Trading Scheme (METS) and the EU ETS could be made possible by establishing a link between them.
Given that nothing concrete has come out of the Copenhagen Climate Conference for either aviation or maritime emissions reduc-tions, many challenges remain for these two sectors. Without a clear mandate for ICAO or IMO, the bunkers issue could remain in policy limbo for the foreseeable future.
From an industry perspective, there may now be an increased risk of the ‘patchwork quilt’ of policies that airlines and the shipping industry have been so keen to avoid, as individual countries or regions implement their own measures to deal with emissions.51
Policy-makers need to consider options that will involve the most participants, keeping in mind the interests of developing countries. Three possible institutional arrangements may deserve some attention.
We are in the situation where for political reasons negotiations in the IMO and ICAO are blocked as some countries are concerned that moving away from the principle of CBDR in these for a may have repercussions in the wider climate negotiations. Alternatively, the redistribution of revenues from MBIs may contribute towards the practical imple-mentation of CBDR.
If the IMO and ICAO wait for a clearer picture from global climate negotiations until countries agree on binding targets in global CO2 reduction, they may lose authority in a future CO2 reduction regime.
Finally, voluntary emissions reduction may not meet the targets needed to avoid runaway climate change.
7.2 how to Implement Maritime Emissions Trading in the Eu ETS?
7.3 The Way Forward

39ICTSD Programme on Trade and Environment
From a sustainable development perspective, it is very important to take into account that climate change, whether induced by the maritime transport sector or by other sectors, is a global issue, and thus, mitigation measures would require participation from all nations. However, the amount and type of contribution could differ as per the divergent circumstances of different states, particularly developing countries. This forms the crux of CBDR principles adopted by the UNFCCC and has been very well integrated within the framework of the Kyoto Protocol. A similar kind of effort is needed to address GHG emission from international transport. Before adopting any measure, whether it is technological, operational or market based, the approach towards implementation of these measures must beclear. Finally, to reach this level of understanding and cooperation,better coherence is needed between the work of IMO, IATA, ICAO,
UNFCCC, the WTO and other international organisations.
Many questions for further research remain if we want to address the problem of rapidly increasing emissions from bunker fuels. Among them are:
• What is the environmental effect of exempting countries (or routes/sizetreshold/products) from climate regulation? And what is the economic effect on individual countries?
• When the proceeds of auctioning allowances are used to finance climate policy in developing countries, what will be the balance of costs and benefits for all countries involved?
• What will be the impact on trade patterns of individual countries? For instance, how will value chains change when the price of raw materials relative to finished products increase as a result of higher transport costs?

40 International Transport, Climate Change and Trade
ENDNOTES
1 also see p. 11.
2 http://www.imo.org/includes/blastDataOnly.asp/data_idpercent3D18900/IntShippingFlyerfinal.pdf .
3 2nd IMO Greenhouse Gas Study.
4 Faber et al., 2010.
5 Split incentives are transactions or exchanges where the economic benefits of energy conservation do not accrue to the person who is trying to conserve, for example a ship owner may be less inclined to invest in energy efficient ships when the ship operator and not the ship owner will benefit directly from lower operating costs through lower fuel use.
6 Also see http://ictsd.org/i/trade-and-sustainable-development-agenda/74410/.
7 http://www.trbav030.org/pdf2008/TRB08my_Gupta_ACCRI.pdf.
8 IPCC Fourth Assessment Report.
9 http://www.greenaironline.com/news.php?viewStory=368.
10 Lee et al. 2009.
11 Both on a seat-kilometre (the total number of seats offered multiplied by the distance flown) and ton-kilometre (the total weight of passengers and freight multiplied by the distance flow ) basis.
12 http://pre2010.theicct.org/documents/ICCT_Aircraft_Efficiency_final.pdf.
13 A winglet is a near-vertical extension of an airplane’s wing tips.
14 The Montreal Protocol regulates substances responsible for ozone depletion.
15 While ICAO is a international organization where states are members, IATA is an international industry trade group of airlines. IATA’s mission is to represent, lead, and serve the airline industry. For the carbon neutral growth in 2020 consept also see http://www.iata.org/pressroom/pr/2009-06-08-03.htm.
16 The preamble of the UNFCCC acknowledges “that the global nature of climate change calls for the widest possible cooperation by all countries and their participation in an effective and appropriate international response, in accordance with their common but differentiated responsibilities and respective capabilities and their social and economic conditions”.
17 http://www.rina.org.uk/c2/uploads/mepc percent2058_4_21.pdf.
18 The Marine Environment Protection Committee (MEPC) is IMO’s senior technical body on marine pollution related matters.
19 Increasingly also called ‘Market-based measures’ or ‘MBMs’.
20 Proposal by France, Germany and Norway, MEPC 59/4/25.
21 EU Directive 2009/29/EC.
22 MEPC 59/4/5 and MEPC 60/4/8, in addition to Denmark supported by Cyprus, the Marshall Islands and Nigeria.

41ICTSD Programme on Trade and Environment
23 Ibid.
24 The industry association of the liner shipping industry.
25 See, for example, http://ideas.repec.org/p/rff/dpaper/dp-98-02.html and http://ideas.repec.org/p/rff/dpaper/dp-97-17.html and Weitzman, M.L. (1974): “Prices vs. Quantities”, Review of Economic Studies, 41:477-491.
26 Emissions from fuel used for international aviation and marine transport are exempt from the New Zealand emissions trading scheme, whereas fuels used for domestic aviation and shipping.
27 Chiavari/Withana/Pallemaerts, 2008; The Role of the EU in Attempting to ‘Green’ the ICAO.
28 Nancy LoBue, the Federal Aviation Authority’s Acting Assistant Administrator, Aviation Policy, Planning and Environment, quoted on www.greenaironline.com.
29 This means that emissions in 2020 will become the baseline and that all growth in emissions after 2020 will be offset.
30 http://www.tyndall.ac.uk/publications/briefing_notes/bn26.pdf.
31 The proposal was submitted to the UNFCCC AWC-LCA by the Group of Least Developed Countries within the framework of the Bali Action Plan on 12 December 2008.
32 In the Copenhagen Accord, struck at the December 2009 UN climate summit, developed countries agreed to provide poorer nations with “new and additional resources” of about US$30 billion for the 3-year period 2010-2012 to help them with climate change mitigation and adaptation. Also, the developed countries committed in Copenhagen to “a goal of mobilising jointly US$100 billion dollars a year by 2020 to address the needs of developing countries”. Also see http://ictsd.org/i/news/biores/74825/.
33 REVIEW OF MARITIME TRANSPORT 2007, http://www.unctad.org/en/docs/rmt2007fas_en.pdf.
34 Markup is the difference between the cost price and selling price of an item / cost price x 100 percent.
35 Oum, Waters and Yong (1990) present elasticities ranging from 0 to -1.1, with low values (-0.06 to -0.25) typically attributable to dry bulk for which there are hardly any alternative modes of transport, and higher values (0 to -1.1) attributable to general cargo. Meyrick and Associates et al. (2007) estimate the elasticity of non-bulk maritime transport to and from Australia at -0.23.
36 Most notably Crouch, 1994.
37 http://ec.europa.eu/environment/climat/pdf/aviation_et_study.pdf.
38 The climatic impact of aviation is 2 to 5 times that of its CO2 emissions alone . The 2-5 variable is related to the climate impact of cirrus clouds that can form out of aviation-induced contrails.
39 Article 4.1(c) of the UNFCCC reads “All Parties, taking into account their common but differentiated responsibilities and their specific national and regional development priorities, objectives and circumstances, shall (…) promote and cooperate in the development, application and diffusion, including transfer, of technologies, practices and processes that control, reduce or prevent anthropogenic emissions of greenhouse gases not controlled by the Montreal Protocol in all relevant sectors, including the energy, transport, industry, agriculture, forestry and waste management sectors”.

42 International Transport, Climate Change and Trade
40 Earmarking revenues from global market-based instruments would also bring them in line with the ICAO Council Resolution on Environmental Charges and Taxes adopted in December 1996 and endorsed by the 32nd ICAO Assembly. This resolution strongly recommends “that the funds collected should be applied in the first instance to mitigating the environmental impact of aircraft engine emissions”.
41 See, e.g. http://ec.europa.eu/economy_finance/articles/international/documents/inno vative_financing_global_level_sec2010_409en.pdf.
42 Innovative Financing and International Maritime Emission Reduction Scheme. Proposal by Nigeria and Liberia, Draft COP 15 decision, 04 Nov 2009.
43 NAPAs provide a process for Least Developed Countries (LDCs) to identify priority activities that respond to their urgent and immediate needs to adapt to climate change – those for which further delay would increase vulnerability and/or costs at a later stage.
44 The main global treaty on passenger flights.
Article 11 of the Chicago Convention reads: Subject to the provisions of this Convention, the laws and regulations of a contracting State relating to the admission to or departure from its territory of aircraft engaged in international air navigation, or to the operation and navigation of such aircraft while within its territory, shall be applied to the aircraft of all contracting States without distinction as to nationality, and shall be complied with by such aircraft upon entering or departing from or while within the territory of that State.
Article 15 includes the following provision: “No fees, dues or other charges shall be imposed by any contracting State in respect solely of the right of transit over or entry into or exit from its territory of any aircraft of a contracting State or persons or property thereon”.
Finally, Article 24 says “Fuel, lubricating oils, spare parts, regular equipment and aircraft stores on board an Aircraft of a contracting State, on arrival in the territory of another contracting State and retained on board on leaving the territory of that State shall be exempt from customs duty, inspection fees or similar national or local duties and charges”.
45 http://www.greenaironline.com/news.php?viewStory=774.
46 DECC/DfT has posted a YouTube message that picks out the key topics from the current consultation and provides an update of progress to date. Presentations from the seminar will shortly be posted on the DECC website.
47 A good source for materials and/or advice on the WTO aspect, if one still has doubts about the legality of harmonized charge as proposed, is the Centre for International Sustainable Development Law in Montreal, Canada.
48 http://www.greenaironline.com/news.php?viewStory=260.
49 http://ictsd.org/i/news/biores/9134/.
50 Under specific circumstances, policies addressing emissions from international maritime transport could affect these countries in a noticeable way. Despite this, the effect on individual countries with specific circumstances might be higher.
51 See e.g. the EU proposal to include shipping and aviation in the EU ETS

43ICTSD Programme on Trade and Environment
52 See Wilmsmeier and Hoffman (2010) for a related discussion.
53 United Nations Conference on Trade and Development (UNCTAD) (2010), “Oil Prices and Maritime Freight Rates: An Empirical Investigation”, UNCTAD/DTL/TLB/2009/2, April 1, 2010.
54 Korinek and Sourdin (2009).
55 MEPC 60/4/54, A Global Maritime Emissions Trading System: Design and Impacts on the Shipping Sector, Countries, and Regions.
56 The study makes use of data in MEPC 60/4/54 (Germany), A Global Maritime Emissions Trading System: Design and Impacts on the Shipping Sector, Countries, and Regions.

44 International Transport, Climate Change and Trade
REFERENCES
Buhaug et al., 2009, Buhaug, J.J. Corbett, Endresen, V. Eyring, J. Faber, S. Hanayama, D.S. Lee, D. Lee, H. Lindstad,A.Z. Markowska, A. Mjelde, D. Nelissen, J. Nilsen, C. Pålsson, J.J. Winebrake, W.Q. Wu, K. Yoshida Second IMO GHG study 2009 London : International Maritime Organisation (IMO), 2009.
CE Delft, 2005, Giving wings to emission trading: Inclusion of aviation under the European emission trading system (ETS): design and impacts.
CE Delft, 2009, Technical support for European action to reducing Greenhouse Gas Emissions.
Crouch, 1994, Geoffrey I. Crouch Price Elasticities in International Tourism In : Journal of Hospitality & Tourism Research, Vol. 17, No. 3, 27-39.
DNV (Det Norske Veritas), 2009, Henrik Madsen, Tor Svensen, Sverre Alvik, Øyvind Endresen, Tore Longva and Magnus Eide Pathways to Low Carbon Shipping : Abatement potential towards 2030 Høvik : Det Norske Veritas.
Faber, 2009, presentation at the UNCTSD Multi-year Expert Meeting On Transport and Trade Facilitation ‘Maritime Transport and the Climate Change Challenge’.
Faber et. al., 2010, A Global Maritime Emissions Trading System Design and Impacts on the Shipping Sector, Countries and Regions Delft, CE Delft.
International Chamber of Shipping, 2009, Shipping, World Trade and the Reduction of CO2 Emissions.
IPCC, 2007, W.N. Adger, S. Agrawala, M.M.Q. Mirza, C. Conde, K. O’Brien, J. Pulhin, R. Pulwarty, B. Smit, K. Takahashi, Assessment of adaptation practices, options, constrains and capacity.
Korinek and Sourdin, 2009, Jane Korinek and Patricia Sourdin Maritime Transport Costs And Their Impact On Trade OECD paper http://www.etsg.org/ETSG2009/papers/korinek.pdf.
Kuhn and Beaufoy, 2009, Australia: Trade & Transport Bulletin - Shipping And Climate Change Impacts.
Lee, et al., 2009, D. S. Lee, David W. Fahey, Piers M. Forster, Peter J. Newton, Ron C.N. Wit, Aviation and global climate change in the 21st century.
Lee, et al., 2010, D.S. Lee, H, Preston, L. L. Lim, B. Owen, V. Eyring and J. Faber, Taking responsibility: setting a CO2 emissions cap for the aviation and shipping sectors in a 2-degree world.
Ling L. Lim, Bethan Owena, Robert Sausen, Aviation and global climate change in the 21st century, also available at http://www.tiaca.org/images/tiaca/PDF/IndustryAffairs/2009 percent20IPCC percent20authors percent20update.pdf.
Maloney and Motes Rojas, 2005, W. Maloney and G. Montes Rojas How elastic are sea, sand and sun? Dynamic panel estimates of the demand for tourism.
MARINTEK et al., 2008, MARINTEK, CE Delft, Dalian Maritime University, Deutsches Zentrum für Luft- und Raumfahrt e.V., DNV, Energy and Environmental Research Associates, Lloyd’s Register-Fairplay, Mokpo National Maritime University (MNMU), National Maritime Research Institute (Japan), Ocean Policy Research Foundation (OPRF) Updated Study on Greenhouse Gas Emissions from Ships, phase 1 report MARINTEK: Trondheim, 2008.
45ICTSD Programme on Trade and Environment
Meyrick and Associates et al., 2007, Meyrick and Associates, GHD and Booz Allen Hamilton International and Domestic Shipping and Ports Study, report to DTEI on behalf of the Australian Maritime Group (AMG).
Oum et al., 1990, Oum, T.H., W.G. Waters II, Y.S. Yong, A Survey of Recent Estimates of Price Elasticities of Demand for Transport, Worldbank Productivity Commission.
Resource Analysis and CE, 2008, Analyse van de implicaties voor Vlaanderen van beleidsmaatregelen voor de internationale scheepvaart inzake klimaat en verzurende emissies (analysis of the impacts on Flandres of policy measures for international maritime transport in the fields of climate and acidifying emissions) Report to the Flemisch Admistration Brussels/Delft : Resource Analysis/CE Delft, 2008.
Russell, Wang and Zeinali, 2009, Marginal Abatement Costs of CO2 Emissions Reduction and Market-Based Mechanisms and the Pricing of Credits.
Stochniol, André, 2008, Architecture for Mitigation, Adaptation and Technology Transformation for International Transport: ‘Global and Differentiated’, Paper for Harvard Project on International Climate Agreements, London.
Tol, 2002, Estimates of the damage costs of climate change. Part 1 : benchmark estimates. In : Environmental Resource Economics, 21, 47-73.
UNCTAD, 2007, Review of Maritime Transport 2007.
UNCTAD, 2010, Trade and Environment Review 2009/2010. http://www.unctad.org/en/docs/ditcted20092_en.pdf.
Voigt, C., 2008, Carbon and Climate Law Review, Vol. 1, No. 2, pp. 54-66.
Wang, H., 2010, GHG Marginal Abatement Cost and Its Impacts on Emissions per Import Value from Containerships in United States.
Wang, H., 2010, Economic Costs For The Compliance Of Non-Annex I Countries For CO2 Reduction From International Shipping, Energy for Sustainable Development (in press).
WWF, 2008, Submission to SBI from WWF.
WWF, 2008, Left on the High Seas: Global Climate Policies for International Transport.
WWF, 2009, International Bunkers - Briefing Paper.

46 International Transport, Climate Change and Trade
ANNEx A: OVERVIEW OF LATEST pROpOSALS FOR MARkET-BASED INSTRuMENTS IN ThE ShIppINg SECTOR AND ThEIR IMpACTS ON TRADEThe following provides a brief overview of the ten latest proposals for MBIs in the IMO and shows potential impacts on trade relevant to these specific proposals.
1. An International Fund for Greenhouse Gas emissions from ships (GHG Fund) proposed by Cyprus, Denmark, the Marshall Islands, Nigeria and IPTA (MEPC 60/4/8)
Would establish a global reduction target for international shipping, set by either UNFCCC or IMO. Emissions above the target line would be offset largely by purchasing approved emission reduction credits. The offsetting activities would be financed by a contribution paid by ships on every tonne of bunker fuel purchased. It is envisaged that contributions would be collected through bunker fuel suppliers or via direct payment from shipowners. The contribution rate would be adjusted at regular intervals to ensure that sufficient funds are available to purchase project credits to achieve the agreed target line. Any additional funds remaining would be available for adaptation and mitigation activities via the UNFCCC and R&D and technical co-operation within the IMO framework.
Impact on trade:
The impacts of any rise in bunker fuel prices due to the imposition of an MBI will depend on the trade route (especially with respect to distance) and the competition from domestic and third country producers, type of cargo, and ship size. The results suggest that, at the levels of contribution being proposed, the impact on freight rates would be relatively small.
The impact of the increased freight costs could result in increased prices for consumers, depending on the market structure for that product. The results also suggest that the increases in consumer
prices in the importing country could benefit domestic producers, though at the expense of domestic consumers.
This proposal, as it applies to every tonne of bunker fuel sold, should not result in any competitive distortion as all Party ships and all ships, both Party and non-Party, going to a Party port must pay the contribution. Ships that are less fuel-efficient, and hence use more fuel, would be affected to a greater extent than the more efficient ships. Routes that are serviced by older, smaller, less efficient ships may be disadvantaged by this measure, but application of zero-cost efficiency measures could offset the impact of the proposal by reducing fuel costs, and hence the price of shipping for these routes. This proposal applies the “polluter pay” principle in that those ships that pollute the most pay the most. This could become a driver for investments in more efficient ships and technologies, depending on the level of the price signal. Such a transition to more efficient vessels could be assisted by use of the international fund.
With respect to modal shift, unless the price rise is significant, the shift from sea to road or rail should not occur. A modal shift may occur if the relative price of shipping by sea relative to road or rail increases sufficiently to cause shippers to look for shorter sea routes and move more cargo by land. Since, however, port infrastructure is also a large determinant of freight costs; it may take significant changes in relative freight rates to cause any modal shift. More analysis is needed on this issue.
2. Leveraged Incentive Scheme (LIS) to improve the energy efficiency of ships based on the International GHG Fund proposed by Japan (MEPC 60/4/37)
Is designed to target “direct” reduction of CO2 emission primarily from the shipping

47ICTSD Programme on Trade and Environment
sector. The concept of the Leveraged Incentive Scheme is that a part of the GHG Fund contributions, which are collected on marine bunker is refunded to ships meeting or exceeding agreed efficiency benchmarks and labelled as “good performance ships”.
Impact on trade:
As this proposal is based on the same principle as that outlined in the GHG Fund (MEPC60/4/8), the potential impacts would be the same. As ships would have an incentive to be below the required EEDI and to improve their EEOI, this could advantage those ships and companies that have greater access to financing. This is because they would have more readily funding available to adopt more efficient technologies. Since, any ship that achieved relative improvements in its EEOI to a certain level would be eligible for refunds. Both older and newer ships would have the possibility to be rated as “good performance ships”. However, further assessment is needed as to whether the proposal creates competitive distortion. Even though there would be fuel cost savings from such investments, as noted, the upfront investment expenditures could serve as a barrier. Funding new technologies for ships serving LDCs and SIDS could be another potential use for the international fund.
This proposal is not expected to result in modal shift or competitive distortion.
3. Achieving reduction in greenhouse gas emissions from ships through Port State arrangements utilizing the ship traffic, energy and environment model, STEEM (PSL) proposal by Jamaica (MEPC 60/4/40)
Is an IMO global agreement, Member States participate in levying a uniform emissions charge on all vessels calling at their respective ports based on the amount of fuel consumed by the respective vessel on its voyage to that port (not bunker suppliers). The proposal is directly aimed at reducing
maritime emissions of CO2 without regard to design, operations, or energy source. The Port State Levy would be structured to achieve the global reduction targets for GHG and could be leveraged in a manner as proposed by Japan to reward vessels exceeding efficiency targets.
Impact on trade:
This proposal would charge ships for the emissions for each leg of their journey. The same assessment as for the GHG Fund (MEPC 60/4/8) is applicable to this proposal.
The ship would be charged for each leg, and that charge would have to be distributed in some manner to the non-discharged cargo owners, similar to the way other costs are distributed for cargos destined for multiple ports. If the effect of this measure, or similar measure, was substantial, there could be a service distortion for routes served by ships serving widely distributed ports, such as in SIDS, where only small amounts of cargo are discharged at each of the ports, but where the cargo for the next port is still being carried. This could lead to shifts in service delivery with some individual islands being served by smaller, single port ships.52
4. The United States proposal to reduce greenhouse gas emissions from inter-national shipping, the Ship Efficiency and Credit Trading (SECT) (MEPC 60/4/12)
Is designed to focus emission reduction activities just in the shipping sector. Under SECT, all ships, including those in the existing fleet, would be subject to mandatory energy efficiency standards, rather than a cap on emissions or a surcharge on fuel. As one means of complying with the standard, SECT would establish an efficiency-credit trading programme. The stringency level of these efficiency standards would be based on energy efficiency technology and methods available to ships in the fleet. These standards would become more stringent over time, as new technology and methods

48 International Transport, Climate Change and Trade
are introduced. Similar to the EEDI, these efficiency standards would be based on a reduction from an established baseline and would establish efficiency standards for both new and existing ships. The SECT is designed to achieve relative GHG reductions, i.e. reductions in emissions per tonne mile and not to set an overall target for the sector.
Impact on trade:
In this proposal, if ships do not meet the standard or make operational or efficiency improvements to meet the standard, one option for compliance would be to purchase efficiency credits. Such credits would be available from more efficient ships that are above the standard and were issued with credits for the amount they were above the standard. This could lead to a cost saving for transporting goods on those ships, relative to less fuel-efficient ships.
More efficient ships would have the ability to generate and sell credits, which would allow them to offset some or all of the costs associated with purchasing and installing fuel-efficiency equipment. The efficiency savings would not be exclusive to newer, more efficient ships; indeed some older ships could have significant cost-savings from inexpensive efficiency improvements. However, less fuel-efficient ships would, by definition, need to do more to meet the standard. It is uncertain whether the reduction in the overall costs of the transportation of goods onboard more efficient ships would be passed on to consumers in the short term. In the long term, these savings or costs would be passed on, so exporters and importers could reduce their costs by using more efficient ships.
Where less efficient ships are widely used, there would be higher costs to import goods into those countries. A regulatory requirement to implement cost-efficient measures could offset some of these cost increases.
Because the proposal encourages more fuel-efficient ships, the proposal has the potential to provide long term benefits to trade in both developed and developing countries. Low maritime transportation costs have played a large role in the expansion of world trade over the last few decades. This expansion of world trade has allowed developing countries to better participate in the global market place.
Disruption and distortion could potentially occur if certain ships on certain routes were unable to trade due an inability to obtain sufficient credits, or not being able to afford the permits where there was an inability to pass the costs through. This could impact the competitiveness of certain routes. On the other hand, the proposal would provide an incentive for inefficient ships to become more efficient, leading to reduced operating costs.
The proposal suggests there could be a phase-in period, with only ships with EEDI-approved baselines covered in the initial phase and “very old ships” (that is, ships that would be decommissioned in the next three years) being exempted during the initial years of implementation. Such an exemption could be beneficial to shipowners with older ships, provided the replacement of such ships is economically feasible for the shipowner.
5. Vessel Efficiency System (VES) proposal by World Shipping Council (MEPC 60/4/39)
Would establish mandatory efficiency standards for both new and existing ships. Each vessel would be judged against a requirement to improve its efficiency by X% below the average efficiency (the baseline) for the specific vessel class and size. Standards would be tiered over time with increasing stringency. Both new build and existing ships would be covered. New builds must meet the specified standards or they may not operate. New builds, once completed, are not defined as existing ships. The system applicable to existing

49ICTSD Programme on Trade and Environment
ships sunsets when today’s fleet turns over. Existing ships may comply by improving their efficiency scores through technical modifications that have been inspected and certified by the Administration or recognized organizations. Existing ships failing to meet the required standard through technical modifications would be subject to a fee applied to each tonne of fuel consumed. The total fee applied (non-compliant ships only) would vary depending upon how far the vessel’s efficiency (as measured by the EEDI) falls short of the applicable standard. A more efficient ship would pay a smaller penalty than a less efficient ship that falls short of the standard by a wide margin.
Impact on trade:
This proposal is similar to the one in the SECT proposal (MEPC 60/4/12), but in place of credits, ships that did not meet the standard would have to pay a fee on each tonne of fuel consumed, based on how far the ship’s actual efficiency deviated from the standard. Thus, a ship that was only slightly less efficient that the standard would pay less than a ship that was more inefficient. It is uncertain whether the reduction in the overall costs of the transportation of goods onboard more efficient ships would be passed on to consumers in the short term. In the long term, these savings or costs would be passed on, so exporters and importers could reduce their costs by using more efficient ships.
Where less efficient ships are widely used, there would be higher costs to import goods into those countries. A regulatory requirement to implement cost-efficient measures could offset some of these cost increases.
Because the proposal encourages more fuel-efficient ships, the proposal has the potential to provide long term benefits to trade in both developed and developing countries. Low maritime transportation costs have played a large role in the expansion of world trade over the last few
decades. This expansion of world trade has allowed developing countries to better participate in the global market place.
6. The Global Emission Trading System (ETS) for international shipping proposal by Norway (MEPC 61/4/22)
Would set a sector-wide cap on net emissions from international shipping and establish a trading mechanism to facilitate the necessary emission reductions, be they in-sector or out-of-sector. The use of out-of-sector credits allows for further growth of the shipping sector beyond the cap. In addition the auction revenue would be used to provide for adaptation and mitigation (additional emission reductions) through UNFCCC processes and R&D of clean technologies within the maritime sector. A number of allowances (Ship Emission Units) corresponding to the cap would be released into the market each year. It is proposed that the units would be released via a global auctioning process. Ships would be required to surrender one Ship Emission Unit, or one recognized out-of-sector allowance or one recognized out-of-sector project credit, for each tonne of CO2 they emit. The Norwegian ETS would apply to all CO2 emissions from the use of fossil fuels by ships engaged in international trade above a certain size threshold. The proposal also indicates that limited exemptions could be provided for specific voyages to Small Island Developing States.
Impact on trade:
An emissions trading system establishes a price on carbon through the price of the allowances. In theory, for the same level of emission reductions, the price of the allowance should equal the price of a measure needed to achieve the same emission reductions. Thus, the impacts on the costs of transporting goods and the impact on end consumers should be the same whether a reduction measure is applied or there is an emissions trading system. In practice, the impacts on costs and prices

50 International Transport, Climate Change and Trade
of the two measures may not necessarily be the same for a number of reasons, including differences in transactions costs between emissions trading and paying a contribution.
If all the allowances were auctioned, there would be no competitive distortion. However, ships that were more efficient would not have to buy as many allowances as ships that were less efficient. Thus, the system favours ships that are already efficient, but also provides an incentive for ships that are less efficient to improve their efficiency.
The need to purchase allowances will raise the cost of shipping freight in a similar fashion to a direct contribution on bunker fuels. The conclusions of the analysis of the impact of an increase of bunker fuels on freight costs and the pass-through of freight costs to final consumers in the importing country then apply.
The proposal suggests that gross tonnage limits could be applied to limit the scope of applicability of the measure. A gross tonnage limit of 400 GT would imply that just over 42,500 ships would be covered. If this limit were raised to 1,000 GT, just under 34,900 vessels would be covered, which would cover an estimated 98% of carbon dioxide emitted by ships of 400 GT and above. A threshold of 4,000 GT would cover just over 24,000 ships and cover an estimated 91% of the carbon dioxide emitted
by ships 400 GT and over. There is not sufficient information available to establish with certainty how many of the ships exempted would be owned by companies in developing countries. However, an indication is available in MEPC 60/WP.5.
7. Global Emissions Trading System (ETS) for international shipping proposal by the United Kingdom (MEPC 60/4/26)
Is very similar in most respects to the global ETS proposal by Norway. Two aspects of the UK proposal that differ from the Norwegian ETS proposal are the method of allocating emissions allowances and the approach for setting the emissions cap. The UK proposal suggests that allowances could be allocated to national governments for auctioning. It also suggests the net emission cap would be set with a long term declining trajectory with discrete phases (for example, five to eight years) with an initial introductory or transitional phase of one to two years.
Impact on trade:
Many of the comments above relating to the Norwegian ETS apply to ETS proposal by the United Kingdom. In addition, the proposal specifically notes that further analysis would be needed to determine an appropriate minimum size for the inclusion of ships in the emissions trading scheme that would maximize coverage while minimizing administrative burden (MEPC 60/4/26 paragraph 23).
Table 20
Ship size threshold (GT) No of shipsNo. of ships as % of
ships ≥400 GTEmissions (as % of emissions
from ships ≥400 GT)
≥400 42,697 100% 100%
≥500 39,180 92% 99%
≥1,000 34,866 82% 98%
≥2,000 30,138 71% 96%
≥4,000 24,267 57% 91%
≥5,000 22,311 52% 89%
≥10,000 17,346 41% 81%

51ICTSD Programme on Trade and Environment
8. Further elements for the development of an Emissions Trading
System (ETS) for International Shipping proposal by France (MEPC 60/4/41)
Sets out additional detail on auction design under a shipping ETS. In all other aspect the proposal is similar to the Norwegian proposal for an international ETS.
Impact on trade:
Many of the comments above relating to the Norwegian ETS apply to the ETS proposed by France.
9. Market-Based Instruments: a penalty on trade and development proposal by the Bahamas (MEPC 60/4/10)
Does not set explicit standards or reductions to be achieved in the shipping sector or out-of-sector for GHG reductions. The proposal clearly sets forth that the imposition of any costs should be proportionate to the contribution by international shipping to global CO2 emissions. Bahamas’ Focal Point has indicated that it is assuming that mandatory technical and operational measures would be implemented such as the EEDI. The proposal would apply to all ships engaged in both domestic and international maritime transport as fuel prices impact all market segments and trades.
Impact on trade:
This proposal argues against the imposition of any market-based measure on the grounds that reducing GHG emissions from the shipping industry can only come through technical and operational changes. For this reason, the Bahamas does support the development of the EEDI and EEOI. Market-base measures that would lead to increases in fuel prices are seen as imposing a penalty on trade and development. Instead, it is argued that if there is no market-based measure, then this results in a saving relative to the case where a market-based measure is implemented. The proposal
suggests that a general increase in fuel prices would, in any case, be a driver for more fuel-efficient ships. An issue with this approach is that for less efficient ships, a significant increase in fuel prices could disproportionately affect those services. This, in turn, would feed into the price of imported goods, as discussed above. There would not be any funds generated for adaptation and mitigation activities.
If, however, a market-based measure is put in place, then the “penalty” on shipping should not be larger than 2.7%; that is, it should not be larger than the contribution of the maritime shipping industry to global GHG emissions.
This proposal would not result in any competitive distortion or change in trade patterns.
10. A Rebate Mechanism (RM) for a market-based instrument for international shipping proposal by IUCN (MEPC 60/4/55)
Focuses on a Rebate Mechanism to compensate developing countries for the financial impact of a MBI. A developing country’s rebate would be calculated on the basis of their share of global costs of the MBI, using readily available data on a developing country’s share of global imports by value as a proxy for that share (or another metric such as value-distance if data becomes available). The proposal indicates that, in principle, the Rebate Mechanism could be applied to any maritime MBI which generates revenue such as a levy or an ETS. In order to evaluate the proposal, the Rebate Mechanism has been assessed integrated with a MBI (see MEPC 60/4/55).
Impact on trade:
This proposal proposes adding a Rebate Mechanism to any of the market-based measure proposals. The rebate would be distributed to developing countries on the basis of each country’s share of global

52 International Transport, Climate Change and Trade
imports by value. These funds could be used to offset some of the impacts on consumers due to increases in the price of goods as a result of the imposition of a market-based measure.
Any potential for competitive distortion would arise from the market-based measure itself, and not from the rebate.
The proposal suggests the application threshold for a given market-based measure could be set at a level higher than 400 GT. It is suggested that the ship size threshold could be set at 4,000 GT, at least initially (MEPC 60/4/55 paragraph 33). According to Table 19-3, this would represent just over 24,000 ships covering 91% of the emissions that would be covered if a threshold of 400 GT was used. There is insufficient infor-
mation available to establish with certainty how many of the ships exempted would come from developing countries. However, an indication is available in MEPC 60/WP.5.
The IUCN proposal allows developing countries to be compensated for any decrease in exports and increases in the price of imports that might occur as the result of the implementation of a market-based measure. The IUCN proposal would not, however, compensate for lost competitiveness. The funds flow to governments and not to companies that might be directly impacted by the measure. The proposal would, on the other hand, partially mitigate any costs to developing countries. It is up to countries to decide how they would use the rebate.

53ICTSD Programme on Trade and Environment
ANNEx B: ANALYSIS OF IMpACT ON TRADE IN SELECTED gOODS: IRON ORE, CRuDE OIL, gRAINS, AND CLOThINg AND FuRNITuRE
There are only a few statistical studies that analyse how an increase in the costs of freight could affect the costs to consumers of imports and few that analyse the impact of freight cost increases on producers in the exporting country.
While the studies are not directly comparable because different models and data sets were used, the results are indicative and help to inform the assessment of potential impacts of the measures.
The impacts of bunker fuels prices on freight rates and freight rates on trade, consumers, and producers depend on many factors. This includes the type of cargo; the economic structure of the importing and exporting country; the trade route; the size of ship; and the supply and demand, not only for the product, but also for cargo space on the ship. For this reason, most studies looks at indicative routes and cargo traded, by vessel type. In this section, the impacts on four types of cargo are analysed: iron ore (Capesize); crude oil (VLCC); grains (Panamax); and furniture and clothing (container).
With respect to the ability of exporters to pass on any increase in freight costs to consumers, the larger the market share domestic production has for the goods in question, the less likely it is that the exporter would be able to pass an increase in transportation costs through to the end consumer due to competition from domestic producers. Conversely, where there is little or no domestic production, the exporter is more likely to be able to pass the increased costs on to the end consumer.
Increased freight costs will also have a larger impact on exporters of goods that have a low value-to-weight ratio, as the increase in freight cost is a larger share of the final cost than for higher-value added products.
Iron ore
Iron ore is a bulk commodity that has a low value to weight ratio, and therefore a relatively high average freight rate on an ad valorem basis. The results suggest that a 10% increase in either oil prices or bunker fuel prices will lead to increases in iron ore freight costs of around 10%. There is a range, depending on the estimation. An UNCTAD study53 found that a 10% increase in Brent crude oil prices led to an increase in iron ore freight costs between 8 and 10%, depending on which other independent variables were included in the analysis. Vivid Economics estimates that a 10% increase in bunker fuel price will lead to around a 10% increase in iron ore freight costs. This average, however, reflects a range from a 5% to a 14% increase, depending on the route and the size of the exporting firms.
For iron ore exports to China, the results suggest that exporters are more likely to be able to pass through an increase in costs and maintain their market share the closer they are to China and the larger their domestic iron ore exporters are. The results indicate that a country like India, which has many small exporters, would lose market share due to an increase in freight costs caused by a market-based measure. The results show a lesser impact on Brazil than India due to the dominance in its iron ore export market of a large, efficient firm. Australia, on the other hand, with both a short distance and large, efficient producers, would experience the least impact of the three countries.
The price increase for iron ore in China is estimated to be around 1.5%, which benefits Chinese ore producers, as their prices would rise as well, but represents a cost increase for domestic Chinese producers that use iron ore in production of their products.

54 International Transport, Climate Change and Trade
Crude oil
VLCC freight rates for shipping crude oil are moderately sensitive to bunker price increases. UNCTAD (2010) finds that the effect of fuel oil prices on freight rates are between 2.2% and 2.8%, depending on the equation estimated. Vivid Economics estimated that a 10% increase in bunker fuel prices will increase the average VLCC freight cost by 3.2% to 3.7%, with a range of 1.2% to 6%, depending on the route and importing country. The ability of exporters to pass on these price increases depends on the market. For example, for the Republic of Korea, which imports all of its oil, (87% from the Middle East alone), the cost pass-through to consumers is 100%, but this represents an increase in consumer price of just under 0.2%. In the United States, in contrast, which has its own oil production and imports oil from Canada by pipeline, the pass through is about 73%, and the increase in consumer costs is only 0.4%. This is because the increase in freight costs is only a very small portion of the value of the product.
Korinek and Sourdin (2009) find similar results with their estimation over various routes, suggesting that a 9-10% increase in shipping costs for crude oil would lead, on average to a 0.4% increase in the price of crude oil.
Grains
The market for grains is very diverse, so the impacts vary by grain type and by market. For example, wheat import into South Africa represents 50% of South Africa’s total consumption. In this case, wheat prices were estimated by Vivid Economics to increase by approximately 0.2% for the 2.5% increase in freight costs estimated to result from a 10% increase in the price of bunker fuel. The estimated cost pass-through to South African consumers ranges from 10% to 40%, implying the exporters would bear 60% to 90% of the freight cost increase.
By contrast, Kenya’s domestic production of wheat is only about a third of its total consumption. Therefore, less competition from
domestic producers implies exporters are more able to pass on the cost of freight increases to consumers, an estimated 50% to 75%. Vivid Economics have calculated that a 10% increase in freight costs would raise bulk wheat prices in Kenya by around 0.4%. While Kenyan wheat producers would benefit from the price increase, Kenyan consumers would lose.
With regard to maize imports by Saudi Arabia, a country without any significant transhipment of imports, and with only 6% domestic production, the price of maize is estimated to increase by around 0.7%, most of which is borne by Saudi Arabian consumers.
An OECD study54 found that it is more expensive to ship grains to smaller markets in developing countries than to larger markets. There are a number of reasons given: less competition on the shipping route; port infrastructure (more time spent unloading the cargo); imbalances in trade on some routes; and distance. The study suggests that distance from major grain exporters is a key determinant of shipping costs, but that other factors are important as well.
MEPC 60/INF.7 looked at the impact on price increases in certain commodity markets for a 5% transportation cost increase. This price increase was estimated to lead to increases in commodity prices by between 0.15% (coffee from Columbia’s Atlantic ports to Europe) to 1.9% (jute from Bangladesh to Europe). The larger the proportion freight rates are as a per cent of the price of the commodity, the larger the potential cost pass-through, everything else being equal.
These studies suggest that the cost impacts on consumers will depend on a number of factors, but that, overall, the percentage increase in prices would be relatively low. Nonetheless, a low percentage increase in the price of food in countries where expenditures on food form a large percentage of household budgets, can still have a significant impact on consumers. At the same time, domestic grain producers can gain from the general increase in prices, though at the expense of consumers.

55ICTSD Programme on Trade and Environment
Another study55 found that for EU imports of cereals from Argentina, an 11% increase in transport costs (caused by an allowance price of $30) would lead to a 3% increase in the value of imports. Similarly, the price of coffee imports from Brazil into the EU would rise by 16% and cause the value of coffee imports to increase by 0.3%.
Although the studies use different metho-dologies and are not, therefore, strictly comparable, they all suggest that the percentage increase of the implementation of a market-based measure would be small. It must be cautioned, however, that even a small percentage increase can have a sizeable impact on a poor country or on consumers with poor purchasing power.
Clothing and furniture
To look at what might happen with the container trade, two categories of goods were selected: clothing and furniture. The analysis of clothing and furniture into Europe from Asia was complicated due to the heterogeneous nature of the trade statistics category. Both low-end and high-end quality clothing and furniture are included in the trade statistics, which mask differences in domestic production versus imports and prices.
About 40% of wearing apparel sold in the EU is imported. The estimates by Vivid Economics suggest that between 10% and 40%
of the additional freight costs would be passed through to consumers. By contrast around 70% of furniture is imported into the EU. Therefore, there is the possibility for a higher pass-through of the costs, due to less competition from domestic producers. The ability to pass through increased freight costs is estimated to be between 60% to 90%, which imply exporters from Asia bear less than half of the increase in freight costs. The broad ranges for both products stem from their heterogeneity making it difficult to achieve more precise estimates. A micro-level analysis to illustrate the potential impact on developing country exporters estimated the impact on Chinese exporters of knitwear and folding chairs, assuming the implementation of a carbon price of $20 and $40, respectively, and a bunker fuel price of $437/tonne.56
Assuming these carbon prices are completely passed through to freight rates, the impact on the total transport cost of container ships (4000 - 6000 TEU) was estimated to be 9% and 19%, respectively, for the two carbon prices. Under the assumption that this increase in freight costs is completely borne by the exporters, rather than partially passed on to the consumers, the profit margin of exporters of knitwear is estimated to decrease by 3 - 5%, and of exporters of folding chairs by 19 - 30%, when the carbon price is $20, and by 7% - 11% for knitwear, and 39% - 63% for folding chairs, when the carbon price is $40.

56 International Transport, Climate Change and Trade
ANNEx C: ASSIgNINg EMISSIONS FROM ShIpS
For both ICAO and the IMO, an important, unresolved methodological issue concerned how best to assign international GHG emissions from these sectors to specific countries. An agreed rule governing how to calculate international emissions in national inventories would be required in order for these emissions to be assigned to and dealt with under countries’ national GHG policies. The UNFCCC’s Subsidiary Body on Science and Technological Advice (SBSTA) set forth a number of options in a working paper it issued in 2003 (UNFCCC 2003). But in the six years since this issue was first discussed, little progress has been made on what is the appropriate methodology for assigning responsibility for international emissions to countries.
The most promising option appears to be dividing the emissions between the countries of origin and destination for either the aircraft/ship or its passengers/cargo (Faber, Boon et al. 2007). Other options, such as assignments based on national fuel sales, the nationality of the carrier or shipper, or country of vehicle registration could cause serious market distortions and evasive behaviour. For instance, national emissions could be “mitigated” by purchasing fuel elsewhere, changing the nationality of carriers and shippers, or registering aircraft and marine vessels in another country.
Market distortions and evasive behaviour would be most severe for maritime shipping. The majority of shipping capacity is comprised of vessels flagged in countries that engage in relatively little international trade, and
similarly the ownership of a large portion of the global shipping fleet does not correspond to international trade flows (Figure 8). The potential for evasion is also high in the marine sector since changing vessel flags is easy and large quantities of fuel can be bunkered onboard a ship, affording great flexibility in choosing where to flag a vessel and purchase fuel in order to minimize costs.
While dividing international transport emissions between origins and destinations provides the least opportunity for evasion and market distortions, the approach is still hindered by practical and political issues: how to split emissions from multi-stop trips, how to estimate emissions produced during a trip, and how to treat emissions from developing nations.
For the specific purposes of reporting emissions under the Framework Convention, countries have been instructed to report based on the sales of bunker fuels within their countries, regardless of where the fuel is actually consumed or by whom it is consumed. This method is not the most representative of international trade and travel, especially in the case of international marine transport where fuel can readily be bunkered (ships, unlike airplanes, need not refuel at almost every port they visit). It is important to note that this method is used for the purposes of reporting only, as required of Annex I Parties, and that the emissions from international bunker fuels are not currently included in calculating or accounting with respect to a country’s target for GHG reductions.

57ICTSD Programme on Trade and Environment
Figure 8: Comparison of International Trade (Percent of Global Value of Merchandise Trade), Vessel Flag (Percent of Global Deadweight Tons, DWTs), and Vessel Owner (Percent of Global DWTs) by Country
Sources: DOC 2006; World Bank 2007
Vessel Owner
Vessel Flag
International Trade
PanamaLiberia
GreeceJapan
ChinaUnited States
25%
20%
15%
10%
5%
0%

58 International Transport, Climate Change and Trade
ANNEx D: AVIATION IN ThE Eu ETS
The cap
For the first year, 2012, the EU Aviation Directive sets a cap of 97 percent of historical emissions (i.e. the mean average of annual emissions from aircraft arriving at or departing from EU airports in 2004–2006). For the next EU ETS phase (2013–2020) and subsequent phases, the cap will reduce to 95 percent multiplied by the number of years in the phase. By August this year the Commission will have decided what the historical aviation emissions are, based on the best available data. The setting of a cap determines the amount of CO2 that can be emitted by aircraft operators across the EU. This figure then translates into the number of allowances (each equivalent to a tonne of CO2) that need to be surrendered by the aircraft operators each year.
Under the EU ETS, other sectors have to reduce their emissions by 8 percent compared to 1990 emissions. Aviation therefore would get roughly twice the amount of permits compared with other sectors. Environmental NGOs had recommended a cap in line with other sectors but this approach was not supported by the European Parliament and Council. The official reason is that it is unrealistic for the aviation sector to reduce emissions by anywhere near 8 percent as its business-as-usual (BAU) growth trajectory and abatement options are very different from other sectors under the EU ETS.
Aviation in the EU ETS in practice: auctioning of allowances, the obligation and the use of auction revenues
Auctioning emission permits is the best distribution mechanism, because it is the most efficient and fairest way to issue permits, and also to avoid the shortcoming of the current EU ETS where electricity firms are reported to have made windfall profits by passing on the price of permits to customers that they received for free.
According to the Commission impact asses-sment: “since every airline on each route
covered by the scheme would be treated equally, airlines can be expected to pass on, to a large extent or even in full, compliance costs to customers”. The size of these profits has been estimated to be in the in the range of €3.5bn a year. Given this, it is crucial to ensure that in this period aviation will have reasonable levels of auctioning in the EU ETS.
The Aviation Directive provides that from 1 January 2013 15 percent of aviation allowances (AAs) will be auctioned with the remaining 85 percent allocated for free to aircraft operators based on a benchmark. An aircraft operator will have to apply to their administering Member State for the free allocation of AAs ahead of 2012 and then at the beginning of each phase by submitting verified tonne–kilometre data for the flights it performs that arrive at/ depart from EU airports in the monitoring year (i.e. an application will need to be made ahead of 2012 for free allocation of AAs for that year and then in the year ending 24 months before the start of the 2013-2020 phase and subsequent phases). The UK Government has specified that aircraft operators allocated to the UK who wish to apply for free allocation of AAs, will need to submit a benchmarking plan detailing how they will monitor tonne–kilometre data in 2010 by 31 August 2009 and they will then need to monitor their emissions in 2010 in accordance with their submitted plan and submit a verified report of these emissions to the UK regulator by 31 March 2011.
Member States will submit details of the applications that they receive from operators to the Commission. The Commission will then decide the total quantity of AAs to be allocated for free and to be auctioned for a scheme phase as well as the benchmark to be used by Member States to allocate AAs for free, 15 months before the phase starts. Twelve months before each phase is due to start, each Member State will use the Commission’s benchmark to calculate and publish what AAs will be allocated to the aircraft operators whose applications it sent to the Commission during the phase and each

59ICTSD Programme on Trade and Environment
year of the phase. The competent authority of each Member State (the Environmental Agency in the case of the UK) will then issue the AAs to each aircraft operator by 28 February 2012 and by 28 February each year thereafter.
A special reserve of three percent of AAs will be set aside for allocation to operators who are new entrants (ie those aircraft operators who start performing flights that arrive at/ depart from EU airports after the monitoring year) or aircraft operators whose tonne-kilometre data increases by an average of more than 18 percent annually between the monitoring year and the second calendar year for the phase. Again, aircraft operators who wish to obtain an allocation of AAs from the special reserve must apply to the competent authority of its administering Member State and the application will be referred to the Commission which will decide a benchmark for allocation of the special reserve for Member States to use in calculating the AAs due to the aircraft operators who submitted applications for AAs.
A Regulation providing details regarding the auctioning process will be adopted by the Commission (no date is given for this in the Aviation Directive). Although the Aviation Directive acknowledges that Member States can determine the use to be made of auction revenues, it states that such revenues should be used to tackle climate change in the EU and elsewhere including (i) by adaptation to the impacts of climate change especially in developing countries, (ii) by funding research and development of mitigation and adaptation particularly in respect of air transport for low emission transport, (iii) the cost of administration of the scheme, (iv) by funding contributions to the Global Energy Efficiency and Renewable Energy Fund and (v) by funding measures to avoid deforestation. Member States will be required to report to the Commission on how they use auction revenues. Like some other Member States, the UK Government is opposed to hypothecation of auction revenues as a matter of policy.
Aircraft operators will be obliged to submit allowances equivalent to their verified annual
emissions from flights arriving in/ departing from EU airports by the end of April each year. Aircraft operators whose emissions exceed the AAs that they have been allocated for free or have bought at auction will have to either purchase AAs from other aircraft operators or purchase EUAs from other EU ETS installations or (to a limited extent) purchase CERs/ ERUs in the secondary market. In 2012 up to 15 percent of the number of allowances required to be surrendered by an aircraft operator can be CERs/ ERUs (the amount will be determined at least 6 months prior to the start of subsequent phases as part of the general review procedures in the EU ETS Directive). It should be noted that installations of industries already covered by the EU ETS will not be able to use allowances issued to aircraft operators to meet their obligations under the EU ETS.
Effects of including aviation in the EU ETS
Most impact assessments currently on the table show that integrating aviation into the EU ETS will not necessarily reduce aviation emissions. To reduce aviation emissions is not the immediate goal of the EU ETS; the goal is rather to ensure that aviation emissions are capped and that economy-wide reductions are made where they are the most cost-effective. Even an assessment by Ernst & Young commissioned by the aviation industry shows that even in the toughest scenario envisaged, by 2020 emissions would grow by 83 percent rather than 86 percent in a business-as-usual situation. Last March, European leaders committed to reduce overall EU emissions at least by 20 percent by 2020. The Commission’s Impact Assessment suggests that integration of aviation into the EU ETS policy will only reduce aviation emissions by about 3 percent. In other words it would offset just one year’s growth of the sector’s emissions.
The reason why integration in the ETS will not change the emissions of the sector is that the CO2 prices in the system will be around €15 per tonne, which is a significant amount for power plants, steel mills and the like, but translates into an insignificant 3.8 cents per

60 International Transport, Climate Change and Trade
litre of kerosene (the fuel used in aircraft). This number is particularly insignificant given that aviation generally pays no fuel tax and that this price increase holds only in case 100 percent of the emission permits are auctioned. As mentioned above, 85 percent of permits will be allocated for free. Fuel taxes in road transport are around 65 cents per litre – more than 10 times higher than equivalent CO2 prices in the EU ETS. Also, high carbon prices in aviation would not put the EU aviation industry at a competitive disadvantage since every airline on each route covered by the scheme would be treated equally.
Therefore, environmental NGOs insist on 100 percent auctioning of emission permits, a limit on access to offsets, a cap which becomes more stringent each year like other sectors, introduction of fuel taxation and VAT on airline tickets alongside integration of aviation into the EU ETS. Another idea would be to make the sector’s fuel efficiency objective (the aviation industry has set itself an objective to improve fuel efficiency by 1.5 percent a year and reduce emissions 50 percent by 2050 – without saying how compared to 2000) legally-binding in the European Union to ensure that at least feasible improvements are made.

SELECTES ICTSD ISSUE PAPERS Agriculture Trade and Sustainable Development How Would A Trade Deal On Cotton Affect Exporting And Importing Countries? By Mario Jales. Issue Paper No.26, 2010.Simulations on the Special Safeguard Mechanism: A Look at the December Draft Agriculture Modalities. By Raul Montemayor. Issue Paper No.25, 2010.How Would a Trade Deal on Sugar Affect Exporting and Importing Countries? By Amani Elobeid. Issue Paper No.24, 2009.Constructing a Composite Index of Market Acess. By Tim Josling. Issue Paper No.23, 2009. Comparing safeguard measures in regional and bilateral agreements. By Paul Kruger, Willemien Denner and JB Cronje. Issue Paper No.22, 2009.Competitiveness and Sustainable DevelopmentTrade, Economic Vulnerability, Resilience and the Implications of Climate Change in Small Island and Littoral Developing Economies. By Robert Read. Issue Paper No.12, 2010.The Potential Role of Non Traditional Donors ‘Aid in Africa. By Peter Kragelund. Issue Paper No.11, 2010. Aid for Trade and Climate Change Financing Mechanisms: Best Practices and Lessons Learned for LDCs and SVEs in Africa. By Vinaye Dey Ancharaz. Issue Paper No.10, 2010. Resilience Amidst Rising Tides: An Issue Paper on Trade, Climate Change and Competitiveness in the Tourism Sector in the Caribbean. By Keron Niles. Issue Paper No.9, 2010. El sector textil y confección y el desarrollo sostenible en Nicaragua. Por Ana Victoria Portocarrero Lacayo. Documento de Fondo No.7, 2010.El sector textil y confección y el desarrollo sostenible en Guatemala. Por Pedro Prado et al. Documento de Fondo No.6, 2010.Dispute Settlement and Legal Aspects of International TradeBurden of Proof in WTO Dispute Settlement: Contemplating Preponderance of the Evidence. By James Headen Pfitzer and Sheila Sabune. Issue Paper No.9, 2009.Suspension of Concessions in the Services Sector: Legal, Technical and Economic Problems. By Arthur E. Appleton. Issue Paper No.7, 2009.Trading Profiles and Developing Country Participation in the WTO Dispute Settlement System. By Henrik Horn, Joseph Francois and Niklas Kaunitz. Issue Paper No.6, 2009.Developing Countries, Countermeasures and WTO Law: Reinterpreting the DSU against the Background of International Law. By Andrea Bianchi and Lorenzo Gradoni. Issue Paper No.5, 2008.Fisheries, International Trade and Sustainable DevelopmentThe Importance of Sanitary and Phytosanitary Measures to Fisheries Negotiations in Economic Partnership Agreements. By Martin Doherty. Issue Paper No.7, 2008.Fisheries, Aspects of ACP-EU Interim Economic Partnership Agreements: Trade and Sustainable Development Implications. By Liam Campling. Issue Paper No.6, 2008.Fisheries, International Trade and Sustainable Development. By ICTSD. Policy Discussion Paper, 2006.Intellectual Property Rights and Sustainable DevelopmentThe Technical Assistance Principles of the WIPO Development Agenda and their Practical Implementation. By C. Deere-Birkbeck and R. Marchant. Issue Paper No.28, 2010.Free Trade of Pharmaceutical Products: The Limits of Intellectual Property Enforcement at the Border. By Xavier Seuba. Issue Paper No.27, 2010.Evaluación del impacto de las disposiciones de ADPIC + en el mercado institucional de medicamentos de Costa Rica. Por Grevin Hernandez-González y Max Valverde. Documento de Fondo No.26, 2009.Access to Climate Change Technology by Developing Countries: A Practical Strategy. By Cynthia Cannady. Issue Paper No.25, 2009.Trade in Services and Sustainable DevelopmentFacilitating Temporary Labour Mobility in African Least-Developed Countries: Addressing Mode 4 Supply-Side Constraints. By Sabrina Varma. Issue Paper No.10, 2009.Advancing Services Export Interests of Least-Developed Countries: Towards GATS Commitments on the Temporary Movement of natural Persons for the Supply of Low-Skilled and Semi-Skilled Services. By Daniel Crosby, Issue Paper No.9, 2009.Maritime Transport and Related Logistics Services in Egypt. By Ahmed F. Ghoneim, and Omneia A. Helmy. Issue Paper No.8, 2007.Environmental Goods and Services ProgrammeHarmonising Energy Efficiency Requirements – Building Foundations for Co-operative Action. By Rod Janssen. Issue Paper No.14, 2010Climate-related single-use environmental goods. By Rene Vossenaar. Issue Paper No.13, 2010.Technology Mapping of the Renewable Energy, Buildings, and transport Sectors: Policy Drivers and International Trade Aspects: An ICTSD Synthesis Paper. By Renee Vossenaar and Veena Jha. Issue Paper No.12, 2010.Deploying Energy-Efficiency and Renewable-Energy Technologies in Residential and Commercial Buildings. By Rene Vossenaar and Veena Jha. Issue Paper No.11, 2010.Trade Flows, Barriers and Market Drivers in Renewable Energy Supply Goods: The Need to Level the Playing Field. By Veena Jha. Issue Paper No.10, 2009.Trade and Sustainable EnergyClimate Change and Trade on the Road to Copenhagen. Policy Discussion Paper, 2009.Trade, Climate Change and Global Competitiveness: Opportunities and Challenge for Sustainable Development in China and Beyond. By ICTSD. Selected Issue Briefs No.3, 2008.Intellectual Property and Access to Clean Energy Technologies in Developing Countries: An Analysis of Solar Photovoltaic, Biofuel and Wind Technologies. By John H. Barton. Issue Paper No.2, 2007.Regionalism and EPAsRules of Origin in EU-ACP Economic Partnership Agreements. By Eckart Naumann. Issue Paper No.7, 2010SPS and TBT in the EPAs between the EU and the ACP Countries. By Denise Prévost. Issue Paper No.6, 2010Los acuerdos comerciales y su relación con las normas laborales: Estado actual del arte. By Pablo Lazo Grandi. Issue Paper No.5, 2010.Revisiting Regional Trade Agreements and their Impact on Services and Trade. By Mario Marconini. Issue Paper No.4, 2010.Trade Agreements and their Relation to Labour Standards: The Current Situation. By Pablo Lazo Grandi. Issue Paper No.3, 2009.Legal and Systematic Issues in the Interim Economic Partnership Agreements: Which Way Now? By Cosmas Milton Obote Ochieng. Issue Paper No.2, 2009.Environmental Issues in Economic Partnership Agreements: Implications for Developing Countries. By Beatrice Chaytor. Issue Paper No.1, 2009.Global Economic Policy and InstitutionsThe Microcosm of Climate Change Negotiations: What Can the World Learn from the European Union? By Håkan Nordström, Issue Paper No.1, 2009.
These and other ICTSD resources are available at http://www.ictsd.org

ICTSD’s project on Trade and Sustainable Energy aims to promote pro-sustainable development perspectives for a transition to sustainable energy production and consumption by brokering new and innovative knowledge on trade-related opportunities and challenges. The project aims to:
• Support the transition to a sustainable energy future by providing relevant stakeholders in different policy processes with innovative analysis regarding opportunities and challenges in the trade and sustainable energy nexus;
• Generate policy-oriented and solutions-focused knowledge on the interface between the multilateral trading system and various regimes and initiatives promoting the transition to a sustainable energy future;
• Expand the knowledge community on trade and sustainable energy by including non-traditional actors and view-points in the debate, including oil producers, climate scientists, agricultural economists, specialists in services trade, labour and consumer organisations; and
• Support existing capacity-building efforts through knowledge outputs and dialogues, particularly for poor countries and disadvantaged communities.
Publications include:
• Sectoral Approaches to Climate Change Mitigation: Competitiveness, Trade and Development Issues in Small Developing Countries. By ICTSD, Information Note No.11, October 2009.
• Climate Change and Trade on the Road to Copenhagen. Policy Discussion Paper, 2009.• Trade, Climate Change and Global Competitiveness: Opportunities and Challenge for
Sustainable Development in China and Beyond. By ICTSD. Selected Issue Briefs No.3, 2008.
• Intellectual Property and Access to Clean Energy Technologies in Developing Countries: An Analysis of Solar Photovoltaic, Biofuel and Wind Technologies. By John H. Barton. Issue Paper No.2, 2007.
For further information, visit www.ictsd.org
ABOUT ICTSD
Founded in 1996, the International Centre for Trade and Sustainable Development (ICTSD) is an independent non-profit and non-governmental organization based in Geneva. By empowering stakeholders in trade policy through information, networking, dialogue, well-targeted research and capacity building, the centre aims to influence the international trade system such that it advances the goal of sustainable development.
www.ictsd.org