international undergraduate students: the uk's · pdf fileinternational undergraduate...
TRANSCRIPT

DECEMBER 2015
International Undergraduate Students:
The UK’s Competitive Advantage

32
Contents
6Executive summary
8Recommendations for policymakers and universities
91. Introduction
122. International undergraduate enrolment trends
173. Policy analysis: The UK market and its primary competitors
214. The international undergraduate student experience in the UK
Contents
Contents
295. What has changed since 2008?
366. How does the UK international undergraduate experience compare?
447. Decision-making factors for international undergraduate students
478. What helps international undergraduate students to choose?
509. How does UK undergraduate student choice differ from rival markets?
5310. Analysis and synthesis

54
Figure 5: ISB survey data – UG financial support satisfaction trends across key competitors, 2008-14
Figure 6: ISB survey data – UG overall learning satisfaction trends across key competitors, 2008-14
Figure 7: ISB survey data – UG overall satisfaction trends across key competitors, 2008-14
Figure 8: ISB survey data – decision factors for international UG students in the UK, 2014–15
Table 25: ISB survey data – key decision-making factors for UG students in the UK by nationality, 2014–15
Table 26: ISB survey data – decision factors for UG students in the UK by field of study, 2014–15
Table 27: ISB survey data – key influences on international UG choice: mean scores by nationality, 2014–15
Table 28: ISB survey data – key influences on UG choice: nationality by perceived significance (ranked), 2014–15
Table 29: ISB survey data – countries considered by UG students before choosing the UK, 2014–15
Table 30: ISB survey data – location before commencing programme of study in the UK, 2014–15
Figure 9: Agent Barometer survey data – best destination for undergraduate study 2015
Table 31: ISB survey data – key influences on international UG students’ decisions: competitor comparisons, 2013–14
Appendix A: UK Non-EU UG Student Population by field of study, 2013-14 vs 2008-09
Appendix B: UK Non-EU UG Student Population by domicile, 2013-14 vs 2008-09
Appendix C: % International UG students by domicile and field of study
Appendix D: UG International Students: Funding of studies by country of study
Appendix E: Education Agents. Trends in overall attractiveness of study destinations
Acknowledgements
Author: Will Archer
The report was supported by funding from the Department for Business, Innovation and Skills, UKTI and the Higher Education Funding Council for England. The author and the UK HE International Unit would like to thank members of the Project Steering Group for their expert advice:
Professor Judith Lamie, Dr Shaun Curtis, Michael Peak, Vincenzo Raimo, Peter Clack, Dr David Stevens, Gordon Slaven, Dr Janet Ilieva, Cliff Hancock, Brian Johnson, Daniel Hurley, Charlene Allen, Jo Attwooll, Vikki Challen, Daniel Shah.
Contributors: Teresa Angulo, Kevin Brett, Stephen Darwin, Laura Dicken, Greg Gawinowski, Jessica Howlett, Richard Garrett, Rory Govan, Lynne Griffiths, Rachael Merola, Kyla Steenhart.
Index of tables and figures
Table 1: International students by academic level – UK and competitors, 2013–14
Figure 1: Distribution of foreign students by destination country, 2012
Table 2: International UG student enrolments by country: 2007-14 (and changes in comparative share)
Figure 2: ISB survey structure
Table 3: ISB survey data on the international UG arrival experience in the UK, 2014
Table 4: ISB survey data on the international UG learning experience in the UK, 2014
Table 5: ISB survey data on the international UG living experience in the UK, 2014
Table 6: ISB survey data on international UG support services usage in the UK, 2014
Table 7: ISB survey data on international UG satisfaction with support services in the UK, 2014
Table 8: ISB survey data – derived importance of the international UG student experience in the UK, 2014
Figure 3: Closing the loop
Table 9: ISB survey data – overall measures of the UK international UG student experience, 2008-14
Table 10: ISB survey data – decision-making factors for international UG students in the UK, 2008-14
Table 11: ISB survey data – key influences for international UG students in the UK, 2008-14
Table 12: ISB survey data – application methods for international UG students in the UK, 2008-14
Table 13: ISB survey data – application time/satisfaction for international UG students in the UK, 2008-14
Table 14: ISB survey data – other countries considered by international UG students in the UK, 2008-14
Table 15: ISB survey data – funding sources for international UG students in the UK, 2008-14
Table 16: ISB survey data – the arrival experience for international UG students in the UK, 2008-14
Table 17: ISB survey data – the learning experience for international UG students in the UK, 2008-14
Table 18: ISB survey data – the living experience for international UG students in the UK, 2008-14
Table 19: ISB survey data – support services for international UG students in the UK, 2008-14
Table 20: ISB survey data – overall measures of UG satisfaction across key competitors, 2013–14
Table 21: ISB survey data – UG arrival experience satisfaction across key competitors, 2013–14
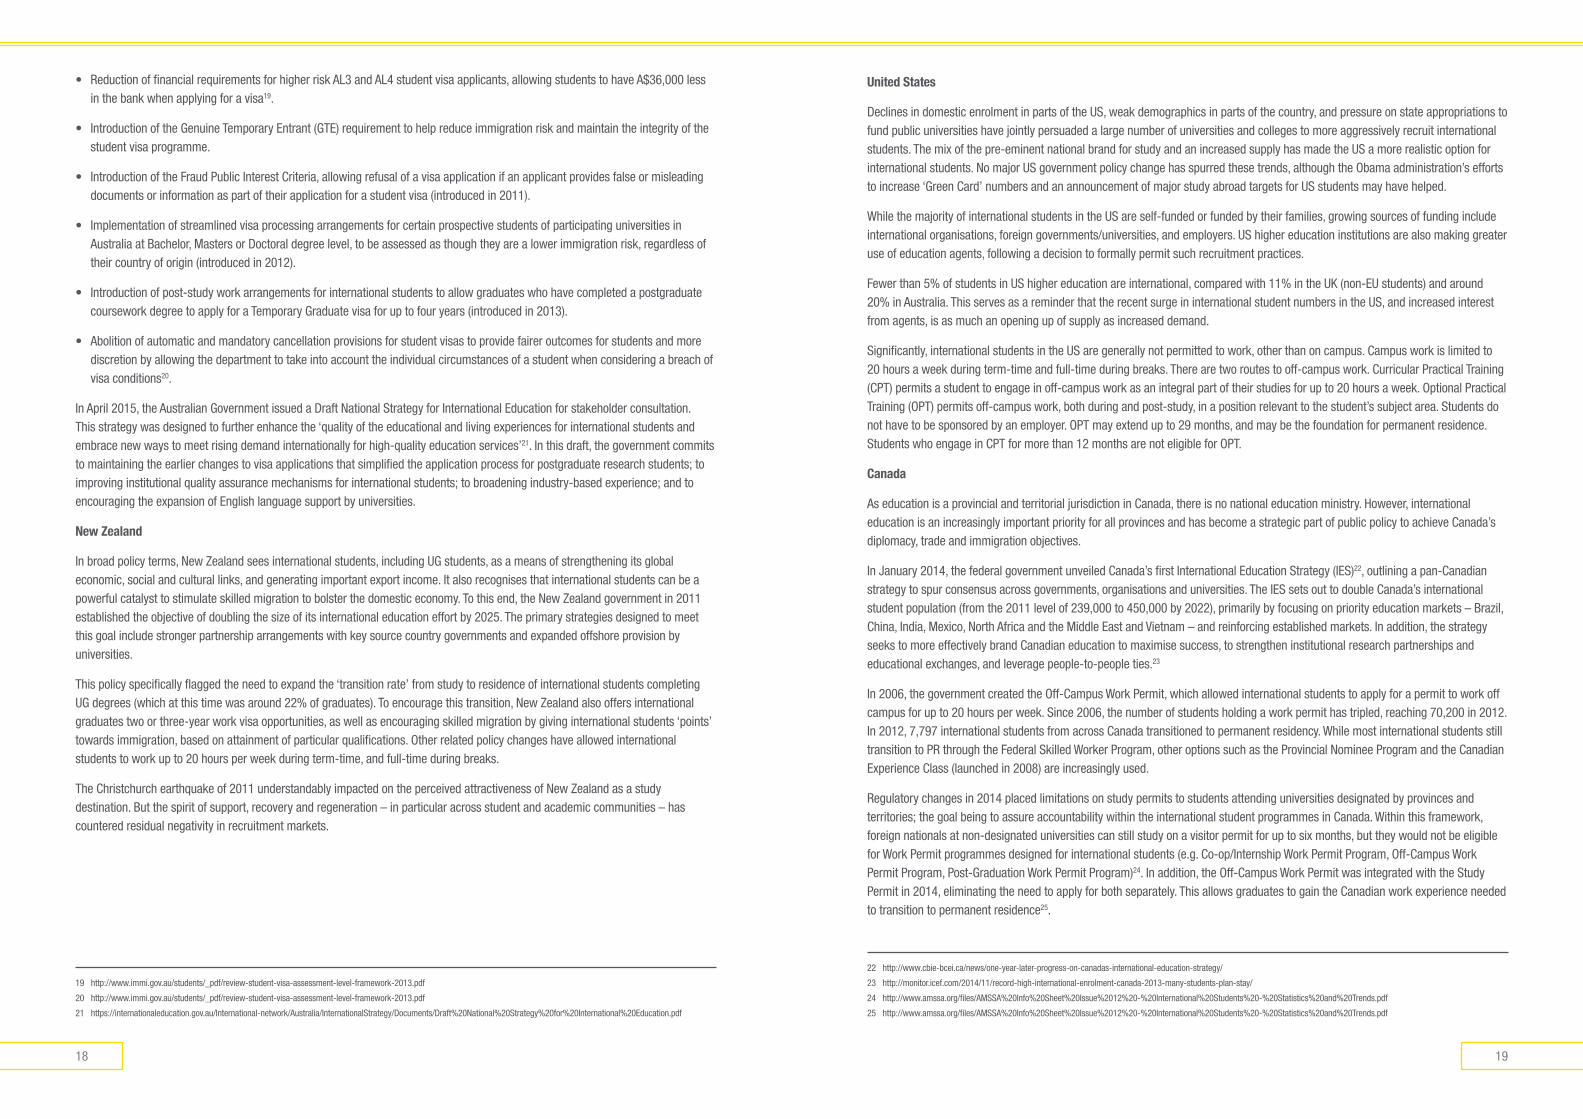
Table 22: ISB survey data – UG learning experience satisfaction across key competitors, 2013–14
Table 23: ISB survey data – UG living experience satisfaction across key competitors, 2013–14
Table 24: ISB survey data – UG support services satisfaction across key competitors, 2013–14
Figure 4: ISB survey data – UG cost-of-living satisfaction trends across key competitors, 2008-14

76
Each university will have highs and lows of performance across disciplines and within teams, as does every organisation. The best leadership seeks to narrow the range upwards. Areas of lower satisfaction have seen the most rapid improvements, such as careers advice and learning support, or are ahead of rivals, such as making host country friends. Notable areas showing lower levels of satisfaction relate to financial indicators (earning money is down seven percentage points to 68%) and cost of accommodation has seen a marginal downturn but scores better than rivals.
There are clearly areas for improvement – most notably on the academic administrative component of the undergraduate learning experience that lag behind the leaders: marking criteria, assessment and performance feedback trailing behind Canada and the US.
In an era where universities are held accountable by their students daily, all the UK’s competitors are increasing their efforts. To continue to attract the best talent from across the world, in greater numbers, the sector must jointly and severally capitalise on its evident strengths in undergraduate provision, while keeping an eye on innovations and improvements elsewhere.
The evidence in this report also shows scope for the UK’s higher education institutions to step up their efforts on several fronts. There is a demonstrated need for a better understanding of the myriad established and emerging routes into undergraduate education in the UK, in turn to underpin more sophisticated marketing and social media strategies.
Education agents feature in the decision-making of at least 26% of international undergraduates in the UK. This figure is lower than for all the UK’s major English-speaking rivals. International students in the UK typically report high levels of satisfaction3 with agent services (90%+). Most agents are professional advisers. It would be to the UK’s benefit to engage with this group positively, to promote the UK’s comparative strengths in undergraduate education. The UK’s attractiveness to agents as a study destination has trended downwards since 2010, counter to the US, Canada, Australia and New Zealand4.
It is hoped that this report contributes to a better understanding of the current international undergraduate student landscape. Its recommendations for policymakers and universities are intended to drive sustained growth for this critical component of the UK’s higher education system and its broader economy.
3 ISB: Students who indicate that an education agent helped them to choose are asked nine further questions on the quality of service received.
4 ICEF i-graduate Agent Barometer 2015
This report on international undergraduate students is part of a series commissioned by the UK Higher Education International Unit to systematically examine the UK’s market position with respect to international student recruitment and the international student experience. It complements two companion reports that look at the UK’s competitive advantage concerning international taught postgraduate students and international postgraduate research students.
The findings presented in these reports are based on international student experience data derived from i-graduate’s International Student Barometer (ISB), an independent survey process implemented by 800 higher education providers worldwide, including more than 100 universities in the UK. It is supported by statistics on international student recruitment and enrolment in the UK and major competitor countries, as well as a high-level analysis of key competitors’ government policies on recruitment, support and post-study employment.
In total, this report draws on feedback from 365,754 international students studying outside their home country. The ISB dataset is without precedent in scale and detail, making this the most significant comparative study of the undergraduate student experience to date.
The number of non-EU international undergraduate students in the UK has increased by 46% since 2007, reflecting its pre-eminent reputation as a quality provider of undergraduate education. Despite the UK’s improving satisfaction results, some of our rivals are enjoying faster growth than the UK.
International undergraduate student satisfaction with UK higher education is very high, at 91%1. UK universities have seen improvements in international student satisfaction across 75 of 84 measures, including higher satisfaction rates across all aspects of the learning experience (23 elements) and higher satisfaction rates across all summary indicators (overall satisfaction 91%, arrival 90%, learning 88%, living 87% and support services overall 90%).
All this with an additional 47,910 non-EU international undergraduate students on UK campuses.
1 Overall satisfaction (single measure) as measured by the ISB. Consistent at 91% for five out of six years, 2008-2014
85% of international undergraduates would recommend or actively recommend their UK study experience. For undergraduate education, a higher proportion of international students would recommend the UK than any of its major English-speaking rival destinations2.
The UK has the highest satisfaction ratings amongst our competitors for all the dimensions of the student experience: overall satisfaction, learning, living, support and arrival experience.
Against competitor countries the UK has the highest ratings for student satisfaction in the majority of the measured elements of the student experience. Notably, it excels against its competitors in teaching and learning, with the highest ratings for 15 of 23 measures of the teaching and learning experience and has increased satisfaction in every single area of the learning experience.
The UK also has higher satisfaction with the cost of living than our main rivals, and yet the UK’s actual market share of international undergraduates over this period has stagnated, while universities in the US and Canada have seen significant growth in numbers and market share. More students consider several destinations when choosing where to study and there is no doubt that the sector is being negatively impacted by current visa policies.
Overall, the UK should take a less self-critical approach to the undergraduate student experience. Universities work hard to identify weaknesses and make improvements – evidenced by increased levels of student satisfaction across all measures of the learning experience – across what is evidently world-class provision. High average scores should not be taken to signal future indifference, as most UK universities have achieved a mind-set that is a force against inertia on the continuum to continuous improvement.
2 Comparison: UK, US, Canada, Australia and New Zealand.
ExEcUTIvE sUmmary

98
rEcOmmENdaTIONs FOr pOlIcymaKErs aNd UNIvErsITIEs 1. INTrOdUcTION
International students represent a vital part of UK higher education. The number of international students – EU and non-EU – in UK higher education has grown dramatically in recent decades, constituting 435,000 students in 2013–14, with UK market share second only to the US. Today, international students represent almost 20% of all UK higher education enrolment, and non-EU student fees alone represent 14% of sector revenue6. The international student market is projected to grow strongly. UNESCO projects that international student numbers will grow from 4.5 million globally in 2012 to 7 million by 2025.
Undergraduate study
In 2013–14, there were around 130,000 international students from non-EU countries enrolled in undergraduate (UG) programmes in the UK. Although international UG students only represent about 10% of total UK undergraduate enrolments, a smaller proportion than for postgraduates, their numbers have increased significantly since 2008 and have grown by almost 48,000 during this period, an increase of 46%7.
Table 1: International students by academic level – UK and competitors, 2013–14
0%
20%
40%
60%
80%
100%
UKUSAGermanyCanadaAustraliaNew Zealand
UG
PGT
PGR
* For 2013–14 or closest equivalent period. These ratios are reported in a variety of ways across the sample countries.
6 Universities UK (2014) The Impact of Universities on the UK Economy.
7 UK Higher Education Statistics Agency
recommendation 1
Universities, sector bodies and Government should acknowledge, applaud and promote the UK’s pre-eminence in the provision of international undergraduate education. The UK has a world-class undergraduate student experience to be proud of. The UK’s primary competitive advantage – educational quality – should be promoted through a sustained national campaign and sophisticated forms of web presence and social media networks, which give genuine depth to the UK UG offer.
recommendation 2
Universities, sector bodies and Government should consider a more substantive process for collecting and collating evidence of the decision-making, influences and routes to undergraduate study in the UK.5
recommendation 3
Universities, sector bodies and Government should consider more positive and targeted engagement with education agents and advisors. It can take years or generations to influence parents. Professional advisers are likely to respond promptly to evidence of – or changes to – the attractiveness of the UK offer.
recommendation 4
Prospective students increasingly expect to be able to access clear and engaging insights about the potential learning experience that an institution, a campus, a department and a specific course can offer. The UK‘s primary competitive advantage – educational quality – should be increasingly foregrounded in more sophisticated forms of web presence and social media networks, which give genuine depth to the UK UG offer.
5 Including routes through Transnational Education.
recommendation 5
Given the long-term value of undergraduate students to universities and the UK economy and soft power more generally, a central plank of policy should seek to afford greater opportunities for international students to earn an income while studying in the UK, as well as in graduate jobs. In addition to its economic value, this will enhance graduate employability and improve integration with local communities. It would also be a positive response to concerns around costs of living, accommodation and study in the UK.
recommendation 6
Given the success of key competitor countries in expanding pre-university pathways and schools provision to drive higher international UG enrolments, policymakers and others should increase support for universities and other providers to further develop this important pipeline route into UK higher education.
recommendation 7
Universities, sector bodies and Government should seek better and more comprehensive measures of outcomes in terms of further study, employment and career progression of UK-educated graduates. Demonstrating return on investment to those considering investing years of their youth is a necessary measure, preferably capturing the transformative personal impacts from a UK education, not just salary data. This recommendation is common to all levels of provision.
1110
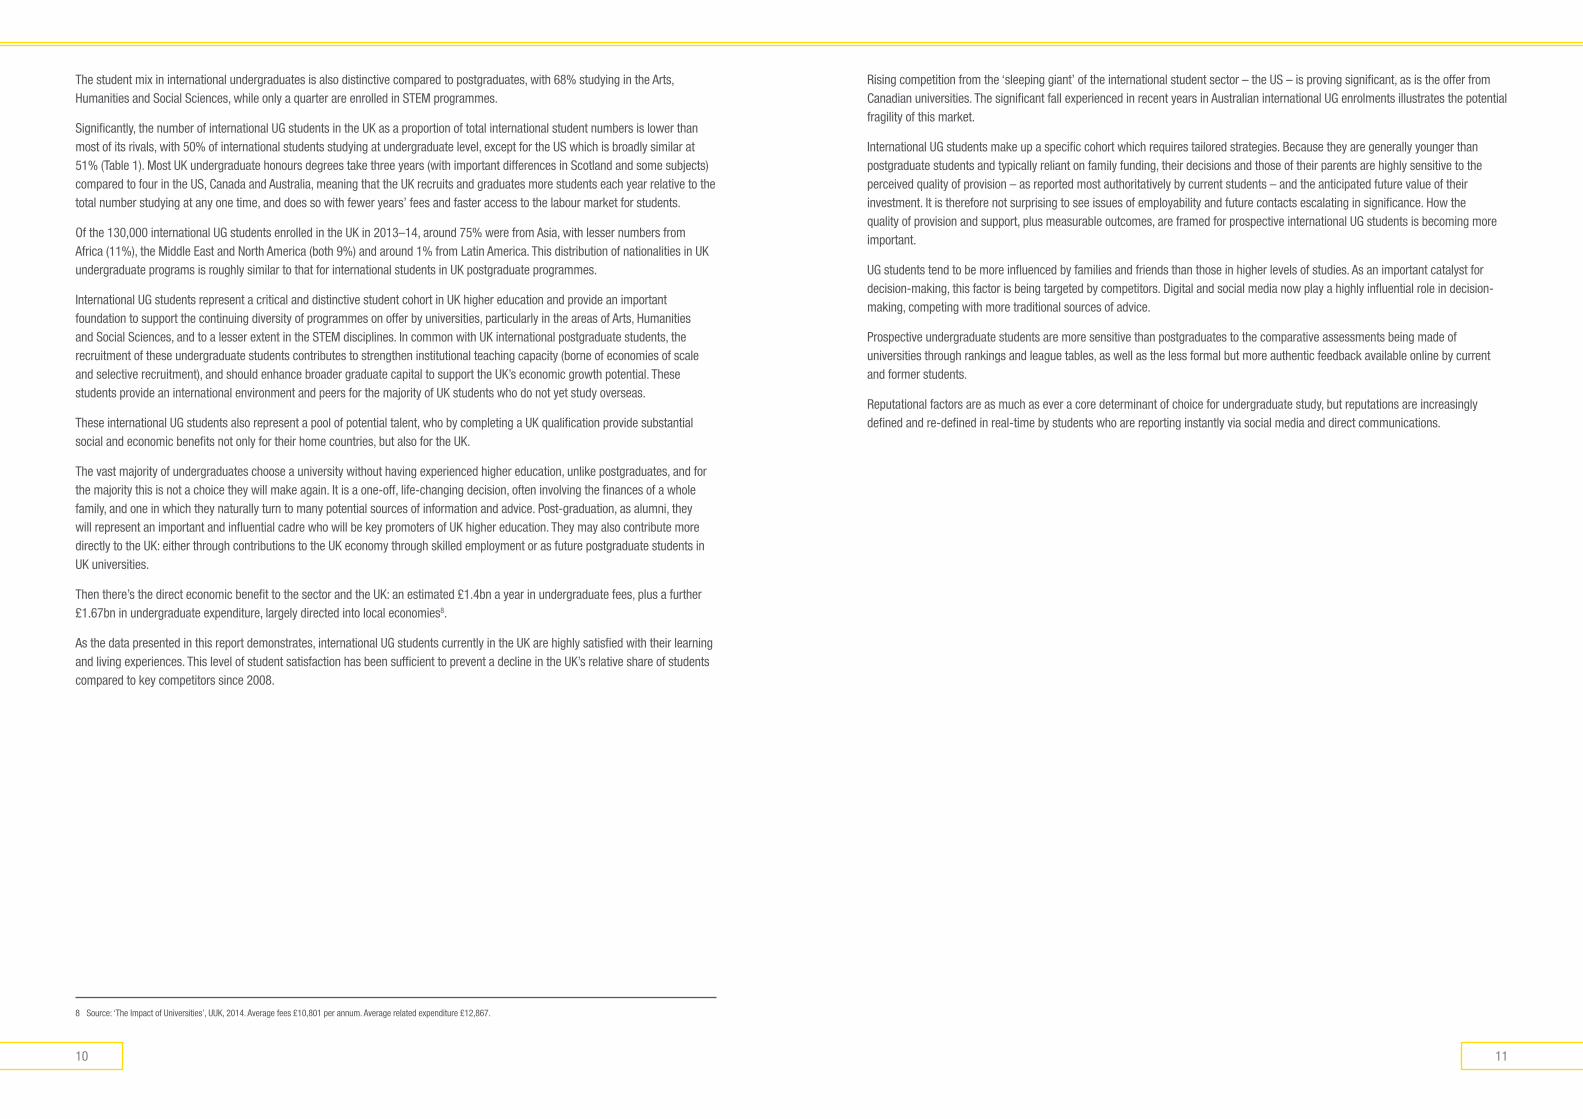
Rising competition from the ‘sleeping giant’ of the international student sector – the US – is proving significant, as is the offer from Canadian universities. The significant fall experienced in recent years in Australian international UG enrolments illustrates the potential fragility of this market.
International UG students make up a specific cohort which requires tailored strategies. Because they are generally younger than postgraduate students and typically reliant on family funding, their decisions and those of their parents are highly sensitive to the perceived quality of provision – as reported most authoritatively by current students – and the anticipated future value of their investment. It is therefore not surprising to see issues of employability and future contacts escalating in significance. How the quality of provision and support, plus measurable outcomes, are framed for prospective international UG students is becoming more important.
UG students tend to be more influenced by families and friends than those in higher levels of studies. As an important catalyst for decision-making, this factor is being targeted by competitors. Digital and social media now play a highly influential role in decision-making, competing with more traditional sources of advice.
Prospective undergraduate students are more sensitive than postgraduates to the comparative assessments being made of universities through rankings and league tables, as well as the less formal but more authentic feedback available online by current and former students.
Reputational factors are as much as ever a core determinant of choice for undergraduate study, but reputations are increasingly defined and re-defined in real-time by students who are reporting instantly via social media and direct communications.
The student mix in international undergraduates is also distinctive compared to postgraduates, with 68% studying in the Arts, Humanities and Social Sciences, while only a quarter are enrolled in STEM programmes.
Significantly, the number of international UG students in the UK as a proportion of total international student numbers is lower than most of its rivals, with 50% of international students studying at undergraduate level, except for the US which is broadly similar at 51% (Table 1). Most UK undergraduate honours degrees take three years (with important differences in Scotland and some subjects) compared to four in the US, Canada and Australia, meaning that the UK recruits and graduates more students each year relative to the total number studying at any one time, and does so with fewer years’ fees and faster access to the labour market for students.
Of the 130,000 international UG students enrolled in the UK in 2013–14, around 75% were from Asia, with lesser numbers from Africa (11%), the Middle East and North America (both 9%) and around 1% from Latin America. This distribution of nationalities in UK undergraduate programs is roughly similar to that for international students in UK postgraduate programmes.
International UG students represent a critical and distinctive student cohort in UK higher education and provide an important foundation to support the continuing diversity of programmes on offer by universities, particularly in the areas of Arts, Humanities and Social Sciences, and to a lesser extent in the STEM disciplines. In common with UK international postgraduate students, the recruitment of these undergraduate students contributes to strengthen institutional teaching capacity (borne of economies of scale and selective recruitment), and should enhance broader graduate capital to support the UK’s economic growth potential. These students provide an international environment and peers for the majority of UK students who do not yet study overseas.
These international UG students also represent a pool of potential talent, who by completing a UK qualification provide substantial social and economic benefits not only for their home countries, but also for the UK.
The vast majority of undergraduates choose a university without having experienced higher education, unlike postgraduates, and for the majority this is not a choice they will make again. It is a one-off, life-changing decision, often involving the finances of a whole family, and one in which they naturally turn to many potential sources of information and advice. Post-graduation, as alumni, they will represent an important and influential cadre who will be key promoters of UK higher education. They may also contribute more directly to the UK: either through contributions to the UK economy through skilled employment or as future postgraduate students in UK universities.
Then there’s the direct economic benefit to the sector and the UK: an estimated £1.4bn a year in undergraduate fees, plus a further £1.67bn in undergraduate expenditure, largely directed into local economies8.
As the data presented in this report demonstrates, international UG students currently in the UK are highly satisfied with their learning and living experiences. This level of student satisfaction has been sufficient to prevent a decline in the UK’s relative share of students compared to key competitors since 2008.
8 Source: ‘The Impact of Universities’, UUK, 2014. Average fees £10,801 per annum. Average related expenditure £12,867.
1312
2. INTErNaTIONal UNdErgradUaTE ENrOlmENT TrENds
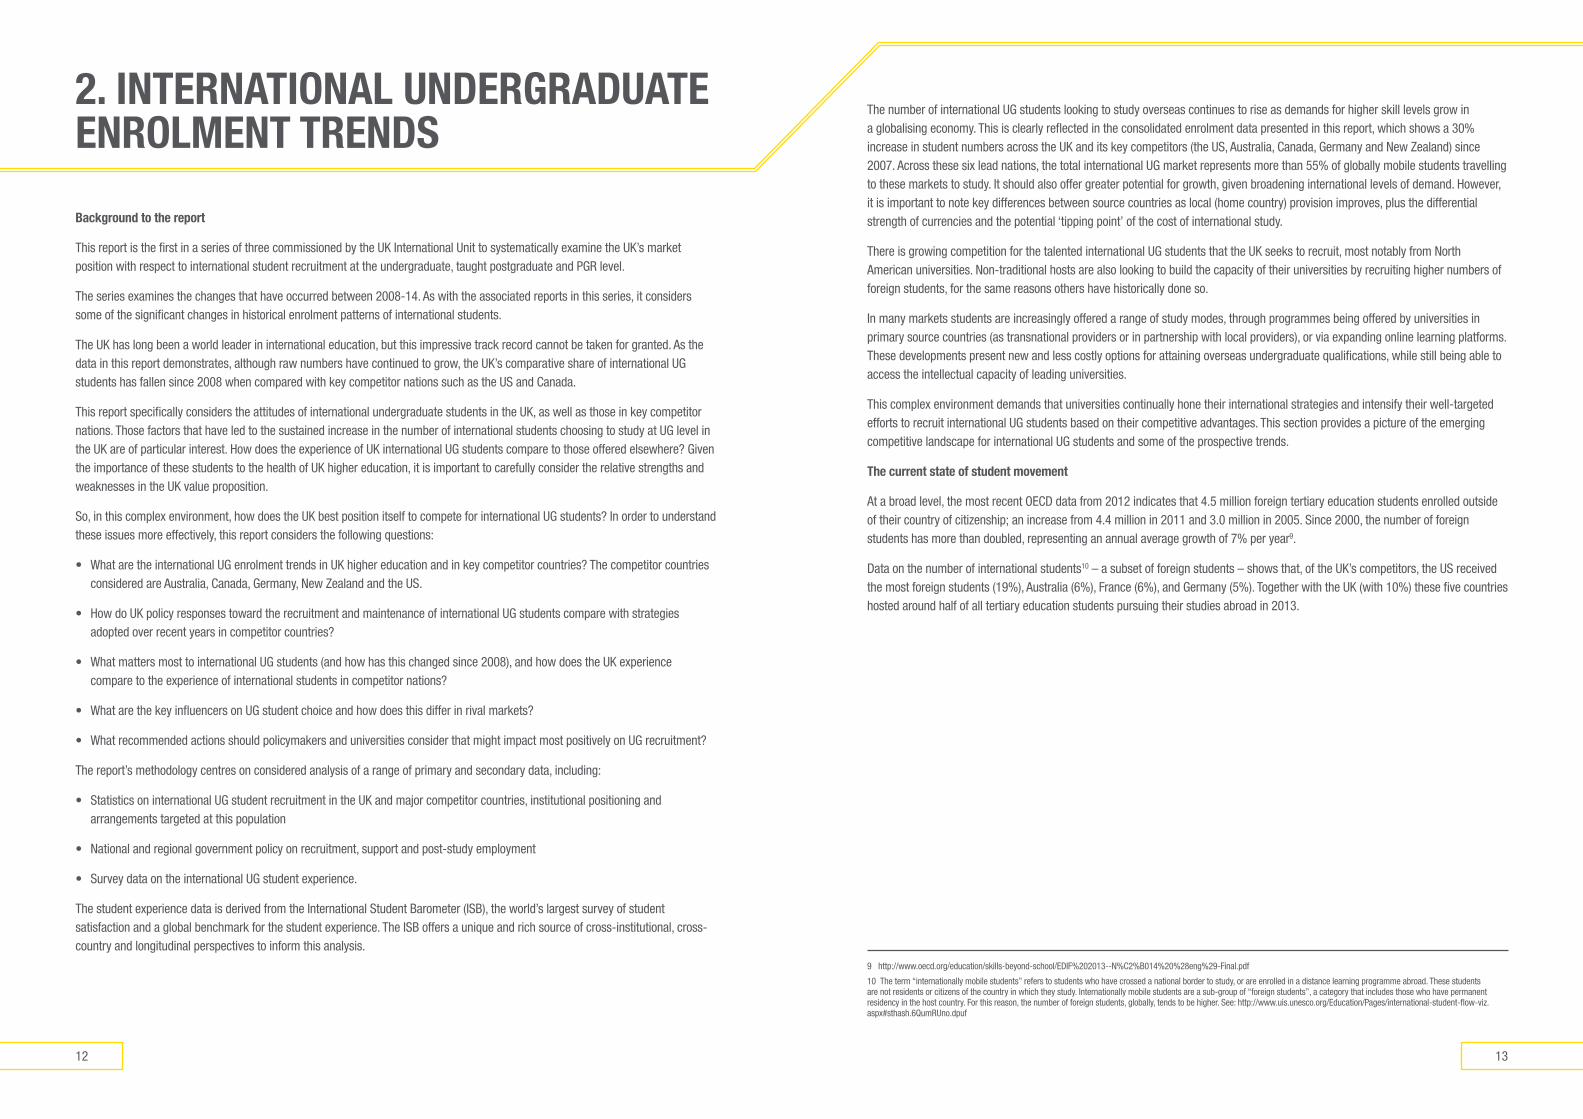
The number of international UG students looking to study overseas continues to rise as demands for higher skill levels grow in a globalising economy. This is clearly reflected in the consolidated enrolment data presented in this report, which shows a 30% increase in student numbers across the UK and its key competitors (the US, Australia, Canada, Germany and New Zealand) since 2007. Across these six lead nations, the total international UG market represents more than 55% of globally mobile students travelling to these markets to study. It should also offer greater potential for growth, given broadening international levels of demand. However, it is important to note key differences between source countries as local (home country) provision improves, plus the differential strength of currencies and the potential ‘tipping point’ of the cost of international study.
There is growing competition for the talented international UG students that the UK seeks to recruit, most notably from North American universities. Non-traditional hosts are also looking to build the capacity of their universities by recruiting higher numbers of foreign students, for the same reasons others have historically done so.
In many markets students are increasingly offered a range of study modes, through programmes being offered by universities in primary source countries (as transnational providers or in partnership with local providers), or via expanding online learning platforms. These developments present new and less costly options for attaining overseas undergraduate qualifications, while still being able to access the intellectual capacity of leading universities.
This complex environment demands that universities continually hone their international strategies and intensify their well-targeted efforts to recruit international UG students based on their competitive advantages. This section provides a picture of the emerging competitive landscape for international UG students and some of the prospective trends.
The current state of student movement
At a broad level, the most recent OECD data from 2012 indicates that 4.5 million foreign tertiary education students enrolled outside of their country of citizenship; an increase from 4.4 million in 2011 and 3.0 million in 2005. Since 2000, the number of foreign students has more than doubled, representing an annual average growth of 7% per year9.
Data on the number of international students10 – a subset of foreign students – shows that, of the UK’s competitors, the US received the most foreign students (19%), Australia (6%), France (6%), and Germany (5%). Together with the UK (with 10%) these five countries hosted around half of all tertiary education students pursuing their studies abroad in 2013.
9 http://www.oecd.org/education/skills-beyond-school/EDIF%202013--N%C2%B014%20%28eng%29-Final.pdf
10 The term “internationally mobile students” refers to students who have crossed a national border to study, or are enrolled in a distance learning programme abroad. These students are not residents or citizens of the country in which they study. Internationally mobile students are a sub-group of “foreign students”, a category that includes those who have permanent residency in the host country. For this reason, the number of foreign students, globally, tends to be higher. See: http://www.uis.unesco.org/Education/Pages/international-student-flow-viz.aspx#sthash.6QumRUno.dpuf
Background to the report
This report is the first in a series of three commissioned by the UK International Unit to systematically examine the UK’s market position with respect to international student recruitment at the undergraduate, taught postgraduate and PGR level.
The series examines the changes that have occurred between 2008-14. As with the associated reports in this series, it considers some of the significant changes in historical enrolment patterns of international students.
The UK has long been a world leader in international education, but this impressive track record cannot be taken for granted. As the data in this report demonstrates, although raw numbers have continued to grow, the UK’s comparative share of international UG students has fallen since 2008 when compared with key competitor nations such as the US and Canada.
This report specifically considers the attitudes of international undergraduate students in the UK, as well as those in key competitor nations. Those factors that have led to the sustained increase in the number of international students choosing to study at UG level in the UK are of particular interest. How does the experience of UK international UG students compare to those offered elsewhere? Given the importance of these students to the health of UK higher education, it is important to carefully consider the relative strengths and weaknesses in the UK value proposition.
So, in this complex environment, how does the UK best position itself to compete for international UG students? In order to understand these issues more effectively, this report considers the following questions:
• WhataretheinternationalUGenrolmenttrendsinUKhighereducationandinkeycompetitorcountries?Thecompetitorcountriesconsidered are Australia, Canada, Germany, New Zealand and the US.
• HowdoUKpolicyresponsestowardtherecruitmentandmaintenanceofinternationalUGstudentscomparewithstrategiesadopted over recent years in competitor countries?
• WhatmattersmosttointernationalUGstudents(andhowhasthischangedsince2008),andhowdoestheUKexperiencecompare to the experience of international students in competitor nations?
• WhatarethekeyinfluencersonUGstudentchoiceandhowdoesthisdifferinrivalmarkets?
• WhatrecommendedactionsshouldpolicymakersanduniversitiesconsiderthatmightimpactmostpositivelyonUGrecruitment?
The report’s methodology centres on considered analysis of a range of primary and secondary data, including:
• StatisticsoninternationalUGstudentrecruitmentintheUKandmajorcompetitorcountries,institutionalpositioningandarrangements targeted at this population
• Nationalandregionalgovernmentpolicyonrecruitment,supportandpost-studyemployment
• SurveydataontheinternationalUGstudentexperience.
The student experience data is derived from the International Student Barometer (ISB), the world’s largest survey of student satisfaction and a global benchmark for the student experience. The ISB offers a unique and rich source of cross-institutional, cross-country and longitudinal perspectives to inform this analysis.

1514
Table 2: International Ug student enrolments 2007-14 (and changes in comparative share)
International Ug students
2007–08 2008–09 2009–10 2010–11 2011–12 2012–13 2013–14Change since
2007-08
% Change since
2007-08
market share
2007-08
market share
2013-14
Change in
market share (% points)
% change in market
share
UK (non-EU) 104,445 112,215 123,940 134,220 142,440 146,945 152,355 47,910 46% 16.6% 17.1% 0.5% 3.1%
Australia 105,469 117,372 124,927 127,729 123,985 120,895 120,154 14,685 14% 16.8% 13.5% -3.3% -19.5%
New Zealand 38,617 37,580 40,692 41,881 44,514 44,077 44,500 5,883 15% 6.1% 5.0% -1.1% -18.6%
US 243,360 269,874 274,431 291,439 309,342 339,993 370,724 127,364 52% 38.7% 41.7% 3.0% 7.6%
Canada 85,994 88,406 97,945 108,190 119,437 132,424 146,340 60,346 70% 13.7% 16.4% 2.8% 20.2%
Germany (non-EU)
50,875 48,950 49,500 49,775 50,600 53,075 55,825 4,950 10% 8.1% 6.3% -1.8% -22.5%
Total 628,760 674,397 711,435 753,234 790,318 837,409 889,898 261,138 42%
Explanatory notes for this table
1. UK onshore enrolment data directly from https://www.hesa.ac.uk/stats (Non-EU Total UK UG)
2. Australian data derived from http://highereducationstatistics.education.gov.au (Enrolment Data Set) with a formula applied to exclude offshore students.
3. New Zealand data estimated based on undergraduate enrolments by Education Counts NZ https://www.educationcounts.govt.nz/statistics/international-education/international-students-in-new-zealand
4. Canadian data based on modeled estimates using Immigration and OECD data by OBHE.
5. US data based on modeled estimates based on IIE Open Doors data – http://www.iie.org/en/Research-and-Publications/Open-Doors/Data/International-Students/Academic-Level/2012-14. OBHE
6. German data derived from DAAD data http://www.wissenschaftweltoffen.de/kompakt/wwo2015_kompakt_en.pdf by OBHE
7. Change in the share of foreign UG students within this group of six countries, not including other countries’ share of foreign UG students.
To provide a greater level of clarity around this data, it is useful to look more specifically at overall and UG student enrolments in these individual competitor countries.
In Australia, although the estimated number of UG students has increased by 14% since 2007–08, its comparative share among major host countries has slipped by 19.5%. The near-crippling strength of the Australian dollar has now gone and there is evidence that in response to a number of recent policy changes (discussed later in this report), the number of international UG students in Australian universities has picked up significantly, with UG students enrolled in 2015 up around 10% since 2013–1411.
Currently, international students make up around 20% of undergraduates in Australian universities (compared to about a third of all postgraduate students). In contrast to the UK, just over half of all international UG students are enrolled in management and commerce qualifications. Around 10% are in engineering programmes, with just under 10% studying in either health, information technology or arts programmes. Interestingly, these proportions are roughly similar to those for Australian-based international PGT students.
11 http://highereducationstatistics.education.gov.au (Enrolment Data Set)
Figure 1: distribution of foreign and international students by destination country, 2013
Other non-OECD countries20%
United States 19%
United Kingdon 10%Australia 6%
France 6%
Germany 5%
Russian Federation** 3%
Japan 3%
Canada* 3%
China** 2%
Italy** 2%
Austria 2%
Netherlands 2%
South Arabia** 2%Spain 1%Korea** 1%
Turkey** 1%
Other OECD countries 10%
* Year of reference 2012 ** Data refer to foreign instead of international students
Source: OECD 2015 Education at a Glance report
International Ug student enrolments
Looking specifically at international non-EU undergraduate student enrolments, in 2013–14 HESA reported a total of 152,355 students enrolled. The US received the most foreign students (370,724), followed by our estimates for Canada (146,340), Australia (120,154), Germany (non-EU 55,825) and New Zealand (44,500).
Although all countries recorded absolute increases in student numbers over the period from 2007-08 to 2013-14, the relative shares of students shifted. Due to increased growth in international UG student enrolments in North America, all other competitors except the UK went backwards in real terms. The UK held its own with a 0.5% increase in market share. Canada recorded the greatest increase in its share of international UG students from 2007-14 (up 20.2%), having moved from hosting around 85,000 students in 2007–08 to 146,000 in 2013–14. Similarly the US has seen strong growth in its share, based on a 52% increase in student numbers since 2007. Conversely, Germany, New Zealand and Australia have experienced significant falls in share (ranging from 18-22%).
Table 2 (below) illustrates how these numbers of international UG students in the UK and key competitor nations have changed since 2007-8. Some caution is required in interpreting this table, as some of the data included for several countries are based on estimates where direct information is not available (the basis of which is included in the Explanatory Notes following the table).

1716
International UG student numbers in the UK have grown significantly since 2007–08, expanding by 46% to 152,355 in the latest reported data. The UK‘s share of UG students has remained relatively stable during this time, while significant declines have been recorded in key competitors Australia, New Zealand and Germany.
However, the UG international student market has been historically dominated by US universities, which attract the majority of students internationally and continue to grow their share. In 2013–14, US universities attracted more than 4 in 10 of all students amongst the six main competing nations (41.7%), compared to the 17.1% held by the UK, 13.5% for Australia and 16.4% for Canada. However, the strongest comparative growth since 2007–08 has been experienced in Canada (70%), which managed to exceed even the US (at 52%). From our estimates this level of growth saw Canada surpass Australia as the third largest provider of international UG education in 2012–13; an advantage it continues to maintain.
As is the case with international student recruitment more generally, the UK’s traditional competitors for international students have over the last five years refreshed their policy strategies in order to sustain and build their international students numbers. Initiatives have included liberalising visa application and approval processes, improving work opportunities during and post-study, improving institutional support, and expanding provision.17 These policy shifts have been driven by a growing appreciation of the immediate and longer-term economic benefits that international students can contribute to domestic educational, economic and social outcomes.
Key competitor countries
Given this complex broad environment, it is useful to consider the specific policy responses developed by the UK’s main competitor countries to meet their challenges in sustaining and growing international UG student numbers. This analysis considers recent policy moves that have sought to influence international UG student recruitment in Australia, New Zealand, the US, Canada and Germany.
australia
International education is a highly significant contributor to the Australian economy, being its largest services export with an estimated contribution of A$16.3bn to the economy in 2013–1418. International UG students currently make up 27% of Australian undergraduate enrolments. These international UG students are a significant contributor to the Australian economy and to the ability of Australian universities to maintain key undergraduate teaching programmes. Notably, international UG students make up 44% of total enrolments in management and commerce programmes, 27% of engineering programmes and 12% of health programmes.
As with other international student categories, the number of UG students opting to study in Australia fell from 2011 in response to the range of factors outlined earlier this report (i.e. currency appreciation, student security concerns and private provider issues). This prompted a series of policy responses to address this decline. Firstly, the Australian government commissioned an independent review of international student arrangements in 2011 in order to increase the attractiveness of the country for international students. Most significantly, this review led to streamlining the visa application process for many countries and categories of students. The review also provided a set of policy recommendations that were largely adopted in order to enhance the competitiveness of Australia’s international education sector. These recommendations included:
17 In contrast, in 2012 a portion of the UK’s Tier 1 visa route, which allowed international students to work without employer sponsorship for up to two years, was restricted. According to a 2015 report from the UK All-Party Parliamentary Group on Migration, the closure of the Tier 1 route saw an 88% decrease in the number of students successfully switching into a post-study work visa.
18 Australian Government, Export Income to Australia from International Education Activity in 2013-14, 2014
International UG students make up the overwhelming majority of international student enrolments in new Zealand. Since 2007–08, the number of international UG students enrolled in New Zealand universities has, like Australia, increased modestly (by around 15%), reducing the country’s modest share of this market from 6.1% to 5%. Analysis undertaken by the New Zealand Ministry of Education has linked this decline to the appreciating value of the New Zealand Dollar, which has increased the cost of study and negatively impacted on their primary market for students (South East Asia – and particularly China – where 75% of UG students come from). However, as is the case with Australia, the latest 2015 data suggests some apparent improvement in international UG student numbers, which are now up to 18,52312. Currently, international students make up around 15% of all undergraduates in New Zealand universities and are primarily studying management and commerce, information technology and engineering qualifications.
The United states hosts the largest number of international UG students, more than double those of any of its nearest rival host nations (Australia, Canada and the UK). In addition, the number of international UG students studying in US higher education has increased more than half since 2007–08, expanding the overall US share by almost 8%. Yet international UG students remain a small fraction of the US undergraduate population (estimated at less than 5% overall), though they are more prominent in the science, engineering and technology disciplines. The top three countries of origin for international students are China, Saudi Arabia, and South Korea, who together account for 48%13 of all international enrolments in the US. Chinese undergraduate students alone make up 30% of the total and numbers from India are growing fast. This significant growth can be attributed to increased efforts by US universities to internationalise and to expand their sources of revenue as domestic demographics reduce local recruitment potential in many regions.
As the US is the most attractive overseas study destination for students, it is able to attract high-quality international UG applicants. These students are recognised as being critical to not only sustaining programmes in STEM disciplines, but also to building the intellectual capability and reputation of US universities internationally14.
In Canada, international students only comprise 6% of students at the UG level, and there is a strong belief among policymakers that there is considerable untapped potential for future growth15. Accordingly, Canada has an ambitious strategy to increase its share of international students studying in its higher education universities and these efforts have yielded significant results across the board. Canada has achieved a 70% increase in international UG students since 2007–08, and recorded a 20% growth in its relative proportion of these students compared to its primary competitors. While international students enrolled in Canadian universities in 2013 came from 194 countries, the top five source countries – China, India, South Korea, Saudi Arabia and France – accounted for more than half of all foreign student enrolments, and the top 10 sending countries accounted for 71% of all foreign student enrolments. More than a third of foreign students in Canada in 2013 came from China16.
In germany estimated non-EU UG enrolments in universities show a marginal increase since 2007–08 of just 10%, resulting in a loss of its overall competitive share. The last two years have seen some modest increases in UG students, however the majority of the growth in German universities is being driven by increasing interest from foreign EU students and those adjacent to the borders of the EU. While there are significant language and cultural barriers to studying as an undergraduate in Germany, the progressive removal of student tuition fees by regional governments may mitigate against this factor. Similarly, universities are being encouraged to expand language and cultural integration activities for international students (discussed later in this report), which may also improve the ability of German universities to attract international undergraduate students. The leading non-EU countries of origin for foreign students studying in Germany are Turkey, China and Russia.
12 http://www.educationcounts.govt.nz/statistics/tertiary/participation
13 Open Doors 2015 data http://www.iie.org/Research-and-Publications/Open-Doors/Data/International-Students/By-Academic-Level-and-Place-of-Origin/2014-15
14 The Importance of International Students to America http://www.nfap.com/
15 http://www.international.gc.ca/education/assets/pdfs/ies_report_rapport_sei-eng.pdf
16 http://monitor.icef.com/2014/11/record-high-international-enrolment-canada-2013-many-students-plan-stay/
3. pOlIcy aNalysIs: ThE UK marKET aNd prImary cOmpETITOrs
1918
United states
Declines in domestic enrolment in parts of the US, weak demographics in parts of the country, and pressure on state appropriations to fund public universities have jointly persuaded a large number of universities and colleges to more aggressively recruit international students. The mix of the pre-eminent national brand for study and an increased supply has made the US a more realistic option for international students. No major US government policy change has spurred these trends, although the Obama administration’s efforts to increase ‘Green Card’ numbers and an announcement of major study abroad targets for US students may have helped.
While the majority of international students in the US are self-funded or funded by their families, growing sources of funding include international organisations, foreign governments/universities, and employers. US higher education institutions are also making greater use of education agents, following a decision to formally permit such recruitment practices.
Fewer than 5% of students in US higher education are international, compared with 11% in the UK (non-EU students) and around 20% in Australia. This serves as a reminder that the recent surge in international student numbers in the US, and increased interest from agents, is as much an opening up of supply as increased demand.
Significantly, international students in the US are generally not permitted to work, other than on campus. Campus work is limited to 20 hours a week during term-time and full-time during breaks. There are two routes to off-campus work. Curricular Practical Training (CPT) permits a student to engage in off-campus work as an integral part of their studies for up to 20 hours a week. Optional Practical Training (OPT) permits off-campus work, both during and post-study, in a position relevant to the student’s subject area. Students do not have to be sponsored by an employer. OPT may extend up to 29 months, and may be the foundation for permanent residence. Students who engage in CPT for more than 12 months are not eligible for OPT.
Canada
As education is a provincial and territorial jurisdiction in Canada, there is no national education ministry. However, international education is an increasingly important priority for all provinces and has become a strategic part of public policy to achieve Canada’s diplomacy, trade and immigration objectives.
In January 2014, the federal government unveiled Canada’s first International Education Strategy (IES)22, outlining a pan-Canadian strategy to spur consensus across governments, organisations and universities. The IES sets out to double Canada’s international student population (from the 2011 level of 239,000 to 450,000 by 2022), primarily by focusing on priority education markets – Brazil, China, India, Mexico, North Africa and the Middle East and Vietnam – and reinforcing established markets. In addition, the strategy seeks to more effectively brand Canadian education to maximise success, to strengthen institutional research partnerships and educational exchanges, and leverage people-to-people ties.23
In 2006, the government created the Off-Campus Work Permit, which allowed international students to apply for a permit to work off campus for up to 20 hours per week. Since 2006, the number of students holding a work permit has tripled, reaching 70,200 in 2012. In 2012, 7,797 international students from across Canada transitioned to permanent residency. While most international students still transition to PR through the Federal Skilled Worker Program, other options such as the Provincial Nominee Program and the Canadian Experience Class (launched in 2008) are increasingly used.
Regulatory changes in 2014 placed limitations on study permits to students attending universities designated by provinces and territories; the goal being to assure accountability within the international student programmes in Canada. Within this framework, foreign nationals at non-designated universities can still study on a visitor permit for up to six months, but they would not be eligible for Work Permit programmes designed for international students (e.g. Co-op/Internship Work Permit Program, Off-Campus Work Permit Program, Post-Graduation Work Permit Program)24. In addition, the Off-Campus Work Permit was integrated with the Study Permit in 2014, eliminating the need to apply for both separately. This allows graduates to gain the Canadian work experience needed to transition to permanent residence25.
22 http://www.cbie-bcei.ca/news/one-year-later-progress-on-canadas-international-education-strategy/
23 http://monitor.icef.com/2014/11/record-high-international-enrolment-canada-2013-many-students-plan-stay/
24 http://www.amssa.org/files/AMSSA%20Info%20Sheet%20Issue%2012%20-%20International%20Students%20-%20Statistics%20and%20Trends.pdf
25 http://www.amssa.org/files/AMSSA%20Info%20Sheet%20Issue%2012%20-%20International%20Students%20-%20Statistics%20and%20Trends.pdf
• ReductionoffinancialrequirementsforhigherriskAL3andAL4studentvisaapplicants,allowingstudentstohaveA$36,000lessin the bank when applying for a visa19.
• IntroductionoftheGenuineTemporaryEntrant(GTE)requirementtohelpreduceimmigrationriskandmaintaintheintegrityofthestudent visa programme.
• IntroductionoftheFraudPublicInterestCriteria,allowingrefusalofavisaapplicationifanapplicantprovidesfalseormisleadingdocuments or information as part of their application for a student visa (introduced in 2011).
• ImplementationofstreamlinedvisaprocessingarrangementsforcertainprospectivestudentsofparticipatinguniversitiesinAustralia at Bachelor, Masters or Doctoral degree level, to be assessed as though they are a lower immigration risk, regardless of their country of origin (introduced in 2012).
• Introductionofpost-studyworkarrangementsforinternationalstudentstoallowgraduateswhohavecompletedapostgraduatecoursework degree to apply for a Temporary Graduate visa for up to four years (introduced in 2013).
• Abolitionofautomaticandmandatorycancellationprovisionsforstudentvisastoprovidefaireroutcomesforstudentsandmorediscretion by allowing the department to take into account the individual circumstances of a student when considering a breach of visa conditions20.
In April 2015, the Australian Government issued a Draft National Strategy for International Education for stakeholder consultation. This strategy was designed to further enhance the ‘quality of the educational and living experiences for international students and embrace new ways to meet rising demand internationally for high-quality education services’21. In this draft, the government commits to maintaining the earlier changes to visa applications that simplified the application process for postgraduate research students; to improving institutional quality assurance mechanisms for international students; to broadening industry-based experience; and to encouraging the expansion of English language support by universities.
new Zealand
In broad policy terms, New Zealand sees international students, including UG students, as a means of strengthening its global economic, social and cultural links, and generating important export income. It also recognises that international students can be a powerful catalyst to stimulate skilled migration to bolster the domestic economy. To this end, the New Zealand government in 2011 established the objective of doubling the size of its international education effort by 2025. The primary strategies designed to meet this goal include stronger partnership arrangements with key source country governments and expanded offshore provision by universities.
This policy specifically flagged the need to expand the ‘transition rate’ from study to residence of international students completing UG degrees (which at this time was around 22% of graduates). To encourage this transition, New Zealand also offers international graduates two or three-year work visa opportunities, as well as encouraging skilled migration by giving international students ‘points’ towards immigration, based on attainment of particular qualifications. Other related policy changes have allowed international students to work up to 20 hours per week during term-time, and full-time during breaks.
The Christchurch earthquake of 2011 understandably impacted on the perceived attractiveness of New Zealand as a study destination. But the spirit of support, recovery and regeneration – in particular across student and academic communities – has countered residual negativity in recruitment markets.
19 http://www.immi.gov.au/students/_pdf/review-student-visa-assessment-level-framework-2013.pdf
20 http://www.immi.gov.au/students/_pdf/review-student-visa-assessment-level-framework-2013.pdf
21 https://internationaleducation.gov.au/International-network/Australia/InternationalStrategy/Documents/Draft%20National%20Strategy%20for%20International%20Education.pdf

2120
So what do we know about the experiences of UK-based international UG students, and what can this tell us about the most effective strategies to attract prospective international students?
The International Student Barometer (ISB) survey has been implemented by over 100 UK universities and by more than 800 universities worldwide. Comparisons at the national level are limited to participating universities in any specific year. However, as the world’s largest student survey, with more than 2.3 million responses globally, the scale of the exercise provides substantive indicators for most aspects of the student experience: a global benchmark for higher education.
The ISB instrument tracks five dimensions of the undergraduate student experience with a total of 152 checkpoints, plus an indication of overall satisfaction and a measure of recommendation – the extent to which a student would recommend their study experience to others (a derivation of the widely-used Net Promoter Score).
Figure 2: IsB survey structure
Section 1: Application and Decision-Making 43 Checkpoints
Section 2: Arrival experience 18 Checkpoints
Section 3: Learning 36 Checkpoints
Section 4: Living 24 Checkpoints
Overall Satisfaction
+
+
152 Checkpoints
Recommendation (NPS)
Section 5: Support Services 31 Checkpoints
This section compares the principal components of the student experience; drawing from the arrival experience, the learning experience, the living experience and university support services. By using a measure of derived importance, it is possible to establish which components matter most. Section 5 then looks at what has changed over time. Finally, section 6 considers how the UG experience in the UK stacks up against major rivals.
Nationally, tuition fees in Canada have been rising: university fees for international students are now approximately twice those of Canadian students. The only province not to experience an increase was Newfoundland and Labrador, where a tuition fees freeze included international students. In the other provinces, fee increases for international undergraduate students ranged from 2.1% in Prince Edward Island to 6.9% in Ontario. For international graduate students, increases ranged from 1.0% in Alberta to 7.7% in Saskatchewan.
germany
In recent years, the German Federal Government has sought to improve the performance and competitiveness of higher education through a variety of initiatives and programmes designed to attract more international students to study there. The DAAD’s prominence and budget to promote Germany as a study destination26 has long been a source of envy for other countries. While this is sure to continue, the scale and focus is likely to change, faced with the current and very immediate challenge of mass migration in Europe.
A series of programmes was introduced to significantly lower the cost of study, which was already perceived to be very low cost compared to obvious rivals. A funded consortium was also established to strengthen international marketing. Since 2010, the consortium has designed a number of strategies to increase the international visibility of study opportunities in Germany.
In 2011, the government introduced the Germany Scholarship for high-achieving students. Recipients receive €300 per month; half supplied by private sponsors and half by the Federal Government. In the first year, around 10,000 students received this joint funding, with the objective of providing funding for up to 8% of all students at German universities (about 160,000)27 in the medium term: “The Whole Future for Half the Price”28..
26 DAAD is the German Academic Exchange Service: https://www.daad.de/en/
27 http://www.bmbf.de/en/14332.php
28 http://www.bmbf.de/en/12159.php
4. ThE INTErNaTIONal UNdErgradUaTE sTUdENT ExpErIENcE IN ThE UK

2322
Table 3: ISB survey data on the international UG arrival experience in the UK, 2014
Ug arrival Experience
Base: 10,938 UK 2014
Accommodation Office 88%
Accommodation Condition 85%
Bank account 75%
Internet access 80%
Finance Office 90%
First night 88%
Formal welcome 89%
Home friends 82%
Host friends 78%
Local Orientation 86%
Meeting staff 91%
Other friends 90%
Registration 89%
Social activities 85%
Study sense 84%
University Orientation 87%
Welcome 82%
The learning experience
The learning experience section of the ISB uses 23 standard measures for undergraduates, dealing with their experiences with teaching and learning, facilities and other components of their studies. UG students at all stages of their studies are invited to give feedback on their learning experience, resulting in a base of 26,059 respondents for this section in the UK 2014–15 ISB.
As table 4 (below) demonstrates, UG students rate the subject expertise of their lecturers as the pre-eminent element of their learning experience in UK universities, with a highly impressive 95% satisfaction rate. It is significant that this rate is almost exactly the same as that expressed by PGT international students (with satisfaction at 94%). Student responses to the key elements of the undergraduate learning experience are similarly positive, including the quality of lectures (at 90%), the quality of assessment (at 89%) and learning support (at 89%) – ‘learning support’ specifically meaning ‘getting time from academic staff when I need it/personal support with learning’. In addition, UG students highly regard laboratories, virtual learning experiences, levels of technology and library facilities (both online and physical), lecture theatres and virtual learning environments). Similarly, language support and the levels of multiculturalism were highly-rated aspects of the UK undergraduate learning experience.
UG students were less satisfied with three aspects of their learning experience: the availability of opportunities for work experience, careers advice (in the learning context), and the clarity of marking criteria used to guide assessment.
principal elements compared
Most student surveys focus on the learning experience. This is hardly surprising; after all, students are there to learn. However, for international UG students, the wider contextual experience is vital to consider. The international UG student will typically confront a more complex series of realities than domestic students, who are inevitably familiar with local educational and social environments.
As this is typically their first experience of tertiary study, the challenges are multiplied in less familiar cultural and social contexts of learning. Therefore, the not insignificant challenges of social integration, accommodation and the quality of teaching and learning facilities assume potentially greater importance. In addition, the lack of direct family support and the generally younger age of international UG students create other challenges beyond those encountered by domestic students.
All of these factors provide a rich foundation for the ISB data to help demystify the current international UG experience, as well as to suggest actions likely to improve the ability of the UK to attract similar students into the future.
The most recent data outlined below is taken from the ISB outcomes from the 2014–15 UK academic cycle, comprising feedback from 28,323 international UG students.
The time series data incorporates feedback from 180,860 international undergraduate students studying in the UK between 2008-15.
The global comparisons and indices are made up of 184,894 international undergraduate students studying at universities in the US, Canada, Germany, New Zealand and Australia.
In total, this report draws on feedback from 365,754 international students engaged in undergraduate study outside their home country.
The dataset is of unprecedented scale and detail, making this the largest comparative study of the undergraduate student experience in the world.
The arrival experience
First impressions are vitally important – whether the student feels welcome or not, integrated or isolated, oriented or disorientated. For this reason, the ISB asks all UG students in their first year of study questions about their arrival experience. In the most recent survey cycle (2014-15), 10,938 UG students answered questions in the arrival section.
Responses to the questions put to international UG students about their arrival experience in the UK demonstrate this represented an overwhelmingly positive experience. As table 3 (below) demonstrates, 85% or more of students were satisfied with their formal welcome and orientation to the institution, their opportunities to meet staff, their initial registration, finance and accommodation arrangements, and the social activities and networks to which they were introduced. Generally, international UG students appear to be more satisfied with their arrival experiences than their postgraduate colleagues. For instance, the number of UG students who felt satisfied with the welcome they received (82%) was higher than for PGT students (78%) and for PGR students (76%). The truncated term ‘welcome’ refers specifically to the ‘meet and greet’ at the airport or rail station. This system appears to be working well for the UG international student population, whose arrival in more predictable patterns appears more straightforward to manage and resource.
The areas of least satisfaction (albeit still highly rated) included making friends with UK students and setting up a bank account.

2524
Table 5: ISB survey data on the international UG living experience in the UK, 2014
Ug living Experience
Base: 24,663 UK 2014
Accommodation quality 84%
Accommodation cost 59%
Eco-friendly attitude 90%
Earning money 58%
Financial support 55%
Good contacts 78%
Good place to be 91%
Host culture 86%
Host friends 77%
Internet access 82%
Living cost 67%
Other friends 89%
Campus buildings 90%
Campus environment 92%
Social activities 84%
Safety 92%
Home friends 84%
Social facilities 82%
Sport facilities 84%
External transport links 84%
Transport within the university 82%
Visa advice 88%
Worship facilities 89%
support services
In this section of the ISB survey international undergraduates are first asked to consider which university support services they have used and then, for the services they have used, how satisfied they are with that service. So while base numbers will be inevitably smaller, these responses will be best informed. For undergraduate students, unsurprisingly the most used service is on-campus food service, with 72% (16,334 students) indicating usage in the 2014–15 academic cycle. High proportions of international undergraduates join clubs and societies (60%) and use the students’ union (57%), compared to 40% and 44% of PGT students. These factors are the most significant differences in the use of university support services between international UG and PGT students.
More consistent responses across the international UG and PG student cohorts are seen in the accessing of IT support (45%UG/52%PGT) and use of the careers service (28% UG/28%PGT).
A relatively small proportion of international UG students said they had used university counselling services (10%), faith provision (9%) or disability support (6%) but each of these services will typically be of very significant importance to those who do.
Table 4: ISB survey data on the international UG learning experience in the UK, 2014
learning Experience
Base: 26,059 UK 2014
Academic English 92%
Marking criteria 81%
Assessment 89%
Careers advice 77%
Course content 90%
Class size 88%
Expert lecturers 95%
Employability 82%
Good teachers 89%
Online library 91%
Physical library 91%
Learning support 89%
Learning spaces 88%
Laboratories 93%
Language support 91%
Multicultural 91%
Course organisation 86%
Performance feedback 82%
Quality lecturers 90%
Research 89%
Technology 90%
Virtual learning 92%
Work experience 74%
The living experience
This section of the ISB questionnaire comprises 23 standard measures, covering accommodation and living, as well as day-to-day and broader social life experiences. A broad sample of 24,663 international UG students in the UK provided feedback for this survey in the 2014–15 academic cycle.
International undergraduates are satisfied with levels of safety, campus environments, the surroundings outside the university (labelled as ‘a good place to be’) and the quality of the host culture. High satisfaction also exists around attitudes to the environment and friendships with other students from their home country.
The ‘host friends’ indicator from survey data suggests that almost one in four UG students (23%) struggle to make friends from the UK.
Although international UG student satisfaction with their living experience is generally positive, there are several key areas where significant dissatisfaction exists. Significantly, the primary areas of comparative concern are clearly grouped around financial factors. These include the cost of living (67% satisfied), the cost of accommodation (59%), opportunities to earn money (58%), and financial support from the university (where only 55% were satisfied). Clearly this is an area where some of the strongest UG student dissatisfaction is found, suggesting it is something to consider when assessing areas for competitive improvements in the UK offer for undergraduate study.

2726
Table 7: ISB survey data on international UG satisfaction with support services in the UK, 2014
Ug support services
Base: 22,626 UK 2014
Accommodation Office 88%
Catering 84%
Counselling 88%
Careers Service 91%
Disability Support 91%
Finance Department 89%
Faith Provision 95%
Health Centre 88%
Residential Assistants 92%
International Office 93%
IT support 93%
Personal Tutors 92%
Student Advisory 94%
Students' Union 94%
Clubs/societies 94%
The Ug international student experience – what matters most?
For the ISB, i-graduate uses a derived measure of importance rather than an explicit one. The earliest iterations of the survey asked students to express importance explicitly. This made the survey overly long and established that almost every aspect of the student experience is important to nearly all students. The derived measure is not a complex algorithm; it is a measure of correlation between each component of the student experience and the student’s propensity to recommend. So if students would not recommend their experience to others, they are more likely to be dissatisfied with (for example) accommodation and the derived importance score would be higher. This would apply also in that students who are more satisfied with accommodation are more likely to recommend their experience.
The analysis suggests that, for international UG students studying in the UK, the living, arrival and learning experience all feature prominently in their most important rated factors. For UG students the three most important factors are establishing good contacts for the future (living factor), social activities (arrival experience) and quality lecturers (learning experience). Closely following these were course content (learning), social activities (living – asked of all students), course organisation (learning) and employability (learning). Five of the following thirteen factors (forming the top twenty reported in table 8 below) related to the living environment, four to the arrival experience and four to learning. This reflects the wide mix of study and non-study factors that are fundamental to international UG student satisfaction.
Significantly, the factors that UG students rate as less important are also those where satisfaction is generally lower, such as internet access, accommodation cost and host culture.
Table 6: ISB survey data on international UG support services usage in the UK, 2014
support services Usage
Base: 22,626 UK 2014 % used
Catering 16334 72%
Clubs/societies 13615 60%
Students' Union 12835 57%
Personal Tutors 11887 53%
IT support 10182 45%
Accommodation Office 8902 39%
Finance Department 7453 33%
Student Advisory 7351 32%
Health Centre 7272 32%
International Office 6987 31%
Careers Service 6310 28%
Residential Assistants 3736 17%
Counselling 2156 10%
Faith Provision 2120 9%
Disability Support 1332 6%
Of the international UG students who accessed these support services, the highest level of satisfaction was with faith provision. Importantly, services of higher levels of use – student advisory services, the students’ union and clubs and societies – all recorded extremely high levels of satisfaction (all 94%). Similarly, very high levels of satisfaction were evident for international offices, IT support services, personal tutors and residential assistants. Careers services evidently face the challenge of convincing more international students to use them, but those who do report very high levels of satisfaction (91%). Relatively lower levels of satisfaction are reported around the catering, accommodation offices and health services. Noting that ‘relatively lower’ is still 84% to 88% in this section.

2928
While any student survey is useful as a snapshot in time of the student experience, it is just that: a moment in time. Years ago universities would reassure themselves that a picture, taken once every two or three years, would be sufficient to reassure them that all is well with the student and his or her experience. So, looking at the international undergraduate student experience, what has changed since 2008?
This question is important for two reasons. Firstly, the once near-timeless experience of higher-level study is now readily impacted by changes outside the organisation – such as the growing array of competing universities and competitive factors. Secondly, this question underscores the value of a sequence of surveys – regular feedback – to understand what has changed. This applies not only to contextual changes for students (alternative options, their motivations for study, the expectations they bring with them), but also to the impact of changes made as a result of positive interventions compared to no intervention at all. This is called ‘closing the loop’:
Figure 3: closing the loop
Invite Student Feedback
Closing the Loop
Collect StudentFeedback
Aggregate andCompare
Report -back
Institution-levelDisaggregation
DisseminationInterpretation
Prioritisation
ResourceAllocation
Implementation of Changes
Internal Review
When the international student experience was last reported by the International Unit (at PGR level only), most UK universities had been surveying their international students comparatively for just a year or two. Now, with the benefit of hindsight, it is possible to look back at what has changed across seven years.
Firstly, as noted earlier in the report, the number of international UG students in the UK has increased by almost half since 2007-8. It is to be expected that universities, academics and services would struggle to maintain satisfaction levels in the face of such significant increases. At the same time, international undergraduates who when faced with a world of choice chose the UK, have become no less demanding. With some notable exceptions of ‘active expectation management’, student expectations have shown no signs of diminishing.
Table 8: IsB survey data – derived importance of the international Ug student experience in the UK, 2014
rank area component of the Ug experiencederived
Importance
1 Living Good contacts 31.1%
2 Arrival Social activities 30.8%
3 Learning Quality lecturers 29.8%
4 Learning Course content 29.6%
5 Living Social activities 29.6%
6 Learning Course organisation 29.6%
7 Learning Employability 29.3%
8 Living Good place to be 27.8%
9 Living Campus buildings 27.8%
10 Living Host culture 27.7%
11 Learning Good teachers 27.6%
12 Arrival Formal welcome 27.5%
13 Living Social facilities 27.0%
14 Arrival University Orientation 26.8%
15 Arrival Study sense 26.7%
16 Arrival Host friends 26.6%
17 Living Campus environment 26.5%
18 Learning Expert lecturers 26.2%
19 Learning Assessment 25.8%
20 Learning Research 25.7%
5. WhaT has chaNgEd sINcE 2008?

3130
Table 16: IsB survey data – the arrival experience for international Ug students in the UK, 2008-14
arrival Experience
2008 2009 2010 2011 2012 2013 2014 Change
Accommodation Office 82% 83% 85% 86% 88% 87% 88% 7%
Accommodation Condition N/A N/A 84% 84% 84% 85% 85% 1%
Bank account 62% 64% 65% 70% 74% 75% 75% 13%
Internet access 84% 86% 77% 77% 79% 77% 80% -4%
Finance Office 79% 79% 87% 89% 89% 91% 90% 11%
First night 84% 85% 86% 86% 87% 88% 88% 4%
Formal welcome 87% 88% 89% 89% 89% 89% 89% 2%
Home friends 75% 79% 83% 84% 83% 85% 82% 7%
Host friends 81% 83% 79% 79% 79% 78% 78% -3%
Local Orientation 84% 86% 86% 86% 86% 87% 86% 2%
Meeting staff 87% 87% 90% 90% 90% 91% 91% 4%
Other friends 89% 90% 90% 89% 89% 90% 90% 1%
Registration 87% 86% 87% 87% 89% 90% 89% 2%
Social activities 85% 85% 86% 86% 84% 85% 85% 0%
Study sense 82% 83% 83% 85% 84% 85% 84% 2%
University Orientation 86% 86% 86% 88% 87% 88% 87% 1%
Welcome 76% 79% 81% 81% 81% 83% 82% 6%
Overall student satisfaction
Across all the primary (umbrella) measures of student satisfaction, the UK has seen improvements since 2008.
Overall UG satisfaction has remained relatively stable at an impressively high level since 2008 (then 90%, now 91%). Of this period, the only slight dip in satisfaction was recorded in 2012, picking up subsequently. These elevated levels of satisfaction are also reflected in the propensity of international UG students to recommend UK universities as a place to study: rising two percentage points between 2008-14.
The largest increase in satisfaction over time has been with the arrival experience and support services, where efforts may be easier to implement and recognise. Likewise, improvement is also seen in learning and living.
Table 9: IsB survey data – overall measures of the UK international Ug student experience, 2008-14
Overall measures
2008 2009 2010 2011 2012 2013 2014 Change
Recommendation 83% 83% 84% 84% 84% 86% 85% 2%
Overall Satisfaction 90% 91% 91% 91% 89% 91% 91% 1%
Arrival Overall 87% 88% 88% 88% 89% 90% 90% 3%
Learning Overall 87% 87% 88% 88% 86% 88% 88% 2%
Living Overall 86% 87% 88% 88% 88% 89% 87% 1%
Support Overall 88% 89% 90% 91% 91% 91% 90% 2%
The arrival experience
On virtually all factors related to their arrival experience in the UK, international UG students have reported improved satisfaction since 2008, despite starting from a relatively high base. In 2014, highest levels of satisfaction were reported with institutional orientation (meeting staff, finance, formal welcome, formal orientation, accommodation, registration and the first night) and social contact (local orientation, other friends and social activities). The most significant improvements over time relate to the ease of financial arrangements (dealings with the institution’s finance office and establishing a bank account).
‘Home friends’, while noting the improvement, is a counter-indicator to ‘host friends’, reflecting the continuing challenge of integration.
Declining satisfaction was recorded concerning the vexed issue of internet access. While connectivity has no doubt improved since 2008, higher expectations are likely to have impacted on satisfaction in this area.

3332
The living experience
While the trend remains upward across the majority of indicators of the living experience, more mixed results emerge in this section.
On the positive side, the element of greatest importance to undergraduate students, making good contacts for the future, has improved significantly, by six percentage points.
Providing immigration and visa advice for international students has been increasingly challenging for UK universities in recent years. So recognition is due for an evident improvement in student satisfaction across this period.
Almost surprisingly, satisfaction with the cost of living has improved. The key here is ‘positive expectation management’, not a fall in prices or a weakening of the UK currency. Universities have got better at a) giving a realistic indication of what it costs to live while studying in the UK and at b) making prospective students take note.
Two areas of concern have deteriorated. Declining satisfaction with financial support29 is significant, with a 10% fall since 2008 meaning that almost half of international UG students in 2014 were dissatisfied. In a related indicator, satisfaction also fell concerning the ability of students to earn money, which has dropped by seven percentage points across the period.
Satisfaction with social engagement also recorded a fall, though minor. In addition, as reported earlier, with rising expectations of internet connectivity, there have been falling levels of satisfaction with access.
Notably, improvements over time means several elements of the living experience are now reporting satisfaction levels of 90% or above, where none did in 2008. 90%+ levels were recorded for campus buildings and general environment, an eco-friendly attitude, the surroundings outside the university and personal safety. Other strong results can be seen concerning transport and sporting facilities and spaces for worship.
The most notable indicator showing nominal change is ‘host friends’, a key indicator of social integration. Much good work and applied research is being conducted in this area30.
29 Question wording: “The availability of financial support/bursaries, etc.”
30 Most notably at the University of Warwick; Spencer-Oatey et al.
The learning experience
These outcomes, by any measure, are outstanding results. UK universities, with 36% more international undergraduates than in 2008, have seen improvements in student satisfaction across every measure of the learning experience. Importantly, areas of lower levels of satisfaction (careers advice and work experience) have seen the biggest increases across this period, clearly on a trajectory of significant improvement.
Table 17: IsB survey data – the learning experience for international Ug students in the UK, 2008-14
learning Experience
2008 2009 2010 2011 2012 2013 2014 Change
Academics’ English 88% 89% 91% 91% 91% 92% 92% 3%
Marking criteria N/A N/A 80% 81% 79% 80% 81% 1%
Assessment 86% 87% 88% 88% 87% 88% 89% 3%
Careers advice 70% 72% 76% 77% 75% 76% 77% 7%
Course content 87% 89% 89% 90% 88% 90% 90% 2%
Class size N/A N/A N/A N/A 87% 87% 88% 1%
Expert lecturers 94% 94% 94% 94% 94% 95% 95% 1%
Employability 79% 80% 81% 82% 79% 81% 82% 4%
Good teachers 85% 86% 88% 88% 87% 88% 89% 3%
Online library N/A N/A 89% 90% 90% 91% 91% 2%
Physical library N/A N/A 88% 90% 91% 90% 91% 3%
Learning support 82% 84% 87% 88% 86% 88% 89% 6%
Learning spaces 84% 85% 87% 89% 88% 89% 88% 4%
Laboratories N/A N/A 91% 92% 92% 93% 93% 1%
Language support 84% 85% 88% 89% 89% 90% 91% 6%
Multicultural 86% 88% 90% 90% 91% 91% 91% 5%
Course organisation N/A N/A 85% 86% 85% 86% 86% 1%
Performance feedback 81% 83% 81% 81% 79% 81% 82% 1%
Quality lecturers N/A N/A 89% 89% 88% 89% 90% 1%
Research 86% 87% 87% 87% 86% 88% 89% 3%
Technology 86% 85% 88% 89% 89% 90% 90% 4%
Virtual learning N/A N/A 91% 90% 91% 92% 92% 1%
Work experience 67% 69% 71% 72% 70% 72% 74% 7%

3534
support services
Overall, UG students in 2014 were highly satisfied with the support services they chose to access. The specific dimensions of support satisfaction improved on almost all fronts from an already high base in 2008. It is notable and encouraging that the biggest improvements were in the areas of comparatively lower satisfaction: catering and accommodation office services. In 2014, more than 90% of students were satisfied with services provided by the students’ union, campus clubs and societies, faith provision, personal tutors, international office, careers service, disability support, residential assistants and IT support. This last point is also notable: due recognition for IT services.
Table 19: IsB survey data – support services for international Ug students in the UK, 2008-14
support services
2008 2009 2010 2011 2012 2013 2014 Change
Accommodation Office 80% 83% 85% 86% 87% 87% 88% 8%
Catering 77% 78% 80% 83% 81% 83% 84% 7%
Counselling 91% 87% 88% 91% 88% 90% 88% -2%
Careers Service 87% 86% 88% 88% 88% 89% 91% 4%
Disability Support 91% 90% 90% 92% 91% 94% 91% 0%
Finance Department 85% 85% 86% 89% 88% 90% 89% 4%
Faith Provision 92% 92% 94% 94% 94% 95% 95% 4%
Health Centre 88% 87% 89% 89% 88% 86% 88% 0%
Residential Assistants 89% 89% 91% 92% 92% 92% 92% 3%
International Office 92% 90% 91% 92% 91% 92% 93% 2%
IT support 91% 90% 91% 92% 92% 93% 93% 3%
Personal Tutors N/A N/A N/A N/A N/A 92% 92% 0%
Student Advisory 91% 91% 92% 92% 94% 95% 94% 4%
Students' Union 92% 92% 93% 94% 94% 93% 94% 2%
Clubs/societies 93% 92% 94% 95% 94% 94% 94% 1%
conclusion
The most recent results of the ISB survey around satisfaction of international UK students tells an extremely positive story. On the vast majority of elements, outcomes have remained strong, with improvements across the board since 2008. Moreover, on most of the items that started from a relatively low base, improvement is greatest.
Across all key factors of the learning and support experience, the UK performs extremely well, confirming its continuing strength as an attractive destination for international students.
Consideration should be given to negative perceptions around financial support and part-time work in particular.
Table 18: IsB survey data – the living experience for international Ug students in the UK, 2008-14
living Experience
2008 2009 2010 2011 2012 2013 2014 Change
Accommodation quality 83% 83% 85% 85% 85% 85% 84% 2%
Accommodation cost 62% 65% 59% 60% 57% 58% 59% -3%
Eco-friendly attitude N/A 87% 89% 90% 90% 92% 90% 4%
Earning money 65% 65% 59% 60% 61% 54% 58% -7%
Financial support 65% 67% 61% 64% 62% 52% 55% -10%
Good contacts 73% 74% 80% 80% 79% 79% 78% 6%
Good place to be 87% 88% 90% 90% 90% 91% 91% 4%
Host culture 81% 83% 85% 85% 86% 87% 86% 5%
Host friends 75% 77% 75% 76% 77% 77% 77% 2%
Internet access 84% 84% 79% 79% 81% 80% 82% -3%
Living cost 60% 67% 64% 66% 62% 66% 67% 7%
Other friends 85% 86% 88% 89% 89% 90% 89% 4%
Campus buildings N/A N/A N/A 89% 88% 89% 90% 1%
Campus environment N/A N/A N/A 92% 91% 93% 92% 0%
Social activities 80% 81% 84% 84% 83% 84% 84% 4%
Safety 89% 89% 89% 87% 89% 92% 92% 4%
Home friends 86% 86% 85% 85% 85% 85% 84% -2%
Social facilities 83% 83% 86% 87% 80% 82% 82% -1%
Sport facilities 80% 79% 81% 83% 81% 84% 84% 4%
External transport links 82% 82% 85% 85% 85% 86% 84% 2%
Transport within the university
81% 81% 81% 84% 83% 84% 82% 1%
Visa advice 86% 85% 83% 84% 85% 88% 88% 3%
Worship facilities 86% 87% 86% 86% 86% 90% 89% 3%

3736
6. hOW dOEs ThE UK INTErNaTIONal UNdErgradUaTE ExpErIENcE cOmparE?
Overall measures: ranked positions UK australia Canada nZ Us
Ug 2014 2014 2014 2013 2014
Recommendation 1 4 3 5 2
Overall Satisfaction 1 4 3 5 2
Arrival Overall 1 2 4 5 3
Learning Overall 1 4 3 5 2
Living Overall 1 2 5 3 4
Support Overall 1 4 5 3 2
The arrival experience
Some caution is required when considering comparative data on the arrival experience for international UG students. Firstly, it is apparent that both the UK and its key competitors generally do equally well with regard to welcoming and orientating students. Understandably, new students will generally regard their welcome as positive, though how welcome students feel will depend on a range of quite subjective factors such as cultural familiarity, preparedness and academic or other connections. Perhaps for these reasons, the range of difference in levels of UG student satisfaction with their arrival arrangements is broadly comparable. Nevertheless, this suggests that continuing efforts to improve the welcoming experience for international undergraduate students is essential for maintaining a competitive position.
For UG students, the UK performs comparatively best with regard to initial connection-building (meeting staff, building personal connections, social activities and first night experiences). Results are comparatively less convincing around university orientation, accommodation support and in establishing a bank account.
Table 21: IsB survey data – Ug arrival experience satisfaction across key competitors, 2013–14
arrival Experience UK australia Canada nZ Us
2014 2014 2014 2013 2014
Accommodation Office 3.13 3.13 3.22 3.07 3.15
Accommodation Condition 3.11 3.03 3.07 3.02 3.07
Bank account 2.92 3.17 3.14 3.15 3.15
Internet access 3.04 2.89 3.05 2.79 2.92
Finance Office 3.16 3.10 3.10 3.04 3.14
First night 3.15 3.11 3.09 3.07 3.08
Formal welcome 3.17 3.12 3.14 3.08 3.17
Home friends 3.06 3.10 3.06 3.10 3.12
Host friends 3.03 2.86 2.87 2.87 2.93
Local Orientation 3.09 2.96 3.03 3.07 3.05
Meeting staff 3.18 3.09 3.06 3.06 3.14
Other friends 3.24 3.10 2.95 3.04 3.08
Registration 3.15 3.08 3.14 3.01 2.96
Social activities 3.06 3.01 2.95 2.91 3.06
Study sense 3.08 3.02 3.01 2.95 3.06
University Orientation 3.11 3.14 3.08 3.07 3.14
Welcome 3.07 3.09 2.97 3.10 2.99
While percentages of satisfied students provide a helpful general picture, they can mask significant differences. The difference between a student being (merely) satisfied and very satisfied is worthy of note. Even more notable is the difference between passive and active recommendation. In institutional terms, the difference between a student recommending his or her experience if asked, or recommending it actively, is of huge importance in a competitive environment where personal recommendation plays such a significant part.
Comparing the UK’s international UG student experience against rival markets, this report now turns to the more sensitive indicator of the mean score of satisfaction, based on the 4-point scale where a ‘very satisfied’ scores 4 and very dissatisfied scores 1. From the earliest days of the ISB, the decision was taken not to have a mid-point option for satisfaction, as some students would incline towards the non-committal ‘3’: neither satisfied nor dissatisfied.
However, for recommendation, the statement ‘I would neither encourage nor discourage others’ is not an opt-out response. It is a significant thing to say. For this reason, a 5-point scale for recommendation is used.
Overall measures
On all the overall measures drawn from ISB survey data, the UK international UG student experience is the most highly rated against key rivals on all factors. This is an extremely strong result. The UK is rated significantly higher as a recommended destination than its key rival the United States, and has considerably higher overall satisfaction levels than Australia, Canada and New Zealand.
In the critical domain of learning, the UK international undergraduate student experience is ahead of all rivals, although very closely followed by the US.
On the other umbrella measures – arrival, living and support – the margins are smaller. In the living experience the UK’s lead is most closely challenged by Australia, with similar ratings across all rivals.
Table 20: IsB survey data – overall measures of Ug satisfaction across key competitors, 2013–14
Overall measures: mean scores UK australia Canada nZ Us
Ug 2014 2014 2014 2013 2014
Recommendation 4.22 4.04 4.10 4.02 4.17
Overall Satisfaction 3.16 3.03 3.04 3.01 3.10
Arrival Overall 3.12 3.09 3.03 3.02 3.06
Learning Overall 3.08 2.97 3.01 2.94 3.07
Living Overall 3.07 3.05 3.00 3.02 3.01
Support Overall 3.02 2.96 2.96 2.96 2.99
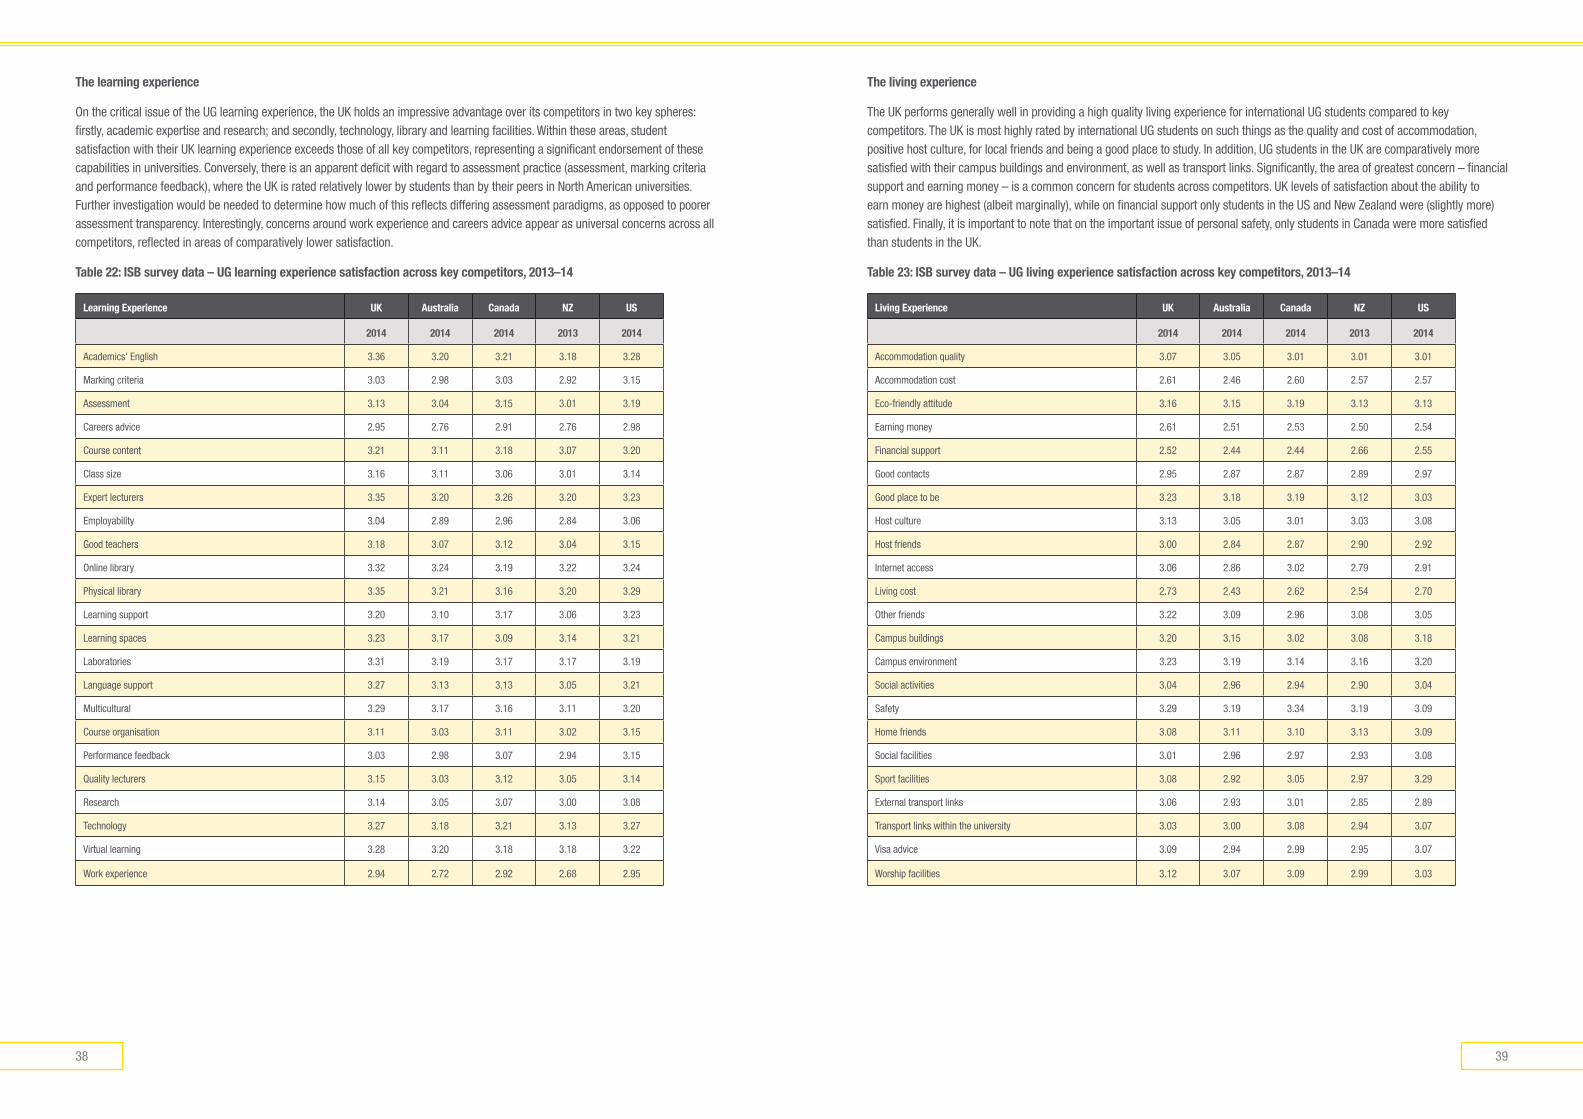
3938
The living experience
The UK performs generally well in providing a high quality living experience for international UG students compared to key competitors. The UK is most highly rated by international UG students on such things as the quality and cost of accommodation, positive host culture, for local friends and being a good place to study. In addition, UG students in the UK are comparatively more satisfied with their campus buildings and environment, as well as transport links. Significantly, the area of greatest concern – financial support and earning money – is a common concern for students across competitors. UK levels of satisfaction about the ability to earn money are highest (albeit marginally), while on financial support only students in the US and New Zealand were (slightly more) satisfied. Finally, it is important to note that on the important issue of personal safety, only students in Canada were more satisfied than students in the UK.
Table 23: IsB survey data – Ug living experience satisfaction across key competitors, 2013–14
living Experience UK australia Canada nZ Us
2014 2014 2014 2013 2014
Accommodation quality 3.07 3.05 3.01 3.01 3.01
Accommodation cost 2.61 2.46 2.60 2.57 2.57
Eco-friendly attitude 3.16 3.15 3.19 3.13 3.13
Earning money 2.61 2.51 2.53 2.50 2.54
Financial support 2.52 2.44 2.44 2.66 2.55
Good contacts 2.95 2.87 2.87 2.89 2.97
Good place to be 3.23 3.18 3.19 3.12 3.03
Host culture 3.13 3.05 3.01 3.03 3.08
Host friends 3.00 2.84 2.87 2.90 2.92
Internet access 3.06 2.86 3.02 2.79 2.91
Living cost 2.73 2.43 2.62 2.54 2.70
Other friends 3.22 3.09 2.96 3.08 3.05
Campus buildings 3.20 3.15 3.02 3.08 3.18
Campus environment 3.23 3.19 3.14 3.16 3.20
Social activities 3.04 2.96 2.94 2.90 3.04
Safety 3.29 3.19 3.34 3.19 3.09
Home friends 3.08 3.11 3.10 3.13 3.09
Social facilities 3.01 2.96 2.97 2.93 3.08
Sport facilities 3.08 2.92 3.05 2.97 3.29
External transport links 3.06 2.93 3.01 2.85 2.89
Transport links within the university 3.03 3.00 3.08 2.94 3.07
Visa advice 3.09 2.94 2.99 2.95 3.07
Worship facilities 3.12 3.07 3.09 2.99 3.03
The learning experience
On the critical issue of the UG learning experience, the UK holds an impressive advantage over its competitors in two key spheres: firstly, academic expertise and research; and secondly, technology, library and learning facilities. Within these areas, student satisfaction with their UK learning experience exceeds those of all key competitors, representing a significant endorsement of these capabilities in universities. Conversely, there is an apparent deficit with regard to assessment practice (assessment, marking criteria and performance feedback), where the UK is rated relatively lower by students than by their peers in North American universities. Further investigation would be needed to determine how much of this reflects differing assessment paradigms, as opposed to poorer assessment transparency. Interestingly, concerns around work experience and careers advice appear as universal concerns across all competitors, reflected in areas of comparatively lower satisfaction.
Table 22: IsB survey data – Ug learning experience satisfaction across key competitors, 2013–14
learning Experience UK australia Canada nZ Us
2014 2014 2014 2013 2014
Academics' English 3.36 3.20 3.21 3.18 3.28
Marking criteria 3.03 2.98 3.03 2.92 3.15
Assessment 3.13 3.04 3.15 3.01 3.19
Careers advice 2.95 2.76 2.91 2.76 2.98
Course content 3.21 3.11 3.18 3.07 3.20
Class size 3.16 3.11 3.06 3.01 3.14
Expert lecturers 3.35 3.20 3.26 3.20 3.23
Employability 3.04 2.89 2.96 2.84 3.06
Good teachers 3.18 3.07 3.12 3.04 3.15
Online library 3.32 3.24 3.19 3.22 3.24
Physical library 3.35 3.21 3.16 3.20 3.29
Learning support 3.20 3.10 3.17 3.06 3.23
Learning spaces 3.23 3.17 3.09 3.14 3.21
Laboratories 3.31 3.19 3.17 3.17 3.19
Language support 3.27 3.13 3.13 3.05 3.21
Multicultural 3.29 3.17 3.16 3.11 3.20
Course organisation 3.11 3.03 3.11 3.02 3.15
Performance feedback 3.03 2.98 3.07 2.94 3.15
Quality lecturers 3.15 3.03 3.12 3.05 3.14
Research 3.14 3.05 3.07 3.00 3.08
Technology 3.27 3.18 3.21 3.13 3.27
Virtual learning 3.28 3.20 3.18 3.18 3.22
Work experience 2.94 2.72 2.92 2.68 2.95

4140
Figure 4: IsB survey data – Ug cost-of-living satisfaction trends across key competitors, 2008-14
2.0
2008 2009 2010 2011 2012 2013 2014
2.5
3.0
UK
Australia
Canada
NZ
USA
Financial support
As noted earlier, the UK has seen declining levels of student satisfaction around the availability of financial support. As figure 5 (below) demonstrates, this can be seen from 2011, with a partial recovery in 2014. This level of satisfaction fell beneath all competitors (aside from Canada) in 2013, with Australia’s dramatic fall in 2014 putting the UK back in the middle of the pack. This suggests that financial support remains a somewhat volatile element of student satisfaction and may be a deciding factor for prospective international students weighing up differing study destinations.
Figure 5: IsB survey data – Ug financial support satisfaction trends across key competitors, 2008-14
20142008 2009 2010 2011 2012 2013
2.5
2.0
3.0
UK
Australia
Canada
NZ
USA
Support services
In support services, 8 of 15 measures are rated most highly against rivals. The dimension of difference across key competitors in some support services is slight. However, there are some variances that are useful to note. For instance, the UK’s university careers services have the highest rating for satisfaction against major rivals. The UK is rated lowest on health centre services but highest on IT support and for its clubs and societies. For university health services the average rating is 88% satisfied, but this is lower than rivals.
Table 24: IsB survey data – Ug support services satisfaction across key competitors, 2013–14
support services UK australia Canada nZ Us
2014 2014 2014 2013 2014
Accommodation Office 3.12 3.05 3.11 3.10 3.11
Catering 3.06 2.97 2.93 2.88 2.98
Counselling 3.18 3.20 3.17 3.20 3.21
Careers Service 3.26 3.08 3.17 3.05 3.21
Disability Support 3.25 3.27 3.23 3.07 3.26
Finance Department 3.13 3.03 3.08 3.02 3.17
Faith Provision 3.37 3.30 3.14 3.26 3.28
Health Centre 3.18 3.22 3.20 3.21 3.26
Residential Assistants 3.22 3.21 3.22 3.15 3.24
International Office 3.25 3.16 3.19 3.17 3.25
IT support 3.27 3.19 3.19 3.18 3.25
Personal Tutors 3.30 3.21 3.22 3.25
Student Advisory 3.29 3.20 3.19
Students' Union 3.29 3.22 3.21 3.19 3.32
Clubs/societies 3.31 3.13 3.20 3.20 3.25
Other factors
Other important longitudinal outcomes emerge from international comparisons of the ISB data. These merit consideration and are outlined below.
cost of living
The change over the last seven years in satisfaction with the cost of living provides useful insights about the relative position of the UK. As the graph below demonstrates, for international UG students in the UK, satisfaction has remained broadly consistent throughout this period and is highest in 2014. Notably, Australia has suffered a significant fall in satisfaction on this factor since 2009, coinciding with falling student enrolments.

4342
Overall satisfaction
Finally, the critical dimension of overall international UK student satisfaction since 2008 is represented in this figure 7. Here the data tells an impressive story for the UK.
Figure 7: IsB survey data – Ug overall satisfaction trends across key competitors, 2008-14
2.5
20142008 2009 2010 2011 2012 2013
3.0
3.5
UK
Australia
Canada
NZ
USA
Overall student satisfaction for UK-based UG students has continued to remain highest amongst key competitors since 2008, often by a considerable margin. However, just as the UK has seen an improving trend in this indicator, so have most competitors.
learning overall
The gradual rise in student satisfaction with overall learning in the UK, as well as the similar improvements being recorded in competitor nations is well represented in figure 6 (below). Here we can also see some recovery in UK satisfaction levels from 2012, mirroring those recorded in the US. This data shows that in 2014 satisfaction with learning in the UK and the US was considerably higher than in Australia and Canada.
Figure 6: IsB survey data – Ug overall learning satisfaction trends across key competitors, 2008-14
2.5
3.0
3.5
20142008 2009 2010 2011 2012 2013
UK
Australia
Canada
NZ
USA

4544
7. dEcIsION-maKINg FacTOrs FOr INTErNaTIONal UNdErgradUaTE sTUdENTs
Key decision-making factors by nationality
UG students across virtually all nationalities in UK universities generally rate institutional reputation and specific courses of study as their most significant decision-making factors. However, it is notable that for students from South East Asia, India and Nigeria, the issue of personal safety figures prominently as a decision-making trigger.
Similarly, the research quality of universities, the cost of living, the cost of study, and the ability to earn an income appeared as more significant decision-making factors for students from India and Nigeria, when compared to students from China.
Table 25: IsB survey data – key decision-making factors for Ug students in the UK by nationality, 2014–15
UK 2014
china malaysia Us Nigeria Indiahong Kong
singapore Brazil Canada pakistan russia Norwaysouth Korea
decision making Factors 11,362 1,171 570 440 380 318 300 269 247 153 135 129 127 111
Institution reputation 3.46 3.33 3.56 3.39 3.52 3.62 3.50 3.67 3.45 3.47 3.54 3.57 3.33 3.54
Specific course of study 3.43 3.24 3.50 3.29 3.54 3.65 3.37 3.54 3.44 3.44 3.57 3.40 3.46 3.55
Earning potential 3.33 3.27 3.49 2.96 3.54 3.50 3.35 3.39 3.33 3.29 3.43 3.40 3.12 3.45
Personal safety 3.31 3.50 3.55 3.29 3.51 3.56 3.54 3.49 3.31 3.35 3.44 3.13 3.26 3.48
Research quality 3.27 3.29 3.28 3.01 3.45 3.41 3.26 3.13 3.30 3.09 3.33 3.34 3.16 3.55
Cost of living 3.17 3.05 3.40 3.05 3.37 3.24 3.23 3.25 2.88 3.11 3.20 2.95 2.83 3.17
Location 3.13 3.01 3.12 3.36 3.16 3.19 3.15 3.090 3.24 3.25 3.03 3.04 3.24 3.06
Opportunities for further study
3.12 3.22 3.24 2.73 3.30 3.27 3.18 3.00 3.07 2.90 3.27 3.20 2.78 3.26
Cost of study 3.09 3.07 3.26 2.99 3.25 3.31 3.23 3.14 2.39 3.07 3.18 2.83 2.68 3.25
Post-study work opportunities
3.01 2.84 3.15 2.64 3.10 3.06 3.02 2.96 2.72 2.90 3.10 3.18 2.51 3.10
Social life 3.01 2.99 2.92 3.06 2.94 3.10 3.02 2.89 2.94 3.05 3.09 2.89 3.29 3.11
University Scholarship/Bursary
2.87 2.86 3.08 2.61 2.95 3.00 2.88 2.79 2.79 2.86 3.06 2.42 2.34 3.05
Opportunities to work while studying
2.86 2.92 2.94 2.51 3.12 3.10 2.89 2.54 2.80 2.62 3.03 2.66 2.14 2.83
Visa process 2.61 2.90 3.11 2.70 3.09 3.00 2.82 2.91 2.41 2.86 3.10 2.55 2.13 2.73
Permanent residence 2.60 2.52 2.67 2.41 2.81 2.43 2.66 2.44 2.45 2.48 2.68 2.90 2.21 2.68
Proximity to my home country
2.19 2.33 2.19 1.71 2.49 2.34 2.23 1.89 1.59 1.92 2.45 1.98 2.50 2.03
With any sector-level report, there is an inevitable risk that outcomes are overly broad or too generic. This can result in either sweeping propositions around generic interpretations or, more likely, no action at all. So while this report outlines those issues that broadly matter most in international UG student decision-making, a deeper exploration of differences by country of origin and field of study may yield valuable insights. In the 2014–15 academic cycle, all new international UG arrivals to the UK (that is, students who were in the first year of their studies) were asked questions in the ISB around their decision-making. Responses were received from 11,362 students. The decision-factors questions have a 4-point scale, from very unimportant (1) to very important (4). In the scale on the chart below, the range is from unimportant (2) to very important (4).
Key decision-making factors
In 2014–15, the principal factors underpinning the decision of international UG students to study in the UK were (in order of significance): the reputation of their selected institution, the specific course of study, earning potential and personal safety. The first of these factors – institutional reputation – was common across all international students as their primary decision-making factor. The specific course of study was also shared between UG students and PGT students as their second priority. For all international students, the issue of research quality, earning potential and personal safety also figured prominently in decision-making priorities. Equally, the issues of proximity to home country and opportunities for permanent residence all rated lower across all student categories, including UG students.
Interestingly, cost of study, cost of living and opportunities to work were rated relatively lower as decision-making factors, despite these appearing as more significant concerns in later satisfaction data. This suggests that although financial issues are not primary in decision-making (being more rightly centred on institutional quality and course offerings), this does become more significant for UG students once they are living and engaged in study in the UK.
Figure 8: IsB survey data – decision factors for international Ug students in the UK, 2014–15
0.0 0.5 1.0 1.5 2.0 2.5 3.0 3.5
Proximity to my home country
Permanent residence
Visa process
Opps to work while studying
University Schloarship/Bursary
Social life
Work opportunities
Cost of study
Opps for further study
Location
Cost of living
Research quality
Personal safety
Earning potential
Specific course of study
Institution reputation
2.19
2.60
2.61
2.86
2.87
3.01
3.01
3.09
3.12
3.13
3.17
3.27
3.31
3.33
3.43
3.46

4746
Having considered the decision factors, what things or people help international undergraduates to reach a decision? Obviously, identifying the specific factors that encourage students to opt for the UK or a particular institution is of critical interest in more effectively focusing international UG student recruitment strategies.
To this end, the ISB survey asks UG students in their first year of study to reflect on what helped them to choose to study where they did. Here, key influencers – individuals, internet-based resources and the media – are essential reference points. Students respond by ticking down a list, enabling outcomes to be reported based on the percentage of students who select specific items of influence. This section reports feedback from 11,351 international undergraduate students in UK universities in the 2014–15 academic year.
Similar to motivations for study, while generic indicators can be identified, the value and the power of the analysis is found in the differences between groups of students. The averages mask the diversity of influences. To inform institutional marketing and student recruitment, it is the country-by-country analysis that presents the more actionable insights. This helps target student recruitment strategies more effectively, either in terms of current approaches that universities might strengthen or in areas where they need to develop new initiatives.
Overall choice
The data demonstrates some important differences in the broad influencers on UG student decision-making discussed earlier in this report. For students from the UK’s leading UG student source country – China – a distinctive pattern of influence is apparent. Here education agents, in tandem with family and friends, play a much more influential role. Similarly, students from Malaysia, Nigeria and India identify agents as key influences. This is a trend that is difficult to discount. For Chinese students, there is greater influence reported for teachers in previous learning institutions than elsewhere. Interestingly, the reported influence of league tables and rankings is inconsistent: strong in Malaysia and India, but weaker in China (and for students from the US). Students from Malaysia were more influenced by educational exhibitions, but Chinese students were far less influenced by institutional websites. This data demonstrates some of the fragmented influences that exercise themselves on international UG decisions to study in the UK, suggesting that targeted strategies are necessary to engage with prospective students in differing regions.
consider the field of study
In considering the decision-making factors identified by students from different disciplines, a broadly consistent pattern emerges. Across virtually all fields of study, four decision-making triggers – institutional reputation, the specific nature of courses, earning potential and personal safety – are most prominent. Similarly, proximity, permanent residence and opportunities to work were rated and ranked lower, as was the case with data analysed by nationality.
Table 26: IsB survey data – decision factors for Ug students in the UK by field of study, 2014–15
Busi
ness
Engi
neer
ing
soci
al st
udie
s
Biol
ogic
al s
cien
ces
mat
h &
com
p sc
i
Law
Join
t hon
s
allie
d m
edic
ine
crea
tive
arts
phys
ical
sci
ence
s
med
icin
e an
d de
ntis
try
lang
, lit
& re
late
d
arch
itect
ure
&
Build
ing
mas
s co
mm
s an
d do
cs
hist
oric
al a
nd p
hil
ling
uist
ics,
cl
assi
csTo
uris
m &
ho
spita
lity
Tech
nolo
gies
vet s
ci, a
gr &
re
late
d
Educ
atio
n
Othe
r lan
gs &
lits
decision making Factors
study area
Institution reputation
3.43 3.47 3.55 3.43 3.46 3.61 3.45 3.46 3.34 3.50 3.58 3.36 3.49 3.41 3.47 3.46 3.33 3.41 3.48 3.41 3.25
Earning potential 3.37 3.40 3.30 3.30 3.37 3.42 3.26 3.40 3.33 3.27 3.23 3.11 3.40 3.38 2.94 3.18 3.41 3.31 3.31 3.19 3.04
Personal safety 3.37 3.33 3.23 3.33 3.23 3.32 3.26 3.43 3.29 3.19 3.39 3.19 3.39 3.36 3.04 3.31 3.46 3.20 3.36 3.46 3.09
Specific course of study
3.34 3.46 3.39 3.44 3.38 3.50 3.45 3.59 3.49 3.38 3.58 3.37 3.54 3.52 3.32 3.36 3.42 3.41 3.47 3.37 3.39
Research quality 3.20 3.32 3.17 3.42 3.30 3.20 3.15 3.35 3.29 3.37 3.26 3.09 3.39 3.40 3.24 3.21 3.37 3.27 3.08 3.33 3.29
Cost of living 3.19 3.20 3.06 3.18 3.20 3.10 3.12 3.34 3.28 3.02 3.17 3.10 3.21 3.25 2.98 2.92 3.48 3.04 3.21 3.12 2.96
Location 3.18 3.06 3.17 3.10 3.02 3.14 3.10 3.13 3.15 3.06 3.13 3.27 3.19 3.26 3.23 3.07 3.09 3.21 3.05 3.15 3.09
Opps for further study
3.16 3.17 3.07 3.21 3.14 3.05 3.01 3.20 3.14 3.17 3.06 2.92 3.24 3.15 2.98 2.97 3.13 3.23 2.68 3.22 2.70
Social life 3.13 3.02 3.07 2.94 2.88 3.00 3.05 2.90 2.98 2.85 2.97 3.11 2.97 3.12 2.90 2.99 3.10 3.04 2.86 2.98 2.85
Cost of study 3.11 3.09 3.00 3.10 3.05 3.09 3.07 3.23 3.19 3.00 3.09 3.02 3.15 3.20 2.92 2.92 3.18 3.09 3.12 3.23 3.06
Work opportunities
3.02 3.04 2.94 3.02 3.11 3.02 2.80 3.23 3.18 2.86 3.18 2.71 3.10 3.09 2.81 2.75 3.15 3.08 2.81 3.24 2.54
Opps to work while studying
3.02 2.88 2.78 2.87 2.95 2.73 2.71 2.90 3.06 2.64 2.35 2.56 3.02 3.16 2.50 2.46 3.38 3.00 2.66 3.04 2.78
University Scholarship/Bursary
2.87 2.92 2.74 2.84 2.94 2.85 2.75 3.11 2.96 2.74 2.78 2.89 2.93 3.05 2.48 2.64 3.02 2.88 2.95 3.17 2.94
Visa process 2.72 2.75 2.46 2.49 2.54 2.71 2.51 2.77 2.53 2.46 2.68 2.28 2.69 2.72 2.21 2.59 2.28 2.68 2.78 2.30 2.64
Permanent residence
2.65 2.58 2.49 2.61 2.73 2.60 2.44 2.74 2.75 2.42 2.61 2.55 2.63 2.67 2.51 2.52 2.63 2.70 2.36 2.86 2.24
Proximity to my home country
2.36 2.21 2.15 2.18 2.16 2.14 2.05 2.48 2.13 1.99 2.09 2.03 2.23 2.23 1.89 2.26 2.17 2.05 2.02 2.47 2.00
8. WhaT hElps INTErNaTIONal UNdErgradUaTE sTUdENTs TO chOOsE?

4948
In terms of triggers for choice, it is also interesting to consider what variations emerge among international UG student nationalities. For instance, more insights can be derived by considering how students rank these influences. As table 28 illustrates, key influences vary for international students from non-EU countries. Although the role of families (and to a lesser extent, friends) are consistent as common influences, there are differential influences from agents, institutional websites and league tables, depending on nationality.
Table 28: IsB survey data – key influences on Ug choice: nationality by perceived significance (ranked), 2014–15
Key Influencers
UK 2014 china malaysia Usa Nigeria Indiahong Kong
singapore Brazil Canada pakistan russia Norwaysouth Korea
Japan
The institution website 1 6 5 1 3 2 5 3 1 3 3 1 1 3 1
Family 2 2 1 3 1 4 1 4 10 1 1 3 4 4 2
Friends 3 3 4 2 5 5 4 2 4 2 2 6 3 4 2
League tables or rankings
4 5 2 8 4 3 2 1 2 4 5 1 6 1 5
Education Agent 5 1 3 13 2 1 3 8 13 7 4 7 2 6 4
Prospectus from this institution
6 11 6 4 6 6 8 5 5 6 7 8 7 8 5
A visit to the institution 7 9 14 7 7 11 9 11 19 9 10 5 5 11 7
Current students at this institution
8 7 8 6 8 7 7 6 8 5 9 9 8 9 12
Teacher/tutor where you studied previously
9 4 7 5 11 11 6 9 12 13 12 4 13 2 8
Alumni of this institution
10 8 9 9 10 9 10 7 10 8 6 13 11 7 9
Social networking site 11 12 12 11 12 10 13 12 3 11 11 12 13 11 13
Careers advisor where you studied previously
12 10 10 9 9 8 12 10 17 11 8 10 10 10 10
Staff of this institution 13 14 16 12 14 14 14 17 14 10 14 14 13 13 10
Independent website 14 16 15 14 15 15 15 18 7 14 13 11 9 13 15
Education exhibition/fair
15 17 11 16 13 13 11 15 16 15 16 15 11 15 14
Other media or press 16 15 18 15 16 17 16 19 15 16 15 15 17 16 16
Home government advisory service
17 13 13 17 18 19 20 14 6 18 20 18 16 20 17
Host government advisory (eg British Council)
18 20 17 17 20 16 17 15 8 18 16 17 18 18 17
An advert for this institution (TV, radio, poster)
19 18 20 19 16 18 17 20 17 18 16 19 18 16 19
Your employer 20 19 19 20 18 19 19 13 19 17 16 20 18 19 19
Table 27: IsB survey data – key influences on international Ug choice: mean scores by nationality, 2014–15
Key Influencers 10938 1121 550 429 358 305 293 259 231 147 132 123 119 109 102
decision making Factors
UK 2014 china malaysia Usa Nigeria Indiahong Kong
singapore Brazil Canada pakistan russia Norwaysouth Korea
Japan
Education Agent 26% 46% 38% 12% 37% 51% 40% 18% 7% 19% 31% 23% 38% 21% 27%
Alumni of this institution
14% 15% 17% 13% 12% 15% 11% 27% 12% 17% 21% 12% 10% 18% 15%
Careers advisor where you studied previously
13% 10% 14% 13% 13% 16% 10% 14% 2% 12% 19% 15% 10% 13% 11%
Current students at this institution
19% 17% 17% 20% 15% 16% 14% 32% 12% 25% 18% 18% 12% 15% 10%
Your employer 2% 3% 3% 1% 2% 1% 2% 9% 2% 1% 1% 0% 1% 2% 0%
Education exhibition/fair
5% 5% 13% 4% 7% 9% 11% 8% 3% 3% 1% 7% 10% 5% 7%
Family 35% 34% 44% 37% 42% 38% 44% 37% 12% 44% 43% 37% 31% 27% 29%
Friends 34% 32% 37% 38% 26% 28% 32% 43% 27% 44% 37% 26% 34% 27% 29%
Home government advisory service
4% 7% 8% 2% 2% 1% 0% 8% 19% 1% 0% 2% 6% 0% 1%
Host government advisory (eg British Council)
3% 3% 4% 2% 1% 3% 2% 8% 12% 1% 1% 3% 1% 3% 1%
Independent website 7% 5% 7% 7% 5% 8% 4% 5% 13% 4% 9% 13% 11% 7% 6%
An advert for this institution (TV, radio, poster)
2% 4% 2% 1% 3% 2% 2% 2% 2% 1% 1% 2% 1% 5% 0%
Staff of this institution 8% 7% 6% 12% 5% 9% 6% 7% 6% 13% 7% 9% 9% 7% 11%
A visit to the institution 19% 11% 8% 19% 16% 12% 12% 11% 2% 15% 16% 32% 22% 10% 25%
The institution website 38% 19% 26% 43% 33% 40% 22% 40% 61% 40% 33% 47% 43% 33% 36%
League tables or rankings
33% 24% 42% 18% 29% 39% 43% 45% 31% 26% 30% 47% 18% 40% 26%
Other media or press 4% 6% 3% 5% 3% 3% 4% 4% 5% 2% 5% 7% 4% 5% 3%
Prospectus from this institution
24% 10% 24% 23% 25% 28% 14% 36% 20% 24% 20% 21% 15% 16% 26%
Social networking site 13% 9% 11% 13% 10% 14% 8% 9% 27% 12% 12% 12% 9% 10% 8%
Teacher/tutor where you studied previously
18% 27% 18% 23% 11% 12% 16% 15% 8% 9% 9% 35% 9% 34% 21%

5150
9. hOW dOEs UK INTErNaTIONal UNdErgradUaTE sTUdENT chOIcE dIFFEr FrOm rIval marKETs?
Key influences cited in major competitors
How the key influences identified by UK-based international UG students compare to those in key competitor nations can also provide further insights. As table 30 (below) demonstrates, agents play a far more significant influencing role when students have chosen to study in Australia and New Zealand. It is also notable that US-based UG students report higher levels of agent influence than seen in the UK.
Evidently, students coming to the UK are less likely to use agents. However there is a possible counterpoint. Perhaps agents are less likely to guide students to study in the UK? Data from the latest Agent Barometer31 would seem to suggest this.
Figure 9: agent Barometer survey data – best destination for undergraduate study 2015
country rank 2015 rank 2014 rank 2013 rank 2012 rank 2011 rank 2010
USA 1 1 2 1 1 1
Canada 2 3 4 4 4 3
Australia 3 2 1 2 3 4
UK 4 3 3 2 2 2
USA 34%
United Canada 18%Australia 18%
UK 17%
Other 13%
Given the UK’s demonstrated strengths in undergraduate provision and the mismatch in agent perceptions, there is a need for the UK’s universities, sector bodies and government agencies to engage in a more structured way with these key advisors, in order to convey the positives of UK undergraduate education.
This (table 31) data also demonstrates the consistency of the influences identified by students in the UK and across competitor nations. Universally, the role of family and friends as a key source of influence is clear.
University websites also play a critical function, with the data suggesting that institutional websites in the UK and North America are leading the way.
League tables and rankings clearly are of greater influence for students choosing the UK for undergraduate study (33%) than for the US (25%). It is interesting to note their limited influence in Canada and Australia, falling to just six in a hundred and one in a hundred for New Zealand and Germany respectively.
Current students play a role in driving choice, and on this influence the UK is competitive with Canada and ahead of other rival countries.
UK universities derive more value from recommendations of former teachers than competitors, but with the exception of Australia the gap is small between rivals.
Alumni are ‘the university at large’ and should be a greater influence on prospective students than they are. Universities across all competitor countries are now advancing alumni engagement strategies – in most cases going beyond traditional (some would say cynical) fundraising, towards a lifelong relationship32.
31 ICEF i-graduate Agent Barometer 2015
32 Gretchen Dobson 2015 “Staying Global: how international alumni relations advances the agenda”. http://www.gretchendobson.com/
To more effectively understand the nature of international UG student choice, it is useful to look at the other countries that students considered. Similarly, it is also illuminating to compare decision-making data collected by the ISB in potential alternatives to the UK.
Major competitors for student choice
So firstly, who are the UK’s major rivals for international UG students who ended up studying in the UK? A question in the ISB specifically asks UG students whether they considered any other countries before choosing to study in the UK. Around a fifth of students indicated that the UK was the only choice they considered. However, for students from the key market of China, this rate was only 9% and for Malaysia it was 16%.
The primary alternative country considered for study by the UK’s international undergraduate students is the US. In fact, virtually all non-EU nationalities that responded – aside from students originating from Malaysia, who selected Australia – identified the US as the primary alternative option they had considered. This potential preference was most strongly expressed among Chinese students, where 65% said they had considered the US prior to opting to study in the UK.
In terms of second preferences beyond the US, Australia and Canada feature strongly. It is apparent that Canada is seen as a viable alternative study destination for international UG students, being a possible option for a significant number of Chinese and Nigerian students. However, Australia remained the overwhelming second choice for students from Malaysia.
Table 29: IsB survey data – countries considered by Ug students before choosing the UK, 2014–15
UK 2014
china malaysia Us Nigeria Indiahong Kong
singapore Brazil Canada pakistan russia Norwaysouth Korea
US 44% 65% 41% 55% 56% 44% 50% 48% 30% 51% 51% 37% 57% 54%
Canada 19% 20% 11% 13% 31% 23% 21% 12% 42% 44% 34% 10% 13% 26%
Australia 24% 24% 51% 28% 7% 24% 42% 44% 46% 30% 38% 17% 31% 15% 26%
Germany 16% 12% 7% 11% 7% 11% 7% 6% 30% 5% 17% 23% 9% 16% 6%
NZ 6% 5% 13% 11% 1% 4% 5% 7% 14% 5% 3% 3% 4% 6% 9%
No other countries 19% 9% 16% 22% 21% 19% 11% 15% 9% 21% 19% 18% 25% 14% 14%
The data on where international UG students were located prior to their programme of study shows that a larger number of students in Australia, Canada and New Zealand were in-country prior to undertaking study than was the case for the UK or the US. This would suggest that a more significant flow-through of students from both pre-university preparation programmes and secondary education levels is occurring in these countries.
Table 30: IsB survey data – location before commencing programme of study in the UK, 2014–15
destination country This country my home country another country
Australia 32% 62% 6%
Canada 32% 58% 9%
New Zealand 39% 57% 4%
UK 24% 67% 9%
US 16% 77% 7%

5352
10. aNalysIs aNd syNThEsIs
Where does the UK’s comparative advantage lie?
The UK has steadily boosted its numbers of international UG students since 2007, increasing them by 46% in absolute terms during this period. Although competition has intensified, the UK has more than maintained its comparative share among direct competitors of this growing market (16.6% 2007-08, 17.1% 2013-14). This confirms that UK universities have performed well in attracting UG students.
Having persuaded international graduates to come to the UK, we know from this report that UK universities deliver on their promise of a great student experience for the vast majority of undergraduates (91% satisfied). We also know that the claim of a world-class student experience is justified, as the UK excels in all the primary comparative measures, with 9 in 10 students satisfied with the expertise of their lecturers and the quality of learning support and assessment. The data shows that the arrival experience has improved and that support services are more than hitting the mark.
International UG students also continue to consider the UK to be a safe, welcoming and well-resourced destination to study. Campus environments – from learning facilities to student advice services, technological support to sports and student societies – are similarly well-regarded. In addition, the data suggests that the broad conditions for study in the UK – the quality of social infrastructure and multicultural environment – continue to make it a highly competitive option for international UG student choice.
Even on the critical factors that cause some anxiety for UK-based students – most notably around cost of living and employability – the UK is still holding its own against major competitors.
So the UK’s comparative advantage is clearly established in the quality of learning that universities offer, as well as in the broader student experience, making the UK a leading world-class destination for undergraduate level study.
Despite all these positives, it is important to note a significant fall in the perceived attractiveness of the UK as a study destination among education advisors around the world. Noting the significance of the part played by agents and advisors in student decision-making, it would appear that the UK has more to gain, if more in this key group of influencers can be swayed.33 More competitive policies around student visas and work rights would have an immediate impact on the attractiveness of the UK to professional advisors. And with or without any policy change, there should be more proactive and coordinated engagement with these gatekeepers for international education.
In recent years North American universities have successfully deployed aggressive strategies to attract prospective students. In the case of the US, this means leveraging its pre-eminent higher education reputation, while Canada has been able to make a strong offer to undergraduates. Declining incomes are encouraging universities in the US to more actively recruit international students. Given the scale of the US market, its powerful attraction to students as a preferred destination and the fact it currently represents the least internationalised system across major competitor nations, the stirring of this sleeping giant represents a real threat in coming years.
Other key competitors – most notably Australia and New Zealand – have been adversely affected by currency fluctuations and concerns of student security. However, recent policy changes in Australia (most notably around visas) and the offer of migration for students studying in New Zealand have driven marked increases in perceptions of attractiveness and improved UG students numbers. Moreover, the growth of transnational education centred on in-country delivery of programmes, as well as the transforming potential of online platforms, make it difficult to anticipate the precise nature of the looming international UG market that the UK will confront in coming years.
33 See also: Iona Yuelu Huang, Vincenzo Raimo & Christine Humfrey (2014): Power and control: managing agents for international student recruitment in higher education, Studies in Higher Education
Table 31: IsB survey data – key influences on international Ug students’ decisions: competitor comparisons, 2013–14
UK australia Canada nZ Us germany
2014 2014 2014 2013 2014 2014
Education Agent 26% 53% 29% 46% 32% 11%
Alumni of this institution 14% 11% 18% 11% 14% 13%
Careers advisor where you studied previously 13% 13% 14% 13% 12% 3%
Current students at this institution 19% 16% 21% 16% 17% 16%
Your employer 2% 2% 2% 2% 3% 2%
Education exhibition/fair 5% 5% 6% 6% 3% 0%
Family 35% 32% 43% 30% 38% 29%
Friends 34% 29% 43% 34% 36% 40%
Home government advisory service 4% 5% 3% 5% 7% 4%
Host government advisory service 3% 0% 1% 13% 3% 5%
Independent website 7% 5% 5% 4% 7% 5%
Press advertisement for this institution 2% 1% 5% 1% 1% 0%
Staff of this institution 8% 9% 6% 8% 8% 3%
A visit to the institution 19% 12% 15% 16% 11% 8%
The institution website 38% 27% 36% 27% 32% 25%
League tables or rankings 33% 14% 16% 6% 25% 1%
Other media or press 4% 0% 5% 2% 6% 7%
Prospectus from this institution 24% 4% 8% 3% 5% 4%
Social networking site 13% 9% 13% 6% 9% 12%
Teacher/tutor where you studied previously 18% 7% 17% 11% 15% 14%
Before leaving this important table, it is worth noting the things that are not a great influence on undergraduate student decision-making. Top of the bottom of the list are press advertisements. Close to it are other media and independent websites. For all the media calls on university budgets, this is worth noting. It is also worth noting because it suggests an almost open field for whoever creates a compelling and genuinely helpful web resource for prospective international undergraduates.
The Education UK website and the British Council, included most recently in 2013, were cited by 11% and 5% of undergraduates.
Finally, fairs and exhibitions. For decades the exhibitions trail has been etched indelibly into the calendars, budgets and world maps of international offices. The effectiveness of these events differs of course between source countries and within them, but the reality of the UK average – just 5% of students saying they were an influence – tells a story.
The richness of the data on decision-making, at institutional and at national level, should be used to inform better allocation of marketing and advertising budgets.

5554
So promotional initiatives should be proceeded – and preceded – with caution. At the very least, they should be localised. Preferably, they should target students by profile36. Ideally, they should be personal.
Having said this, it is important to acknowledge that the UK has gone from good to GREAT in recent years, benefitting from significant investment in a global brand campaign. What matters most is for such campaigns to provide a platform for universities rather than an umbrella. With support, universities can achieve more with a more personal approach, informed by those students who have ‘bought’ already, who are vested in UK HE. Promotional strategies should be informed by their decisions, their motivations, expectations and what matters most to them. Current students and alumni should inform promotional strategies and they should feature in them. Almost all universities already provide profiles of students and successful graduates, but mostly as isolated case studies. More can be done to provide profiles, endorsements, reflections and advice from relevant students and graduates – relevant to the individual applicant.
Prospective students increasingly expect to be able to access clear and engaging insights about the potential learning experience that an institution, a campus, a department and a specific course can offer. This demands that the UK’s primary competitive advantage – educational quality – be increasingly foregrounded in more sophisticated forms of web presence and social media networks, which give genuine depth to the UK UG offer.
The decision-making data presented in this report demonstrates that prospective international UG students are basing their choices to study in the UK on factors of institutional quality, specific course offerings and institutional research output. These critical institutional dimensions can be further highlighted by intuitively designed, outwardly-focused institutional and discipline-centred web services that target the specific study considerations for UG students.
The data indicates the influence of education agents as growing in significance, most notably for students from China and India. The perceived deterioration in the UK’s condition (as viewed by agents) suggests promotional efforts should be directed at this group – as individuals – to increase positive perceptions of the quality and reputation of UK higher education.
Beyond formal pathways, not enough is known of the routes to UK study that are taken by international undergraduates. Good research has been conducted into transnational provision as a feeder for UK HE37. But how important for example are international schools, private schools or state schools, and in which countries? A large-scale study would enable these global ‘routes to learning’ to be charted.
Finally, universities should increasingly hard-wire the connections between recruitment, student experience and graduate outcomes. Historically, departments of admissions, student services and alumni have operated independently. Having persuaded a student to travel halfway around the world for the best years of his or her life, universities must then deliver on their promise, or understand where they have fallen short. Graduates, their careers and their life stories complete the picture.
ENDS
November 2015
36 “Learning tribes and the new youth market”: i-graduate 2008. http://www.universityworldnews.com/article.php?story=20080327105946510
37 Most notably Janet Ilyeva: “Transnational pathways to higher education in England”. HEFCE 2015. http://www.hefce.ac.uk/pubs/year/2015/201508/
What policy changes might impact most positively on Ug recruitment?
The UK undergraduate education is good value, with higher satisfaction and lower total costs than the UK’s key rivals, but perceptions and up-front costs matter. A range of coordinated policy responses could be considered to improve the affordability of the UK as a study destination. One option would be greater access to ongoing sources of funding, such as scholarships or bursaries.
Given declining satisfaction levels about the ability of UK-based international students to earn an income during their study, policy attention could be directed to the capacity of international students to access employment during and after study in the UK. Although this is clearly a difficult matter, any increase in the ability of international UG students to gain professional experience – and to offset any more of their costs through employment – would tilt the playing field towards the UK.
Visas, visa advice and visa processing are a significant challenge. In terms of support and advice from UK universities, satisfaction levels are high and until now have been holding up – so say the students who have made it through the process. The reality in 2015 is that the UK’s rivals are benefitting significantly34, to the detriment of UK universities. There is no doubt that the sector and the economy are being negatively impacted by the UK’s current visa processes.
As noted earlier in this report, several countries (most notably Australia) have moved to introduce streamlined forms of visa processing, including introducing new low-risk categories. These developments will generate further competitive pressure on the UK if not responded to in some form.
Similarly, the UK’s competitors have improved opportunities for graduates to obtain work visas post-study, in order to make study more attractive for international students. This reflects the legitimate desire of many graduates to either gain valuable work experience in their host country or to contribute more determinedly over time to its economic potential.
Inevitably, this growing differential in post-study opportunities must put UK universities at a competitive disadvantage in attempting to recruit the most talented of the international student pool. These are the students with the most global options to choose from. Therefore, the implications of changes to visa arrangements should be reviewed in order to understand the likely increasing impact on recruitment of international undergraduates to the UK.
It is also apparent from data presented in this report that other competitor nations (with the exception of the US) are benefiting from a greater flow-through of students who are applying in-country as international UG students. Many of these students would be participating in post-secondary pre-university preparation programmes, frequently offered by associated university entities or private training organisations with university agreements. Quite often, these programmes have a strong English language component in order to allow students to meet mandatory IELTS requirements. Given the success that these programmes have had in providing a gateway to subsequent UG study for international students, the importance of pathway and foundation programmes to UK higher education and the economy should be acknowledged and encouraged, in turn to encourage greater international UG student enrolments.
Finally, this report has demonstrated the increasingly fluid nature of the international student market. Consideration needs to be given to initiating a formal process for the collection and collation of empirical evidence of graduate outcomes and career trajectories for key nationalities. This should provide substantive evidence of the value of a UK degree and the return on investment – not just in financial terms – in the careers and lives of those who graduate from UK universities.
What types of promotional initiatives would increase applications?
Strategies for promoting the UK’s offer to prospective undergraduates should be influenced by trends in the decisions of current students – what matters most and what helps them to choose.
In today’s individualised world, mass market campaigns are of limited value. While it is tempting, with millions of students moving thousands of miles, to talk big numbers, the ‘buyer’ of international education has never been more distinctively individual. In a time when the consumer buying a toothbrush expects the retailer to know his name and preferred brand35, a prospective student making one of the biggest discretionary purchase decisions of her lifetime will expect you to know not just her name but her profile and her preferences.
34 Open Doors 2015 reports annual growth in India UG student numbers in the US of 39.3% in the academic year 2014/15.
35 Edwina Dunn, Clive Humby: “The couple who helped transform the way we shop”. http://www.bbc.co.uk/news/business-30095454

5756
appendix B: UK Non-EU Ug student population by domicile, 2013-14 vs 2007-08
rank Ug by domicile 2007-08 2013-14 Change % change
1 China 20,807 39,353 18,546 89%
2 Hong Kong 7,287 12,933 5,646 77%
3 Malaysia 8,009 12,487 4,478 56%
4 United States 5,795 6,933 1,138 20%
5 India 5,754 6,865 1,111 19%
6 Nigeria 4,546 6,860 2,314 51%
7 Singapore 2,055 5,532 3,477 169%
8 Norway 1,981 4,082 2,101 106%
9 Saudi Arabia 1,539 3,923 2,384 155%
10 Canada 1,776 3,046 1,270 72%
11 Pakistan 3,269 3,039 - 230 -7%
12 Korea (South) 2,148 2,874 726 34%
13 Bangladesh 1,371 2,482 1,111 81%
14 Russia 1,461 2,352 891 61%
15 Vietnam 1,041 2,266 1,225 118%
16 United Arab Emirates 1,304 1,894 590 45%
17 Switzerland 1,027 1,850 823 80%
18 Thailand 909 1,628 719 79%
19 Sri Lanka 1,843 1,582 - 261 -14%
20 Brunei 1,197 1,526 329 27%
Other 26,570 28,850 2,280 9%
Total 104,445 152,355 47,910 46%
Source: HESA
appendix a: UK Non-EU Ug student population by field of study, 2013-14 vs 2007-08
Ug Non-EU by field of study 2007-08 2013-14 Change % change
(D) Business & administrative studies 26,580 47,521 20,941 79%
(9) Engineering & technology 14,495 21,029 6,533 45%
(B) Social studies 8,201 13,029 4,828 59%
(C) Law 5,806 9,697 3,892 67%
(H) Creative arts & design 6,254 9,146 2,892 46%
(F) Languages 6,750 8,584 1,834 27%
(2) Subjects allied to medicine 6,507 7,259 753 12%
(3) Biological sciences 3,706 6,189 2,483 67%
(8) Computer science 4,692 4,941 249 5%
(7) Mathematical sciences 2,734 4,290 1,556 57%
(A) Architecture, building & planning 2,437 4,088 1,651 68%
(1) Medicine & dentistry 3,057 3,744 687 22%
(6) Physical sciences 2,097 3,510 1,412 67%
(E) Mass communications & documentation 1,631 2,894 1,263 77%
(G) Historical & philosophical studies 1,754 2,184 430 25%
(J) Combined 2,630 1,931 -699 -27%
(I) Education 1,467 899 -568 -39%
(4) Veterinary science 397 847 450 113%
(5) Agriculture & related subjects 494 575 81 16%
Total 104,445 152,355 47,910 46%
Source: HESA

5958
Funding of Studies: Employment while studying
0%
5%
10%
15%
20%
25%
Employment while studying
Australia
Canada
UK
Germany
NZ
USA
Source: ISB Data
appendix E: Education agents. Trends in overall attractiveness of study destinations
0% 20% 40% 60% 80% 100%
USA '15USA '14USA '13USA '12USA '11USA '10
Australia '15Australia '14Australia '13Australia '12Australia '11Australia '10
Canada '15Canada '14Canada '13Canada '12Canada '11Canada '10
UK '15UK '14UK '13UK '12UK '11UK '10
New Zealand '15New Zealand '14New Zealand '13New Zealand '12New Zealand '11New Zealand '10
Unattractive Very UnattractiveVery Attractive Attractive
Source: ICEF i-graduate Agent Barometer 2010-2015
Appendix C: % International UG students by domicile and field of study
Other
Mathematical sciences
Computer science
Biological sciences
Subjects allied to medicine
Languages
Creative arts & design
Law
Social studies
Engineering & technology
Business & administrative studies
Other
Mathematical sciences
Computer science
Biological sciences
Subjects allied to medicine
Languages
Creative arts & design
Law
Social studies
Engineering & technology
Business & administrative studies
Source: HESA
appendix d: Ug International students: Funding of studies by country of study
Ug Funding of studies
0%
20%
40%
60%
80%
100%
Employment while studying
Scholarship/bursary
SavingsLoanGovernment/State funding
Family
Australia
Canada
UK
Germany
NZ
USA
Source: ISB Data

december 2015
© Unauthorised copying of this document is not permitted. If you wish to copy this document please contact the UK HE International Unit for approval. While every effort has been made to ensure the accuracy and completeness of the material in this Annual Report, the authors and the UK Higher Education International Unit give no warranty in that regard and accept no liability for any loss of damage incurred through the use of, or reliance upon, this report or the information contained herein.
ISBN number: 978-1-84036-354-8
The UK hE International UnitWoburn House 20 Tavistock Square London WC1H 9HQ
+44(0)20 7419 5421
www.international.ac.uk
@internationalUt