international union of geodesy and geophysics …lipi.go.id [email protected] secretary : eddy...
TRANSCRIPT

International Union of Geodesy and Geophysics Indonesian National Committee
Country Report
IUGG General Assembly Melbourne, Australia June 28 – July 7, 2011

Indonesia Country Report IUGG General Assembly
Melbourne, Australia June 28 – July 7, 2011
2
Introduction
Asep Karsidi, President of the Indonesian National Committe for IUGG The Country Report for the IUGG General Assembly XXV at Melbourne, Australia prepared by the Indonesian National Committee for IUGG consists of reports for the associations: IAG, IAGA, IAHS, IAMAS, IASPEI and IAVCEI.
1. Country Report for IAG consists of two parts:
A. Geodetic Activities in the National Coordinating Agency for Surveys and Mapping (BAKOSURTANAL)
� Real Time Coastal Sea Level Network Supporting Indonesian Tsunami Early Warning System
� Present Status of Indonesian Sea Level Monitoring Network � The Airborne Gravity Survey for Regional Geoid Mapping
B. 2. Research Activities conducted by the Institute of Technology in
Bandung, they are about: � Studying Land Subsidence In Semarang (Indonesia) Using Geodetic
Methods � Land Subsidence And Urban Development In Jakarta (Indonesia) � Land Subsidence Characteristics Of Jakarta Between 1997 And 2005,
As Estimated Using GPS Surveys � Land Subsidence Characteristics Of The Bandung Basin, Indonesia,
As Estimated From GPS And Insar � Crustal Deformation Studies In Java (Indonesia) Using GPS � The Applications Of GPS Cors In Indonesia: Status, Prospect And
Limitation � Land Subsidence Characteristics Of The Jakarta Basin (Indonesia) and
Its Relation With Groundwater Extraction And Sea Level Rise
2. Country Report for IASPEI presents � Development of New Seismic Hazard Maps of the Indonesian
Region
3. Country Report for IAVCEI describes � Volcanic Activity In Indonesia During Period of 2008-2011
Indonesia Country Report IUGG General Assembly
Melbourne, Australia June 28 – July 7, 2011
3
4. Country Report for IAHS presents � Research and development of space weather model and
observation method in Indonesia during 2008-2010
5. Country Report for IAHS presents � Impact of Climate Change on Water Resources In Java Island � Groundwater management issues in the Greater Jakarta area,
Indonesia

Indonesia Country Report IUGG General Assembly
Melbourne, Australia June 28 – July 7, 2011
4
THE INDONESIAN NATIONAL COMMITTEE FOR IUGG (INC-IUGG) Adhering Organization: Indonesian Institute of Sciences (LIPI) Jl. Jend. Gatot Subroto No. 10 Jakarta 12710, Indonesia
President Asep Karsidi Head of National Coordinating
Agency for Surveys and Mapping (BAKOSURTANAL), Jl. Raya Jakarta-Bogor km.46 Phone : (+62 21) 8752062 Fax. : (+62 21) 8752064 E-mail: [email protected]
Vice President
Iskandar Zulkarnain
Deputy Chairman for Earth Sciences. Indonesian Institute of Sciences Jl. Jend. Gatot Subroto No. 10 Jakarta 12710, Indonesia Phone : (+62 21) 5225711 Fax. : (+62 21) 5207226 E-mail: [email protected] [email protected]
Secretary : Eddy Priyanto Head of Center for Geodesy and Geodynamics, National Coordinating Agency for Surveys and Mapping (BAKOSURTANAL), Jl. Raya Jakarta-Bogor km.46 Phone : (+62 21) 8757329 Fax. : (+62 21) 8757329 E-mail : [email protected]
NATIONAL CORRESPONDENTS OF ASSOCIATIONS
IAG Hasanuddin Z.
Abidin Dept. of Geodetic Engineering, Institute of Technology of Bandung,
Indonesia Country Report IUGG General Assembly
Melbourne, Australia June 28 – July 7, 2011
5
Jl. Ganesa 10, Bandung 40132 Indonesia Phone : (+62 22) 2534286 Fax : (+62 22) 2534286 E-mail: [email protected]
IASPEI Sri Widiyantoro
Dept. of Geophysics and Meteorology Institute of Technology of Bandung, Jl. Ganesa 10, Bandung 40132 Indonesia Phone : (+62 22) 2500494 Fax : (+62 22) 2534139 E-mail: [email protected]
IAVCEI Surono
Center for Vulcanology and Geological Hazard Mitigation, Geological Agency, Dept. of Energy and Mineral Resources Jl. Diponegoro Bandung12810, Indonesia Phone : (+62 22) 7272606 Fax : (+62 22) 7272606 E-mail : [email protected]
IAGA Buldan Muslim
Dr. Buldan Muslim National Institute of Aeronautic and Space (LAPAN), The Space Science Center Jl. Dr. Djundjunan 133 Bandung 40173, Indonesia Phone : +62 22 6014998 Fax : +62 22 6014998 E-mail : [email protected]
IAMAS Prih Haryadi Meteorological Climatological and Geophysical Agency (BKMG) Jl. Angkasa I No. 2, Kemayoran Jakarta 10620, Indonesia Phone : (+62 21) 6540158 Fax : (+62 21) 6540158 E-mail : [email protected]
Indonesia Country Report IUGG General Assembly
Melbourne, Australia June 28 – July 7, 2011
6
IAHS Arie Setiadi Moerwanto
Research Institute for Water Resources Jl. Juanda No. 193, PO Box 51 Bandung 40135, Indonesia Phone : (+62 22) 2501533, or (+62 22) 2501544 Fax : (+62 22) 2500163 Email : [email protected]
IAPSO Safwan Hadi Dept. of Geophysics and Meteorology Institute of Technology of Bandung Jl. Ganesa 10, Bandung 40132 Indonesia Phone : (+62 22) 2500494 Fax : (+62 22) 2534139 E-mail: [email protected]
Indonesia Country Report IUGG General Assembly
Melbourne, Australia June 28 – July 7, 2011
7
Activities Report for IAG
Geodetic Activities in the National Coordinating Agency for Surveys and Mapping (BAKOSURTANAL)
Khafid
National Coordinating Agency for Surveys and Mapping (BAKOSURTANAL), Jl. Raya Jakarta-Bogor Km 46 Cibinong INDONESIA.
Email: [email protected]
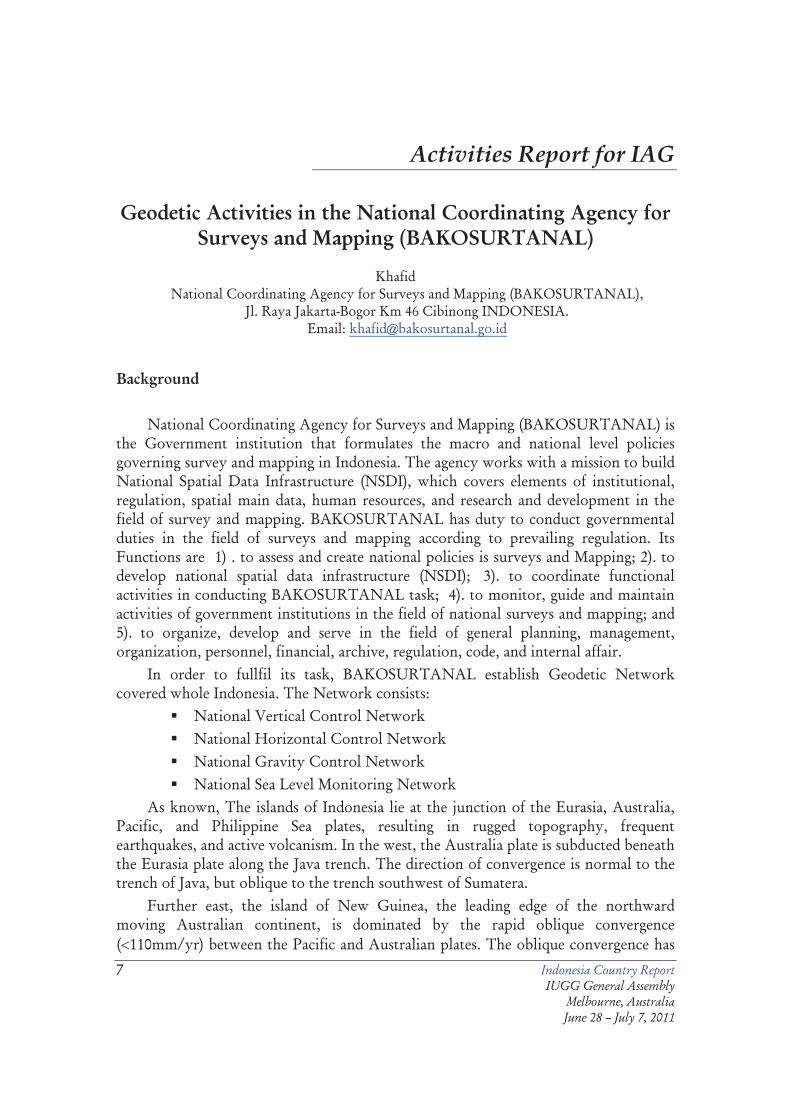
Background National Coordinating Agency for Surveys and Mapping (BAKOSURTANAL) is
the Government institution that formulates the macro and national level policies governing survey and mapping in Indonesia. The agency works with a mission to build National Spatial Data Infrastructure (NSDI), which covers elements of institutional, regulation, spatial main data, human resources, and research and development in the field of survey and mapping. BAKOSURTANAL has duty to conduct governmental duties in the field of surveys and mapping according to prevailing regulation. Its Functions are 1) . to assess and create national policies is surveys and Mapping; 2). to develop national spatial data infrastructure (NSDI); 3). to coordinate functional activities in conducting BAKOSURTANAL task; 4). to monitor, guide and maintain activities of government institutions in the field of national surveys and mapping; and 5). to organize, develop and serve in the field of general planning, management, organization, personnel, financial, archive, regulation, code, and internal affair.
In order to fullfil its task, BAKOSURTANAL establish Geodetic Network covered whole Indonesia. The Network consists:
� National Vertical Control Network � National Horizontal Control Network � National Gravity Control Network � National Sea Level Monitoring Network
As known, The islands of Indonesia lie at the junction of the Eurasia, Australia, Pacific, and Philippine Sea plates, resulting in rugged topography, frequent earthquakes, and active volcanism. In the west, the Australia plate is subducted beneath the Eurasia plate along the Java trench. The direction of convergence is normal to the trench of Java, but oblique to the trench southwest of Sumatera.
Further east, the island of New Guinea, the leading edge of the northward moving Australian continent, is dominated by the rapid oblique convergence (�110mm/yr) between the Pacific and Australian plates. The oblique convergence has

Indonesia Country Report IUGG General Assembly
Melbourne, Australia June 28 – July 7, 2011
8
produced a complex array of microplates whose motions result in rapid shear, arc-continent collision, oceanic and continental subduction, continental rifting, and seafloor spreading. In West Papua a large section of the continent (the Bird’s Head) is being detached along a rapid (80mm/yr) shear zone and subducted at Seram trough.
The complexity of tectonic processes in Indonesia was recognized by geologists long before the widespread acceptance of the theory of plate tectonic and has resulted in numerous geologic and geophysical studies in the region.
Geodetic data with the level of precision available using Global Positioning System (GPS) give us the opportunity to address many outstanding issues by providing two important number of information. First, geodetic data enable us to directly estimate recent rates of plate motion. Second, geodetic data can provide an estimate of the regional horizontal surface velocity field that may be used in constructing and maintaining geodetic datum that take account of Earth deformation.
We have conducted GPS studies throughout Indonesia and South and Southeast Asia for the last ten years. For the first time, we integrate the information from these GPS data to gain a more complete picture of tectonic block interactions in the Indonesia region. And then incorporate velocity solutions from each of tectonic block into velocity model by repeated GPS surveys. The reference frame used in the analysis of the entire Indonesia GPS data set is the 2000 International Terrestrial Reference Frame (ITRF2000) computed by the International Earth Rotation Service (IERS). The Current Status of Indonesian permanent GNSS stations network The objectives of main Maintenance of permanent GNSS stations network are as follows:
� To maintain national geodetic reference frame in active seismic zones for survey and mapping purposes,
� Mitigation, Crustal deformation monitoring for geological hazard mitigation � Sea level change monitoring with continuous GPS and Tide Gauge stations
collocation, GPS Meteorology to determine PW in the troposphere and TEC in the ionosphere,
� GPS for safety navigation. � Permanent GPS station is part of the Ina-TEWS (Indonesian Tsunami Early
Warning System) � Maintenance of a national geodetic reference frame, which refers to the global
geodetic reference frame (ITRF). � Service instantaneous correction careful positioning with GPS (references in
real-time positioning (DGPS / RTK)) for the purposes of surveying and mapping, navigation and transportation.
� Study geodynamics in Indonesian territory. � Mitigation of earthquake disasters

Indonesia Country Report IUGG General Assembly
Melbourne, Australia June 28 – July 7, 2011
9
� Spatial Planning
Figure 1. Distribution of Continous GPS-Stations in Java
At this moment BAKOSURTANAL maintaines 100 continous GPS distributed in whole Indonesia, as listed in table 1. Figure 1 shows the location of c-GPS stations in Java island. Tabel. 1 Locations of 100 c-GPS Stations maintained by BAKOSURTANAL
NO Code Location Latitude Longitude
1 CKUR PULAU SUKUN NTT -8.121 122.110
2 CTOA KALATOA NTT -7.406 121.767
3 CBON BONERATE SULSEL -7.382 121.078
4 CDAI TANJUNG BUNGA NTT -8.068 122.867
5 CPBR PULAU PEMANA NTT -8.348 122.318
6 CLBR LEMBAR MATARAM -8.728 116.076
7 CPBI KLUNGKUNG BALI -8.543 115.471
8 CDNP DENPASAR BALI -8.818 115.146
9 CSRJ SINGARAJA BALI -8.149 115.058
10 CCAK PERANCAK BALI -8.393 114.628
11 CBRN BALURAN JATIM -7.838 114.440
12 CMCR MUNCAR JATIM -8.451 114.389
13 CPMK PAMENGPEUK JABAR -7.655 107.691
14 CLBG LEMBANG JABAR -6.824 107.616
15 CSGT SEGARANTEN JABAR -7.256 106.905

Indonesia Country Report IUGG General Assembly
Melbourne, Australia June 28 – July 7, 2011
10
NO Code Location Latitude Longitude
16 CLDO LIDO JABAR -6.767 106.830
17 CTVI SURANGGA KAB. SUKABUMI -7.121 106.597
18 CPTN CISOLOK P. RATU -6.961 106.411
19 CUJG UJUNG GENTENG SUKABUMI -7.382 106.405
20 CPSR PASAURAN BANTEN -6.226 105.833
21 CSBK PULAU SEBUKU LAMPUNG -5.902 105.505
22 CLGI PULAU LAGUNDI LAMPUNG -5.812 105.297
23 CUJK UJUNG KULON BANTEN -6.747 105.213
24 CTCN TANJUNG CINA LAMPUNG -5.913 104.727
25 CANG SOREANG -7.022 107.525
26 CBLR BLORA -7.005 111.312
27 CBTL BANTUL -7.887 110.327
28 CCLP CILACAP -7.738 109.001
29 CGON CILEGON -5.941 106.003
30 CJEM JEMBER -8.175 113.693
31 CJPR JEPARA -6.596 110.667
32 CJUR CIANJUR -6.827 107.139
33 CKBN KEBUMEN -7.668 109.654
34 CLMG LAMONGAN -7.093 112.326
35 CLUM LUMAJANG -8.214 113.114
36 CMAG MOSPATI -7.606 111.451
37 CMGL MAGELANG -7.476 110.217
38 CMIS CIAMIS -7.326 108.343
39 CMJT MOJOKERTO -7.466 112.442
40 CMLG MALANG -7.979 112.663
41 CMLP MALIMPING -6.792 105.900
42 CNGA NGANJUK -7.604 111.905
43 CNYU BANYUWANGI -8.212 114.375
44 CPAC PACITAN -8.196 111.097
45 CPAI PAITON -7.719 113.530
46 CPAS PASURUAN -7.651 112.901
47 CPBL PURBALINGGA -7.389 109.364
48 CPES PESANGGARAN -8.534 114.110

Indonesia Country Report IUGG General Assembly
Melbourne, Australia June 28 – July 7, 2011
11
NO Code Location Latitude Longitude
49 CPKL PEKALONGAN -6.884 109.670
50 CPTU PELABUHAN RATU -6.900 106.467
51 CPWD PURWODADI -7.096 110.914
52 CPWK PURWAKARTA -6.548 107.438
53 CRBT RANGKASBITUNG -6.360 106.246
54 CROL PATROL -6.315 107.991
55 CRUT GARUT -7.212 107.921
56 CSIT SITUBONDO -7.703 114.013
57 CSLO SOLO -7.571 110.831
58 CSMN SUMENEP -7.018 113.875
59 CSMP SAMPANG -7.195 113.252
60 CTAN TANGGEUNG -7.451 107.136
61 CSUM SUMEDANG -6.859 107.922
62 CTBN TUBAN -6.872 111.987
63 CTGL TEGAL -6.871 109.136
64 CTUL TULUNGAGUNG -8.065 111.906
65 CJKT JAKARTA -6.118 106.865
66 CMER MERAUKE -8.479 140.392
67 CUAL TUAL -5.664 132.736
68 CFAK FAKFAK -2.919 132.265
69 CSAU SAUMLAKI -7.989 131.307
70 CSOR SORONG -0.875 131.253
71 CAMB AMBON -3.639 128.200
72 CKDR KENDARI -4.085 122.391
73 CBKL BENGKULU -3.785 102.253
74 CSEL BALAI SELASA -1.806 100.855
75 CPAR PARIAMAN -0.620 100.120
76 CAIR AIR BANGIS 0.222 99.388
77 CSAB SABANG 5.831 95.347
78 CBTU CIBITUNG Bekasi -6.308 107.096
79 CTGR TANGERANG -6.291 106.663
80 CTER TERNATE 0.788 127.382
81 CBIT BITUNG SULUT 1.4438 125.186
82 CMAK MAKASAR SULSEL -5.135 119.408

Indonesia Country Report IUGG General Assembly
Melbourne, Australia June 28 – July 7, 2011
12
NO Code Location Latitude Longitude
83 CSBY SURABAYA JATIM -7.334 112.724
84 CBAL BALIKPAPAN KALTIM -1.256 116.839
85 CPON PONTIANAK KALBAR 0.075 109.191
86 CBIK BIAK PAPUA -1.186 136.090
87 CMAN MANOKWARI PAPUA -0.859 134.072
88 CNAB NABIRE PAPUA -3.367 135.506
89 CKAL KALABAHI NTT -8.213 124.517
90 CKUP KUPANG NTT -10.169 123.597
91 CMRE MAUMERE NTT -8.627 122.219
92 CREO REO NTT -8.311 120.490
93 CLWB LEWOLEBA NTT -8.371 123.422
94 CTOL TOLI-TOLI SULTENG 1.042 120.817
95 CBKT BUKIT TINGGI SUMBAR -0.309 100.371
96 CPDG PADANG SUMBAR -0.954 100.363
97 CCIR CIREBON JABAR -6.716 108.561
98 CSEM SEMARANG JATENG -6.987 110.377
99 BAKO CIBINONG JABAR -6.491 106.849
100 BAK2 CIBINONG JABAR -6.491 106.849
3. Current Status of BAKOSURTANAL Sea Level Monitoring
Realizing the great loss in the tragedy and in support of the early warning system in
Indian Ocean initiated by the United Nations, Indonesia has allocated national funding for establishing the Indonesian Tsunami Early Warning System (InaTEWS). As sea level monitoring is an important component of TEWS with its role for confirming the arrival time and height of the waves. Indonesia in joint efforts with international partners under the coordination of IOC/UNESCO has established real or near real time sea level monitoring stations. Current status (April 2011), BAKOSURTANAL manage 113 stations comprising:
� 10 tide gauges in cooperation with Germany � 10 tide gauges in cooperation with IOC/UHSLC � 93 tide gauges purely financed by Indonesian Government
4. Airborne Gravity Surveys

Indonesia Country Report IUGG General Assembly
Melbourne, Australia June 28 – July 7, 2011
13
The airborne gravity survey conducted since year 2008 has yielded a set of GPS kinematics position and Free-air gravity anomaly data along the flight strips. This set of data then be gridded into 6’ interval data. Covered survey areas are as follows:
2008 : Sulawesi (44,000 line km) 2009 : South and East Kalimantan (45,000 line km) 2010 : Western Kalimantan and Western Papua (56,000 line km) 2011 : This year, it is planned to cover the rest of western Papua.
5. International Cooperation BAKOSURTANAL cooperates with International institutions as follows:
� Scripps Institution of Oceanography, USA Our geodetic control network coordinates and velocity field for Indonesia is based on GPS surveys data collected annually which is part of scientific collaboration with Scripps Institution of Oceanography, Rensselaer Polytechnic Institute, DEOS Delft University of Technology and GeoForsung Zentrum Potsdam to monitor crustal deformation in Indonesia region. Beginning at year 1997 we were included GPS surveys data collected in Asia Pacific Regional Geodetic Project (APRGP) under Permanent Committee on GIS Infrastructure for Asia and the Pacific (PC-GIAP). More than 250 sites have had three or more occupations with at least a year between each observation. Sites in the GPS network were observed continuously for approximately three days during each occupation period. We used a combination of dual-frequency carrier phase and pseudorange GPS receivers of Trimble 4000’s, Ashtech Z-XII, and Leica’s in the data acquisition.
� National Oceanic And Atmospheric Administration, USA Concerning the collection of global of, and access to observations od sea level from tide gauges, BAKOSURTANAL and NOAA have established in Sibolga, Padang, Benoa and Sabang.
� The University of Hawaii Sea Level Center (UHSLC), USA USA Government under NOAA/University of Hawaii Sea Level Centre (UHSLC) joint collaboration and with financial assistance from USAID has partnered with BAKOSURTANAL to install 10 tide gauges using GTS. The capability of stations will be upgraded gradually to use BGAN communication.
� GeoForschung Zentrum Potsdam, Germany In view of the Earthquake and Tsunami of 26 December 2004, BAKOSURTANAL and GFZ have been involved in The German - Indonesia

Indonesia Country Report IUGG General Assembly
Melbourne, Australia June 28 – July 7, 2011
14
TEWS (GITEWS) Programme. There are installed 10 sea level stations and 10 continuous GPS stations. Each tide gauge station consists of continuous GPS monitoring, a ground meteorological sensor and multiple communication capabilities such as GTS, BGAN/Inmarsat, and PASTI.
� The Geodynamics department, DNSC Copenhagen, Denmark
BAKOSURTANAL in co-operation with the Geodynamics Division, DTU Space, Denmark Technical University, undertakes a joint campaign for regional airborne gravity in Indonesia. The aim of this cooperation is to provide the good coverage of gravity data for geoid mapping in Indonesia as well as to contribute for the improvement of the global Earth Gravity Model (EGM). The main objective of this project is to undertake an airborne gravity survey over parts of Indonesia to provide data for precise geoid model for the area and to provide data for the Earth Geo potential Models (EGM’S). To integrate the collected airborne data with BAKOSURTANAL existing surface data and to use the terrain elevation model from SRTM in order to compile the best possible geoid for the area.
� Institute Geographique National (IGN), France BAKOSURTANAL in cooperation with IGN has establishe a DORIS beacon in BAKOSURTAL’s Base in Cibinong.
� Kyoto University. Japan The scope of cooperation between BAKOSURTANAL and Kyoto University are as follows: � Establishment of Absolute Gravity Network in the Indonesian archipelago
as a part of the Absolute Gravity Standard Station Network in Asia and Oceania,
� Studying the time dependent behavior of the gravity field in East Asia and Southeast Asia,
� Studying the influence of the environmental parameters on the absolute gravity measurements,
� To conduct research and development in data processing and explanation of the problems on the geodynamics and on the physics of the interior of the earth,
� To determine accurately the tidal parameters to study the geodynamical problems of the nearly diurnal free wobble of the Earth’s core, seismic core modes, core undertones, the Earth’s rotation and the polar motion.
3. Future Cooperation

Indonesia Country Report IUGG General Assembly
Melbourne, Australia June 28 – July 7, 2011
15
The future geodetic activities will continue the cooperation with International Institutions. There are some new proposed activities:
� PROTECS (Project for Training, Education and Consultancy) After succesfully GI-TEWS (German Indonesia Tsunami Warning System)-project, GFZ-BAKOSURTANAL and BMKG agree to continue with a new project, it is called PROTECS. This project start on June 1, 2011 for the next three years.
� New MoU with GFZ A new MoU between BAKOSURTANAL and GFZ will be signed the next few month. Cooperative activities carried out under this MoU may include scientific research into the following areas of interest:
1. Operation, data sharing and maintenance of the GITEWS GPS-controlled tide gauges
2. Sharing data and expertise for GPS analyses in the frame of the IGS TIGA project
3. Satellite altimetry calibration/validation; 4. Specific research topics exploiting altimetry data and gravity data; 5. Sharing software for tide gauge data processing; 6. Sharing databases; and 7. other areas of interest to be mutually agreed upon by the Parties.

Indonesia Country Report IUGG General Assembly
Melbourne, Australia June 28 – July 7, 2011
16
Real Time Coastal Sea Level Network Supporting Indonesian Tsunami Early Warning System
Parluhutan Manurung, Joko Ananto, And Sri Handayani
National Coordinating Agency for Surveys and Mapping (BAKOSURTANAL), Jl. Raya Jakarta-Bogor Km 46 Cibinong INDONESIA.
Email: [email protected]
Introduction
The demand for high rate sea level data transmission enabling a tsunami warning issuance in both Indian Ocean and the Indonesian Internal Sea Waters has been increasing after the tragedy of the 2004 Sumatra Tsunami. As it is known, the tsunami was the most catastrophic in recorded history, causing great loss of lives with more than 120,000 fatalities in Indonesia and thousands more over 9 countries in Asia. If an early warning system were available in the region, many lives could have been saved.
Figure 1. Tsunami occurrences at least once in a year since 2004
Realising the great loss in the tragedy and in support of the early warning system
in both Indian Ocean and internal waters of Indonesia, Indonesia has allocated national funding for establishing the Indonesian Tsunami Early Warning System (IdnTEWS). This can be claimed as a turning point in the development of real time coastal sea level monitoring network in Indonesia. Unexpectedly, the tsunami events occurred at least once in a year starting from the devastating tsunami to date and these have been triggering the efforts to speed up the progress development of the warning system in the region. More important, the distribution of earthquakes generating tsunamis, as

Indonesia Country Report IUGG General Assembly
Melbourne, Australia June 28 – July 7, 2011
17
can be seen in Figure 1, shows that the threat is not only found along the coastlines facing the Indian Ocean, but also in both the Internal Waters and Indonesia that facing Pacific Ocean. Therefore the needs to distribute more stations to the Eastern parts of Indonesia should be carried out and this of course requires more investment.
This paper reports the station distribution of the existing network, a description on technology applied, GPS technology added in the network, and data availability.
Station Map Distribution
The Permanent Sea Level Monitoring Network of Indonesia is fully centralised under the responsibility of BAKOSURTANAL in terms of budgeting, maintenance and data processing. However, the contribution of the local port authorities is considerable by assigning at least one of their staff to operate the station on a daily basis.
The network is aimed at functioning as reference stations serving for multi purpose as such as from practical application to research. The network distribution is still far than adequate for representing tidal characteristics along the entire country coast line.
Assuming that one tidal station represents a tidal regime of about 100 km of coast line length, an ideal number of permanent tidal stations, classified as reference stations, for the whole country should be about 810 stations. Therefore, the network is still gradually expanding in number of stations with support not only from the tsunami warning program, but also from support of inter department for densification of the network until it possibly reach the idealistic station distribution.
Figure 2. Distribution map of the Indonesian Sea Level Monitoring Network
Support for development of the sea level component of InaTEWS is derived from mainly four sources of funding available at present that have contributed to the upgrade and installation of tide gauge stations. The support and number of the installed of agreed stations are as follows:

Indonesia Country Report IUGG General Assembly
Melbourne, Australia June 28 – July 7, 2011
18
� The German - Indonesia TEWS (GITEWS) Programme has installed 7 out of 10 agreed sea level stations and the remaining will be completed by the end of 2009. Each station consists of continuous GPS monitoring, a ground meteorological sensor and multiple communication capabilities such as GTS, BGAN/Inmarsat, and PASTI.
� USA Government under NOAA/University of Hawaii Sea Level Centre (UHSLC) joint collaboration and with financial assistance from USAID has partnered with BAKOSURTANAL to install 7 out of 10 agreed stations using GTS. The capability of stations will be upgraded gradually to use BGAN communication and continuous GPS monitoring planed to take place by May 2009.
� The IOC has provided funding for 3 tide gauge station upgrades. UHSLC and BAKOSURTANAL partnered to install all the agreed stations. The work completed by the early of 2008. The capability of stations will also be upgraded gradually to use the BGAN communication and continuous GPS monitoring expected to start by May 2009.
� Indonesian government under the InaTEWS Programme supports funding has completed to install 40 out of 60 agreed stations using GSM and VSAT platforms. However, the completion of the remaining stations is still subject to funding availability.
(a)
(b)
Figure 3 Adopting local art and culture in the tidal hut outlook (a). Poster for explaining to
public about the importance of sea level stations in supporting tsunami warnings (b)
The progress of new developments of Indonesia Coastal Seal Level Monitoring Network has been achieving in total 90 stations with the following summary, namely:

Indonesia Country Report IUGG General Assembly
Melbourne, Australia June 28 – July 7, 2011
19
� First Order Sea Level Network consisting of 57 out 80 planned real time stations supporting both IOTWS and InaTEWS. This is designed to use multiple-use platforms and various communication tools for back up as such as GTS, BGAN, PASTI (Indonesian Satellite-based Communication provider), VSAT and GSM data.
� Second Order Sea Level Network consisting of 25 float gauge digital stations using GSM data connections. This order is mainly distributed in the internal water of Indonesia which is relatively not prone to tsunami threats.
� Third Order Sea Level Network consisting of 8 operational analogue (graphical chart) stations. Since the cost for operational is higher than that of digital, this type will be gradually replaced with digital in the next few years.
Efforts to adopt local arts and culture impression on the outlook of the tidal huts have been made allowing participations from the local people to keep the stations from destructions and vandalism, as shown in Figure 3(a).
The UNESCO Jakarta under JTIC programme has generously provided a poster explaining to public living in tsunami at risk about the importance of sea level stations in supporting tsunami warnings, as shown in Figure 3(b).
Tide Gauge Technology
The stations supporting tsunami warnings consist of multiple-use platforms using higher data sampling rate which provide the range, durability and sampling capability to monitor tsunami signals including stability and accuracy to measure long term sea level trend and its variations. The stations dedicated to non-hazard monitoring are adequately equipped with single type of sensor with float gauge or pressure.
The sensor basic configuration for natural hazard monitoring capability should use combination of the three different types of sensors consisting of pressure, float gauge and radar. The three types of sensors should be capable of operating independently and have a 0.5 millimetre height resolution over a range of 0 to 15 meters. This will ensure to provide back-up and redundancy, continuous observations during extreme water levels and long term satisfactory performance for at least 12 months. The common specification of three types level sensors are as follows: � Radar gauge tidal recording with 10 second data sampling rate enabling
monitoring of sea level with high time resolution recording. This should be a primary sensor in supporting the warning system by having the advantage of ease of operation and maintenance since a direct contact to the sea water is at the very minimum level and the stilling well is no longer necessary

Indonesia Country Report IUGG General Assembly
Melbourne, Australia June 28 – July 7, 2011
20
� Pressure gauge digital recording with one minute data sampling rate and high capability in detecting quick changes of water pressure caused by tsunami and this is also adequate to fill any short gaps which may occur in the radar type. The installations of this type have been showing more widespread use including in the future plan of network densification in particular for practical applications.
� Float gauge digital recording with one minute data sampling rate, allowing real time monitoring that can cover extreme sea level changes for relatively short time durations. In some current areas it is found not possible to install a well in the installations request a considerable amount of costly engineering work. Both of the GITEWS and Indonesia support stations are equipped with sensors
manufactured by the same company while those supported by NOAA/UHLSC use those of different manufacturers and then customised them in one system using data loggers supporting the GTS transmission. It is found that some problems related to firm ware could not be fixed on site and this should only be handled by manufacturer for commercial reasons. Therefore, number of spare units of data loggers and sensors should be available allowing to a quick recovery and subsequently this will keep an optimal data recording.
Communication is one of the main bottlenecks in the development of an early warning system in terms of maintenance and airtime cost. The operational demands driving the data communications system requirements are: i) Reliable real time data streaming (every minute), ii) system stability, iii) system versatility and two-way communication capability, iv) ability to expand usage, and iv) affordable cost. The demands would only be fulfilled by using different communication channels such as VSAT, GTS/Meteosat, BGAN, and GSM data, which are all running independently, if possible. This provides a more robust system to ensure that the system is able to receive data during emergencies. The use of satellite based data communication with solar cell for a self-supporting power supply should be the most reliable option for the vast archipelagic region.
In a normal situation when the required data transmission rate is not that high, use of Meteosat or Japanese geostationary satellites and GTS provides the most reliable option for data transmission. This approach allows for data transmissions every 15 minutes, the satellite link modem consumes low energy, and the transmission air time is free access due to the generous support of WMO. However, Indonesia is located in the potential tsunami risk front lines where the time needed for tsunami waves to reach the nearest coastline is 15 minutes on average. This communications option is not meant for facilitating an extreme mode with faster data transmission requirements, such as one minute transmission rates when a tsunami occurs. This high transmission rate often requires that the system trigger the stations, located close to the tsunami source, to continuously transmit data in the event of a major earthquake. This allows

Indonesia Country Report IUGG General Assembly
Melbourne, Australia June 28 – July 7, 2011
21
the experts on duty at the Indonesia Tsunami Early Warning Centre to make a decision to evacuate or not to evacuate.
Problem of providing a sufficient power supply is mostly encountered in high rate data transmission using satellite unlike that of using GSM/GPRS of which range of distance for transmission is shorter compare to the former. A worse condition will occur when orientation of the antenna is not correctly pointing to the assigned satellite. Several types of satellite communication used namely GTS; Inmarsat/BGAN, Iridium and Indonesia Satellite PASTI. The 15 minute interval data transmission with GTS is found relatively very stable and reliable as indicated mostly over 90% data record availability. The one minute data transmission interval capability with BGAN is added later in the system fulfilling a higher rate transmission for coastal zone of Indonesia classified tsunami at risk. It is found that the performance is reliable though modems of some stations should need to be repaired. In fact, the transmission is not set to a constant one minute transmission rate but it is set to capability of one minute transmission which is triggered during a tsunami mode.
The use of VSAT in the Indonesian support stations is the high priority option since this is the best solution at present for real time data communication. It is becoming more cost effective and reliable for a vast area such as Indonesia with an archipelagic condition where mostly very minimal terrestrial communication infrastructure is available. The VSAT instrumentation should have a high standard technical specification, such as all connectors should be hermetically sealed to protect the electronics from water, dust and particularly high salinity in outdoor and marine environments. Problem of power supply is still unavoidable due to the consumption of power is higher compare with other communication platforms.
In the year 2009, it has been initiated to use the Iridium communication as it has been used by the Agency for the Assessment and Application of Technology (BPPT) in the development of Indonesia support buoys.
The use of the terrestrial based transmission using a wireless communication should be a better option since the area coverage of GSM/GPRS facilitated by numbers of providers is significantly improving in the country. Although it is susceptible to a local earthquake but it is found that providers show more reliable capacity for a quick recovery. Again, the density of station distribution could compensate failure of the neighbouring stations allowing monitoring the propagation of tsunami in the region at risk. As some GSM/GPRS providers are now facilitating a monthly based subscription with a more affordable cost, BAKOSURTANAL has initiated to start a real time transmission at some stations and this will be expanded covering the whole network if the signal coverage is available.
The stations mostly rely on batteries charged by solar panels for power since local power is not an appropriate option at many remote areas and more importantly that local power is vulnerable to failure in the event of earthquake or tsunami run off.

Indonesia Country Report IUGG General Assembly
Melbourne, Australia June 28 – July 7, 2011
22
However, despite that high intensity of sun shine but both high humidity and cloud are factors greatly reducing an optimal capacity of solar power in the equatorial region. Considering the factors, several batteries, mostly those of maintenance free, should be available more than required for back up enabling to maintain power in a worse condition where sun shine availability resulting from high rainfall and cloud is not sufficient to recharge the batteries for at least four days.
Optimal sea level observations still require local operators to routinely check and maintain the station. BAKOSURTANAL assigns in total 120 local operators, recruited from the local port authority office where the stations are located. The operators play a very significant role in maintaining the stations to ensure the full operation of the instruments. This is because the recording instruments used in the network still require a regular maintenance and more important, the stations are mostly located in busy ports which are prone to damage by traffic in the harbour and vandalism. A minimum weekly monitoring contact carried out by a staff on duty in BAKOSURTANAL office to the operators. It is now possible since most of the operators could afford to have mobile phones unlike in the past when contact with operators were difficult since contact can only be done with fixed line and some with letters. Training workshops for improving the operator’s skill on station maintenance have been conducted regularly. The results of the regular monitoring and training have been encouraging, as indicated by a significant improvement in data quality and data return from an average of 60 to 95%.
GPS Technology
The first initiative to incorporate continuous GPS measurements in the sea level monitoring system in Indonesia carried out under the GITEWS programme. This is a significant improvement for both determination of geocentric position of the stations and separation of thermal expansion from the sea level variation records. Considering the locations of the coastal stations are mostly in harbour with geological formation of alluvial sediments, the variations are partly caused by ground layer compaction and subsidence. The high accuracy of height derived GPS time series is also significant to show indication of instability occurred with the jetty piers of which this could also affect the sea level records.

Indonesia Country Report IUGG General Assembly
Melbourne, Australia June 28 – July 7, 2011
23
Figure 4. The tidal huts with GPS antenna on top located in Seblat (Sumatra) and Sadeng (Java).
Stations supported under the GITEWS program are all equipped with geodetic
type GPS receivers together with ground meteorological sensors enabling for the computation of more high accurate atmospheric corrections required for the determination of precise height component. The additional sensor is also useful for other applications as such as GPS meteorology. In term of tsunami warnings, the station with atmospheric measurement capabilities is also of great importance to ensure that the extreme sea level change indicated during the tsunami alert mode is not caused by a positive surge and vice versa.
Table 1. The existing and planned continuous GPS observations at the sea level monitoring stations. The sea level data is free accessible from the UNESCO/IOC website.
More importantly, the coastal gauge GPS stations are also of importance to provide formation of baselines used for ambiguity resolutions to the nearest GPS buoys located offshore. The data is transmitted hourly using Inmarsat/BGAN to BAKOSURTANAL and German Research Centre for Geosciences (GFZ) servers and the system has a capacity to trigger the transmission in higher rate during the tsunami

Indonesia Country Report IUGG General Assembly
Melbourne, Australia June 28 – July 7, 2011
24
mode. Figure 4 shows the tidal hut located in Sadeng (Western tip of Java) and Seblat (Western coast of Sumatra) with the GPS antennas at the roof top.
Another initiative will be carried out at several of the ten existing coastal sea level stations supported by both NOAA/UHSLC and UNESCO. The installation is planned to start by early May 2009. Table 1 shows the existing and planned continuous GPS observations at the sea level monitoring stations supported under GITEWS, IOC, and NOAA/UHSLC. In total there will be at least 20 continuous GPS capable sea level stations in the Sea Level Monitoring Network of Indonesia.
Data Availability
The percentage of data record per year is improving greatly after the era of digital sensors together with reliable communication tools enabling remote monitoring of the sensor performances. The availability of mobile phone owned by most operators nowadays also enables to facilitate troubleshooting and quick recovery by the local operators via a remote help by the engineer on duty at the BAKOSURTANAL office. This is hardly possible to carry out in the past.
In supporting the tsunami warnings, the real time sea level data from the BAKOSURTANAL Sea Level Centre’s computer server should flow continuously to that of the National Tsunami Warning Centre (NTWC) via a dedicated internet connection. The data streaming is displayed on web-based and this be incorporated to the Decision Support System (DSS) in NTWC by the end of year 2009. The web-based display of the real time sea level transmitted to the Warning Centre is shown in Figure 6.
Indonesia with supports of the partners has also been contributing a free access real time data from 17 stations with the list of station as shown in Table 1. The data is displayed in the UNESCO/IOC website with the address as http://www.ioc-sealevelmonitoring.org/. The data is made available in accordance with the IOC Oceanographic Data Exchange Policy as adopted by the 22nd session of IOC Assembly in Resolution 6.

Indonesia Country Report IUGG General Assembly
Melbourne, Australia June 28 – July 7, 2011
25
Figure 5. Real time sea level data flow from the Indonesia sea level centre (BAKOSURTANAL) to the Tsunami Warning Centre (BMKG) transmitted through a dedicated line.
Conclusion
The development of the Indonesian Real Time Coastal Sea Level Network is progressing significantly in support for both InaTEWS and IOTWS. There are 57 of 80 planned stations already in place and the total number of stations in the network consists of 90, as of May 2009. Ongoing attempts to complete the deployment of the remaining stations and the data display including a quality control capability which have been pursued.
The extensive network uses different communication channels such as VSAT, Meteosat/GTS, BGAN, PASTI and GSM data, which are all running independently, if possible. As Indonesia coastlines are close to tsunamigenic areas, the communication system should be capable of operating in an extreme tsunami mode where data transmission fast rate from the stations is required.
The significant addition of new real time sea level stations is a great opportunity to improve an operational ocean observing system covering the whole Indonesia region with a better distribution.
The deployment of GPS receivers and meteorological sensors at sea level stations will greatly contributing to both the high precision vertical control supporting tsunami and climate research.
Acknowledgements
The author would like to thank Mr. Rudolf W Matindas, the Chairman of BAKOSURTANAL for his encouragement to report the Indonesian activities on monitoring sea level to related international bodies. Especially, the author would like to thank the support from Ms Henny Liliwaty, Deputy Chairman of Spatial Data Infrastructure, Mr. Rustandi Poerawiardi, Head of Centre for Geodesy and Geodynamics and the author’s colleagues in Gravity and Tide Division, namely Ruddy Sorongan, Sofie Barlianto, Supriadi, Tunjung Wismadi and Amir Machmud. Without their help, the writing of this paper would not have been possible.
References
Intergovernmental Oceanographic Commission, 1985. Manual on sea-level measurement and interpretation. Volume 1 - Basic procedures. Intergovernmental Oceanographic Commission Manuals and Guides No. 14. IOC, Paris, 83pp.
Manurung, P. et al, 2009. Tide Prediction Book 2009. BAKOSURTANAL, Cibinong Indonesia.

Indonesia Country Report IUGG General Assembly
Melbourne, Australia June 28 – July 7, 2011
26
Manurung, P. et al, 2008. Progress Development of the Indian Real Time Coastal Sea Level Network Supporting Tsunami Early Warning System. International Conference of Tsunami Warning, Bali, Indonesia.
Merrifield, M.A. et al., 2005. Tide gage observations of the Indian Ocean tsunami, December 26, 2004, Geophys. Res. Lett. 32, L09603, doi:10.1029/2005GL022610.
Pugh, David T., 1987. Tides, Surges and Mean Sea-Level. John Wiley & Sons, Singapore.
Rabinovich, A.B., Thomson, R.E., 2007. The 26 December 2004 Sumatra Tsunami: Analysis of Tide Gauge Data from the World Ocean Part 1. Indian Ocean and South Africa. Pure Appl. Geophys. 164 (2007) 261–308.
The State Ministry of Research and Technology, 2006. Grand Design of Indonesia Tsunami Early Warning System. The Republic Indonesia State Ministry of Research and Technology Office, Jakarta.

Indonesia Country Report IUGG General Assembly
Melbourne, Australia June 28 – July 7, 2011
27
Present Status of Indonesian Sea Level Monitoring Network
Khafid
National Coordinating Agency for Surveys and Mapping (BAKOSURTANAL), Jl. Raya Jakarta-Bogor Km 46 Cibinong INDONESIA.
Email: [email protected] Introduction
Since 1984, National Coordinating Agency for Surveys and Mapping of Indonesia (BAKOSURTANAL) has been developing and operating the National Permanent Sea Level Monitoring Network. Initially, the equipments were developed using graphic/analog system and it is intended to support the determination of vertical datum for surveying and mapping purposes, navigation and coastal management that do not require data in real time. The number of tide gauges is increased from year to year in line with the increasing needs of reference vertical datum for levelling networks to support surveying and mapping activities. The early implementation was started by BAKOSURTANAL with 8 analogue stations. The number of new stations increased by about 2 per year, except for a significant increase of 25 digital stations in 1998 to support the bathymetric mapping of the exclusive economic zone and sea line passages in Indonesian waters. The Indonesian Sea Level Monitoring Network before the 2004 Sumatra Tsunami consisted of 60 stations, of which 35 stations were using analogue graphical chart recorders and 25 stations were using digital recorders with Public Switch Telephone Node (PSTN) data connection.
Figure 1. National Sea Level Monitoring Network of Indonesia, operational before the 2004 Sumatra Tsunami (Manurung, 2007)
Indonesia Country Report IUGG General Assembly
Melbourne, Australia June 28 – July 7, 2011
28
The demand for permanent sea level monitoring has been increasing after the tragedy of the 2004 Sumatra Tsunami. The tsunami was the most catastrophic in recorded history, causing great loss of lives with more than 120,000 fatalities in Indonesia and thousands more over 9 countries in Asia. If an early warning system were available in the region, many lives could have been saved.
Realizing the great loss in the tragedy and in support of the early warning system in Indian Ocean initiated by the United Nations, Indonesia has allocated national funding for establishing the Indonesian Tsunami Early Warning System (InaTEWS). As sea level monitoring is an important component of TEWS with its role for confirming the arrival time and height of the waves. Indonesia in joint efforts with international partners under the coordination of IOC/UNESCO has established real or near real time sea level monitoring stations. Current status (April 2011), BAKOSURTANAL manage 113 stations comprising:
� 10 tide gauges in cooperation with Germany � 10 tide gauges in cooperation with IOC/UHSLC � 93 tide gauges purely financed by Indonesian Government
2. Present Status of BAKOSURTANAL Sea Level Monitoring
The 26th December 2004 Sumatra Tsunami, which devastated the coastal area of Aceh
and the surrounding countries in the Indian Ocean, can be claimed as a turning point in the development of sea level monitoring in Indonesia. Since then, the appreciation of the importance of sea level monitoring has been increasing, resulting in funding by the Indonesian Government for 2006 - 2008 fiscal years for modernizing the network with new instrumentation and real time communication tools. In fiscal year 2010, BAKOSURTANAL got an additional funding to built 20 stations, and further three tide gauges are installed on March 2011.
The current status (April 2011), BAKOSURTANAL maintain in total 93 tide gauges purely finance by Indonesian Government. New 20 Tide Gauges in 2010
Grand design of Indonesia Tsunami Early Warning System (InaTEWS) is to build 80 tide gauges in real time in Indonesian waters. Until the end of 2009, BAKOSURTANAL maintains 60 real time tide gauges, therefore BAKOSURTANAL for Expenditure Budget Amendment (APBN-P) in 2010 proposed to build new 20 real time tide gauges to complete the grand design. The works are completed at the end of 2010 and operate at begin of 2011. The distribution of the new 20 tide gauges is shown in figure 2.

Indonesia Country Report IUGG General Assembly
Melbourne, Australia June 28 – July 7, 2011
29
Figure 2. Distribution of the new 20 tide gauges The purposes of the new tide gauge installations are as follows:
� To complete the grand design InaTEWS for supporting Indonesia Tsunami Early Warning System (InaTEWS),
� To determine mean sea level, Lowest Astronomical Tide and Highest Water Level for Surveys and Mapping,
� To monitor the effect of Global Climate Changes into Indonesian waters, � As fundamental data for the development of National Spatial Data
Infrastructure (NSDI)
To provide back-up and redundancy, each field unit consists of three types of water level sensors capable of providing continuous observations during extreme water levels and long term satisfactory performance for at least 12 months. The three types of level sensors are as follows:
� Float gauge digital recording with one minute data sampling rate, allowing real time monitoring that can cover extreme sea level changes for relatively short time durations.
� Pressure gauge digital recording with one minute data sampling rate and high capability in detecting quick changes of water pressure caused by tsunami.
� Radar gauge tidal recording with 10 second data sampling rate enabling monitoring of sea level with high time resolution recording.
� The three types of sensors should be capable of operating independently and have a 0.5 millimeter height resolution over a range of 0 to 15 meters.
New 3 Tide Gauges in 2011
Besides the construction of 20 new tide gauges financed through Expenditure
Budget Amendment in fiscal year 2010, BAKOSURTANAL build also 4 buildings for tidal stations, one building for German-Indonesia tide gauge in Rote, and the other

Indonesia Country Report IUGG General Assembly
Melbourne, Australia June 28 – July 7, 2011
30
three are in Tuban, Jambi and Dumai. The last three stations are not dedicated for InaTEWS but for other purposes like Monitoring Sea Level Rise, and Surveys/Mapping. The equipments are installed on March 2011. Figure 3 shows the distribution of the Stations.
Figure 3. Distribution of new tide gauges installed on March 2011 Pushing Raw Data to Decision Support System of InaTEWS
BAKOSURTANAL provides Web-Display to Decision Support System of InaTEWS. The system can display the raw data from BAKOSURTANAL’S Tidal Database in real time. In addition the raw numerical data from 24 tide gauges are directly pushed into DSS of InaTEWS, i.e.:
1. Bengkulu 2. Bintan 3. Binuangen 4. Ende 5. Gunung Sitoli 6. Jailolo 7. Kota Jawa 8. Krui
9. Maumere 10. Nusa Penida 11. Pamempeuk 12. Pelabuhan Ratu 13. Pulau Banyak 14. Sanana 15. Singkil 16. Tahuna
17. Tua Pejat 18. Waingapu 19. Sikakap 20. Muara Sekabaluan 21. Kota Agung 22. Sarmi 23. Raja Ampat 24. Jayapura
GITEWS Sea Level Monitoring
German-Indonesia Tsunami Early Warning System (GITEWS) program supports 10 sea level stations. Each station consists of continuous GPS monitoring, a ground meteorological sensor and VSAT communication. In February 2006, Geoforschung Zentrum (GFZ) carried out site surveys to plan the construction of tide gauges. The first installation is in Sadeng Gunungkidul, Yogyakarta that is equipped with sea level, GPS and ground meteorological sensors, installed on September 2006. At present, all of the 10 planned tide gauges are installed. The last construction is in Rote installed on

Indonesia Country Report IUGG General Assembly
Melbourne, Australia June 28 – July 7, 2011
31
February 2011. Data communication for tide gauge in Sadeng is facilitated with VSAT, on the other tide gauges are with Meteosat, BGAN and PASTI, enabling data stream in real time mode to InaTEWS. All of the GITEWS raw numerical data are pushed to DSS of InaTEWS.
Figure 4. Distribution of GITEWS Sea Level Monitoring USA-Indonesia Sea Level Monitoring Networks
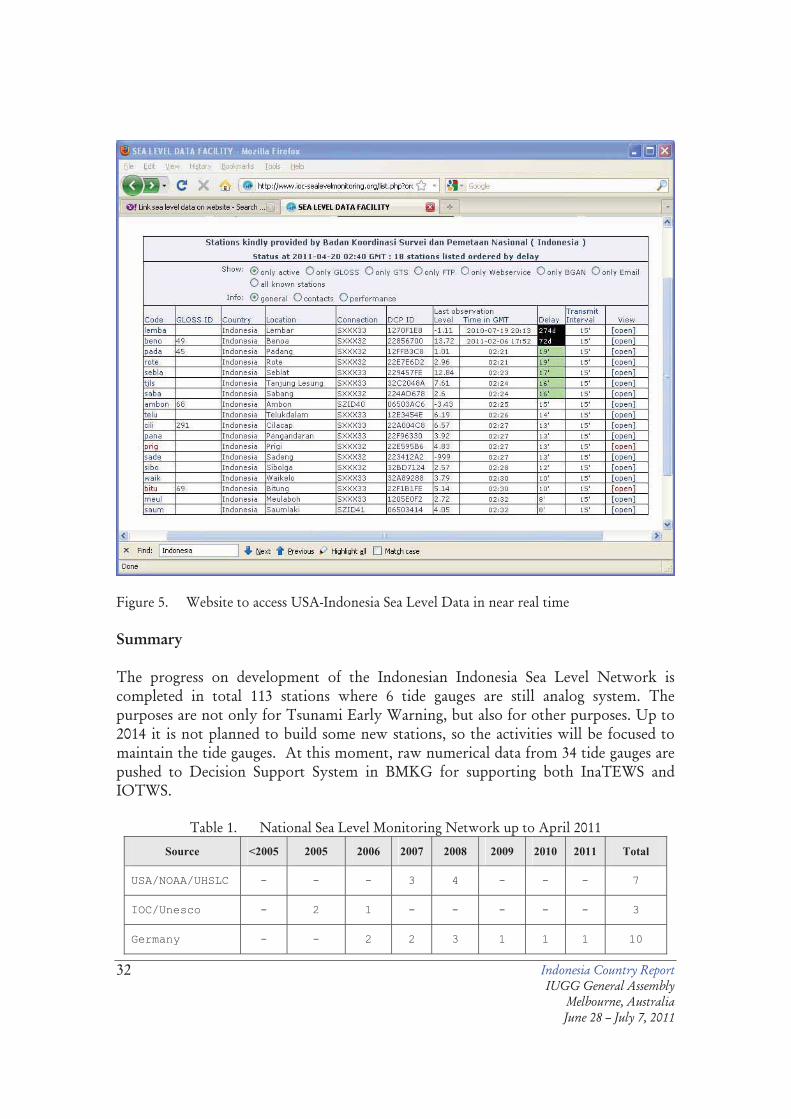
BAKOSURTANAL and the UHSLC, with financial support from the IOC and USAID, have installed 7 real time tide gauges facing to Indian Ocean and 3 tide gauges around Banda Sea. The first installation was built in April 2005 in Sibolga on the western coast of North Sumatra Province. The next installation was carried out in Sabang and Padang on December 2005. The installations were continued in January 2006 at Benoa (Bali) and further in early February 2007 the tide gauges in Cilacap and Prigi were installed. Four additional stations, i.e. Lembar, Bitung, Ambon and Saumlaki were installed in 2008. All the stations are equipped for 15 minute data transmission using GTS/Meteosat. Later, BGAN communication capability will be added to the stations. The data can be accessed via http://www.ioc-sealevelmonitoring.org/
InaTEWS doesn’t receive the raw data from these tide gauges in real time, therefore the use of these data for supporting Tsunami Early Warning is carried out manually through the website of IOC’s Sea Level Monitoring. In the future, it could be better if the raw data can be pushed to InaTEWS.
Recent status on April 2011, the tide gauges in Benoa, Lembar and Ambon are defect and will be repaired on May 2011.
Indonesia Country Report IUGG General Assembly
Melbourne, Australia June 28 – July 7, 2011
32
Figure 5. Website to access USA-Indonesia Sea Level Data in near real time Summary The progress on development of the Indonesian Indonesia Sea Level Network is completed in total 113 stations where 6 tide gauges are still analog system. The purposes are not only for Tsunami Early Warning, but also for other purposes. Up to 2014 it is not planned to build some new stations, so the activities will be focused to maintain the tide gauges. At this moment, raw numerical data from 34 tide gauges are pushed to Decision Support System in BMKG for supporting both InaTEWS and IOTWS.
Table 1. National Sea Level Monitoring Network up to April 2011
Source <2005 2005 2006 2007 2008 2009 2010 2011 Total
USA/NOAA/UHSLC - - - 3 4 - - - 7
IOC/Unesco - 2 1 - - - - - 3
Germany - - 2 2 3 1 1 1 10

Indonesia Country Report IUGG General Assembly
Melbourne, Australia June 28 – July 7, 2011
33
Indonesia 53 - 2 14 - 1 20 3 93
Total 53 2 5 19 7 2 21 4 113 References Caldwell, P., 1998. Sea Level Data Processing Software on IBM PC Compatible
Computers Version 3.0 (Year 2000 Compliant). JIMAR Contribution No 319, SOEST, University of Hawaii, 72 pp.
Intergovernmental Oceanographic Commission, 1985. Manual on sea-level measurement and interpretation. Volume 1 - Basic procedures. Intergovernmental Oceanographic Commission Manuals and Guides No. 14. IOC, Paris, 83pp.
Khafid et. Al. 2010, Laporan Kegiatan: Inventarisasi Data Pemetaan Geoid dan Operasionalisasi Stasiun Pasang Surut, BAKOSURTANAL, Cibinong Indonesia
Manurung, P. et al, 2007. Tide Prediction Book 2009 BAKOSURTANAL, Cibinong Indonesia. Manurung, P. et al, 2009. Tide Prediction Book 2007. BAKOSURTANAL, Cibinong Indonesia.
Merrifield, M.A. et al., 2005. Tide gage observations of the Indian Ocean tsunami, December 26, 2004, Geophys. Res. Lett. 32, L09603, doi:10.1029/2005GL022610.
Pugh, David T., 1987. Tides, Surges and Mean Sea-Level. John Wiley & Sons, Singapore.
Rabinovich, A.B., Thomson, R.E., 2007. The 26 December 2004 Sumatra Tsunami: Analysis of Tide Gauge Data from the World Ocean Part 1. Indian Ocean and South Africa. Pure Appl. Geophys. 164 (2007) 261–308.
The State Ministry of Research and Technology, 2006. Grand Design of Indonesia Tsunami Early Warning System. The Republic Indonesia State Ministry of Researchand Technology Office, Jakarta.

Indonesia Country Report IUGG General Assembly
Melbourne, Australia June 28 – July 7, 2011
34
The Airborne Gravity Survey for Regional Geoid Mapping
Adolf Fientje Kasenda
National Coordinating Agency for Surveys and Mapping (BAKOSURTANAL), Jl. Raya Jakarta-Bogor Km 46 Cibinong INDONESIA.
The earth gravity measurements can be conducted by land, marine and air borne surveys or using space borne mode. Both land and marine surveys give ‘in situ’ gravity values but very time consuming and difficult to perform in rough terrain or shallow water (coastal areas). On the other hand the space borne mode, i.e., measuring the earth gravity from satellite gives a quick globally dataset but the high resolution of the gravity field is attenuated due to high orbit. The airborne gravity survey which measures the gravity from an aircraft offers the best technique to cover inaccessible areas such as mountainous and coastal region in a short time and provides a seamless dataset with better resolution than the space borne technique or accuracy comparable to land survey.
The implementation of the satellite based height system requires a high precision geoid. To create such geoid, a good coverage and quality of gravity data is needed. The main constraint to produce the precise geoid for this country is the deficiency of gravity data, especially in mountainous and coastal areas where access for terrestrial measurements are limited.
Figure 1. The 2008-2010 Airborne Gravity Survey Areas
BAKOSURTANAL in co-operation with the Geodynamics Division, DTU
Space, Denmark Technical University, undertakes a joint campaign for regional airborne gravity in Indonesia. The aim of this cooperation is to provide the good

Indonesia Country Report IUGG General Assembly
Melbourne, Australia June 28 – July 7, 2011
35
coverage of gravity data for geoid mapping in Indonesia as well as to contribute for the improvement of the global Earth Gravity Model (EGM).
The main objective of this project is to undertake an airborne gravity survey over parts of Indonesia to provide data for precise geoid model for the area and to provide data for the Earth Geo potential Models (EGM’S). To integrate the collected airborne data with BAKOSURTANAL existing surface data and to use the terrain elevation model from SRTM in order to compile the best possible geoid for the area.
The joint airborne gravity
surveys have been carried out since 2008 covering major islands of Sulawesi, Kalimantan and Papua. The total numbers of about 510 flights hours have been completed during 2008 – 2010 field work, measuring 145,000 Km lines flown at 10 nautical miles track intervals. It is planned to continue the surveys to cover the rest of the areas where gravity data is unavailable.
Figure 2. BAKOS chairman, Dr. Asep Karsidi
in front of the survey aircraft Airborne gravity measurements The metodology of the surveys are : a. Gravity measurements will be made with a modified LaCosta & Romberg
airborne/seaborne gravimeter (s/n S-99 or S-38), augmented with inertial component. A highly damped, zero-length spring type gravity sensor mounted on a stabilized platform with the following specifications: � Range : 12,000 mGal � Drift : 3.0 mGal per month or less � Operating temperature : 0o C to 40o C � Power requirements : less than 300 Watt � Accuracy : better than 2 mGal
b. The instrument will be installed in a locally chartered aircraft Cessna 208B Grand Caravan and DASH 6 or similar aircraft has proven to be a reliable platform for gravity measurements with the following conditions: i). The aircraft must have an auto-pilot system for smooth navigation. ii). The aircraft should be small size, to get good phugoid motion characteristics
and high stability at low speeds. iii). Performance:

Indonesia Country Report IUGG General Assembly
Melbourne, Australia June 28 – July 7, 2011
36
� Cruise speed : less than 160 knot � Range : more than 1,300 km � Service ceiling : more than 5,000 m � Payload with full fuel : more than 400 kg
iv). Accommodation : 2 (two) flight crews and 3 (three) passengers v). Access to aircraft power : 28 Volt DC or 110/220 Volt AC.
c. The resulting data will provide high-accuracy gravity data given in an international reference frame (called: IGSN71 and WGS-84). The area will be surveyed along flight lines with a spacing of 10 nautical miles, at flight elevations adapted to local topography. Data will subsequently be downward continued to a common surface. The gravity data collected from these surveys shall be accurate to 2mGal internally at an along-track resolution of 6-8 km.
d. The Global Positioning System (GPS) are used for vertical and horizontal positioning control. Geodetic type GPS receivers are required both for installing in the aircraft and for GPS reference stations, with the following conditions: i). Minimum 4 (four) GPS units must be used for measurements (two as rover in
aircraft and two on ground for differential reduction). As an alternative, permanent GPS stations can be used as reference station for positioning.
ii). Tracking L1 C/A code, L1/L2 full-cycle carrier and fully operational during P-code encryption
iii). Accuracy for horizontal ± 20 cm + 1 ppm and for vertical ± 20 cm + 1 ppm.
Overview Survey The activity of airborne gravity survey is carried out since 2008, with coverage area as follows: Year 2008 Area : Sulawesi Survey Period : 21 September – 4 November Number of Flights : 36 Airboorne Time (hours) : 158 Kilometers flown : 44,000

Indonesia Country Report IUGG General Assembly
Melbourne, Australia June 28 – July 7, 2011
37
Figure 3. Airborne Gravity Survey Coverage for Year 2008 Year 2009 Area : South and East Kalimantan Survey Period : 23 October – 26 November Number of Flights : 37 Airboorne Time (hours) : 162 Kilometers flown : 45,000

Indonesia Country Report IUGG General Assembly
Melbourne, Australia June 28 – July 7, 2011
38
Figure 4. Airborne Gravity Survey Coverage for Year 2009 Year 2010 Area : Western Kalimantan and Western Papua Survey Period : 9 July – 26 August Number of Flights : 41 Airboorne Time (hours) : 190 Kilometers flown : 56,000
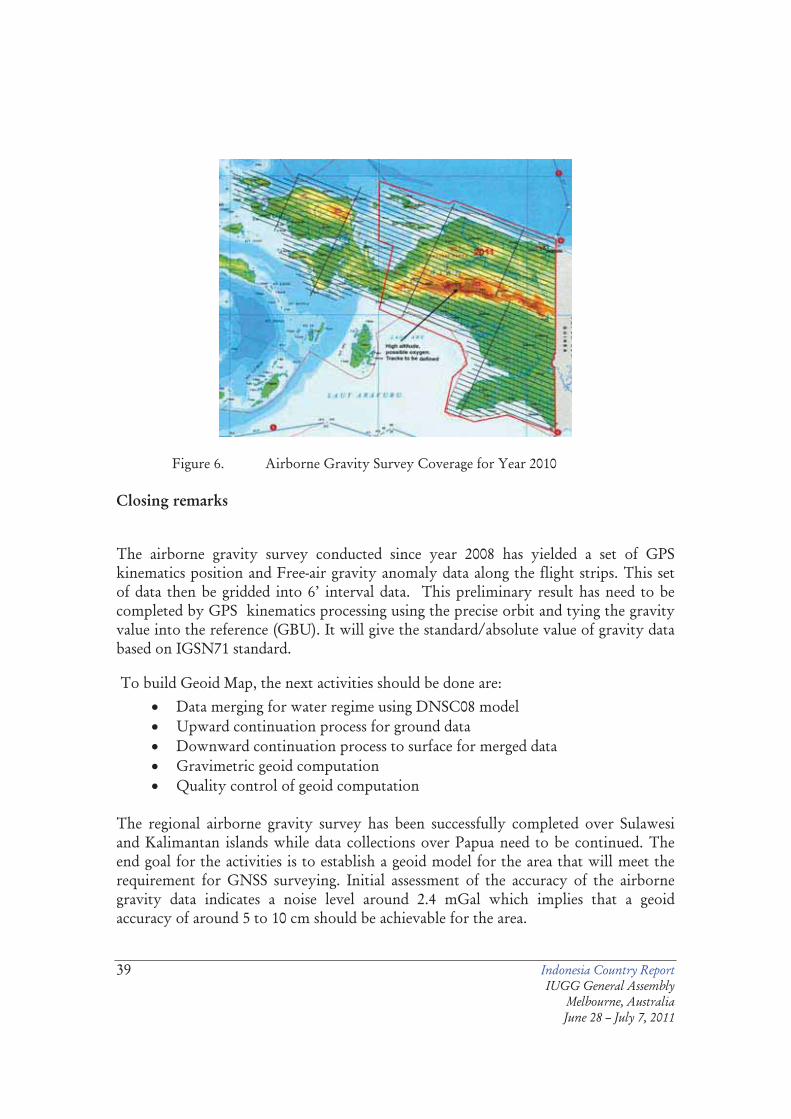
Figure 5. Airborne Gravity Survey Coverage for Year 2010 Year 2011 This year, airborne gravity survey is planned to cover the rest of wesrtern Papua as shown in Figure 6.
Indonesia Country Report IUGG General Assembly
Melbourne, Australia June 28 – July 7, 2011
39
Figure 6. Airborne Gravity Survey Coverage for Year 2010
Closing remarks
The airborne gravity survey conducted since year 2008 has yielded a set of GPS kinematics position and Free-air gravity anomaly data along the flight strips. This set of data then be gridded into 6’ interval data. This preliminary result has need to be completed by GPS kinematics processing using the precise orbit and tying the gravity value into the reference (GBU). It will give the standard/absolute value of gravity data based on IGSN71 standard.
To build Geoid Map, the next activities should be done are: � Data merging for water regime using DNSC08 model � Upward continuation process for ground data � Downward continuation process to surface for merged data � Gravimetric geoid computation � Quality control of geoid computation
The regional airborne gravity survey has been successfully completed over Sulawesi and Kalimantan islands while data collections over Papua need to be continued. The end goal for the activities is to establish a geoid model for the area that will meet the requirement for GNSS surveying. Initial assessment of the accuracy of the airborne gravity data indicates a noise level around 2.4 mGal which implies that a geoid accuracy of around 5 to 10 cm should be achievable for the area.

Indonesia Country Report IUGG General Assembly
Melbourne, Australia June 28 – July 7, 2011
40

Indonesia Country Report IUGG General Assembly
Melbourne, Australia June 28 – July 7, 2011
41
Studying Land Subsidence in Semarang (Indonesia) Using
Geodetic Methods Hasanuddin Z. Abidin, Heri Andreas, Irwan Gumilar, Teguh P. Sidiq, Mohammad Gamal, D.
Murdohardono, Supriyadi, Indonesia, Yoichi Fukuda, Japan Summary
Semarang is the capital of Central Java province, located in the northern coast of Java island, Indonesia, with an area of about 374 km² and population of about 1.4 million. It has been reported for some time that locations in Semarang are subsiding at different rates. This subsidence is mainly due to natural consolidation of alluvial, coupled with excessive groundwater extraction and load of constructions. During the high tide periods, these subsiding areas used to experience flooding. Land subsidence phenomena in Semarang has been studied using several geodetic monitoring methods, i.e. levelling surveys, InSAR (interferometric Synthetic Aperture Radar) technique, GPS surveys, and microgravity surveys. Based on the levelling, InSAR and microgravity data, the subsidence with maximum rate of up to about 15 cm/year were observed during the period of 1979 up to 2006. Largest subsidence occurred at areas along the coast. This paper mainly describes and discusses the results obtained by GPS surveys that have been conducted in 2008 and 2009, and InSAR using ALOS/PALSAR images of 2007 and 2008. Paper is sum up with some concluding remarks. Key words: Semarang, Land Subsidence, GPS , InSAR, Levelling, Microgravity Introduction
Semarang is the capital of Central Java province, located in the northern coast of Java island, Indonesia (see Figure 1). It is centred at the coordinates of about -6º58' (latitude) and +110º25' (longitude), and covers an area of about 37,366.8 hectares or 373.7 km2, with the population of about 1.43 million people in 2006 [Semarang City, 2009].
Topographically, Semarang consisted of two major landscapes, namely lowland INDONESIA and coastal area in the north and hilly area in the south. The northern part, where the city centre, harbour, airport and railway stations are located, is relatively flat with topographical slopes ranging between 0 and 2°, and altitude between 0 and 3.5 m; while the southern part have slopes up to 45° and altitude up to about 350 m above sea level. The northern part has relatively higher population density and also has more industrial and business areas compared to the southern part. The land use of southern part is usually consisted of residential, office, retail, public use and open space areas.

Indonesia Country Report IUGG General Assembly
Melbourne, Australia June 28 – July 7, 2011
42
Two rivers run through the city, one on the east side and another on the west which essentially dividing the city into three parts.
Geologically, Semarang has three main lithologies, namely, volcanic rock, sedimentary rock, and alluvial deposits. According to Sukhyar (2003), the basement of Semarang consists of Tertiary Claystone of the Kalibiuk Formation. Overlying this Formation is the Notopuro Formation which consists of Quaternary volcanic material. The two formations crop out in the southern part of the Semarang area. The northern part of the Semarang area is covered by Kali Garang deltaic alluvium up to a depth of 80 to 100 m in the coastal area. Aquifers are found at depths ranging from 30 to 80 m in this alluvium. The northern part of Semarang is composed by very young alluvium with high compressibility. Several researches [Van Bemmelen, 1949; Marfai et.al. 2008] reported that the shoreline of Semarang progresses relatively quick toward the sea, namely about 2 km in 2.5 centuries or about 8 m/year. Therefore it can be expected that natural consolidation process still occurred until now, causing land subsidence in the northern part of Semarang.
Figure 1. Geographical location of Semarang.
Increases in the population and urban development in the area, has accelerated land subsidence through excessive groundwater extraction, and load of building and construction. Land subsidence is not a new phenomenon for Semarang, which has experienced it since more than 100 years. The impact of land subsidence in Semarang can be seen in several forms, such as the wider expansion of (coastal) flooding areas, cracking of buildings and infrastructure, and increased inland sea water intrusion. It also badly influences the quality of living environment and life (e.g. health and sanitation condition) in the affected areas.

Indonesia Country Report IUGG General Assembly
Melbourne, Australia June 28 – July 7, 2011
43
Figure 2. The importance of land subsidence information. In the case of Semarang, comprehensive information on the characteristics of land subsidence is applicable to several important planning and mitigation efforts (see Figure 2), such as effective control of coastal flood and seawater intrusion, spatial-based groundwater extraction regulation, environmental conservation, design and construction of infrastructure, and spatial development planning. Considering the importance of land subsidence information for supporting development activities in the Semarang area, monitoring and studying the characteristics of this subsidence phenomenon becomes more valuable.
Some subsidence study has been conducted in Semarang city using several geodetic methods, such as Levelling [Sutanta et al., 2005; Marfai and King, 2007], GPS surveys, Gravity [Sarkowi et al., 2005; Fukuda et al., 2008] and InSAR [Murdohardono et al., 2009; BGR, 2009]. This paper describes and discusses the results obtained by GPS surveys that have been conducted in 2008 and 2009. Land Subsidence In Semarang Land subsidence in Semarang has been widely reported and its impacts can be seen already in daily life. It can be seen in the forms of coastal flooding (it is called rob by the locals) that its coverage tends to enlarge by times. Figure 3 shows the severity of coastal flooding in coastal areas of Semarang. This frequent and severe rob not just deteriorate the function of building and infrastructures. It also badly influences the quality of living environment and life (e.g. health and sanitation condition) in the affected areas (see Figure 4). Cracking of buildings and infrastructure, and increased inland sea water intrusion, are also other impacts of land subsidence. The economic losses caused by land subsidence in Semarang are enormous; since many buildings and infrastructures in the industrial zone of Semarang are severely affected by land subsidence and its collateral coastal flooding disasters.

Indonesia Country Report IUGG General Assembly
Melbourne, Australia June 28 – July 7, 2011
44
Many houses, public utilities and a large number of populations are also exposed to this silent disaster. The correspondingmaintenance cost is increasing by year. Provincial government and communities are required to frequently raise ground surface for keeping roads and buildings dry. The living conditions of population affected by the land subsidence are in general decreasing. Based on
Figure 3. Coastal flooding in Semarang on mid April
2009; courtesy of Kompas photo, 2 July 2009.
the levelling surveys conducted by the Centre of Environmental Geology from 1999 to 2003 it was found that the relatively large subsidence were detected at around Semarang Harbor, Pondok Hasanuddin, Bandar Harjo and around Semarang Tawang Railway station, with the rates ranging from 1 to 17 cm/year [Tobing and Murdohardono, 2004; Murdohardono et al., 2007].
Levelling derived subsidence zones in Semarang is given in Figure 5. The zoning is derived based on the height changes of 29 levelling points. It should be noted in this case that the zoning is highly generalized and maybe in accurate in detail. This Figure shows that the northern coastal areas of Semarang are subsiding with the rates larger than 8 cm/year. These areas are generally composed by swamp deposit of soft clay soil.
The estimation based on the PS InSAR technique also revealed that the areas close to shoreline have subsidence rates of more than 8 cm/year [Murdohardono et al., 2009; Kuehn et al., 2009], as shown in Figure 6. The contour lines in this Figure are based on the PS InSAR based velocity data derived from 28 ERS-2 and ENVISAT-ASAR radar scenes recorded between 27 November 2002 and 23 August 2006.

Indonesia Country Report IUGG General Assembly
Melbourne, Australia June 28 – July 7, 2011
45
Figure 4. Examples of subsidence impacts in Semarang.
Figure 5. Levelling
derived subsidence in Semarang in the period of 2000 to 2001; courtesy of Geological Agency Bandung, after [Murdahardono et al., 2007].
Figure 6. PS InSAR derived subsidence rates in Semarang; courtesy of Geological Agency Bandung, after [Murdahardono et al., 2009; Kuehn et al., 2009].

Indonesia Country Report IUGG General Assembly
Melbourne, Australia June 28 – July 7, 2011
46
Subsidence in Semarang has also been studied using the microgravity method since 2002 by the research group from the Department of Geophysics of ITB. Based on this method, it is found that during September 2002 to November 2005, a maximum subsidence of about 48 cm occurred in the northern region of Semarang (see Figure 7). It corresponds to a maximum rate of about 15 cm/year. Based on the results from Levelling, PS InSAR and Microgravity methods, shown in Figures 5 to 7, suggested that during the period between 2000 and 2006, subsidence process in Semarang is going on with the rates that can be up to about 15 cm/year. The higher subsidence rates always occur in the northern coastal areas and getting generally smaller to the south direction.
Figure 7. Microgravity derived subsidence in
Semarang from Sept. 2002 to Nov. 2005; after [Supriyadi, 2008].
Since 2008, the Geodesy Research Division of ITB started to study land subsidence in Semarang by using GPS surveys and InSAR methods. The results are presented in the following sections. Land Subsidence Measured By GPS GPS (Global Positioning System) is a passive, all-weather, satellite-based navigation and positioning system, which is designed to provide precise three-dimensional position and velocity, as well as time information on a continuous worldwide basis [Wells et al., 1986; Hofmann-Wellenhof et al., 2007; Abidin, 2007]. With GPS survey method several monuments, which are placed on the ground covering the Bandung Basin and its surroundings, are accurately positioned relative to a certain reference (stable) point, using the GPS survey technique. The precise coordinates of the monuments are periodically determined using repeated GPS surveys at certain time intervals. By studying the characteristics and rate of change in the height components of the coordinates from survey to survey, the land subsidence characteristics can be derived. For monitoring land subsidence, when the expected subsidence is of very small magnitude, the ideal positioning accuracy to be achieved is at the mm level. In order to achieve this level of accuracy the GPS static survey method based on dual-frequency

Indonesia Country Report IUGG General Assembly
Melbourne, Australia June 28 – July 7, 2011
47
carrier phase data processing should be implemented, with stringent measurement and data processing strategies [Abidin et al., 2002; Leick, 2004]. GPS surveys for studying land subsidence in Semarang have been conducted on 7-13 July 2008 and 5-11 June 2009. The number of observed points was 48 at first survey and 52 points at second survey. The location and distribution of the points are shown in Figure 8. Station SMG1 is the southernmost point in the network and considering its relatively stable location is used as the reference point for this subsidence study.
The GPS surveys exclusively used dual-frequency geodetic-type GPS receivers. The length of surveying sessions was in general between 9 to 11 hours. The data were collected with a 30 second interval using an elevation mask of 150. The surveys were mainly carried out by the staffs and students from the Department of Geodesy and Geomatics Engineering of ITB (Institute of Technology Bandung). Example of some GPS stations is shown in Figure 9.
The data were processed using the software Bernese 5.0 [Beutler etFigure 8. GPS network for studying al., 2007]. Since we are mostlyland subsidence in Semarang. interested in the relative heights with respect to a stable point, the radial processing mode was used instead of a network adjustment mode. In this case, the relative ellipsoidal heights of all stations are determined relative to SMG1 station. For data processing, a precise ephemeris was used instead of the broadcast ephemeris. The effects of tropospheric and ionospheric biases are mainly reduced by the differencing process and the use of dual-frequency observations. The residual tropospheric bias parameters for individual stations are estimated to further reduce the tropospheric effects. The algorithms forthe tropospheric parameter estimation can be found in
Figure 8. GPS network for studying land
subsidence in Semarang.
Figure 9. Example of GPS stations for
monitoring land subsidence in

Indonesia Country Report IUGG General Assembly
Melbourne, Australia June 28 – July 7, 2011
48
Beutler et al. (2007). In processing baselines, most of the cycle ambiguities of the phase observations were successfully resolved.
Semarang.
The standard deviations of GPS -derived relative ellipsoidal heights from all surveys were in general better than 1-2 mm (see Figure 10). A few points have slightly larger standard deviations, due to the lack of observed data caused by the signal obstruction.
Figure 10. Standard deviations of GPS -derived relative heights in mm.
In using GPS surveys method, the height change �dhij and its rate���dhij at each station are derived using the following relation:
�dhij = dh(tj) - dh(ti) (1) v�dhij = �dhij / (tj - ti) (2)
where dh(tj) and dh(ti) are the relative ellipsoidal heights with respect to SMG1, obtained from the ith and jth GPS surveys. Subsidence is represented by a negative value of �dhij .
In order to statistically check the significance of the estimated subsidence values, we apply the general linear hypothesis test [Leick, 2004] to the estimated height parameter. The null hypothesis of the test is that the estimated relative ellipsoid heights at epoch j equal the estimated value of the previous epoch i., i.e. there is no subsidence has occurred. Therefore,
null hypothesis Ho :����dhij = 0 (3) alternative hypothesis Ha :����dhij � 0 (4)
The test statistics for this test is
ij
ij
dhdh
t��
���
(5)
which has the customary Student's t-distribution if Ho is true. The null hypothesis is rejected if
2/,dftt (6)
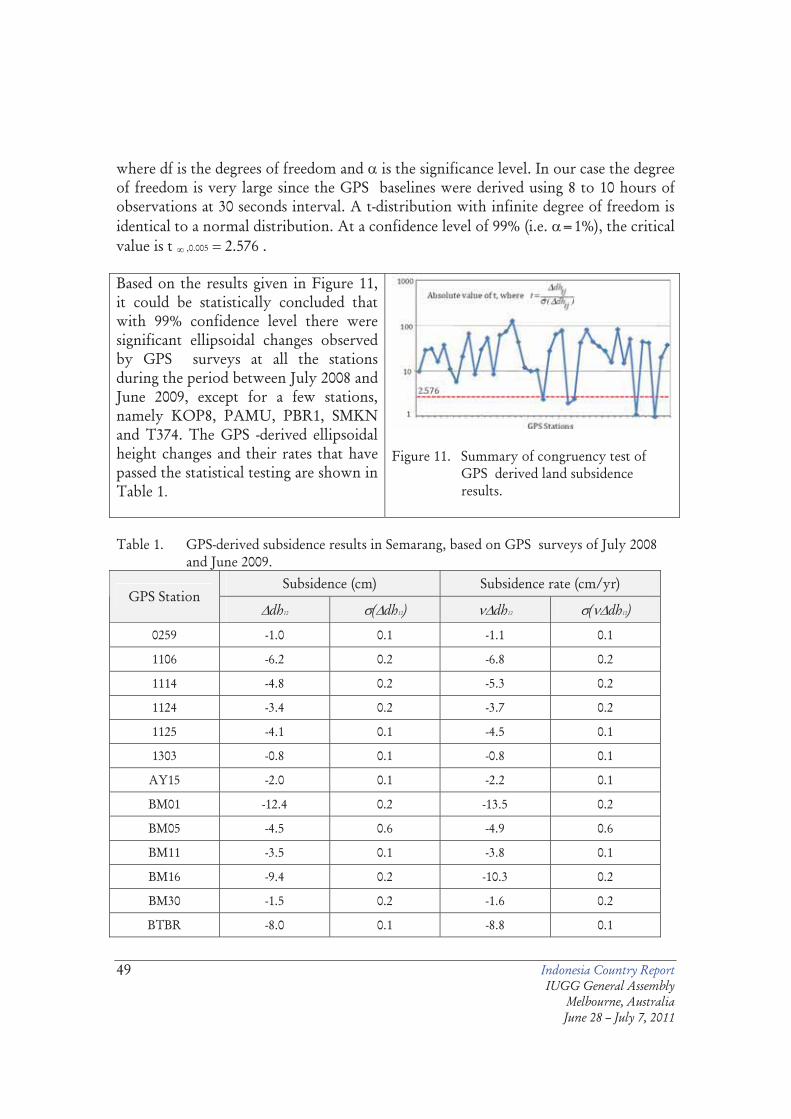
Indonesia Country Report IUGG General Assembly
Melbourne, Australia June 28 – July 7, 2011
49
where df is the degrees of freedom and is the significance level. In our case the degree of freedom is very large since the GPS baselines were derived using 8 to 10 hours of observations at 30 seconds interval. A t-distribution with infinite degree of freedom is identical to a normal distribution. At a confidence level of 99% (i.e. =1%), the critical value is t � ,0.005 � 2.576 . Based on the results given in Figure 11, it could be statistically concluded that with 99% confidence level there were significant ellipsoidal changes observed by GPS surveys at all the stations during the period between July 2008 and June 2009, except for a few stations, namely KOP8, PAMU, PBR1, SMKN and T374. The GPS -derived ellipsoidal height changes and their rates that have passed the statistical testing are shown in Table 1.
Figure 11. Summary of congruency test of
GPS derived land subsidence results.
Table 1. GPS-derived subsidence results in Semarang, based on GPS surveys of July 2008
and June 2009. Subsidence (cm) Subsidence rate (cm/yr)
GPS Station �dh12 �(�dh12) ��dh12 �(��dh12)
0259 -1.0 0.1 -1.1 0.1
1106 -6.2 0.2 -6.8 0.2
1114 -4.8 0.2 -5.3 0.2
1124 -3.4 0.2 -3.7 0.2
1125 -4.1 0.1 -4.5 0.1
1303 -0.8 0.1 -0.8 0.1
AY15 -2.0 0.1 -2.2 0.1
BM01 -12.4 0.2 -13.5 0.2
BM05 -4.5 0.6 -4.9 0.6
BM11 -3.5 0.1 -3.8 0.1
BM16 -9.4 0.2 -10.3 0.2
BM30 -1.5 0.2 -1.6 0.2
BTBR -8.0 0.1 -8.8 0.1

Indonesia Country Report IUGG General Assembly
Melbourne, Australia June 28 – July 7, 2011
50
CTRM -6.1 0.1 -6.7 0.1
ISLA -11.3 0.1 -12.3 0.1
JOHR -4.4 0.1 -4.9 0.1
K371 -3.0 0.3 -3.3 0.3
KO16 -1.8 0.2 -2.0 0.2
MP69 -4.7 0.2 -5.1 0.2
MSJD -7.9 0.1 -8.7 0.1
MTIM -8.6 0.1 -9.4 0.1
PMAS -4.9 0.1 -5.3 0.1
PRPP -8.3 0.1 -9.1 0.1
SD01 -7.3 0.2 -8.0 0.2
SD02 -3.9 0.1 -4.2 0.1
SFCP -3.6 0.1 -3.9 0.1
Results from GPS show that land subsidence in Semarang has spatial variations, ranging from 0.8 to 13.5 cm/year with the mean of 5.9 cm/year (see Table 1 and Figures 12). Northern region of Semarang city exhibits higher rates of subsidence compare to its southern region, as shown in Figures 13 and 14.
Figure 12. GPS-derived subsidence rates in Semarang
Figure 13. GPS derived contours of

Indonesia Country Report IUGG General Assembly
Melbourne, Australia June 28 – July 7, 2011
51
subsidence rates in Semarang Figure 14. GPS derived zones of subsidence rates in Semarang.
The GPS derived subsidence results show more or less the same rates and pattern of subsidence as derived by Levelling, PS InSAR and Microgravity methods. GPS results also indicate that subsidence process is still going on until recently (i.e. June 2009) in Semarang. Land Subsidence Measured By InSAR
Geodesy Research Division of ITB has also used InSAR method to study land subsidence in Semarang using data from the ALOS/PALSAR satellite, which was launched in January 2006 as a successor of JERS-1/SAR. There are three ALOS PALSAR images were processed in this case (see Table 2). They were acquired in Fine Beam Single Polarization mode (HH polarization) with off-nadir angle of 41.5 degrees. InSAR processing has been performed using Level 1.1 products (SLC: Single Look Complex).
There are two pairs of images were processed (see Table 3). The first pair is between 24 October 2007 (071024) and 11 December 2008 (081211), and the other is between 9 December 2007 (071209) and 11 December 2008 (081211). The baselines of image pairs are about 684 m and 849 m, respectively. In this case, the subsidence is derived using two pass differential method, and SRTM data was used for generating the DEM for the area. The final results of subsidence are shown in Figure 15.

Indonesia Country Report IUGG General Assembly
Melbourne, Australia June 28 – July 7, 2011
52
Table 2. ALOS/PALSAR images used for studying land subsidence in Semarang city
Date Looking direction
24 October 2007 Ascending
09 December 2007 Ascending
11 December 2008 Ascending Table 3. Image pair of data
Image Pair Baseline
(Perpendicular)
071024_081211 683.877 meter
071209_081211 848.753 meter

Indonesia Country Report IUGG General Assembly
Melbourne, Australia June 28 – July 7, 2011
53
Figure 15. ALOS/PALSAR InSAR derived subsidence in Semarang city, from
(071024_081211) pair (left), and (071209_081211) pair (right)
Results shown in Figures 15 show that subsidence in Semarang city is generally occuring in the northern part of the city, with the maximum rates of about 15 cm/year. These results are more or less similar with the aforementioned results derived by other methods.
It should be noted in this case that, the uplift presence in Figure 15 is mostly caused by the very low correlation of images, and the uplift presence in this Figure should not be considered as a ‘real’ uplift [Sidiq, 2009]. Closing Remarks
Land subsidence in northern part of Semarang is believed to be caused by the combination of natural consolidation of young alluvium soil, groundwater extraction and load of buildings and constructions. Due to this coastal land subsidence, part of the north coast area of Semarang city has been showing a growth of sea water inundation since almost the last three decade.
Groundwater abstraction in Semarang city is increasing sharply since early 1990s, especially in industrial area (see Figure 16). According to [Marsudi, 2001], the number of registered wells in 1900 is 16; becomes 94 wells in 1974, 178 wells 1981, 350 wells in 1989, 600 wells in 1990, 950 wells in 1996, and 1050 wells in 2000. The registered groundwater abstraction is increasing from about 0.4 million m3/year in 1900, to 0.9 million m3/year in 1974, 1.8 million m3/year in 1981, 8.8 million m3/year in 1989,
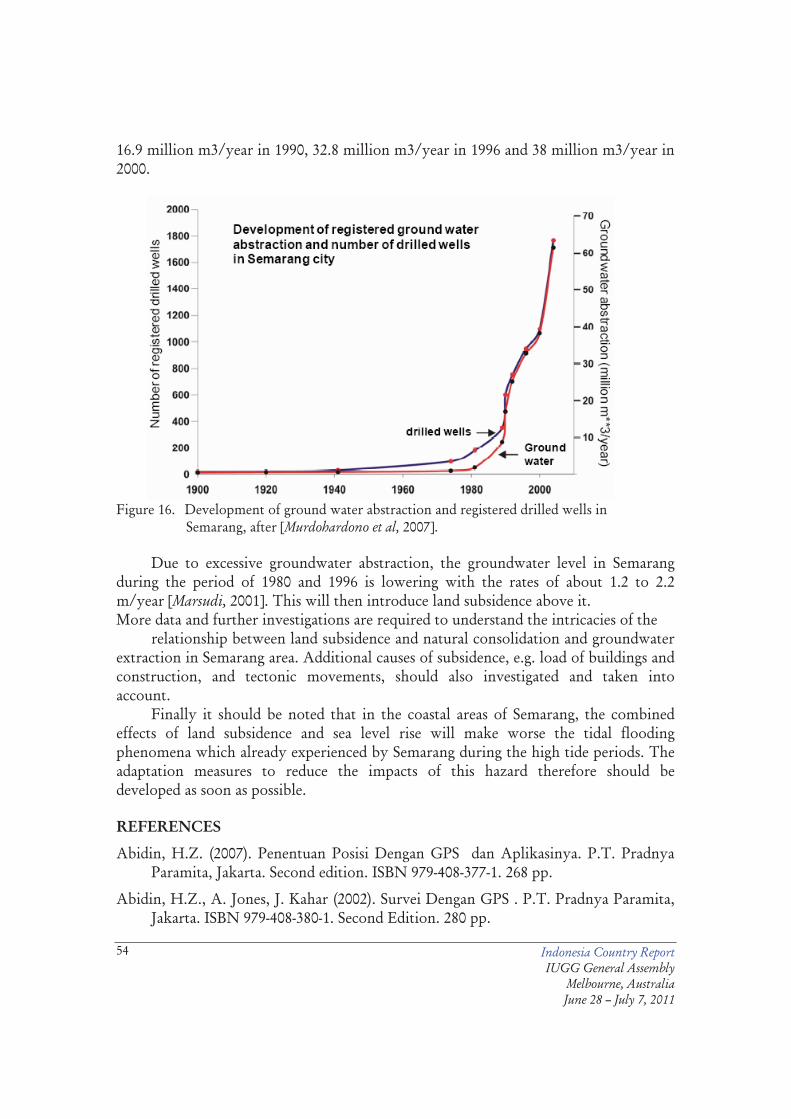
Indonesia Country Report IUGG General Assembly
Melbourne, Australia June 28 – July 7, 2011
54
16.9 million m3/year in 1990, 32.8 million m3/year in 1996 and 38 million m3/year in 2000.
Figure 16. Development of ground water abstraction and registered drilled wells in
Semarang, after [Murdohardono et al, 2007]. Due to excessive groundwater abstraction, the groundwater level in Semarang
during the period of 1980 and 1996 is lowering with the rates of about 1.2 to 2.2 m/year [Marsudi, 2001]. This will then introduce land subsidence above it. More data and further investigations are required to understand the intricacies of the
relationship between land subsidence and natural consolidation and groundwater extraction in Semarang area. Additional causes of subsidence, e.g. load of buildings and construction, and tectonic movements, should also investigated and taken into account.
Finally it should be noted that in the coastal areas of Semarang, the combined effects of land subsidence and sea level rise will make worse the tidal flooding phenomena which already experienced by Semarang during the high tide periods. The adaptation measures to reduce the impacts of this hazard therefore should be developed as soon as possible.
REFERENCES
Abidin, H.Z. (2007). Penentuan Posisi Dengan GPS dan Aplikasinya. P.T. Pradnya Paramita, Jakarta. Second edition. ISBN 979-408-377-1. 268 pp.
Abidin, H.Z., A. Jones, J. Kahar (2002). Survei Dengan GPS . P.T. Pradnya Paramita, Jakarta. ISBN 979-408-380-1. Second Edition. 280 pp.

Indonesia Country Report IUGG General Assembly
Melbourne, Australia June 28 – July 7, 2011
55
Abidin, H. Z., R. Djaja, D. Darmawan, S. Hadi, A. Akbar, H. Rajiyowiryono, Y. Sudibyo, I. Meilano, M. A. Kusuma, J. Kahar, C. Subarya (2001). "Land Subsidence of Jakarta (Indonesia) and its Geodetic-Based Monitoring System." Natural Hazards. Journal of the International Society of the Preventation and Mitigation of Natural Hazards, Vol. 23, No. 2/3, March, pp. 365 - 387.
Abidin, H.Z., H. Andreas, M. Gamal, R. Djaja, D. Murdohardono, H. Rajiyowiryono, M. Hendrasto (2003a). " Studying Land Subsidence of Bandung Basin (Indonesia) Using GPS and EDM Surveys". Proceedings of the International Symposium and Exhibition on Geoinformation 2003 (ISG03), Shah Alam, Malaysia, 13-14 Oct., pp. 228-240.
Abidin, H.Z., R. Djaja, H. Andreas, M. Gamal, K. Hirose, Y. Maruyama, D. Murdohardono, H. Rajiyowiryono, C. Subarya (2003b). " Monitoring Land Subsidence of Jakarta (Indonesia) Using Leveling, GPS Survey and InSAR Techniques." Paper presented at IUGG (International Union of Geodesy and Geophysics) 2003 General Assembly Meeting, Sapporo, 30 June – 11 July, Session G05, 4 July, 09:15-09:30.
Abidin, H.Z., H. Andreas, M. Gamal, M. Hendrasto, O.K. Suganda, Surono (2004). " The Use of GPS Surveys Method for Natural Hazard Mitigation in Indonesia". Proceedings of the Monitoring, Prediction and Mitigation of Disasters by Satellite Remote Sensing, Awaji, Jepang, 19-21 Januari, pp. 95-112.
Abidin, H.Z. , H. Andreas, R. Djaja, D.Darmawa and M. Gamal (2008a). “Land subsidence characteristics of Jakarta between 1997 and 2005, as estimated using GPS surveys”, GPS Solutions, Springer Berlin / Heidelberg, Vol. 12, No. 1, pp. 23-32.
Abidin, H.Z., R. J. Davies, M. A. Kusuma, H. Andreas, T. Deguchi (2008b). “Subsidence and uplift of Sidoarjo (East Java) due to the eruption of the Lusi mud volcano (2006–present)”, Environmental Geology, Springer, DOI 10.1007/s00254-008-1363-4.
BGR (2009). “Detection of land subsidence in Semarang/Indonesia using persistent scatterer interferometry (PSI)”. Article in the site of Federal Institute for Geosciences and Natural Resources (BGR) of Germany, address: http://www.bgr.bund.de/, accessed date: 9 July.
Prange, S. Schaer, T. Springer, C. Urschl, and P. Walser (2007). Bernese GPS software Version 5.0. In: R. Dach, U. Hugentobler, P. Fridez, and M. Meindl (eds) Astronomical Institute, University of Berne, 612 pp.
Fukuda, Y, T. Higashi, S. Miyazaki, T. Hasegawa, S. Yoshii, Y. Fukushima, J. Nishijima, M. Tanigushi, H.Z. Abidin, R.M. Delinom (2008). “Groundwater and Land Subsidence Monitoring in 3 Mega-Cities, Indonesia, by Means of Integrated

Indonesia Country Report IUGG General Assembly
Melbourne, Australia June 28 – July 7, 2011
56
Geodetic Methods”, Paper presented at the AGU Fall Meeting 2008, San Fransisco, 15-19 December.
Hofmann-Wellenhof, B., H. Lichtenegger and E. Wasle (2007). GNSS Global Navigation Satellite Systems: GPS , GLONASS, Galileo, and More. Springer Verlag, Wien, 2007.
Kuehn, F. , D. Albiol, G. Cooksley, J. Duro, J. Granda, S. Haas, A. Hoffmann-Rothe, and D. Murdohardono (2009), ”Detection of land subsidence in Semarang, Indonesia, using stable points network (SPN) technique”, Environmental Earth Sciences, DOI 10.1007/s12665-009-0227-x
Leick, A. (2004) GPS Satellite Surveying. Third edition. John Wiley & Sons. New York, USA.
Marfai, M.A. and L. King (2007). “Monitoring land subsidence in Semarang, Indonesia”, Environmental Geology, Springer Verlag, Vol.53, pp. 651–659.
Marfai, M.A, H Almohammad, S Dey, B Susanto, and L King (2008), “Coastal dynamic and shoreline mapping: multi-sources spatial data analysis in Semarang Indonesia”, Environmental Monitoring and Assessment, Vol. 142, pp. 297-308.
Marsudi (2001). Prediksi Laju Amblesan Tanah di dataran Aluvial Semarang, Propinsi Jawa Tengah. Disertasi Doktor, Institut Teknologi Bandung, 176 pp.
Murdohardono, D., T.M.H.L. Tobing, and A. Sayekti (2007). “Over Pumping ff Ground Water as one of Causes of Sea Water Inundation in Semarang City”, Paper presented at the International Symposium and Workshop on Current Problems in Groundwater Management and Related Water Reosurces Issues, Kuta, Bali, 3-8 Desember 2007.
Murdohardono, D., G.M. Sudradjat, A.D. Wirakusumah F. Kühn, F. Mulyasari (2009), “Land Subsidence Analysis through Remote Sensing and Implementation on Municipality Level; Case Study: Semarang Municipality, Central Java Province, Indonesia”, Paper presented at the BGRGAI-CCOP Workshop on Management of Georisks “The Role of Geological Agencies in Government Practice of Risk Reduction from Natural Disaster”, 23-25 June 2009, Yogyakarta.
Semarang City (2009). Oficial website of Semarang munipality). Address :http://www.semarang.go.id/, access date: 1 July.
Sarkowi, M., W.G.A. Kadir, D. Santoso (2005), “Strategy of 4D Microgravity Survey for the Monitoring of Fluid Dynamics in the Subsurface”, Proceedings of the World Geothermal Congress 2005, Antalya, Turkey, 24-29 April.
Sidiq, T.P. (2009). The Use of InSAR method for Monitoring Volcano Deformation and Land Subsidence (in Indonesian). Master Thesis, Institute of Technology Bandung, September.

Indonesia Country Report IUGG General Assembly
Melbourne, Australia June 28 – July 7, 2011
57
Sukhyar, R. (2003). “Status and Progress of Urban Geology In Indonesia”, Atlas and Urban Geology Vol. 14 : The Ground Beneath Our Feet: a Factor in Urban Planning, United Nations ESCAP (Economic and Social Commission for Asia and the Pacific), New York, pp. 335 – 340.
Supriyadi (2008). Separation of Gravity Anomaly Caused Subsidence and Ground Water Level Lowering of Time Lapse Microgravity Data Using Model Based Filter: Case Study Semarang Aluvial Plain (in Indonesian), PhD Dissertation. Institute of Technology Bandung, September, 146 pp.
Sutanta, H., A. Rachman, Sumaryo, Diyono (2005) “Predicting Land Use Affected by Land Subsidence in Semarang Based on Topographic Map of Scale 1:5.000 and Leveling Data”. Proceedings of the Map Asia 2005 Conference (in CDRom), Jakarta, 22-25 August 2005.
Tobing, TMHL and Dodid Murdohardono (2004). “Peta Amblesan Tanah Daerah Semarang Dan Sekitarnya, Jawa Tengah”. Artikel di Situs Direktorat Tata Lingkungan Geologi dan Kawasan Pertambangan, Alamat situs: http://www.dgtl.esdm.go.id/, Tanggal akses 16 Juli 2004.
Van Bemmelen, R.W. (1949). The Geology of Indonesia. Vol. IA, Government Printing Office, Martinus Nijhof, The Netherlands.
Biographical Notes Prof. Dr. Hasanuddin Z. Abidin, is a Professor and Head of Geodesy Research Division, Faculty of Earth Science and Technology, Institute of Technology Bandung, Indonesia. He obtained his Insinyur degree from Dept. of Geodetic Engineering, ITB in 1985, and his MSc.Eng and PhD degrees from the Department of Geodesy and Geomatics Engineering (previously Dept. of Surveying Engineering), Univ. of New Brunswick, Canada, in 1989 and 1992 respectively. His academic background is related to the theory and applications of satellite geodesy; and his research works up to the present times includes the following areas, namely : ambiguity resolution of GPS signals; the use of GPS system for geodetic surveying, land surveying, cadastral surveying, and marine applications; use of GPS survey method for monitoring volcano deformation, land subsidence, landslide, and dam deformation; geodetics aspects of the international boundary; and integration of GPS and INSAR for deformation study. Contacts Prof. Dr. Hasanuddin Z. Abidin Geodesy Research Division Faculty of Earth Science and Technology

Indonesia Country Report IUGG General Assembly
Melbourne, Australia June 28 – July 7, 2011
58
Institute of Technology Bandung, Jl. Ganesa 10 Bandung INDONESIA Tel. + 62-22-2534286 Fax + 62-22-2534286 Email: [email protected] and [email protected] Web site: http://geodesy.gd.itb.ac.id/hzabidin
Indonesia Country Report IUGG General Assembly
Melbourne, Australia June 28 – July 7, 2011
59
Land Subsidence and Urban Development in Jakarta (Indonesia)
Hasanuddin Z. Abidin, Heri Andreas, Irwan Gumilar And Mohammad Gamal, Yoichi Fukuda And T. Deguchi
Summary Jakarta is the capital city of Indonesia with a population of about 9 people, inhabiting an area of about 660 square-km. In the last three decades, urban development of Jakarta has grown very rapidly in the sectors of industry, trade, transportation, real estate and many others. This exponentially increase urban development introduce several environmental problems. Land subsidence is one of them. The resulted land subsidence will also then affect the urban development plan and process. It has been reported for many years that several places in Jakarta are subsiding at different rates. Over the period of 1982–1997, subsidence ranging from 20 to 200 cm is evident in several places in Jakarta. In general the land subsidence exhibits spatial and temporal variations, with the rates of about 1 to 15 cm/year. A few locations can have the subsidence rates up to about 20-25 cm/year. There are four different types of land subsidence that can be expected to occur in the Jakarta basin, namely: subsidence due to groundwater extraction, subsidence induced by the load of constructions (i.e., settlement of high compressibility soil), subsidence caused by natural consolidation of alluvial soil and tectonic subsidence. It was found that the spatial and temporal variations of land subsidence depend on the corresponding variations of groundwater extraction, coupled with the characteristics of sedimentary layers and building loads above it. This paper discusses the relation between land subsidence and urban development activities in Jakarta. Key words: Jakarta, Land Subsidence, Urban Development, Leveling, GPS , InSAR
Introduction

Indonesia Country Report IUGG General Assembly
Melbourne, Australia June 28 – July 7, 2011
60
The city of Jakarta has a population of about 9 million people [BPS Jakarta, 2007], inhabiting an area of about 661.52 km2. During the day, the population can increase to about 13 million. Jakarta is centered at the coordinates of about -6o 15' (latitude) and +106o 50' (longitude) and, located on the lowland of the northern coast of the West Java province, as shown in Figure 1.
Figure 1. Jakarta and its surrounding areas
The area is relatively flat, with the topographical slopes ranging between 0o and 2o in the northern and central parts, and between 0o and 5o in the southern part. The southernmost area of Jakarta has an altitude of about 50 m above mean sea level (MSL).
Regionally speaking, Jakarta is a lowland area which has five main landforms, namely [Rimbaman and Suparan, 1999; Sampurno, 2001]: (1) Volcanic alluvial fan landforms, which are located in the southern part; (2) Landforms of marine-origin, which are found in the northern part adjacent to the coastline; (3) Beach ridge landforms, which are located in the northwest and northeast parts; (4) Swamp and mangrove swamp landforms, which are encountered in the coastal fringe; and (5) Former channels, which run perpendicular to the coastline. There also 13 natural and artificial rivers flowing through Jakarta, namely Cisadane, Citarum, Ciliung, Angke, Krukut, Sunter, Bekasi, Cakung, Karawang, Cikarang, Ciranjang, Cimancuri and Cidurian.
In terms of geological and hydrological settings, according to Yong et al. (1995), the Jakarta basin consists of a 200 to 300 m thick sequence of Quaternary deposits which overlies Tertiary sediments. The top sequence is thought to be the base of the groundwater basin. The Quaternary sequence can be further subdivided into three major units, which, in ascending order are: a sequence of Pleistocene marine and non-marine sediments, a late Pleistocene volcanic fan deposit, and Holocene marine and floodplain deposits. Three aquifers are recognized inside a 250 m thick sequence of quaternary sediment of the Jakarta basin, namely [Soetrisno et al.,1997; Hadipurwo,1999] : the Upper Aquifer, an unconfined aquifer, occurs at a depth of less than 40 m; the Middle Aquifer, a confined aquifer, occurs at a depth between 40 and 140 m; and the Lower Aquifer, a confined aquifer, occurs at a depth between 140 and 250 m. Inside those aquifers, the groundwater generally flows from south to the north [Lubis et al., 2008]. Below a depth of 250 m, an aquifer in the tertiary sediment was also

Indonesia Country Report IUGG General Assembly
Melbourne, Australia June 28 – July 7, 2011
61
found. But according to Murdohardono and Tirtomihardjo (1993), it is less productive and its water quality is relatively poor.
Figure 2. Urban development and land subsidence relation in Jakarta
In the last three decades, urban development of Jakarta and its surrounding areas
has grown very rapidly in the sectors of industry, trade, transportation, real estate and many others. This exponentially increase urban development introduce several environmental problems. According to [Firman and Dharmapatni, 1994], this rapid urban development has caused several negative externalities, namely : (1) extensive conversion of prime agricultural areas into residential and industrial areas, (2) significant disturbance to main ecological function of the upland of Jakarta area as a water recharge area for Jakarta city, (3) increase in groundwater extraction due to development of industrial activities and the high population increase, (4) high concentrations of BOD and COD in most of the rivers flowing through the Jakarta area as a result of domestic, agricultural and industrial waste disposal, (5) solid waste disposal is now felt as a pressing problem, and (6) the air pollution in Jakarta city has reached a critical point reflected in more evident acid rain. The first three negative impacts will contribute to land subsidence phenomena in several places in Jakarta. The resulted land subsidence will also then affect the urban development plan and process. Figure 2 illustrates the possible relation between land subsidence and urban development in Jakarta.
Land subsidence is a real phenomenon in Jakarta. Over the period of 1982–1997, subsidence ranging from 20 to 200 cm is evident in several places in Jakarta. In general the land subsidence exhibits spatial and temporal variations, with the rates of about 1 to 15 cm/year. A few locations can have the subsidence rates up to about 20-25 cm/year. It was found that the spatial and temporal variations of land subsidence depend on the corresponding variations of groundwater extraction, coupled with the characteristics of sedimentary layers and building loads above it. In the following sub-chapters, the relation between land subsidence and urban development activities in Jakarta will be discussed and analyzed.
Indonesia Country Report IUGG General Assembly
Melbourne, Australia June 28 – July 7, 2011
62
Land Subsidence In Jakarta
Land subsidence is not a new phenomenon for Jakarta, the capital city of Indonesia. It has been reported for many years that several places in Jakarta are subsiding at different rates [Murdohardono & Tirtomihardjo, 1993; Murdohardono & Sudarsono, 1998; Rajiyowiryono, 1999]. The impact of land subsidence in Jakarta could be seen in several forms, such as cracking of permanent constructions and roads, changes in river canal and drain flow systems, wider expansion of flooding areas, malfunction of drainage system, increased inland sea water intrusion and increased tidal flooding coverage. Based on several studies [Murdohardono and Sudarsono, 1998; Rismianto and Mak, 1993; Harsolumakso, 2001; Hutasoit, 2001], there are four different types of land subsidence that can be expected to occur in the Jakarta basin, namely: subsidence due to groundwater extraction, subsidence induced by the load of constructions (i.e. settlement of high compressibility soil), subsidence caused by natural consolidation of alluvium soil, and geotectonic subsidence. The first three are thought to be the dominant types of land subsidence in Jakarta basin.
In the case of Jakarta, the comprehensive information on the characteristics of land subsidence is important for several tasks (see Figure 3), such as spatial-based groundwater extraction regulation, effective control of flood and seawater intrusion, conservation of environment, design and construction of infrastructures, and spatial development planning.
Considering the importance of land subsidence information for supporting the development activities in Jakarta area, monitoring and studying the characteristics of subsidence phenomena becomes necessary.
Since the early 1980's, the land subsidence in several places of Jakarta has been measured using several measurement techniques, e.g. leveling surveys, extensometer measurements, ground water level observations, GPS surveys, and InSAR technique [Abidin, 2005; Abidin et al., 2001, 2004, 2008a, 2008b]. The prediction of ground subsidence, based on certain models incorporating geological and hydrological parameters of Jakarta, has also been investigated [Murdohardono and Tirtomihardjo, 1993; Yong et al., 1995; Purnomo etal., 1999].
The results obtained from leveling surveys, GPS surveys and InSAR technique over the period between 1982 and 2008 show that land subsidence in Jakarta has spatial and temporal variations. In general the observed subsidence rates are about 1 to 15 cm/year, and can be up to 20-25 cm/year at certain location and certain period. The summary of subsidence rates in Jakarta is given in Table 1. The more comprehensive results can be seen in Abidin et al. (2001, 2008a, 2008b).
Table 1. Observed subsidence rates in Jakarta; the rates vary both spatially and temporally.

Indonesia Country Report IUGG General Assembly
Melbourne, Australia June 28 – July 7, 2011
63
Method Period Subsidence Rates (cm/year)
1982 - 1991 0 - 9 Leveling surveys
1991 - 1997 0 - 25
GPS surveys 1997 - 2008 0 - 25
InSAR 2006 - 2007 0 - 12
Urban Development And Land Subsidence
Land subsidence in Jakarta can be caused by four factors, namely: excessive
groundwater extraction, load of buildings and constructions, natural consolidation of alluvium soil, and tectonic activities. Up to now, there is no information yet about the contribution of each factor on the subsidence at each location and their spatial (contribution) variation. In case of Jakarta, tectonic activities seem to be the least dominant factor, while excessive groundwater extraction is considered to be one of dominant factor. The first three factors will have close relation with urban development activities in Jakarta and its surrounding areas.
Increase in Population and Built-up Areas Urban development in Jakarta is going-on rapidly. According to [Firman and
Dharmapatni, 1994], Jakarta has been the most attractive area in Indonesia for domestic and direct foreign investment because of its better infrastructure, high concentration and access to mass markets, pool of skilled labour and entrepreneurs and high access to the decision makers.
The economic activities in
the region have grown very rapidly, especially in industry, trade, transportation, real-estate, and many other sectors; and have also spilled over into the adjacent areas, such as Bogor, Tangerang, Depok and Bekasi. It then increases the urbanization rates into Jakarta and surrounding areas, and population of Jakarta growth rapidly. Consequently, coverage

Indonesia Country Report IUGG General Assembly
Melbourne, Australia June 28 – July 7, 2011
64
of the built-up areas is increased and the green areas are decreased. Nowadays, most areas of Jakarta are built-up areas, as shown in Figure 3.
Figure 3. Built-up areas of Jakarta in 2008,
which cover about 90% of the region.
According to [Lo and Yeung, 1995], in 1948 the population of Jakarta was about 2 million, with a built-up area of 20,000 ha, including Kebayoran Baru, a new town in the south. In 1965 the population of Jakarta was about 4 million, with a built-up area of 35,000 ha. By 1980, Jakarta occupied 65,400 ha with a population of 6.5 million, and it was by this time that the influence of the city on the region (rather than simply on its fringes) was clearly demonstrated. The 1990 Population Census showed that Jakarta had 8.2 million inhabitants. The population growth of Jakarta is shown in Table 2. In 2006, the population density has reached about 13,500 peoples/km2, which make Jakarta the densest region in Indonesia.
Table 2. Population growth of Jakarta [Lo and Yeung, 1995; BPS Jakarta, 2007]
Year Population ('000) Year Population ('000)
1948 �2,000 2002 8,379
1961 2,973 2003 8,603
1971 4,579 2004 8,725
1980 6,503 2005 8,864
1990 8,259 2006 8,961
The increase in population and urban development activities in Jakarta lead to
increase in built-up areas and decrease in green areas. New residential areas, industries, condominiums, malls, hotels, commercials and office buildings have proliferated in Jakarta in the last three decades. In 2006, there are already 306 hotels, in which 135 are star (classified) hotels; and 1955 large and medium manufacturing companies in Jakarta [BPS Jakarta, 2007].
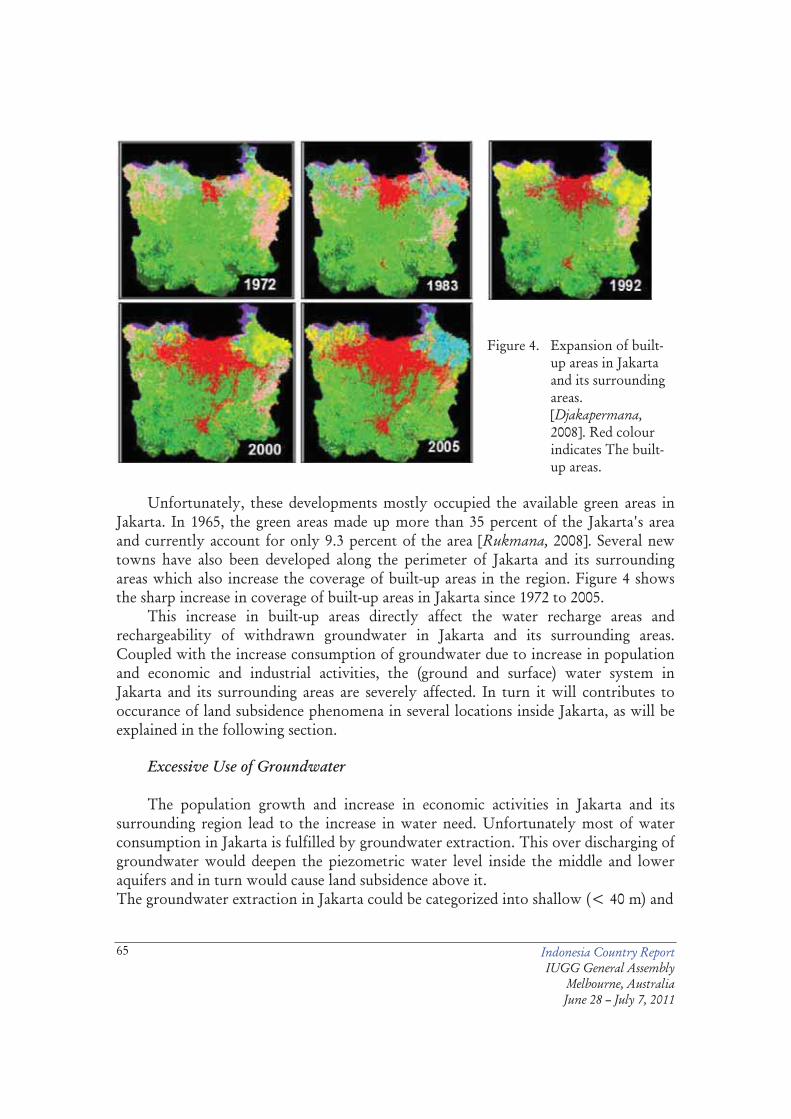
Indonesia Country Report IUGG General Assembly
Melbourne, Australia June 28 – July 7, 2011
65
Figure 4. Expansion of built-up areas in Jakarta and its surrounding areas. [Djakapermana, 2008]. Red colour indicates The built-up areas.
Unfortunately, these developments mostly occupied the available green areas in
Jakarta. In 1965, the green areas made up more than 35 percent of the Jakarta's area and currently account for only 9.3 percent of the area [Rukmana, 2008]. Several new towns have also been developed along the perimeter of Jakarta and its surrounding areas which also increase the coverage of built-up areas in the region. Figure 4 shows the sharp increase in coverage of built-up areas in Jakarta since 1972 to 2005.
This increase in built-up areas directly affect the water recharge areas and rechargeability of withdrawn groundwater in Jakarta and its surrounding areas. Coupled with the increase consumption of groundwater due to increase in population and economic and industrial activities, the (ground and surface) water system in Jakarta and its surrounding areas are severely affected. In turn it will contributes to occurance of land subsidence phenomena in several locations inside Jakarta, as will be explained in the following section.
Excessive Use of Groundwater
The population growth and increase in economic activities in Jakarta and its surrounding region lead to the increase in water need. Unfortunately most of water consumption in Jakarta is fulfilled by groundwater extraction. This over discharging of groundwater would deepen the piezometric water level inside the middle and lower aquifers and in turn would cause land subsidence above it. The groundwater extraction in Jakarta could be categorized into shallow (< 40 m) and

Indonesia Country Report IUGG General Assembly
Melbourne, Australia June 28 – July 7, 2011
66
deep (> 40 m) extraction. Shallow extraction is through dug wells or driven wells, operated with buckets, hand pumps or small electrical pumps; whereas the deep extraction is mostly from drilled wells. Shallow extraction is mostly done by the population. It is well spread over the area, but its extraction rate per well is relatively low. Deep extraction is usually conducted by industry. It is usually more concentrated, and has a relatively high extraction rate per well. According to Sudibyo (1999), the number of registered drilled wells in Jakarta was 3626 wells in 1998. Based on the studies done by Murdohardono and Tirtomihardjo (1993), from the sample of 197-drilled wells in Jakarta, out of 2800 registered drilled wells at that time, 156 wells (79%) are extracting groundwater from depths between 40 m and 140 m, and 41 wells (21%) are extracting from depths between 140 m and 250 m.
The registered groundwater extraction in Jakarta varies from just 3 Qabs (million m3) in 1900 up to maximum of 33.8 Qabs in 1994, and then down to 16.9 Qabs in 1998. It should pointed out here that, these numbers may not reflect the real groundwater extraction in Jakarta basin. According to Soetrisno (1997) the unregistered deep groundwater extraction in Jakarta can be as high as 50% or even more. This excessive groundwater pumping will usually lead to the deepening of the piezometric water level inside the middle and lower aquifers. According to Soetrisno, et al. (1997), the piezometric level in North Jakarta has changed from 12.5 m above sea level in 1910 to about sea level in 1970's, and then deepened significantly to 30-50 m below sea level in 1990's.
The subsidence rate is closely related to the rate of piezometric water level (head) deepening in the middle and lower aquifers. In the case of Jakarta, the increases in both population and industry, which require a lot of groundwater, could explain the above declining trend of piezometric heads, as shown in Figure 5.
The corelation between land subsidence and excessive groundwater taking in Jakarta can be illustrated using the subsidence results obtained from leveling surveys. Figure 9 shows the observed land subsidence during the period of 1982-1991 and 1991-97. Maximum subsidence during the period of 1982-1991 is about 80 cm, while for the period of 1991-97 is about 160 cm. In general the subsidence rates in Jakarta area during this period is about 1-5 cm/year and can reach 26 cm/year at several locations. During the period between 1982 and 1991, the maximum rate of subsidence is about -8 cm/year, while during the period between 1991 and 1997 it is about -26 cm/year. More comprehensive results on leveling-based subsidence in Jakarta can be seen in Abidin et al. (2001).

Indonesia Country Report IUGG General Assembly
Melbourne, Australia June 28 – July 7, 2011
67
Figure 5. Piezometric water level contours (in metres) inside Middle and Lower Aquifers
of Jakarta in 1992; adapted from [Murdohardono and Tirtomihardjo, 1993].
If we compare Figures 5 and 6 it can be realized that the cones of piezometric level depressions inside the middle and lower aquifers more or less coincide with the cones of largest land subsidence measured by the leveling. It should also be noted here that in those areas of subsidence cones, due to their high soil compressibility the situation could be worse with the settlement caused by the load of constructions.
Figure 6. Land subsidence in Jakarta measured from leveling surveys (in metres), Over
the periods of 1982 – 1991 (left) and 1991 – 1997 (right) [Abidin et al, 2001]. The groundwater level inside the middle and lower at several locations in Jakarta are seems still decreasing up to now. The groundwater level are decreasing with the rates of about 0.2 to 2 m/year over the period of 2002 to 2007 [Abidin et al., 2008b]. In comparison with GPS derived subsidences, it can be seen that the large subsidences are usually associated with the realtively high rates of groundwater level change rates. A

Indonesia Country Report IUGG General Assembly
Melbourne, Australia June 28 – July 7, 2011
68
more detail explanation on GPS derived subsidence and its relation with groundwater extraction is given in [Abidin et al 2008a; 2008b].
Coastal Development
Coastal area of Jakarta has also experienced extensive urban development. Many establish-ments take places in this coastal region, such as sea port, coastal resort, golf course, residential areas, industries, condominiums, malls, hotels, and commercials and office buildings. Some areas haev also been reclaimed to accomodate more coastal development initiatives. It should be pointed out, that the observed land subsidences along the coastal areas of Jakarta are relatively have larger rates. Therefore it will somehow affect the coastal development of Jakarta.
Figure 7. Part of coastal areas of Jakarta.

Indonesia Country Report IUGG General Assembly
Melbourne, Australia June 28 – July 7, 2011
69
Figure 8 shows land subsidence in northern part of Jakarta detected by InSAR over the period of June 2006 to February 2007. This Figure shows that subsidence along the coastal zone of Jakarta has a spatial variation, with subsidence rates can reach about 12 cm/year. Please note in this Figure, that one cone of deepest subsidence is located in Pantai Mutiara housing complex, which is actually a land reclamation area. The GPS derived subsidence result (see Figure 9) also show the relatively higher subsidence rates in the western and central parts of Jakarta coastal areas, during the period of Sept. 2007 to August 2008.
Figure 8. InSAR-derived subsidence in the northern part
of Jakarta using ALOS PALSAR data.
Considering the sea level rise phenomena, coastal subsidence in Jakarta will certainly affect coastal development in Jakarta. Considering the relatively flat nature (i.e. 0-2 m above MSL) of most coastal areas of in Jakarta, this combined effect of land subsidence and sea level rise will certainly be have disastrous consequences for habitation, industry, and fresh groundwater supplies from costal aquifers. During high tides, tidal flooding is already affecting some of these coastal areas. The extent and magnitude of subsidence related flooding will worsen with the likely
Figure 9. GPS derived subsidence during the
period of Sept. 2007 to August

Indonesia Country Report IUGG General Assembly
Melbourne, Australia June 28 – July 7, 2011
70
continuation of sea level rise along the coastal area of Jakarta, which is bordered by the Java sea.
2008.
By utilizing the InSAR derived subsidence as shown in Figure 8 and the sea level rise rate of 2 mm/year [Gornitz, 1995; IPCC, 2007], the possible inundated areas can be estimated as shown in Figure 10.
Inundation areas in 2020 (in black); covering about 5,146.80 hectares
Inundation areas in 2050 (in black); covering about 16,237.87 hectares
Figure 10. Possible inundation areas in the coastal areas of Jakarta; with the assumption of spatially different subsidence rates along the coast and sea level rise rate of 2 mm/year.
Impacts of Subsidence to Urban Development
Impacts caused by land subsidence to urban development in Jakarta can be seen in several forms. The differential subsidence nature in Jakarta basin my introduce the cracking and damage in buildings and infrastructure and may change the flow pattern of surface water. Subsidence may also enlarge the (tidal) flooding inundation areas, and in general will deteriorate their environmental quality. Subsidence along several coastal areas of Jakarta also makes them more vulnerable toward sea level rise phenomena. Figure 11 shows several indications of land subsidence phenomena in Jakarta.
In case of Jakarta, which is actually prone toward flooding, subsidence phenomena has to be fully understood for flood management system. During the period between 1993 and 2007, at least there are four big floods in Jakarta, namely on 9-10 January 1993, February 1996, 26 January - 1 February 2002, and 4 – 14 February 2007. Figure 12 shows in general the flood inundation areas of the 2002 and 2007 flooding.
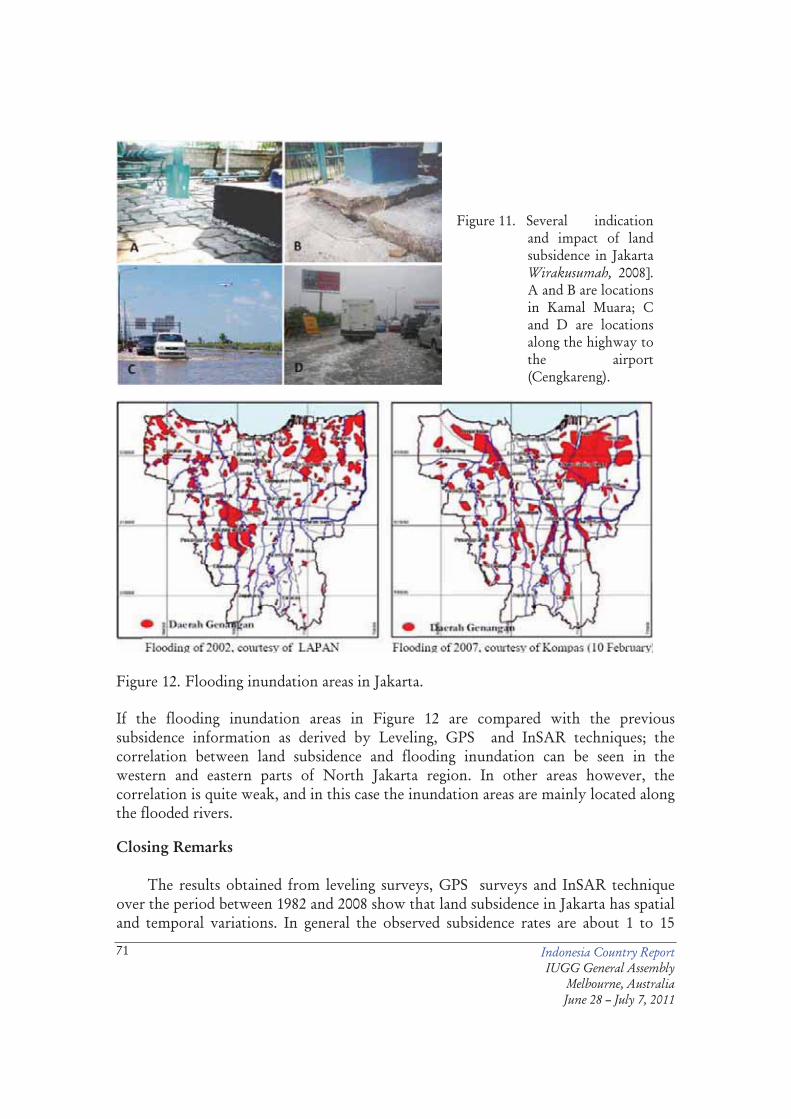
Indonesia Country Report IUGG General Assembly
Melbourne, Australia June 28 – July 7, 2011
71
Figure 11. Several indication and impact of land subsidence in Jakarta Wirakusumah, 2008]. A and B are locations in Kamal Muara; C and D are locations along the highway to the airport (Cengkareng).
Figure 12. Flooding inundation areas in Jakarta.
If the flooding inundation areas in Figure 12 are compared with the previous subsidence information as derived by Leveling, GPS and InSAR techniques; the correlation between land subsidence and flooding inundation can be seen in the western and eastern parts of North Jakarta region. In other areas however, the correlation is quite weak, and in this case the inundation areas are mainly located along the flooded rivers.
Closing Remarks
The results obtained from leveling surveys, GPS surveys and InSAR technique over the period between 1982 and 2008 show that land subsidence in Jakarta has spatial and temporal variations. In general the observed subsidence rates are about 1 to 15

Indonesia Country Report IUGG General Assembly
Melbourne, Australia June 28 – July 7, 2011
72
cm/year, and can be up to 20-25 cm/year at certain location and certain period. There is a strong indication that land subsidence in Jakarta area is governed by the excessive groundwater extraction from the middle and lower aquifers, besides also by building/construction load and natural consolidation of sedimentary layers. The excessive groundwater extraction causes the rapid decrease in groundwater level inside the aquifers, and in turn cause the land subsidence above it. However, the relation between land subsidence and groundwater level decrease inside the acquifers in certain location will not always be a direct and simple relation.
Land subsidence in Jakarta has a strong linkage with urban development process. Urban development in Jakarta causes increases in built-up areas, population, economic and industrial activities, and also groundwater extraction. These increases can then lead to land subsidence phenomena. In other side, the existing land subsidence phenomena will affect and should be considered in urban development process itself. In this case, land use planning, groundwater extraction regulation, building and infrastructure codes, flood management and control, and seawater intrusion control; are examples of several urban development aspects that will be related with land subsidence phenomena.
Finally it can be concluded that more data and further investigation is required to understand the detail and comprehensive relationship between land subsidence and urban development in the Jakarta basin. Additional causes of subsidence, e.g. load of buildings and construction, natural consolidation of alluvium soil, and tectonic movements, should also investigated and taken into account. Further research on the impacts of land subsidence in Jakarta should also be systematically conducted, especially in relation with the flooding inundation areas; and also with the coastal flooding in relation with sea level rise phenomena. References
Abidin, H.Z. (2005). “ Suitability of Levelling, GPS and INSAR for Monitoring Land Subsidence in Urban Areas of Indonesia”. GIM International. The Global Magazine for Geomatics, GITC Publication, Volume 19, Issue 7, July, pp. 12-15.
Abidin, H.Z. (2007). GPS Positioning and Apllications. In Indonesian languange. P.T. Pradnya Paramita, Jakarta. Edisi ke 3. ISBN 978-979-408-377-2. 398 pp.
Abidin, H. Z., R. Djaja, D. Darmawan, S. Hadi, A. Akbar, H. Rajiyowiryono, Y. Sudibyo, I. Meilano, M. A. Kusuma, J. Kahar, C. Subarya (2001). "Land Subsidence of Jakarta (Indonesia) and its Geodetic-Based Monitoring System." Natural Hazards. Journal of the International Society of the Preventation and Mitigation of Natural Hazards, Vol. 23, No. 2/3, March, pp. 365 - 387.
Abidin, H.Z., A. Jones, J. Kahar (2002). GPS Surveying. In Indonesian languange. P.T. Pradnya Paramita, Jakarta. ISBN 979-408-380-1. Edisi ke 2. 280 pp.

Indonesia Country Report IUGG General Assembly
Melbourne, Australia June 28 – July 7, 2011
73
Abidin, H.Z., R. Djaja, H. Andreas, M. Gamal, Indonesia K. Hirose, Y. Maruyama (2004). Capabilities and Constraints of Geodetic Techniques for Monitoring Land Subsidence in the Urban Areas of Indonesia”. Geomatics Research Australia. No.81, December, pp. 45-58.
Abidin, H.Z. , H. Andreas, R. Djaja, D.Darmawa and M. Gamal (2008a). “Land subsidence characteristics of Jakarta between 1997 and 2005, as estimated using GPS surveys”, GPS Solutions, Springer Berlin / Heidelberg, Vol. 12, No. 1, pp. 23-32.
Abidin,H.Z., H. Andreas, M. Gamal, P. Susanti, L. Hutasoit, Y. Fukuda, T. Deguchi, Y. Maruyama (2008b). “Land Subsidence Characteristics of the Jakarta Basin (Indonesia) as Estimated from Leveling, GPS and InSAR and its Relation with Groundwater Extraction”, Paper to be presented at the XXXVI IAH Congress in Toyama Japan, 26 Oct. – 1 Nov. 2008.
Beutler G, Bock H, Brockmann E, Dach R, Fridez P, Gurtner W, Hugentobler U, Ineichen D, Johnson J, Meindl M, Mervant L, Rothacher M, Schaer S, Springer T, Weber R (2001), “Bernese GPS software Version 4.2”, In: Hugentobler U, Schaer S, Fridez P (eds) Astronomical Institute, University of Berne, 515pp.
BPS Jakarta (2007). “Jakarta Dalam Angka 2007”, Katalog BPS: 1403.31, Badan Pusat Statistik Propinsi DKI Jakarta, 520 pp.
Deguchi, T. (2005). Automatic InSAR processing and introduction of its application studies. Proceedings the 26th Asian Conference on Remote Sensing, Hanoi, Vietnam.
Deguchi, T., M. Kato, H. Akcin and H.S. Kutoglu (2006). Automatic processing of Interferometric SAR and accuracy of surface deformation measurement. SPIE Europe Remote Sensing, Stockholm, Sweden.
Djakapermana, R.D. (2008). “Kebijakan Penataan Ruang Jabodetabekjur”, Paper dipresentasikan pada Seminar Sehari Memperingati Hari Air Sedunia, Kelompok Keahlian Teknologi Pengelolaan Lingkungan, FTSL ITB, Bandung, 31 Maret 2008.
Firman, T. and I.A.I. Dharmapatni (1994). “The challenges to suistanaible development in Jakarta metropolitan region”, Habitat International, Vol. 18, No. 3, pp.79-94.
Gornitz, V. (1995). "Sea-level rise: A review of recent past and near-future trends." Earth Surf. Proc. Landforms 20, pp. 7-20.
Hadipurwo,S. (1999). "Groundwater." In COASTPLAN JAKARTA BAY PROJECT, Coastal Environmental Geology of the Jakarta Reclamation Project and Adjacent Areas, CCOP COASTPLAN Case Study Report No. 2, Jakarta/Bangkok, pp. 39 - 49.

Indonesia Country Report IUGG General Assembly
Melbourne, Australia June 28 – July 7, 2011
74
Harsolumakso, A.H. (2001). “Struktur Geologi dan Daerah Genangan”, Buletin Geologi, Vol. 33, No. 1, pp. 29-45.
Hutasoit, L.M. (2001). “Kemungkinan Hubungan antara Kompaksi Alamiah Dengan Daerah Genangan Air di DKI Jakarta”, Buletin Geologi, Vol. 33, No. 1, pp. 21-28.
IPCC (2007). ”Climate Change 2007: The Physical Science Basis, Summary for Policymakers”, Report of Intergovernmental Panel On Climate Change, Can be accessed at: http://www.ipcc.ch/.
Leick, A. (2003). GPS Satellite Surveying. John Wiley & Sons, Third edition, New York, ISBN 0471059307, 435 pp.
Lo, Fu-chen and Yue-man Yeung [Eds] (1995). Emerging World Cities in Pacific Asia. United Nations University Press, Tokyo, ISBN 92-808-0907-5, http://www.unu.edu/unupress/unupbooks/uu11ee/uu11ee15.htm
Lubis, R.F., Y. Sakura and R. Delinom (2008). “Groundwater recharge and discharge processes in the Jakarta groundwater basin, Indonesia”, Hydrogeology Journal, Springer, DOI 10.1007/s10040-008-0278-1
Massonnet, D. and K.L. Feigl (1998). "Radar Interferometry and its Application to Changes in the Earth's Surface." Reviews of Geophysics, Vol. 36, No. 4, November, pp. 441-500.
Murdohardono, D. and H. Tirtomihardjo (1993). "Penurunan tananh di Jakarta dan rencana pemantauannya." Proceedings of the 22nd Annual Convention of the Indonesian Association of Geologists, Bandung, 6-9 December, pp. 346 - 354.
Murdohardono,D. and U. Sudarsono (1998). "Land subsidence monitoring system in Jakarta." Proceedings of Symposium on Japan-Indonesia IDNDR Project : Volcanology, Tectonics, Flood and Sediment Hazards, Bandung, 21-23 September, pp. 243 - 256.
Purnomo, H., D. Murdohardono, and H. Pindratno (1999). "Land Subsidence Study in Jakarta." Proceedings of Indonesian Association of Geologists, Volume IV : Development in Engineering, Environment, and Numerical Geology, Jakarta, 30 Nov.-1 Dec., pp. 53-72.
Rajiyowiryono, H. (1999). "Groundwater and Landsubsidence Monitoring along the North Coastal Plain of Java Island.". CCOP Newsletter, Vol. 24, No. 3, pp.19, July-September.
Rimbaman and P. Suparan (1999). "Geomorphology." In COASTPLAN JAKARTA BAY PROJECT, Coastal Environmental Geology of the Jakarta Reclamation Project and Adjacent Areas, CCOP COASTPLAN Case Study Report No. 2, Jakarta/Bangkok, pp. 21-25.

Indonesia Country Report IUGG General Assembly
Melbourne, Australia June 28 – July 7, 2011
75
Rismianto,D. and W. Mak (1993). "Environmental aspects of groundwater extraction in DKI Jakarta: Changing views." Proceedings of the 22nd Annual Convention of the Indonesian Association of Geologists, Bandung, 6-9 December, pp. 327 - 345.
Rukmana, D. (2008). “Decreasing Green Areas in Jakarta”, The Jakarta Post, March 17, 2008, http://www.thejakartapost.com/news/2008/03/16/decreasing-green-areas-jakarta.html
Sampurno (2001). “Geomorfologi dan Daerah Genangan DKI Jakarta”, Buletin Geologi, Vol. 33, No. 1, pp. 1-12.
Schreier, G. (Ed.) (1993). SAR Geocoding: Data and Systems. Wichmaann Verlag, Karlsruhe, ISBN 3-87907-247-7, 435 pp.
Soetrisno,S., Satrio H., and Haryadi T. (1997). "To Anticipate Impacts of Reclamation of Jakarta Bay, A Groundwater Conservation's Perspective." Paper presented at Workshop on Coastal and Nearshore Geological/Oceanographical Assessment of Jakarta Bay : A Basis for Coastal ZoneManagement and Development, Jakarta, 25 - 28 June.
Wirakusumah, A.D. (2008). “Pemanfaatan Air Tanah di Perkotaan”, Paper dipresentasikan pada Seminar Sehari Memperingati Hari Air Sedunia, Kelompok Keahlian Teknologi Pengelolaan Lingkungan, FTSL ITB, Bandung, 31 Maret 2008.
Yong,R.N., E. Turcott, and H. Maathuis (1995). "Groundwater extraction-induced land subsidence prediction: Bangkok and Jakarta case studies." Proceedings of the Fifth International Symposium on Land Subsidence, IAHS Publication no. 234, October, pp. 89-97.
Biographical Notes
Prof. Dr. Hasanuddin Z. Abidin, is a Professor and Head of Geodesy Research Division, Faculty of Earth Science and Technology, Institute of Technology Bandung, Indonesia. He obtained his Insinyur degree from Dept. of Geodetic Engineering, ITB in 1985, and his MSc.Eng and PhD degrees from the Department of Geodesy and Geomatics Engineering (previously Dept. of Surveying Engineering), Univ. of New Brunswick, Canada, in 1989 and 1992 respectively. His academic background is related to the theory and applications of satellite geodesy; and his research works up to the present times includes the following areas, namely : ambiguity resolution of GPS signals; the use of GPS system for geodetic surveying, land surveying, cadastral surveying, and marine applications; use of GPS survey method for monitoring volcano deformation, land subsidence, landslide, and dam deformation; geodetics aspects of the international boundary; and integration of GPS and INSAR for deformation study.
Contacts

Indonesia Country Report IUGG General Assembly
Melbourne, Australia June 28 – July 7, 2011
76
Prof. Dr. Hasanuddin Z. Abidin Geodesy Research Division Faculty of Earth Science and Technology Institute of Technology Bandung, Jl. Ganesa 10 Bandung INDONESIA Tel. + 62-22-2534286 Fax + 62-22-2534286 Email: [email protected] and [email protected] Web site: http://geodesy.gd.itb.ac.id/hzabidin

Indonesia Country Report IUGG General Assembly
Melbourne, Australia June 28 – July 7, 2011
77
Land subsidence characteristics of Jakarta between 1997 and 2005, as estimated using GPS surveys
Hasanuddin Z. Abidin, H. Andreas, Rochman Djaja, Dudy Darmawan, M. Gamal
Abstract Jakarta is the capital city of Indonesia with a population of about 12 million people, inhabiting an area of about 625 km2. It is well known that several areas in Jakarta are subsiding rapidly. There are four different types of land subsidence that can be expected to occur in the Jakarta basin, namely: subsidence due to groundwater extraction, subsidence induced by the load of constructions (i.e., settlement of high compressibility soil), subsidence caused by natural consolidation of alluvial soil and tectonic subsidence. In addition to the leveling method, Global Positioning System (GPS) survey methods have been used to study land subsidence in Jakarta. In this paper, we characterize subsidence in the Jakarta basin using eight episodic/campaign GPS surveys between 1997 and 2005. The estimated subsidence rates are 1–10 cm/year. The observed subsidence rates in several locations show a positive correlation with known abstraction volumes of groundwater extraction. These basin-wide series of GPS measurements show how this type of measurement can play an important role in multiple public policy decision making in this rapidly growing area. Keywords: Jakarta, Land subsidence, GPS , Groundwater Introduction
Jakarta’s population is about 10 million people, covering an area of about 650 km2. Jakarta is centered at about 6°15�S and +106°50�E and located on the lowland of the northern coast of the West Java province, as shown in Figure 1. The area is relatively flat, with topographical slopes ranging between 0° and 2° in the northern and central parts, and between 0° and 5° in the southern part. The southernmost area of Jakarta has an altitude of about 50 m above mean sea level.
Jakarta is a lowland area with five main landforms (Rimbama and Suparan 1999): (1) alluvial landforms (southern part). (2) Landforms of marine-origin (northern part adjacent to the coastline). (3) Beach ridge landforms (northwest and northeast parts). (4) Swamp and mangrove swamp landforms (coastal fringe). (5) Former channels (perpendicular to the coastline). There are about 13 natural and artificial rivers flowing through Jakarta, of which the main rivers, such as Ciliwung, Sunter, Pesanggrahan, Grogol and their tributaries, form the main drainage system of Jakarta.
Land subsidence is not a new phenomenon for Jakarta. The occurrence of land subsidence was recognized in 1926. Evidence for subsidence was based on repeated

Indonesia Country Report IUGG General Assembly
Melbourne, Australia June 28 – July 7, 2011
78
leveling measurements conducted in the northern part of Jakarta (Schepers 1926; Suharto 1971). Unfortunately, the investigation of land subsidence using leveling was not repeated for 50 years until 1978. Starting in 1978, the impact of land subsidence in Jakarta could be seen in several ways, such as the cracking of permanent constructions located around the center of the Jakarta area (along Thamrin Street), the wider expansion of flooding areas, the lowering of the groundwater level and increased inland seawater intrusion. According to the Local Mines Agency, over the period of 1982–1997, subsidence ranging from 20 to 200 cm is evident in several places in Jakarta.
Figure 1 Jakarta basin
It has been reported for many years that several places are subsiding at different rates (Murdohardono and Tirtomihardjo 1993; Murdohardono and Sudarsono 1998; Rajiyowiryono 1999; Abidin et al. 2001). Considering this significant amount of subsidence and its wide impact on many developmental and environmental aspects, a systematic and continuous monitoring of land subsidence in Jakarta is obviously needed and is critical to the welfare of the city.
In the case of Jakarta, the comprehensive information on the characteristics of
land subsidence is important for several tasks (see Figure 2), such as spatial-based groundwater extraction regulation, effective control of flood and seawater intrusion, conservation of environment, design and construction of infrastructures and spatial development planning.
According to Murdohardono and Sudarsono (1998) and Rismianto and Mak (1993), there are four different types of land subsidence that can be expected to occur in the Jakarta basin, namely, subsidence due to groundwater extraction, subsidence induced by the load of constructions (i.e., settlement of high compressibility soil), subsidence caused by natural consolidation of alluvial soil and geotectonic subsidence. From those types of subsidence, the main spectrum of land subsidence in Jakarta is thought to be caused by groundwater extraction. Excessive groundwater extraction will lead to the deepening of groundwater level (piezometric head), which in turn will cause land subsidence and also seawater intrusion (Soekardi et al. 1986).

Indonesia Country Report IUGG General Assembly
Melbourne, Australia June 28 – July 7, 2011
79
Figure 2 The importance of land subsidence information
Since the early 1980s, land subsidence in several places of Jakarta has been measured using several measurement techniques, e.g., leveling surveys, extensometer measurements, groundwater level observations and Global Positioning System (GPS) surveys (Abidin et al. 2004). The prediction of ground subsidence, based on certain models incorporating geological and hydrological parameters of Jakarta, has also been investigated (Murdohardono and Tirtomihardjo 1993; Yong et al. 1995; Purnomo et al. 1999).
This paper describes the characteristics of land subsidence in Jakarta basin during the period of 1997–2005, as observed by GPS surveys.
GPS surveys for land subsidence study in Jakarta
The use of GPS satellite-based positioning system to systematically establish
geodetic control points over the Jakarta area was first conducted in 1994 by the National Land Agency (BPN). This GPS network is aimed at supporting cadastral mapping, and its design was not intended to monitor land subsidence.
Considering the higher cost saving and speed of simultaneous data collection of GPS surveys compared to leveling, the Department of Geodetic Engineering, Institute of Technology Bandung (ITB) decided to establish the new GPS network for monitoring land subsidence in the Jakarta basin, with some stations occupying points of the existing BPN network. The configuration of this GPS monitoring network is shown in Figure 3. Most of the stations (see Table 1) have reinforced concrete monuments with depths of about 1–2 m below the ground surface and were established between 1993 and 1995.
Station BAKO is the southernmost point in the network and is also the Indonesian zero order geodetic point. It is used as the reference point. BAKO is an IGS [International Global Navigation Satellite Systems (GNSS) Service] station, operated by the National Coordinating Agency for Survey and Mapping (BAKOSURTANAL).

Indonesia Country Report IUGG General Assembly
Melbourne, Australia June 28 – July 7, 2011
80
Based on IGS daily solutions of BAKO data from 2000 to 2006, as computed by the Jet Propulsion Laboratory (JPL 2007), the global velocities of BAKO during that period are –7.63 ± 0.04 mm/year in latitude, 25.38 ± 0.13 mm/year in longitude and 2.13 ± 0.23 mm/year in height. These velocities represent the global crustal motion of the Sunda Shelf block, where the BAKO station and the Jakarta basin are located. Using yearly GPS campaign data from 1991 to 1997 and 2001, Bock et al. (2003) estimated the horizontal velocity of the block as 6 ± 3 mm/year in SE direction relative to the Eurasian plate. Since BAKO and the Jakarta basin are located in the Sunda Shelf block, all GPS subsidence monitoring stations in the Jakarta basin will experience the same crustal motion velocities. This crustal motion is taking into account when defining the coordinates of BAKO. In this study, ITRF2000 is used as the reference frame for BAKO coordinates. Moreover, since BAKO is located in the southern part of the Jakarta basin, which is geologically located on more stable volcanic deposits (Yong et al. 1995; Rismianto and Mak 1993), it can be safely assumed for the purpose of this subsidence study that it is a relatively stable station. The monument of the BAKO station (see Figure 4) was built in 1981. It is made of reinforced concrete, 2 m depth, with an underground foundation of about 1.5 · 1.5 m. It is erected 50 cm above the ground with a width of about 40 x 40 cm.
Figure 3 GPS network for monitoring land subsidence in
Jakarta
The eight GPS surveys were conducted during December 1997, June 1999, June 2000, June 2001, October 2001, July 2002, December 2002 and September 2005. These surveys did not always occupy the same stations. The first survey started with 13 stations. The network then expanded subsequently to 27 stations. At certain epochs, some stations could not be observed due to the destruction of monuments or severe signal obstruction caused by growing trees and/or new construction.
The GPS surveys exclusively used dual-frequency geodetic- type GPS receivers. The length of the sessions was in general between 9 and11 h (see Table 1). The data were collected at 30 s intervals using an elevation mask of 15_. The data were processed

Indonesia Country Report IUGG General Assembly
Melbourne, Australia June 28 – July 7, 2011
81
using the software Bernese 4.2 (Beutler et al. 2001). Since we are mostly interested in the relative heights with respect to a stable point, the radial processing mode was used instead of a network adjustment mode. In this case, the relative ellipsoidal heights of all stations are determined relative to BAKO station.
Considering the length of the baselines of 40–50 km, a precise ephemeris was used instead of the broadcast ephemeris. The effects of tropospheric and ionospheric biases are mainly reduced by the differencing process and the use of dual-frequency observations. The residual tropospheric bias parameters for individual stations are estimated to further reduce the tropospheric effects. In the case of the residual ionospheric delay reduction, a local ionospheric modeling is implemented. The algorithms for the tropospheric parameter estimation and local ionospheric modeling can be found in Beutler et al. (2001). In processing baselines, most of the cycle ambiguities of the phase observations were successfully resolved.
The standard deviations of GPS -derived relative ellipsoidal heights from all surveys were in general better than 1 cm (see Figure 5). A few points have slightly larger standard deviations, due to the lack of observed data caused by the signal obstruction.
GPS-derived land subsidence in Jakarta
In using GPS surveys method, the height change Ddhij and its rate mDdhij at
each station are derived using the following relation:
)()( ijij tdhtdhdh �� (1)
)(/ jjijij ttdhdhv ��� (2) where dh(ti) and dh(tj) are the relative ellipsoidal heights with respect to BAKO, obtained from the ith and jth GPS surveys. Subsidence is represented by a negative value of �dhij. All GPS -derived ellipsoidal height changes and their rates, as obtained from GPS data collected by eight GPS surveys, are given in Tables 2 and 3.
In order to statistically check the significance of the subsidence values, we apply the general linear hypothesis test (Leick 2004) to the estimated height parameter. The null hypothesis of the test is that the estimated relative ellipsoid heights at epoch j equal the estimated value of the previous epoch i., i.e., no subsidence has occurred. Therefore,
null hypothesis Ho :����dhij = 0 (3) alternative hypothesis Ha :����dhij � 0 (4)
The test statistics for this test is

Indonesia Country Report IUGG General Assembly
Melbourne, Australia June 28 – July 7, 2011
82
ij
ij
dhdh
t��
���
(5)
which has the customary Student’s t distribution if Ho is true. The null hypothesis is rejected if
2/,dftt (6) where df is the degrees of freedom and is the significance level. In our case the degree of freedom is very large since the GPS baselines were derived using 8 to 10 hours of observations at 30 seconds interval. A t-distribution with infinite degree of freedom is identical to a normal distribution. At a confidence level of 99% (i.e. =1%), the critical value is t ���������� 2.576 .
Examples of GPS -derived land subsidence at several observing stations are shown in Figs. 6 and 7. In about seven years, i.e., December 1997–September 2005, the accumulated subsidence at several GPS stations is about 25–50 cm (see Figure 6). At other stations the subsidence ranges from 25 to 70 cm in five years, i.e., June 2001–September 2005 (see Figure 7). Based on the results shown in Figs. 6 and 7, it can be concluded that land subsidence rates in the Jakarta basin have both a spatial and a temporal variation. This indicates that the sources of land subsidence in Jakarta also differ spatially.
The estimated subsidence rates during the time December1997–September 2005 are 1–10 cm/year and reach 15–20 cm/year, as shown in Figure 8. The highest rates of land subsidence occur in northwestern Jakarta. The central and northeastern parts sometimes also show quite high rates of subsidence. Figure 8 shows more clearly the nature of spatial and temporal variation of land subsidence rates in the basin. These vertical temporal variations, however, may still be contaminated by annual/semiannual signal bias that plagues all GPS temporal measurements. Joint contributions from surface mass redistribution (atmosphere, ocean, snow and soil moisture) are the primary causes of the observed annual vertical variations of GPS -derived site positions (Dong et al. 2002; Blewitt and Lavallee 2002). By using long-term (~5 years) time-series of daily GPS solutions at eight stations, Ding et al. (2005) obtained the annual and semi-annual variations in height components with the weighted means of amplitudes of about 3.6 and 2.0 mm, respectively.
Table 1 GPS stations and observation times

Indonesia Country Report IUGG General Assembly
Melbourne, Australia June 28 – July 7, 2011
83
Figure 4 Monument of BAKO station
Figures 6, 7 and 8 suggest that the subsidence rates of stations over a certain observation period can slow down, accelerate or be relatively steady in comparison with the rates from the previous period. It indicates that the subsidence in the Jakarta basin is not homogeneous. The variability is due to a number of causal mechanisms, including excessive groundwater extraction, building load, sediment compaction and tectonic activities.
Our data set does not allow us to identify which of these causal mechanisms is most important or determine their spatial relationship across the basin.

Indonesia Country Report IUGG General Assembly
Melbourne, Australia June 28 – July 7, 2011
84
Land subsidence and groundwater extraction The GPS surveys show that land subsidence in Jakarta exhibits spatial and
temporal variations. Excessive groundwater extraction from the middle and lower aquifers of the Jakarta basin by individuals and by industry is hypothesized to be the main factor that causes land subsidence. In this hypothesis, the spatial and temporal variations of land subsidence will strongly depend on the corresponding variations of groundwater extraction, coupled with the characteristics of sedimentary layers and building loads above it. However, the detail and relation between land subsidence and excessive groundwater extraction in the whole Jakarta basin is not yet understood.
Figure 5 Standard deviations of GPS -derived relative heights in mm
Table 2 GPS-derived ellipsoidal height changes from eight surveys, in WGS84

Indonesia Country Report IUGG General Assembly
Melbourne, Australia June 28 – July 7, 2011
85
In the context of groundwater extraction, it should be noted that three aquifers
are recognized inside a 250 m thick sequence of quaternary sediment of the Jakarta basin, namely, (Hadipurwo 1999) the upper aquifer, an unconfined aquifer, which occurs at a depth of less than 40 m; the middle aquifer, which is a confined aquifer and occurs at a depth between 40 and 140 m; and the lower aquifer, which is confined and occurs at a depth between 140 and 250 m. Inside these aquifers, the groundwater generally flows from south to the north. An aquifer was also found in the tertiary sediment below a depth of 250 m.
The groundwater extraction in Jakarta can be categorized into shallow (<40 m) and deep (>40 m) extraction. Shallow extraction is via dug or driven wells, operated with buckets, hand pumps or small electrical pumps; whereas, deep extraction is mostly from drilled wells. Shallow extraction is mostly done by individuals and the wells are generally evenly distributed across the basin and their extraction rate per well is relatively low. Deep extraction is usually conducted by industry and is localized and has a high extraction rate. The land subsidence observed in the coastal, west and northeastern parts of Jakarta are thoughtto be caused by this deep groundwater extraction, whichreduces the water pressure in the aquifer (piezometric level) (Rismianto and Mak 1993). According to Soetrisno et al. (1997), the piezometric level in north Jakarta has changed from 12.5 m above sea level in 1910 to about sea level in the 1970s, and then deepened significantly to 30–50 m below sea level in the 1990s. Figure 9 shows the piezometric levels inside the middle and lower aquifers in 1992.
Table 3 GPS-derived rates of ellipsoidal height changes from eight surveys, in WGS84

Indonesia Country Report IUGG General Assembly
Melbourne, Australia June 28 – July 7, 2011
86
Figure 6 Accumulated GPS derived subsidence (cm) during the period of December 1997–
September 2005
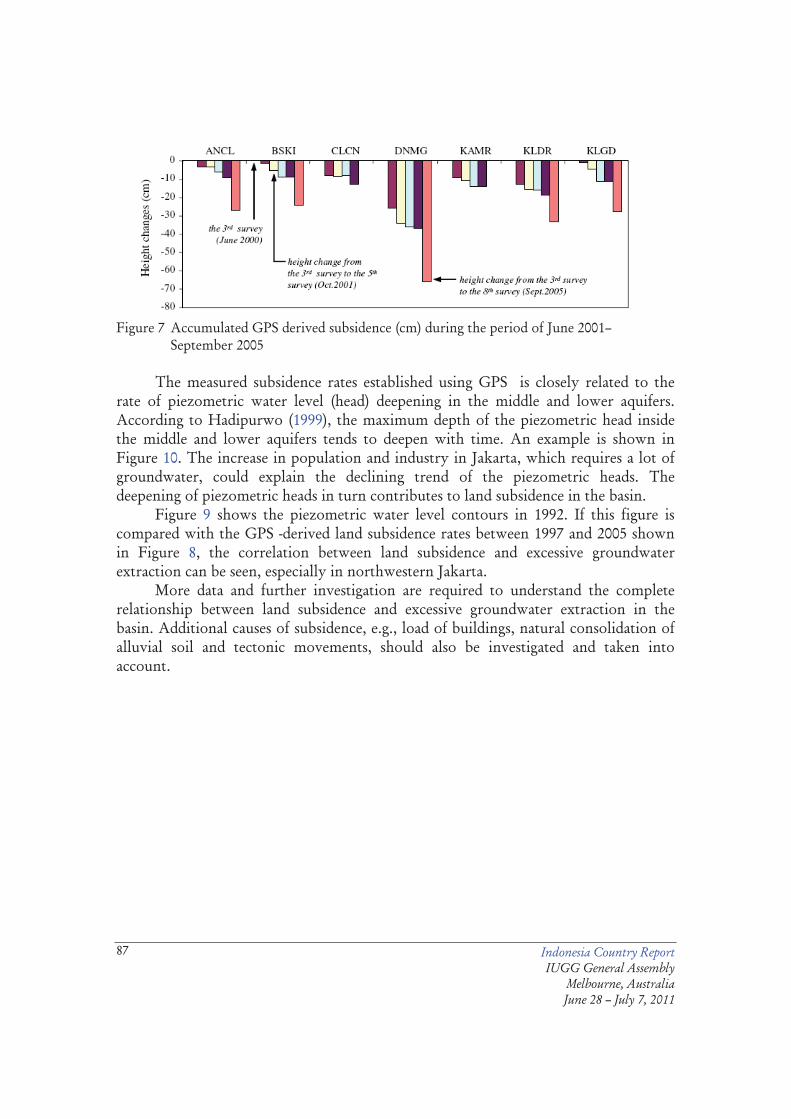
Indonesia Country Report IUGG General Assembly
Melbourne, Australia June 28 – July 7, 2011
87
Figure 7 Accumulated GPS derived subsidence (cm) during the period of June 2001–
September 2005 The measured subsidence rates established using GPS is closely related to the
rate of piezometric water level (head) deepening in the middle and lower aquifers. According to Hadipurwo (1999), the maximum depth of the piezometric head inside the middle and lower aquifers tends to deepen with time. An example is shown in Figure 10. The increase in population and industry in Jakarta, which requires a lot of groundwater, could explain the declining trend of the piezometric heads. The deepening of piezometric heads in turn contributes to land subsidence in the basin.
Figure 9 shows the piezometric water level contours in 1992. If this figure is compared with the GPS -derived land subsidence rates between 1997 and 2005 shown in Figure 8, the correlation between land subsidence and excessive groundwater extraction can be seen, especially in northwestern Jakarta.
More data and further investigation are required to understand the complete relationship between land subsidence and excessive groundwater extraction in the basin. Additional causes of subsidence, e.g., load of buildings, natural consolidation of alluvial soil and tectonic movements, should also be investigated and taken into account.
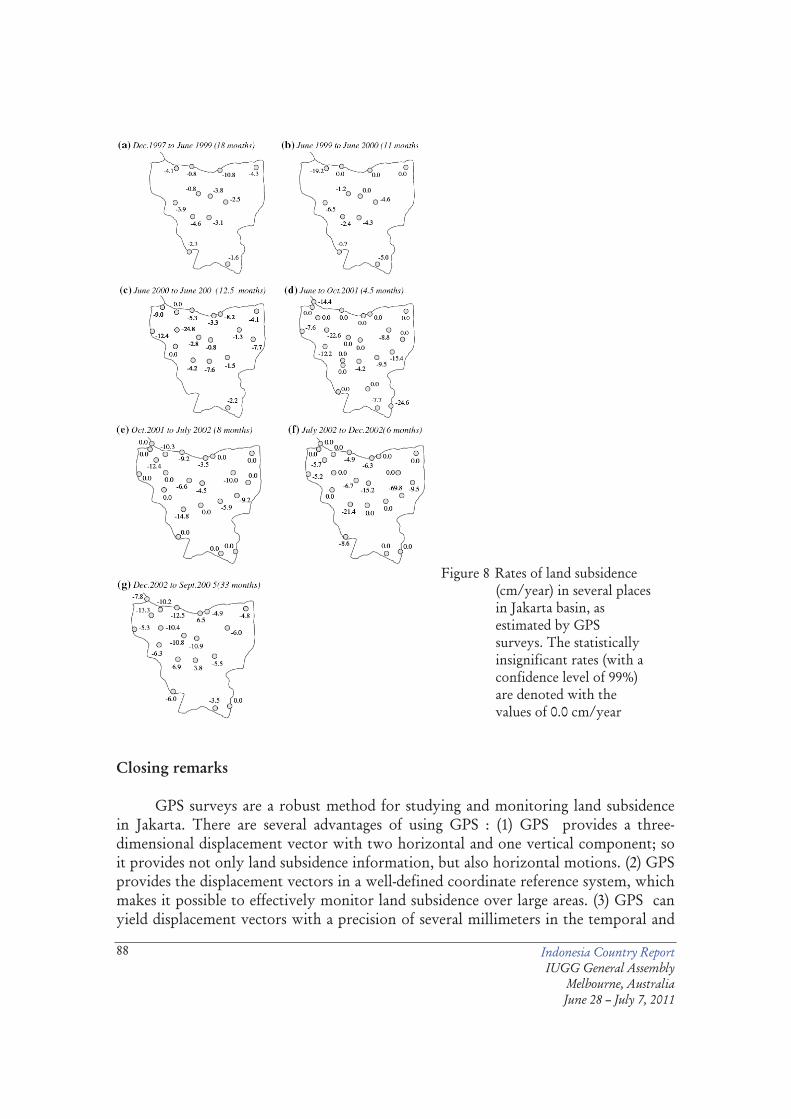
Indonesia Country Report IUGG General Assembly
Melbourne, Australia June 28 – July 7, 2011
88
Figure 8 Rates of land subsidence (cm/year) in several places in Jakarta basin, as estimated by GPS surveys. The statistically insignificant rates (with a confidence level of 99%) are denoted with the values of 0.0 cm/year
Closing remarks GPS surveys are a robust method for studying and monitoring land subsidence
in Jakarta. There are several advantages of using GPS : (1) GPS provides a three-dimensional displacement vector with two horizontal and one vertical component; so it provides not only land subsidence information, but also horizontal motions. (2) GPS provides the displacement vectors in a well-defined coordinate reference system, which makes it possible to effectively monitor land subsidence over large areas. (3) GPS can yield displacement vectors with a precision of several millimeters in the temporal and

Indonesia Country Report IUGG General Assembly
Melbourne, Australia June 28 – July 7, 2011
89
spatial domain. (4) GPS is available continuously, day and night, and independent of weather conditions. This makes field operations flexible.
Figure 9 Piezometric water level contours (in mm) inside middle and lower aquifers of
Jakarta in 1992, adapted from (Murdohardono and Tirtomihardjo 1993)
Figure 10 Example of the deepening of the piezometric head inside the middle and
lower aquifers of Jakarta, drawn from the data given in Hadipurwo (1999) Based on our experience, the main constraint for using GPS in studying land
subsidence in a large city like Jakarta is signal obstruction and multipath caused by high rise buildings, trees, billboards, etc. For this reason, GPS stations cannot always be established in a desired location. Another problem is due to active development activities inside urban areas, which sometimes destroy or alter observation monuments. It should also be noted that the detection of land subsidence at the level of a couple of millimeters requires dual-frequency geodetic type receivers, good project planning, stringent observation strategy and data processing strategy available only in scientific software. Expertise in GPS data acquisition and precise data processing is therefore required.
Implementing a continuously operating GPS network in the Jakarta basin may be useful, because of the possibly large temporal variations in the rates of subsidence. These temporal variations may be difficult to observe with episodic GPS measurements. A fundamental limitation of GPS methods is that the measurements

Indonesia Country Report IUGG General Assembly
Melbourne, Australia June 28 – July 7, 2011
90
are limited to specific points with no spatial continuity. To overcome this limitation, the Interferometric Synthetic Aperture Radar (InSAR) technique (Massonnet and Feigl 1998) should be considered. InSAR provides complete spatial coverage, but is only a relative technique that requires a tie to GPS to transform it to an absolute one.
In order to achieve an even better understanding and modeling of land subsidence in the Jakarta basin, the variations derived from GPS surveys should be integrated with land subsidence information obtained from leveling and INSAR, and also with information from geohydrological and geotechnical measurements (e.g., using automatic water level recorder, piezometer, extensometer, drilling, etc.). Acknowledgments This research has been conducted using research grants from the Ministry of Science and Technology of Indonesia, Ministry of National Education of Indonesia and ITB Research Grant 2005. The GPS surveys were conducted by the Geodesy Research Division of ITB, the National Coordinating Agency for Survey and Mapping (BAKOSURTANAL) of Indonesia and students. Two reviewers are thanked for providing critical and useful comments that improved the quality of this paper. The assistance of Dr. Irwan Meilano in improving the quality of some Figures is gratefully acknowledged. References Abidin HZ, Djaja R, Darmawan D, Hadi S, Akbar A, Rajiyowiryono H, Sudibyo Y,
Meilano I, Kusuma MA, Kahar J, Subarya C (2001) Land subsidence of Jakarta (Indonesia) and its geodeticbased monitoring system. Nat Haz 23(2–3):365–387
Abidin HZ, Djaja R, Andreas H, Gamal M, Hirose K, Maruyama Y (2004) Capabilities and constraints of geodetic techniques for monitoring land subsidence in the urban areas of Indonesia. Geomat Res Aust 81:45–58
Beutler G, Bock H, Brockmann E, Dach R, Fridez P, Gurtner W, Hugentobler U, Ineichen D, Johnson J, Meindl M, Mervant L, Rothacher M, Schaer S, Springer T, WeberR (2001) Bernese GPS software Version 4.2. In: Hugentobler U, Schaer S, Fridez P (eds) Astronomical Institute, University of Berne, pp 515
Blewitt G, Lavallee D (2002) Effect of annual signals on geodetic velocity. J Geophys Res 107(B7). doi:10.1029/2001JB000570
Bock Y, Prawirodirdjo L, Genrich JF, Stevens CW, McCaffrey R, Subarya C, Puntodewo SSO, and Calais E (2003) Crustal motion in Indonesia from global positioning system measurements. J Geophys Res 108(2367). doi:10.1029/2001JB000324

Indonesia Country Report IUGG General Assembly
Melbourne, Australia June 28 – July 7, 2011
91
Ding XL, Zheng DW, Dong DN, Ma C, Chen YQ, Wang GL (2005) Seasonal and secular positional variations at eight co-located GPS and VLBI stations. J Geod 79:71–81. doi: 10.1007/s00190- 005-0444-3
Dong D, Fang P, Bock Y, Cheng M, Miyazaki S (2002) Anatomy of apparent seasonal variations from GPS derived site position time series. J Geophys Res 107(B4):ETG9-1-ETG9-16
JPL (2007) Website of GPS time series, jet propulsion laboratory, California Institute of Technology. Address: http://www.sideshow.jpl.nasa.gov/mbh/all/BAKO.html. Accessed: 25 January
Leick A (2004) GPS satellite surveying, 3rd edn. Wiley, New York Hadipurwo S (1999) Groundwater. In: COASTPLAN JAKARTA BAY PROJECT, coastal environmental geology of the Jakarta reclamation project and adjacent areas. CCOP COASTPLAN case study report, Jakarta/Bangkok, vol 2, pp 39–49
Massonnet D, Feigl KL (1998) Radar interferometry and its application to changes in the Earth’s surface. Rev Geophys 36(4):441–500
Murdohardono D, Sudarsono U (1998) Land subsidence monitoring system in Jakarta. In: Proceedings of symposium on Japan– Indonesia IDNDR project: volcanology, tectonics, flood and sediment hazards, Bandung, 21–23 September, pp 243–256
Murdohardono D, Tirtomihardjo H (1993) Penurunan tananh di Jakarta dan rencana pemantauannya. In: Proceedings of the 22nd annual convention of the Indonesian association of geologists, Bandung, 6–9 December, pp. 346–354
Purnomo H, Murdohardono D, Pindratno H (1999) Land subsidence study in Jakarta. In: Proceedings of Indonesian association of geologists. Development in engineering, environment, and numerical geology, vol IV, Jakarta, 30 November–1 December, pp 53–72
Rajiyowiryono H (1999) Groundwater and land subsidence monitoring along the north coastal plain of Java island. CCOP Newslett 24(3):19
Rimbaman, Suparan P (1999) Geomorphology. In: COASTPLAN JAKARTA BAY PROJECT, coastal environmental geology of the Jakarta reclamation project and adjacent areas. CCOP COASTPLAN case study report no. 2, Jakarta/Bangkok, pp 21–25
Rismianto D, Mak W (1993) Environmental aspects of groundwater extraction in DKI Jakarta: changing views. In: Proceedings of the 22nd annual convention of the Indonesian association of geologists, Bandung, 6–9 December, pp 327–345
Schepers JHG (1926) De Primaire Kringen Ia En II, Benevens Het Stadsnet Van Batavia En Weltevreden, No.1 De Nauwkeurrigheidswaterpassing Van Java. Topografische Dienst In Nederlansch-Indie. Weltevreden Reproductiebedrifj Top.Dienst
Indonesia Country Report IUGG General Assembly
Melbourne, Australia June 28 – July 7, 2011
92
Soekardi P, Djaeni A, Soefner H, Hobler M, Schmidt G (1986)Geological aspect of the aquifer system and the groundwater situation of the Jakarta Artesian Basin. Paper presented at seminar on geological mapping in the urban development, economic and social commission for Asia and the Pacific, Bangkok, 29 October
Soetrisno S, Satrio H, Haryadi T (1997) To anticipate impacts of reclamation of Jakarta Bay, a groundwater conservation’s perspective. Paper presented at workshop on coastal and nearshore geological/oceanographical assessment of Jakarta Bay: a basis for coastal zone management and development, Jakarta, 25–28 June
Suharto P (1971) Precise leveling in Indonesia. Final undergraduate report. Department of Geodetic Engineering. Institute of Technology, Bandung
Yong RN, Turcott E, Maathuis H (1995) Groundwater extractioninduced land subsidence prediction: Bangkok and Jakarta case studies. In: Proceedings of the Fifth international symposium on land subsidence. IAHS Publication no. 234. October pp 89–97

Indonesia Country Report IUGG General Assembly
Melbourne, Australia June 28 – July 7, 2011
93
Land subsidence characteristics of the Bandung Basin, Indonesia, as estimated from GPS and InSAR
H. Z. Abidin, H. Andreas, M. Gamal, A. D. Wirakusumah, D. Darmawan,
T. Deguchi and Y. Maruyama Abstract
The Bandung Basin is a large intramontane basin surrounded by volcanic highlands, in western Java, Indonesia, inhabited by more than five million people. Based on the results of five GPS surveys conducted in February 2000, November 2001, July 2002, June 2003, and June 2005, it can be concluded that for the period of 2000 to 2005 several locations in the Bandung Basin have experienced land subsidence. Over this 5-year period land subsidence in a few locations reached a magnitude of about 70 cm, with a subsidence speed of about 1–2 cm/month. A similar rate of subsidence was also detected by the InSAR (Interferometric Synthetic Aperture Radar) technique during the period between June 2006 and March 2007.
The statistical testing showed no strong correlation between GPS -derived land subsidence and registered groundwater extraction during the period of February 2000 to July 2002. The InSAR technique, however, detected significant subsidence in the textile industry area, which very large volumes of groundwater are usually extracted. Keywords. Subsidence, GPS , InSAR, Bandung, groundwater. Introduction
Bandung is the capital of the West Java province, Indonesia (Figure 1). The city is surrounded by several medium-sized towns, which together form Greater Bandung area. A highland plateau lies in the catchment area of the upper Citarum River. It is surrounded by a range of hills and volcanoes, some of which are still active, and form the intra-montane basin known as the Bandung Basin.
The basin has an area of about 2300 km2 and encompasses three administrative units: the Bandung municipality, the surrounding Bandung regency (district) and part of the Sumedang regency. The central part of the basin, mostly comprising urban and industrial areas, is a plain measuring about 40 km east-west and about 30 km north-south, with an altitude of about 650 to 700 m. In 1995 the Bandung municipality had a population of about 2.5 million, and today the Bandung Basin has more than 5 million inhabitants.
There are several types of land subsidence that can be expected to occur in the Bandung Basin, namely subsidence due to groundwater extraction, subsidence induced by the load of manmade constructions (i.e. settlement of highly compressible soil),

Indonesia Country Report IUGG General Assembly
Melbourne, Australia June 28 – July 7, 2011
94
subsidence caused by natural consolidation of alluvium soil, and geotectonic subsidence. The detailed characteristics and mechanisms of land subsidence are still relatively unknown.
Since information on land subsidence characteristics will be useful for managing many developmental and environmental aspects (Figure 2), systematic and continuous monitoring of land subsidence in Bandung is obviously needed, and critical to the welfare of the city. Comprehensive information on land subsidence characteristics would be important for several tasks, such as spatial-based groundwater extraction regulation, e¤ective control of floods, conservation of environment, design and construction of infrastructure, and spatial development planning in general.
In principle, the land subsidence phenomenon can be studied using several methods, such as hydrogeology methods, e.g. ground water level observation, extensometer measurement and piezometer measurement, as well as by geodetic methods such as levelling surveys, GPS surveys and InSAR (Interferometric Synthetic Aperture Radar); see Sneed et al. (2001), Bell et al. (2002), Ge et al. (2007). In this paper the use of GPS survey and InSAR techniques (Massonnet and Feigl 1998) for studying land subsidence in Bandung will be discussed. The discussion will be based on results obtained from five GPS surveys that have been conducted in February 2000, November 2001, July 2002, June 2003 and June 2005; and InSAR results from the period between June 2006 and March 2007. Bandung basin and its hydrogeologic features
The Bandung Basin is a large intra-montane basin surrounded by volcanic highlands (Figure 3). The central part of the basin has an altitude of about 665 m and is surrounded by up to 2400 m high Late Tertiary and Quaternary volcanic terrain (Dam et al. 1996). The catchment area of the basin and surrounding mountains covers approximately 2300 km2, and the Citarum River with its tributaries forms the main drainage system of the basin catchment. Deposits in the basin comprise of coarse volcaniclastics, fluvial sediments and notably a thick series of lacustrine deposits. A more detailed explanation of the geologic and morphologic setting of the Bandung Basin can be found in Dam et al. (1996).

Indonesia Country Report IUGG General Assembly
Melbourne, Australia June 28 – July 7, 2011
95
Figure 1. Location of Bandung, Indonesia.
Figure 2: Benefit of land subsidence information.

Indonesia Country Report IUGG General Assembly
Melbourne, Australia June 28 – July 7, 2011
96
Figure 3. Bandung Basin and its surroundings.
The Bandung Basin encompasses three administrative units: the Bandung municipality, an urban area 81 km2 in size perched against the northern mountain range; the surrounding Bandung regency; and part of the Sumedang regency (Braadbaart and Braadbaart 1997). The population of the Bandung municipality increased from less than 40 000 in 1906 to nearly one million in 1961, and had grown to about two and half million by 1995. In addition, with expansion of manufacturing and textile industries in the Bandung Basin, urbanisation increased and in 2005 more than 7 million people inhabited the basin. This increase in both population and industrial activity in turn increased the degree of groundwater withdrawal from the aquifers in the Bandung Basin, as illustrated in Figure 4. According to Wirakusumah (2006), about 60% of the total clean water required in the Greater Bandung area (i.e. about 512 million cubicmetres) are supplied by groundwater; and the industry relies nearly 100% on groundwater resources.
On the basis of its hydraulic characteristics and its depth, the multi-layer aquifer configuration of the Bandung Basin may be simplified into two systems (Soetrisno 1996): shallow aquifers (a few metres to around 40 m below the surface) and deep aquifers (more than 40 m to 250 m below the surface). These aquifers are composed of volcanic products from the volcanic complexes that bordered this basin, and lake
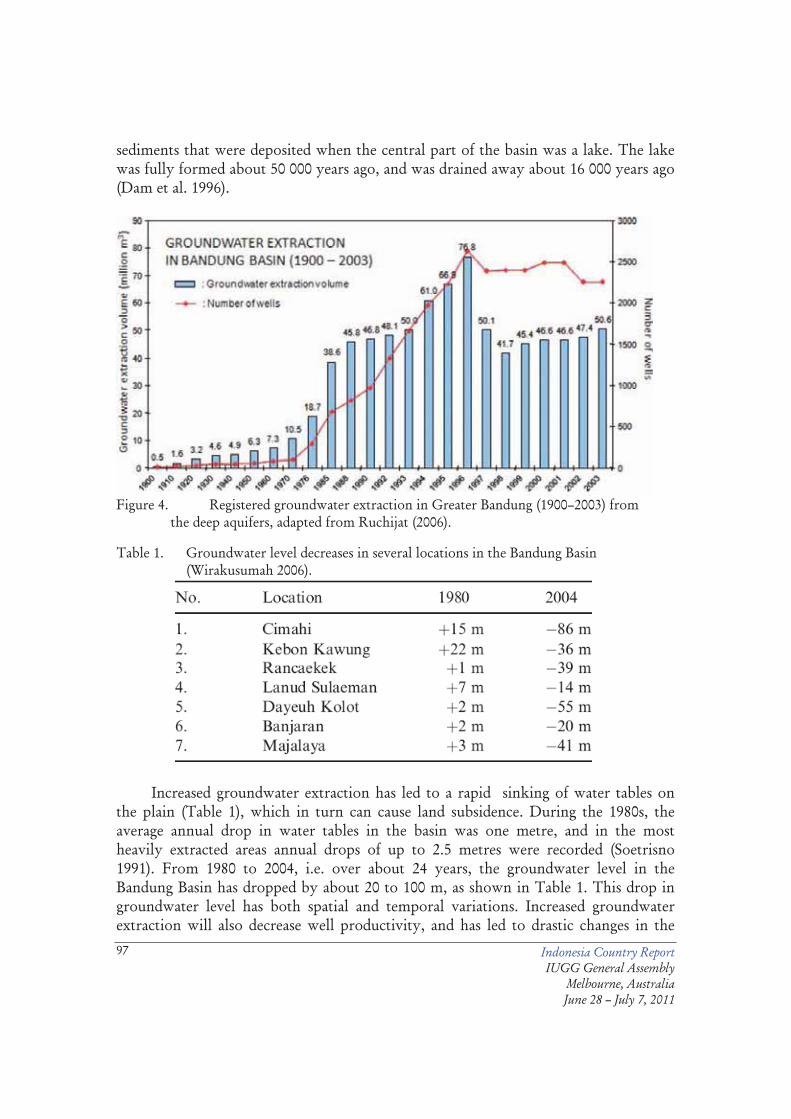
Indonesia Country Report IUGG General Assembly
Melbourne, Australia June 28 – July 7, 2011
97
sediments that were deposited when the central part of the basin was a lake. The lake was fully formed about 50 000 years ago, and was drained away about 16 000 years ago (Dam et al. 1996).
Figure 4. Registered groundwater extraction in Greater Bandung (1900–2003) from
the deep aquifers, adapted from Ruchijat (2006).
Table 1. Groundwater level decreases in several locations in the Bandung Basin (Wirakusumah 2006).
Increased groundwater extraction has led to a rapid sinking of water tables on
the plain (Table 1), which in turn can cause land subsidence. During the 1980s, the average annual drop in water tables in the basin was one metre, and in the most heavily extracted areas annual drops of up to 2.5 metres were recorded (Soetrisno 1991). From 1980 to 2004, i.e. over about 24 years, the groundwater level in the Bandung Basin has dropped by about 20 to 100 m, as shown in Table 1. This drop in groundwater level has both spatial and temporal variations. Increased groundwater extraction will also decrease well productivity, and has led to drastic changes in the
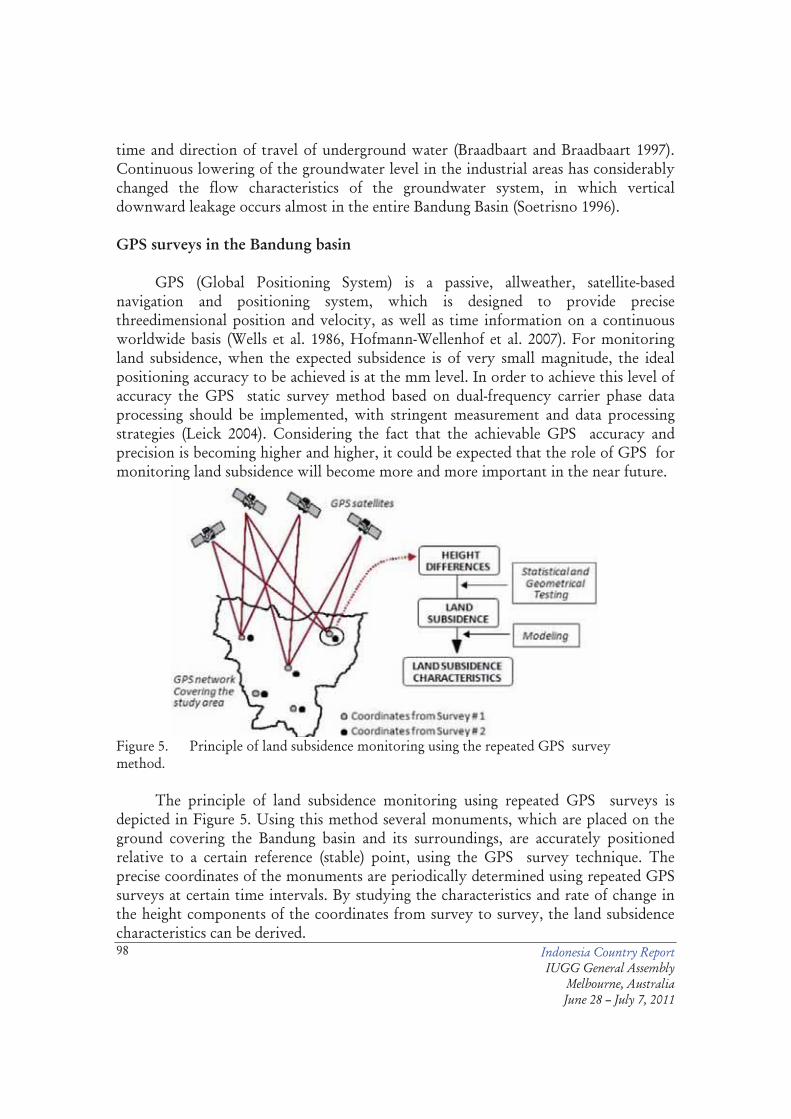
Indonesia Country Report IUGG General Assembly
Melbourne, Australia June 28 – July 7, 2011
98
time and direction of travel of underground water (Braadbaart and Braadbaart 1997). Continuous lowering of the groundwater level in the industrial areas has considerably changed the flow characteristics of the groundwater system, in which vertical downward leakage occurs almost in the entire Bandung Basin (Soetrisno 1996). GPS surveys in the Bandung basin
GPS (Global Positioning System) is a passive, allweather, satellite-based navigation and positioning system, which is designed to provide precise threedimensional position and velocity, as well as time information on a continuous worldwide basis (Wells et al. 1986, Hofmann-Wellenhof et al. 2007). For monitoring land subsidence, when the expected subsidence is of very small magnitude, the ideal positioning accuracy to be achieved is at the mm level. In order to achieve this level of accuracy the GPS static survey method based on dual-frequency carrier phase data processing should be implemented, with stringent measurement and data processing strategies (Leick 2004). Considering the fact that the achievable GPS accuracy and precision is becoming higher and higher, it could be expected that the role of GPS for monitoring land subsidence will become more and more important in the near future.
Figure 5. Principle of land subsidence monitoring using the repeated GPS survey method.
The principle of land subsidence monitoring using repeated GPS surveys is
depicted in Figure 5. Using this method several monuments, which are placed on the ground covering the Bandung basin and its surroundings, are accurately positioned relative to a certain reference (stable) point, using the GPS survey technique. The precise coordinates of the monuments are periodically determined using repeated GPS surveys at certain time intervals. By studying the characteristics and rate of change in the height components of the coordinates from survey to survey, the land subsidence characteristics can be derived.

Indonesia Country Report IUGG General Assembly
Melbourne, Australia June 28 – July 7, 2011
99
In order to study the land subsidence phenomena in the Bandung Basin, five GPS surveys have been conducted in February 2000, November 2001, July 2002, June 2003 and June 2005 (Table 2).
Table 2: GPS surveys for land subsidence monitoring in the Bandung Basin.
The surveys at all stations were carried out using dual-frequency geodetic-type
GPS receivers. In this case the PSCA station located inside the Institute of Technology Bandung (ITB) campus was used as the reference point with known coordinates. For all GPS surveys, except for the first survey, the length of sessions was between 10 to 12 hours. In the first GPS survey the length of sessions was about 5 to 6 hours. The data were collected with a 30-second interval, and the elevation mask was set to 15_ for all stations. The surveys were carried out by the Geodesy Research Division of ITB, in cooperation with the Centre of Volcanology and Geological Hazard Mitigation, Ministry of Energy and Mineral Resources. The configuration of the GPS monitoring network is shown in Figure 6. GPS survey data processing and results
GPS data processing is carried out using the SKIPro version 2.1 commercial software. Processing is done in radial mode from the PSCA station. Since the baseline lengths are relatively short, ranging from 3 to about 23 km, scientific GPS software was not used for data processing. The PSCA station is assumed to be stable for the subsidence study, and its coordinates were computed relative to an Indonesian IGS station located in the BAKOSURTANAL area, Cibinong, Bogor, approximately 110

Indonesia Country Report IUGG General Assembly
Melbourne, Australia June 28 – July 7, 2011
100
km away. For all computations, precise ephemerides and the Saastamoinen tropospheric model were used. The final coordinates were estimated using the ionosphere-free linear combination after fixing the integer ambiguities of the L1 and L2 signals.
For land subsidence monitoring only the ellipsoidal height components are used. Subsidence at a certain GPS station is obtained by simply di¤erencing the ellipsoidal heights of the station as estimated from two consecutive GPS surveys (see Figure 5). The standard deviations of GPS -derived relative ellipsoidal heights from five surveys that have been conducted in the Bandung Basin are depicted in Figure 7. This figure shows that in the first survey the obtained precision level of relative ellipsoidal heighting was 1–3 cm, while for the other surveys it was at the several mm level. The precision of the first survey results is inferior to the following surveys due to the shorter session lengths that were observed. It should be noted here that usually commercial software such as SKIPro gives over optimistic estimates of standard deviations. Estimated land subsidence Based on the estimated ellipsoidal heights obtained from GPS processing, the height di¤erences between two consecutive survey epochs can be calculated. The height di¤erences based on five GPS surveys are given in Table 3, along with their standard deviations. In this table possible subsidence is indicated by negative values of height differences.
Figure 6. Distribution of GPS points for studying land subsidence in the Bandung Basin.
The PSCA reference station is the northern most point in the figure.

Indonesia Country Report IUGG General Assembly
Melbourne, Australia June 28 – July 7, 2011
101
Figure 7. Standard deviations of the estimated coordinates of GPS stations from 5 surveys. Table 3. Ellipsoidal height di¤erences (relative to PSCA) from five GPS surveys (cms).

Indonesia Country Report IUGG General Assembly
Melbourne, Australia June 28 – July 7, 2011
102
Figure 8. Temporal and spatial variation of subsidence rates (mm/month) in the
Bandung Basin during the period 2000 to 2005.
In order to statistically check the significance of the subsidence values measured by GPS surveys, the congruency test (Caspary 1987) was performed. The null hypothesis of the test is that the relative ellipsoid heights of two consecutive epochs (e.g. i and j ) are stable, i.e. there is no subsidence. Therefore:
null hypothesis Ho :����dhij = 0 (1) alternative hypothesis Ha :����dhij � 0 (2)
The test statistics for this test is
ij
ij
dhdh
t��
���
(3)
which has the customary Student’s t distribution if Ho is true. The region where the null hypothesis is rejected is (Wolf and Ghilani 1997):
2/,dftt (4) where df is the degree of freedom and is the significance level used for the test. In our case, for baselines derived using 10 to 12 hours of GPS data a 30-second data interval,
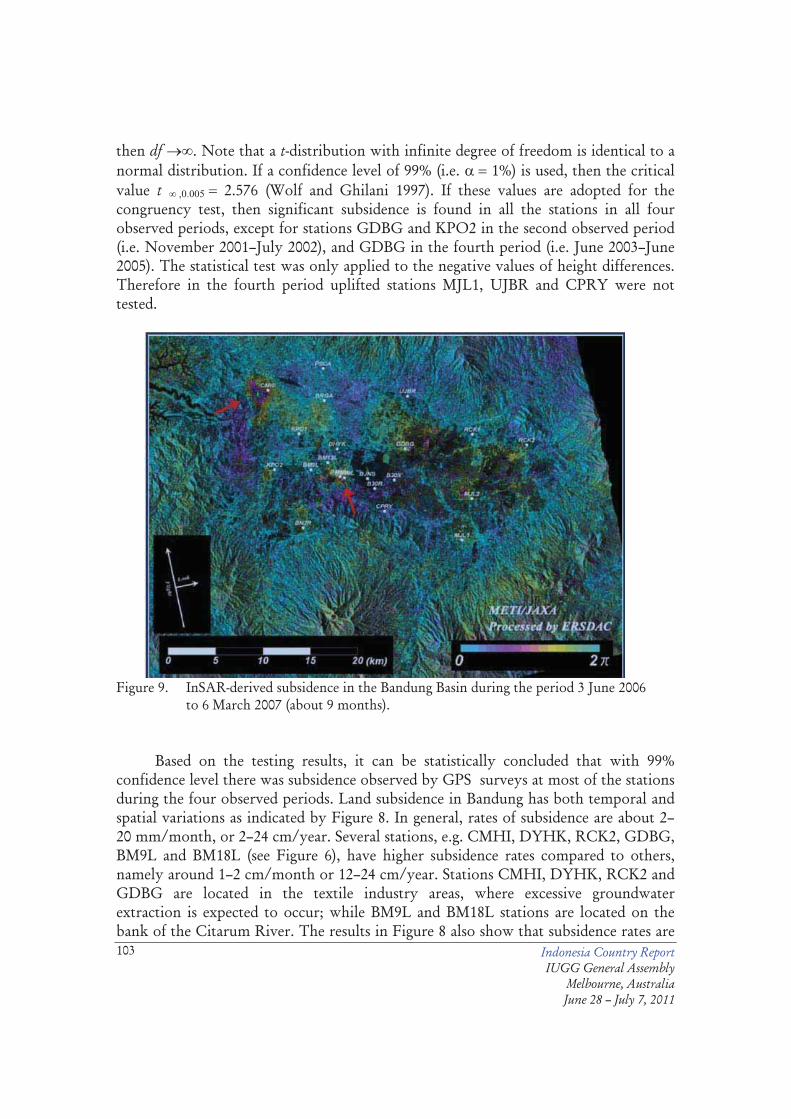
Indonesia Country Report IUGG General Assembly
Melbourne, Australia June 28 – July 7, 2011
103
then df ��. Note that a t-distribution with infinite degree of freedom is identical to a normal distribution. If a confidence level of 99% (i.e. �� 1%) is used, then the critical value t ���������� 2.576 (Wolf and Ghilani 1997). If these values are adopted for the congruency test, then significant subsidence is found in all the stations in all four observed periods, except for stations GDBG and KPO2 in the second observed period (i.e. November 2001–July 2002), and GDBG in the fourth period (i.e. June 2003–June 2005). The statistical test was only applied to the negative values of height differences. Therefore in the fourth period uplifted stations MJL1, UJBR and CPRY were not tested.
Figure 9. InSAR-derived subsidence in the Bandung Basin during the period 3 June 2006
to 6 March 2007 (about 9 months).
Based on the testing results, it can be statistically concluded that with 99% confidence level there was subsidence observed by GPS surveys at most of the stations during the four observed periods. Land subsidence in Bandung has both temporal and spatial variations as indicated by Figure 8. In general, rates of subsidence are about 2–20 mm/month, or 2–24 cm/year. Several stations, e.g. CMHI, DYHK, RCK2, GDBG, BM9L and BM18L (see Figure 6), have higher subsidence rates compared to others, namely around 1–2 cm/month or 12–24 cm/year. Stations CMHI, DYHK, RCK2 and GDBG are located in the textile industry areas, where excessive groundwater extraction is expected to occur; while BM9L and BM18L stations are located on the bank of the Citarum River. The results in Figure 8 also show that subsidence rates are

Indonesia Country Report IUGG General Assembly
Melbourne, Australia June 28 – July 7, 2011
104
not always linear. Several stations show a slowing down of subsidence, while others do not. These results indicate that the mechanism of land subsidence in the Bandung Basin is not simple and may be caused by several factors, such as excessive groundwater extraction, building load, sediment compaction, and tectonic activities. The underlying process responsible for the uplift observed in some cases is still unknown, and investigations are still to be carried out to understand this phenomenon. Land subsidence from InSAR Subsidence in the Bandung Basin seems to be continuing to the present day. Based on the results obtained from InSAR (Interferometric Synthetic Aperture Radar) using ALOS/PALSAR data, subsidence of over 12 cm occurred during the period between June 2006 and March 2007, near GPS stations CMHI, BM18L and BM19L (Figure 9). The InSAR technique applied to the Bandung Basin uses data from the ALOS/PALSAR satellite, which was launched in January 2006 as a successor of JERS-1/SAR. Figure 9 was generated from SAR data observed on 3 June 2006 and 6 March 2007. The images were acquired in Fine Beam Single Polarisation mode (HH polarisation) with an o¤-nadir angle of 41.5_. InSAR processing was performed using Level 1.1 products (SLC: Single Look Complex) distributed to the public by ERSDAC. The processing software for InSAR was developed by Deguchi (2005) and Deguchi et al. (2006). From the results obtained using PALSAR data some clear phase anomalies were detected around Bandung (CMHI, BM18L, BM19L and others). The colour pattern from blue to red (blue-yellow-red) indicates that the surface has deformed away from the SAR sensor position. One cycle of phase corresponds to approximately 11.8 cm (half the wavelength of the L-band). From this image, around the CMHI station the phase anomalies imply land subsidence during the 276 days that is equivalent to 15 cm (1.3 cm/ month) in the look direction of the SAR sensor. If a conversion of look direction into ellipsoidal normal is made, then this rate of subsidence around the CMHI station is in agreement with the previous rates obtained from GPS surveys, which is about 1–2 cm/month. Representation of subsidence in the field The results obtained by the GPS surveys and InSAR show that land subsidence is indeed real and have been occurring in several places in the Bandung Basin with maximum rates of about 1–2 cm per month. Furthermore, subsidence in the Bandung Basin has spatial and temporal variation. Its representation in the field can be observed in the form of ground lowering or fracturing, and other structural deformation around the subsidence areas, as shown in Figure 10.

Indonesia Country Report IUGG General Assembly
Melbourne, Australia June 28 – July 7, 2011
105
Figure 10. Examples of subsidence features in the field. A and B: ground lowering and
hanging wall in the Leuwigajah area (around CMHI GPS station); C: di¤erential subsidence around GDBG GPS station; D: structural cracking around DYHK GPS station.
Land subsidence and groundwater extraction
A hypothesis has been proposed by several studies (Soetrisno 1991, Braadbaart and Braadbaart 1997, IGES 2006) that land subsidence observed in several locations in the Bandung Basin has been caused by excessive groundwater extraction. The two primary categories of groundwater withdrawers in the basin are shallow well pumps and deep well pumps. The majority of shallow wells are used for domestic purposes, while deep wells are operated by the regional water company or by private firms such as textile industries, manufacturing companies and hotels (Braadbaart and Braadbaart 1997).
The above hypothesis is however not always true, as indicated by the example shown in Figure 11. This figure shows example of observed land subsidence on several GPS points and the registered groundwater extraction rates around the corresponding GPS points (i.e. inside 1 km radius). During the two observed periods, the Figure shows that in general there is no correlation between subsidence and registered groundwater extraction rate, except for the CMHI station. In order to gain more insight into a possible correlation between land subsidence and groundwater extraction variables, Spearman’s rank correlation coefficients (R) are computed for the two observed periods. The coefficient is a non-parametric (distribution-free) rank statistic
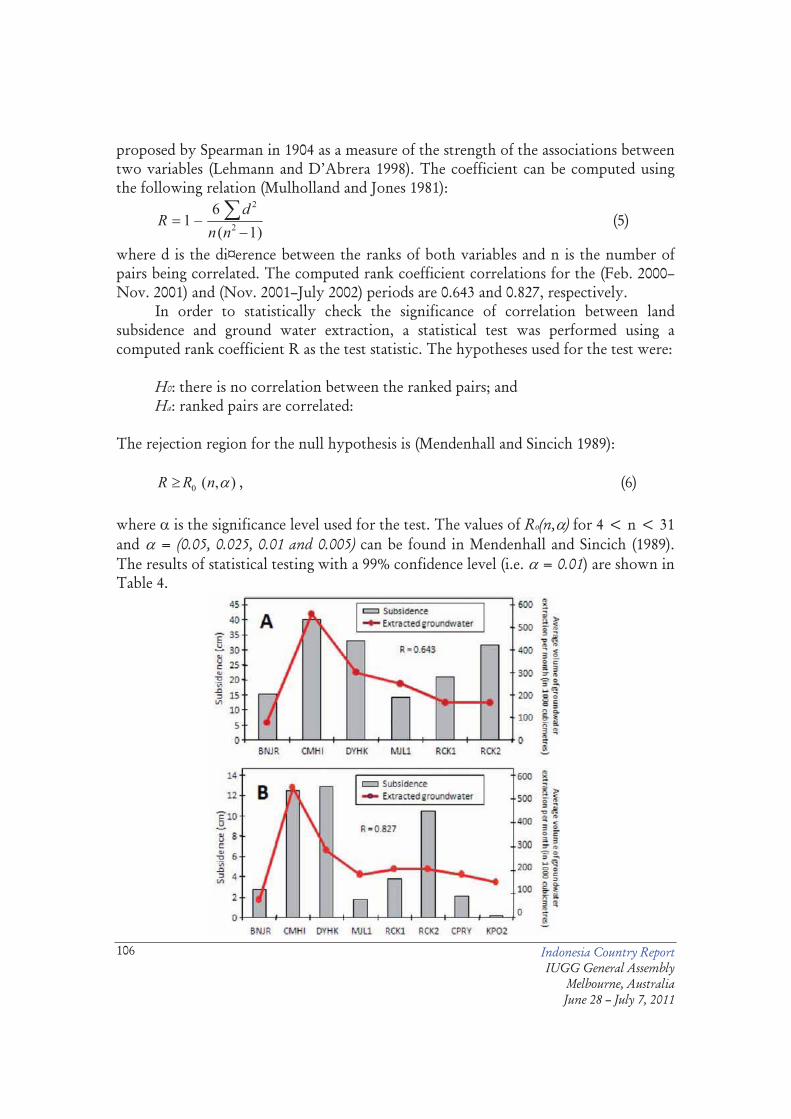
Indonesia Country Report IUGG General Assembly
Melbourne, Australia June 28 – July 7, 2011
106
proposed by Spearman in 1904 as a measure of the strength of the associations between two variables (Lehmann and D’Abrera 1998). The coefficient can be computed using the following relation (Mulholland and Jones 1981):
)1(6
1 2
2
� �
nnd
R (5)
where d is the di¤erence between the ranks of both variables and n is the number of pairs being correlated. The computed rank coefficient correlations for the (Feb. 2000–Nov. 2001) and (Nov. 2001–July 2002) periods are 0.643 and 0.827, respectively.
In order to statistically check the significance of correlation between land subsidence and ground water extraction, a statistical test was performed using a computed rank coefficient R as the test statistic. The hypotheses used for the test were:
H0: there is no correlation between the ranked pairs; and Ha: ranked pairs are correlated:
The rejection region for the null hypothesis is (Mendenhall and Sincich 1989):
),(0 nRR � , (6)
where is the significance level used for the test. The values of Ro(n,) for 4 < n < 31 and = (0.05, 0.025, 0.01 and 0.005) can be found in Mendenhall and Sincich (1989). The results of statistical testing with a 99% confidence level (i.e. = 0.01) are shown in Table 4.
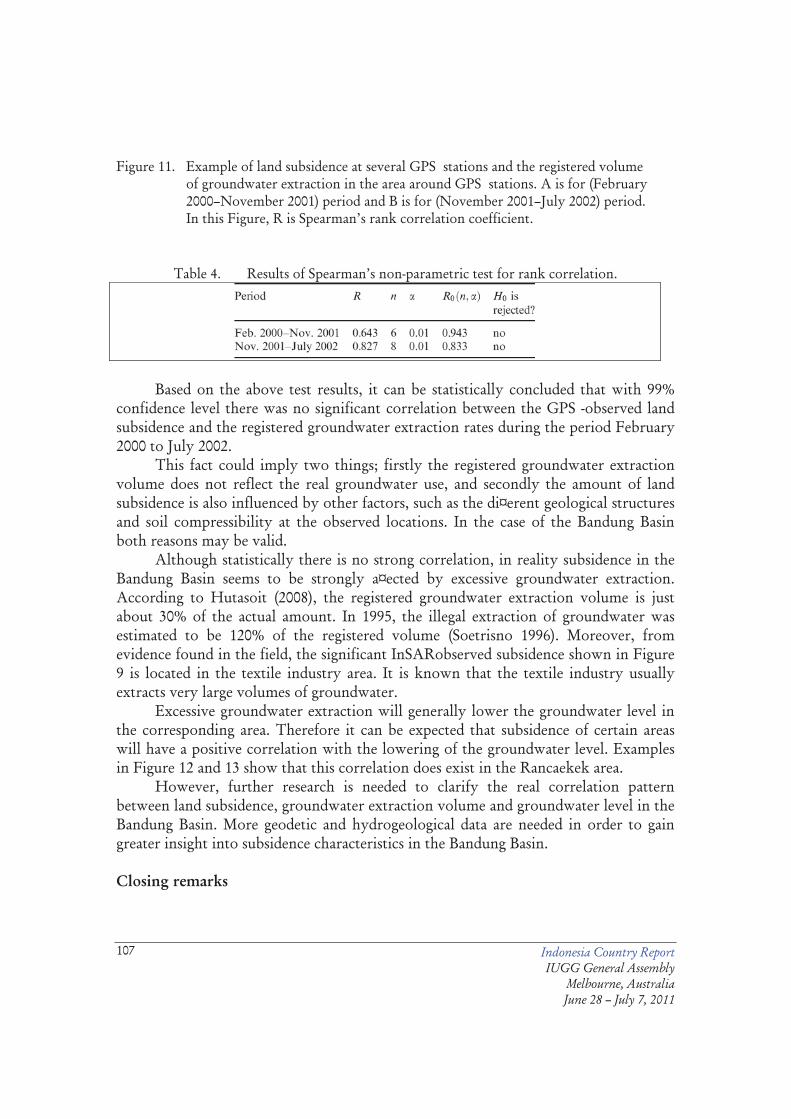
Indonesia Country Report IUGG General Assembly
Melbourne, Australia June 28 – July 7, 2011
107
Figure 11. Example of land subsidence at several GPS stations and the registered volume
of groundwater extraction in the area around GPS stations. A is for (February 2000–November 2001) period and B is for (November 2001–July 2002) period. In this Figure, R is Spearman’s rank correlation coefficient.
Table 4. Results of Spearman’s non-parametric test for rank correlation.
Based on the above test results, it can be statistically concluded that with 99% confidence level there was no significant correlation between the GPS -observed land subsidence and the registered groundwater extraction rates during the period February 2000 to July 2002.
This fact could imply two things; firstly the registered groundwater extraction volume does not reflect the real groundwater use, and secondly the amount of land subsidence is also influenced by other factors, such as the di¤erent geological structures and soil compressibility at the observed locations. In the case of the Bandung Basin both reasons may be valid.
Although statistically there is no strong correlation, in reality subsidence in the Bandung Basin seems to be strongly a¤ected by excessive groundwater extraction. According to Hutasoit (2008), the registered groundwater extraction volume is just about 30% of the actual amount. In 1995, the illegal extraction of groundwater was estimated to be 120% of the registered volume (Soetrisno 1996). Moreover, from evidence found in the field, the significant InSARobserved subsidence shown in Figure 9 is located in the textile industry area. It is known that the textile industry usually extracts very large volumes of groundwater.
Excessive groundwater extraction will generally lower the groundwater level in the corresponding area. Therefore it can be expected that subsidence of certain areas will have a positive correlation with the lowering of the groundwater level. Examples in Figure 12 and 13 show that this correlation does exist in the Rancaekek area.
However, further research is needed to clarify the real correlation pattern between land subsidence, groundwater extraction volume and groundwater level in the Bandung Basin. More geodetic and hydrogeological data are needed in order to gain greater insight into subsidence characteristics in the Bandung Basin. Closing remarks

Indonesia Country Report IUGG General Assembly
Melbourne, Australia June 28 – July 7, 2011
108
Based on the results obtained from land subsidence monitoring in the Bandung Basin, it can be concluded that the GPS survey technique is a reliable method for studying and monitoring land subsidence phenomena. The method is capable of detecting a land subsidence signal that has a relatively small magnitude (of the order of a few cm, or even several mm), although achieving this level of accuracy is not an easy task. In this case the use of dual-frequency geodetic-type receivers is essential, along with good survey planning, a stringent observation strategy, and careful data processing. Although for relatively short baselines (e.g. less than 30 km) the use of commercial GPS software is sufficient for land subsidence studies, for longer baselines use of a scientific software is preferable.
Figure 12. Subsidence of the RCK2 station located in the Rancaekek area.
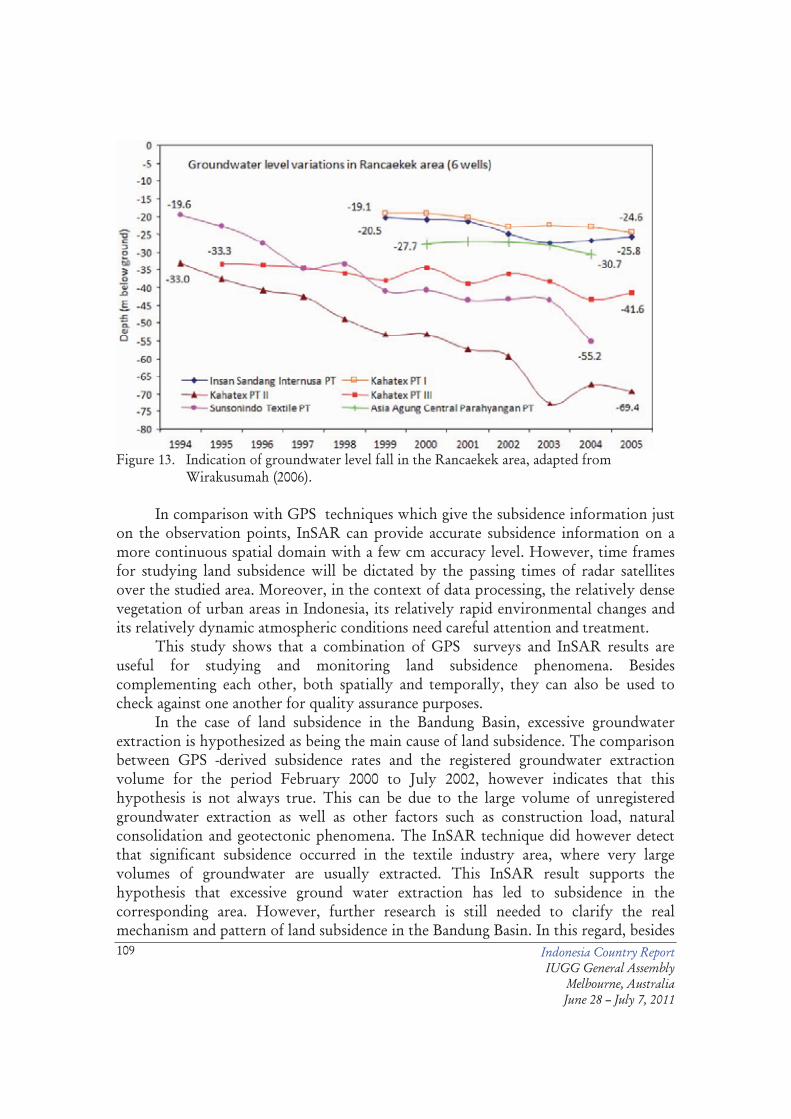
Indonesia Country Report IUGG General Assembly
Melbourne, Australia June 28 – July 7, 2011
109
Figure 13. Indication of groundwater level fall in the Rancaekek area, adapted from
Wirakusumah (2006).
In comparison with GPS techniques which give the subsidence information just on the observation points, InSAR can provide accurate subsidence information on a more continuous spatial domain with a few cm accuracy level. However, time frames for studying land subsidence will be dictated by the passing times of radar satellites over the studied area. Moreover, in the context of data processing, the relatively dense vegetation of urban areas in Indonesia, its relatively rapid environmental changes and its relatively dynamic atmospheric conditions need careful attention and treatment.
This study shows that a combination of GPS surveys and InSAR results are useful for studying and monitoring land subsidence phenomena. Besides complementing each other, both spatially and temporally, they can also be used to check against one another for quality assurance purposes.
In the case of land subsidence in the Bandung Basin, excessive groundwater extraction is hypothesized as being the main cause of land subsidence. The comparison between GPS -derived subsidence rates and the registered groundwater extraction volume for the period February 2000 to July 2002, however indicates that this hypothesis is not always true. This can be due to the large volume of unregistered groundwater extraction as well as other factors such as construction load, natural consolidation and geotectonic phenomena. The InSAR technique did however detect that significant subsidence occurred in the textile industry area, where very large volumes of groundwater are usually extracted. This InSAR result supports the hypothesis that excessive ground water extraction has led to subsidence in the corresponding area. However, further research is still needed to clarify the real mechanism and pattern of land subsidence in the Bandung Basin. In this regard, besides

Indonesia Country Report IUGG General Assembly
Melbourne, Australia June 28 – July 7, 2011
110
carefully considering all possible factors influencing subsidence in the Bandung Basin, the GPS and InSAR derived results should also be integrated with results obtained by other monitoring techniques such as levelling and automatic water level recorders. Comparison between incident rainfall with time and observed land subsidence, and the delay between rainfall and water entering the water table should also be studied in order to gain a better insight of the land subsidence characteristics in the Bandung Basin. References Bell, J. W., Amelung, F., Ramelli, A. R., and Blewitt, G., Land subsidence in Las
Vegas, Nevada, 1935–2000: New geodetic data show evolution, revised spatial patterns, and reduced rates, Environmental and Engineering Geoscience 8:3 (2002), 155–174.
Braadbaart, O. and Braadbaart, F., Policing the Urban Pumping Race: Industrial Groundwater Overexploitation in Indonesia, World Development 25:2 (1997), 199–210.
Caspary, W. F., Concepts of Network and Deformation Analysis. Monograph 11, School of Surveying, The University of New South Wales, Kensington, NSW, Australia, 183 pages, 1987.
Dam, M. A. C., Suparan, P., Nossin, J. J., Voskuil, R. P. G. A., and Group, G. T. L., A chronology for geomorphological developments in the greater Bandung area, West-Java, Indonesia, Journal of Southeast Asian Earth Sciences 14:1–2 (1996), 101–115.
Deguchi, T., Automatic InSAR processing and introduction of its application studies. Paper presented at the 26th Asian Conference on Remote Sensing, 7–11 November, Hanoi, Vietnam, 2005.
Deguchi, T., Kato, M., Akcin, H., and Kutoglu, H. S., Automatic processing of Interferometric SAR and accuracy of surface deformation measurement. Paper presented at the 13th SPIE Symposium on Remote Sensing, 11–13 September, Stockholm, Sweden, 2006.
Ge, L., Chang, H.-C., and Rizos, C., Mine subsidence monitoring using multi-source satellite SAR images, Photogrammetric Engineering and Remote Sensing 73:3 (2007), 259–266.
Hofmann-Wellenhof, B., Lichtenegger, H., and Wasle, E., GNSS Global Navigation Satellite Systems: GPS , GLONASS, Galileo, and More, Springer Verlag, Wien, 2007.
IGES, Sustanaible Groundwater Management in Asian Cities. A Summary Report of Research on Sustainable Water Management in Asia, Freshwater Resources Management Project, Institute for Global Environmental Strategies (IGES), Kanagawa 240-0115, Japan, http://www.iges.or.jp/en/fw/index.html, 2006.

Indonesia Country Report IUGG General Assembly
Melbourne, Australia June 28 – July 7, 2011
111
Hutasoit, L., Personal Communication. Hydrogeologist, Faculty of Earth Science and Technology, Institute of Technology Bandung, 17 January 2008.
Lehmann, E. L. and D’Abrera, H. J. M., Nonparametrics: Statistical Methods Based on Ranks, rev. ed. Englewood Cli¤s, Prentice-Hall, New Jersey, 1998.
Leick, A., GPS Satellite Surveying, 3rd edition, John Wiley & Sons, New York, 462 pages, 2004.
Massonnet, D. and Feigl, K. L., Radar interferometry and its application to changes in the earth’s surface, Reviews of Geophysics 36:4 (1998), 441–500.
Mendenhall, W. and Sincich, T., Statistics for the Engineering and Computer Sciences, 2nd ed., Dellen Publishing Company, San Francisco, 1989.
Mulholland, H. and Jones, C. R., Fundamentals of Statistics, Butterworth, London, 291 pages, 1981.
Ruchijat, S., Kondisi Airtanah Cekungan Bandung. Presentasi Pusat Lingkungan Geologi (PLG) pada Pertemuan Teknis BPLHD Jabar, Bandung, 12 January 2006.
Sneed, M., Ikehara, M. E., Galloway, D. L., and Amelung, F., Detection and Measurement of Land Subsidence Using Global Positioning System and Interferometric Synthetic Aperture Radar, Coachella Valley, California, 1996–98.
U.S. Geological Survey Water-Resources Investigations Report No. 01–4193, Sacramento, California, 31 pages, 2001.
Soetrisno, S., Pemanfaatan Airtanah, Dampak dan Penanggulangannya. Studi Kasus Cekungan Bandung, Jawa Barat. Direktorat Geologi Tata Lingkungan, Bandung, 1991.
Soetrisno, S., Impacts of urban and industrial development on groundwater, Bandung, West Java, Indonesia. Paper presented at the Symposium on Groundwater and Landuse Planning, Fremantle, Western Australia, 16–18 September 1996.
Wells, D. E., Beck, N., Delikaraoglou, D., Kleusberg, A., Krakiwsky, E. J., Lachapelle, G., Langley, R. B., Nakiboglu, M. Schwarz, K. P., Tranquilla, J. M., and Vanicek, P., Guide to GPS Positioning. Canadian GPS Associates, Fredericton, N.B., Canada, 1986.
Wirakusumah, A. D., Air Tanah Bandung Raya, Makalah disajikan pada Lokakarya Pemenuhan Kebutuhan Air Baku Di Cekungan Bandung Tahun 2025, Bandung, 28 February 2006.
Wolf, P. R. and Ghilani, C. D., Adjustment Computations, Statistics and Least Squares in Surveying and GIS, John Wiley & Sons, Inc., New York, 564 pages, 1997.
Received: Feb 14, 2008 Accepted: Apr 18, 2008 Author information H. Z. Abidin, H. Andreas, M. Gamal and D. Darmawan
Indonesia Country Report IUGG General Assembly
Melbourne, Australia June 28 – July 7, 2011
112
Geodesy Research Division Institute of Technology Bandung Jl. Ganesha 10 Bandung 40132, Indonesia E-mail: [email protected] A. D. Wirakusumah Center of Environmental Geology Geology Agency Jl. Diponegoro 57 Bandung 40122, Indonesia T. Deguchi and Y. Maruyama Earth Remote Sensing Data Analysis Center (ERSDAC) Tokyo, Japan
Indonesia Country Report IUGG General Assembly
Melbourne, Australia June 28 – July 7, 2011
113
Crustal Deformation Studies In Java (Indonesia) Using GPS
Hasanuddin Z. Abidin1), Heri Andreas1), Teruyuki Kato2), Takeo Ito3), Irwan Meilano1)3), Fumiaki Kimata3), Danny H. Natawidjaya4) And Hery Harjono4)
1) Institute Of Technology Bandung, Jl. Ganesa 10, Bandung 40132, Indonesia 2) Earthquake Research Institute, The University Of Tokyo 1-1, Yayoi 1, Bunkyo-
Ku, Tokyo 113-0032, Japan 3) Research Center For Seismology, Volcanology And Disaster Mitigation,
Graduate School Of Environmental Studies, Nagoya University, Nagoya 464-8602, Japan
4) Indonesian Institute Of Sciences (Lipi), Jl. Gatot Subroto, Jakarta, Indonesia Abstract
Along the Java trench the Australian–Oceanic plate is moving and pushing onto and subducting beneath the Java continental crust at a relative motion of about 70mm/yr in NNE direction. This subduction-zone process imposed tectonic stresses on the forearc region offshore and on the land of Java, thus causing the formation of earthquake fault zones to accommodate the plate movement. Historically, several large earthquakes happened in Java, including West Java. This research use GPS surveys method to study the inter-seismic deformation of three active faults in West Java region (i.e. Cimandiri, Lembang and Baribis faults), and the co-seismic and post-seismic deformation related to the May 2006 Yogyakarta and the July 2006 South Java earthquakes.
Based on GPS surveys results it was found that the area around Cimandiri, Lembang and Baribis fault zones have the horizontal displacements of about 1 to 2 cm/yr or less. Further research is however still needed to extract the real inter-seismic deformation of the faults from those GPS -derived displacements. GPS surveys have also estimated that the May 2006 Yogyakarta earthquake was caused by the sinistral movement of the (Opak) fault with horizontal co-seismic deformation that generally was less than 10 cm. The post-seismic horizontal deformation of the July 2006 South Java tsunami earthquake has also been estimated using GPS surveys data. In the first year after the earthquake (2006 to 2007), the post-seismic deformation is generally less than 5 cm; and it becomes generally less than 3 cm in the second year (2007 to 2008). Keywords: Crustal deformation; Java. Introduction
Along the Java trench the Australian–Oceanic plate is moving and pushing on to and subducting beneath the Java continental crust at a relative motion of about 70mm/yr in NNE direction. According to Natawidjaya [2006], this subduction-zone
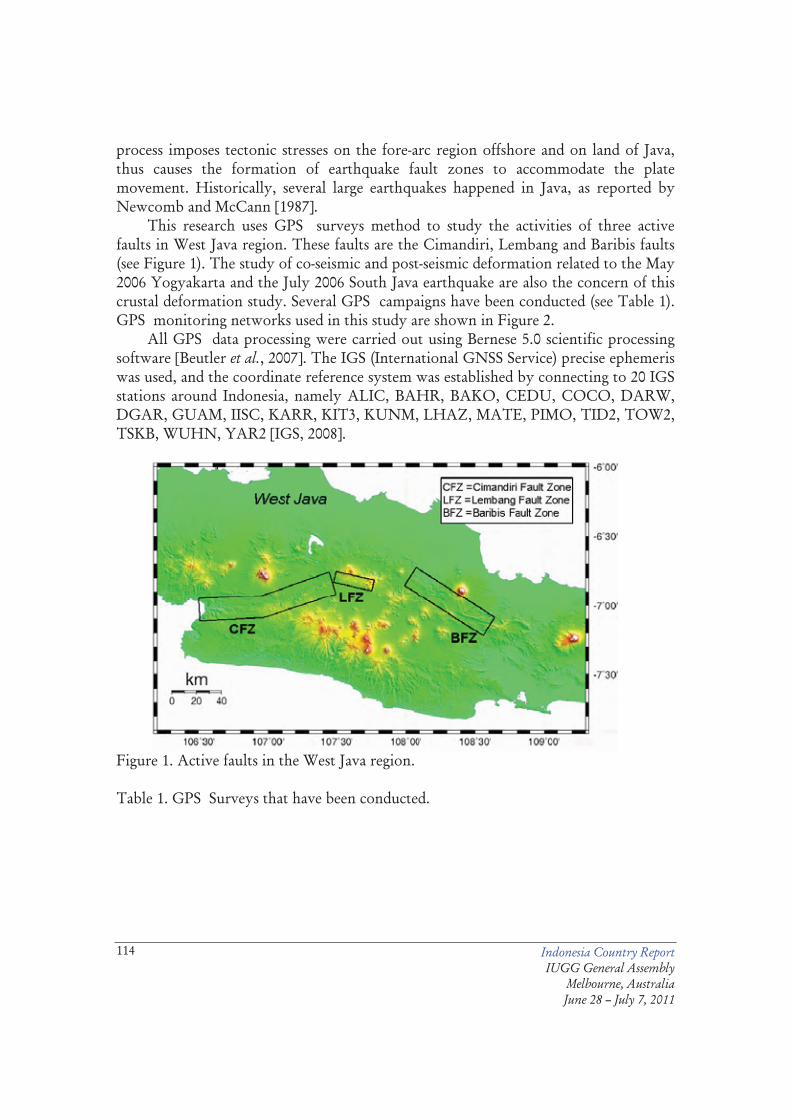
Indonesia Country Report IUGG General Assembly
Melbourne, Australia June 28 – July 7, 2011
114
process imposes tectonic stresses on the fore-arc region offshore and on land of Java, thus causes the formation of earthquake fault zones to accommodate the plate movement. Historically, several large earthquakes happened in Java, as reported by Newcomb and McCann [1987].
This research uses GPS surveys method to study the activities of three active faults in West Java region. These faults are the Cimandiri, Lembang and Baribis faults (see Figure 1). The study of co-seismic and post-seismic deformation related to the May 2006 Yogyakarta and the July 2006 South Java earthquake are also the concern of this crustal deformation study. Several GPS campaigns have been conducted (see Table 1). GPS monitoring networks used in this study are shown in Figure 2.
All GPS data processing were carried out using Bernese 5.0 scientific processing software [Beutler et al., 2007]. The IGS (International GNSS Service) precise ephemeris was used, and the coordinate reference system was established by connecting to 20 IGS stations around Indonesia, namely ALIC, BAHR, BAKO, CEDU, COCO, DARW, DGAR, GUAM, IISC, KARR, KIT3, KUNM, LHAZ, MATE, PIMO, TID2, TOW2, TSKB, WUHN, YAR2 [IGS, 2008].
Figure 1. Active faults in the West Java region. Table 1. GPS Surveys that have been conducted.

Indonesia Country Report IUGG General Assembly
Melbourne, Australia June 28 – July 7, 2011
115
Figure 2. GPS monitoring networks for studying inter-seismic deformation in Cimandiri

Indonesia Country Report IUGG General Assembly
Melbourne, Australia June 28 – July 7, 2011
116
fault (a), Lembang fault (b), Baribis fault (c); post-seismic deformation of the 2006 Yogyakarta earthquake (d); and post-seismic deformation of the 2006 South Java earthquake (e). In this picture CFZ, LFZ, BFZ and OFZ are Cimandiri, Lembang, Baribis and Opak Fault Zones, respectively.
Inter-Seismic Deformation of the Lembang, Cimandiri and Baribis Faults
Lembang fault is topographically and geologically remarkable and runs about 10 km north of Bandung in the EW direction as shown in Figure 1. According to the Directorate of Environmental Geology, the Lembang fault has an earthquake cycle of about 500 years [Pikiran Rakyat, 2004]. Relatively large population is living around the fault area, e.g. city of Bandung and town of Lembang. Cimandiri fault is an active fault in Sukabumi area (West Java), which runs in the direction from Pelabuhan Ratu, passing Sukabumi, Cianjur and Padalarang as shown in Figure 1. According to Darji et al. [1994], Cimandiri is a sinistral strike-slip fault. Several previous earthquakes such as Pelabuhanratu earthquake [1900], Cibadak earthquake [1973], Gandasoli earthquake [1982], Padalarang earthquake [1910], Tanjungsari earthquake [1972], Conggeang earthquake [1948], and Sukabumi earthquake [2001], occurred along the Cimandiri fault. Baribis fault is a thrust fault in the region of Subang–Majalengka–Kuningan, in the eastern part of West Java. Its existence is first proposed by van Bemmelen [1949], based on the name of hilly region of Baribis, located southwest of Majalengka and west of Ciremai volcano. Baribis fault can be considered as an active fault, since there have been several earthquakes occurring in the region along this fault.
Inter-seismic deformation of Lembang, Cimandiri and Baribis faults are derived from the position displacements as estimated from consecutive GPS surveys. If more than two campaigns have been conducted, then the average displacement rates were estimated. The horizontal displacements around Lembang, Cimandiri and Baribis faults as obtained from GPS surveys are shown in Figs. 3–5. The reference frame of the displacement vectors is ITRF 2000.

Indonesia Country Report IUGG General Assembly
Melbourne, Australia June 28 – July 7, 2011
117
Figure 3. Average horizontal displacement rates of the area around Lembang fault, as
estimated from GPS surveys on June 2006, August 2007 and August 2008. The rates vary spatially between 0.3 to 1.4cm/yr.
Figure 4. Average horizontal displacement rates of the area around Cimandiri fault, as
estimated from GPS surveys on December 2006, August 2007 and August 2008. The rates vary spatially between 0.5 to 1.7 cm/yr.

Indonesia Country Report IUGG General Assembly
Melbourne, Australia June 28 – July 7, 2011
118
Figure 5. Horizontal displacements of the area around Baribis fault, as estimated from
GPS surveys on June 2007 and November 2007. The displacements vary spatially between 1.0 to 2.1 cm.
Inter-seismic horizontal displacement rates around the Lembang fault area, as
estimated from GPS surveys conducted on June 2006, August 2007 and August 2008, are shown in Figure 3. The displacement due to the Sunda block motion, with the rate of about 2.7 cm/yr with the south-east direction [Bock et al., 2003] has been removed. However, the horizontal displacement rates between 0.3 to 1.4 cm/yr, are still apparent. Since the northern and southern parts of the Lembang fault are moving with relatively the same direction, this displacement should not be fully related to the activity of the Lembang fault.
These apparent horizontal displacements may be due to co-seismic deformation of the Indramayu earthquake (7.5Mw, depth of 290km) that occurred on Thursday, August 09, 2007 at 12:04:58 a.m. with its epicenter located at about 115km north of the Lembang fault [USGS, 2007]. This earthquake occurred about a week before the last GPS campaign in Lembang fault, i.e. 16–19 August 2007. Therefore, the displacements shown in Figure 5 may also contain the initial part of post-seismic deformation. However, more research and analysis should be performed to clarify this hypothesis.
Related to the Cimandiri fault, the horizontal displacement rates as estimated from GPS surveys conducted on December 2006, August 2007 and August 2008 are shown in Figure 4. The displacements due to the Sunda block motion have been removed from the solution. From Figure 4 it can be realized that the area around Cimandiri fault moves with different rates and directions, with the rates vary spatially between 0.5 to 1.7 cm/yr. In order to verify whether these motions are due to the fault activity or not, more GPS surveys should be conducted.
The estimated inter-seismic horizontal displacements in the Baribis fault area as obtained from GPS surveys conducted on May and November 2007, after a removal

Indonesia Country Report IUGG General Assembly
Melbourne, Australia June 28 – July 7, 2011
119
of the Sunda block motion, is shown in Figure 5. During this period, the displacements vary spatially between 1.0 to 2.1 cm.
Since the northern and southern parts of the Baribis fault are moving with relatively the same direction, this displacement should not be fully related to the activity of Baribis fault. As in the case of the Lembang fault, these apparent horizontal displacements may also contain the post-seismic deformation signal of the Indramayu earthquake of 9 August 2007, with its epicenter located about 150 km north-west of Baribis fault [USGS, 2007]. However, more research and analysis should be performed to clarify this hypothesis.
It should be mentioned that in the above Figs. 3–5, the 95% error ellipses are plotted at the tip of the displacement arrows. The same scales are used for both displacements and error elipses. Since they are very small, they are difficult to recognize in the figures. Co-Seismic Deformation of the 2006 Yogyakarta Earthquake The 27 May 2006 earthquake hit the Provinces of Yogyakarta and Central Java of Indonesia at 5:54 a.m. local time, with its epicenter estimated around 25km south-southwest of the Indonesian city of Yogyakarta and about 10 km below the sea bed [USGS, 2006a]. The USGS-estimated magnitude of first earthquake is Mw 6.3. Subsequently, about 750 aftershocks have been reported, with the largest intensity recorded at Mw 5.2. The 2006 Jogyakarta earthquake occurred along the active Opak fault, which runs about NE from the Parang Tritis area to the Bantul area then continue northward to the Klaten region (see Figure 6). In this case, the principle earthquake fault movement along the Opak fault might also trigger some movements along the Dengkeng fault.
A week after the earthquake, i.e. 4 to 8 June 2006, a GPS survey was conducted on 48 GPS points belonging to the 2nd order GPS network around Jogyakarta and Central Java, that was firstly observed in 1998. GPS surveys were conducted using 14 geodetic-type dual-frequency GPS receivers. Each point is observed for about 8 to 10 hours, while the reference point located in the UGM Boulevard Jogyakarta is observed continuously.

Indonesia Country Report IUGG General Assembly
Melbourne, Australia June 28 – July 7, 2011
120
Figure 6. Opak Fault and Dengkeng Fault; courtesy of Danny H. Natawidjaja.
Figure 7. Co-seismic horizontal displacements of the
Yogyakarta 2006 earthquake.
GPS results in Figure 7 show that horizontal co-seismic displacement around Bantul and Jogyakarta are mostly less than 10 cm, with mostly south and south-west directions (see Figure 7). By using the Okada model [Okada, 1985] and genetic algorithm, these derived-GPS displacements are then used to estimate the fault geometry. The estimation results indicated the existence

Indonesia Country Report IUGG General Assembly
Melbourne, Australia June 28 – July 7, 2011
121
Figure 8. The estimated fault geometry causing the 2006 Yogyakarta earthquake. of left-lateral fault with a strike of 48� and a dip of 89� (see Figure 8). This fault is located slightly to the east of the Opak fault as indicated in Figure 6. Based on the USGS Moment Tensor Solution, the dip and strike of the fault causing the Yogyakarta 2006 earthquake are 85� and 59�; and according to the Harvard Moment Tensor Solution are 90� and 51� [USGS, 2006a]. GPS -derived dip and strike, i.e. 89� and 41�, are closer to those given by the Harvard Moment Tensor Solution. Post-Seismic Deformation of the 2006 South Java Earthquake
The July 17th 2006 South Java earthquake (Mb6.1, Ms7.7 and Mw7.7, Harvard global CMT) occurred about 200 km south of western Java Island (see Figure 7). It occurred on Monday, July 17, 2006, at 3:19:28 p.m. local time (8:19:28 UTC). The USGS recorded at least 22 aftershocks south of Java ranging between magnitude 4.6 and 6.1. Two largest aftershocks measured 6.0 and 6.1 Mw [USGS, 2006b].

Indonesia Country Report IUGG General Assembly
Melbourne, Australia June 28 – July 7, 2011
122
Figure 9. Earthquake location; after [USGS, 2006b].
The July 17th 2006 South Java earthquake (Mb6.1, Ms7.7 and Mw7.7, Harvard global CMT) occurred about 200 km south of western Java Island (see Figure 9). It occurred on Monday, July 17, 2006, at 3:19:28 p.m. local time (8:19:28 UTC). The USGS recorded at least 22 aftershocks south of Java ranging between magnitude 4.6 and 6.1. Two largest aftershocks measured 6.0 and 6.1 Mw [USGS, 2006b].
In order to study the post-seismic deformation of the earthquake, three GPS surveys were conducted on July 2006, August 2007 and August 2008, by the researchers from ITB, LIPI, Nagoya University and Tokyo University. About thirty GPS points along approximately 200 km coastline were observed.
The observation length at each site is more than 18 hours. The dual-frequency geodetic type receivers were used for the observation. The GPS data were processed using Bernese 5.0 GPS processing software [Beutler et al., 2007]. In this case, the ITRF 2005 was used as a reference frame, and 23 IGS stations were involved in the processing along with all observation sites.

Indonesia Country Report IUGG General Assembly
Melbourne, Australia June 28 – July 7, 2011
123
Figure 10. Post-seismic horizontal deformation of the 2006 South Java earthquake, as
estimated from GPS surveys on July 2006 and August 2007. The displacements are in general less than 5 cm.
Figure 11. Post-seismic horizontal deformation of the 2006 South Java earthquake, as
estimated from GPS surveys on August 2007 and August 2008. The displacements are in general less than 3 cm.
The estimated post-seismic horizontal deformation is shown in Figs. 10 and 11.
It can be seen that the magnitude of post-seismic deformation between July 2006 and August 2007 is in general less than 5 cm, with increasing magnitudes toward the west direction, i.e. decreasing distances toward the epicenter. The post-seismic deformation is getting smaller with time, and between August 2007 and August 2008, its magnitudes are in general less than 3 cm. The physical reasons on the spatial variation in post-seismic deformation direction as indicated in Figs. 10 and 11 are still under investigation. Closing Remarks
Based on GPS survey results it was found that the area around Cimandiri, Lembang and Baribis fault zones have the horizontal displacements of about 1 to 2 cm/yr. Further research is however still needed to extract the real inter-seismic deformation of the faults from those GPS -derived displacements. GPS surveys have also estimated that the May 2006 Yogyakarta earthquake was caused by the sinistral movement of the (Opak) fault with horizontal co-seismic deformation that was generally less than 10 cm. The post-seismic horizontal deformation of the July 2006 South Java tsunami earthquake has also been estimated using GPS surveys data. In the

Indonesia Country Report IUGG General Assembly
Melbourne, Australia June 28 – July 7, 2011
124
first year after the earthquake (2006 to 2007), the post-seismic deformation is generally less than 5 cm; and it becomes generally less than 3 cm in the second year (2007 to 2008).
Considering the vulnerability of Java Island toward the future earthquakes and its relatively dense population, these crustal deformation studies using GPS surveys will be continued. In the future, data from newly established continuous GPS stations will be incorporated in the analysis, and possibility of InSAR-based deformation study [Massonnet and Feigl, 1998] will also be explored and implemented. References Beutler, G., Bock, H., Dach, R., Fridez, P., Gade, A., Hugentobler, U., Jaggi, A.,
Meindl, M., Mervant, L., Prange, L., Schaer, S., Springer, T., Urschl, C. and Walser, P. [2007]
Bernese GPS Software Version 5.0. In: Dach, R., Hugentobler, U., Fridez, P. and Meindl, M. (eds.), Astronomical Institute, University of Berne, 612 p.
Bock, Y., Prawirodirdjo, L., Genrich, J. F., Stevens, C. W., McCaffrey, R., Subarya, C., Puntodewo, S. S. O. and Calais, E. [2003] “Crustal motion in Indonesia from global positioning system measurements,” Journal of Geophysical Research, 108(B8), 2367, doi:10.1029/2001JB000324.
Dardji, N., Villemin, T. and Rampnoux, J. P. [1994] “Paleostresses and strike-slip movement: The Cimandiri Fault Zone, West Java, Indonesia,” Journal of Southeast Asian Earth Sciences, 9(I/2), 3–11.
IGS [2008]. The website of the International GNSS Service (IGS), http://igscb.jpl.nasa.gov/.
Massonnet, D. and Feigl, K.L. [1998] “Radar interferometry and its application to changes in the Earth’s surface,” 36(4), 441–500.
Natawidjaya, D. H. [2006] Comprehensive Environmental Assessment (CEA): Geological and Seismological Section. Final Report, Kementrian Lingkungan Hidup.
Newcomb, K. R. and McCann, W. R. [1987] “Seismic history and seismotectonics of the Sunda Arc,” Journal of Geophysical Research, 92(B1), 421–440.
Okada, Y. [1985] “Surface deformation due to shear and tensile faults in a half-space,” Bulletin Seismological Society of America, 75, 1135–1154.
Pikiran, R. [2004] “90% Izin di KBU dari Pemprov, Pemkab Bandung Merasa Dizalimi,” HU Pikiran Rakyat, Kolom Bandung Raya, Sabtu, 14 Agustus 2004.
USGS [2006a] The website of USGS (United States Geological Survey), Earthquake Hazards Program, http://earthquake.usgs.gov/eqcenter/eqinthenews/2006/usneb6/.
USGS [2006b] The website of USGS (United States Geological Survey), Earthquake Hazards Program, http://earthquake.usgs.gov/eqcenter/eqinthenews/2006/usqgaf/#details.
USGS [2007]Website of theUnited States Geological Survey, EarthquakeHazards Program, http://earthquake.usgs.gov/eqcenter/recenteqsww/Quakes/us2007fubd.php#details.

Indonesia Country Report IUGG General Assembly
Melbourne, Australia June 28 – July 7, 2011
125
Van Bemmelen, R. W. [1949] The Geology of Indonesia. Vol. IA, Government Printing Office, Martinus Nijhof, The Netherlands.

Indonesia Country Report IUGG General Assembly
Melbourne, Australia June 28 – July 7, 2011
126
The Applications of GPS CORS in Indonesia: Status, Prospect and Limitation
Hasanuddin Z. Abidin, Cecep Subarya, Buldan Muslim, Farid H. Adiyanto, Irwan Meilano, Heri Andreas, Irwan Gumilar, Indonesia Summary The use of GPS for positioning, surveying and mapping applications in Indonesia is systematically started at the end of 1980s. In this case, static surveying and real time (absolute and differential) positioning are the two most positioning modes being used. The GPS CORS in Indonesia were firstly established by the Indonesian National Coordinating Agency forSurveys and Mapping (Bakosurtanal) with three stations, i.e. in Cibinong (West Java), Medan (North Sumatra) and Parepare (South Sulawesi). In October 2009 the GPS CORS of Bakosurtanal consists of 51 continuously operating GPS reference stations. Several clusters of local GPS CORS have also been established by other governmental agencies and universities. GPS CORS prospect in Indonesia is very promising especially for maintaining the national spatial reference system to support various applications of positioning, surveying and mapping, such as in land administration, mining and transportation sectors. Observing several natural hazard phenomena in Indonesia, e.g. earthquake, tsunami volcanic eruption, land subsidence and landslide, will also be greatly improved. GPS based mapping of tropospheric water vapor and ionospheric TEC over Indonesia region will also benefit from the enormous data provided by GPS CORS. The current results of GPS CORS in Indonesia will be presented in this paper, especially those related to maintenance of the national spatial reference system, tectonic deformation monitoring and TEC mapping over Indonesia region. Potential application for land administration will be discussed. Possible limiting factors for sustainable operation of GPS CORS in Indonesia will also be critically reviewed. Key Words: GPS , Positioning, Cors, Indonesia, Reference Frame Introduction GPS is started to be used in Indonesia at the end of 1980s especially for surveying and mapping related purposes. Afterward the applications are started to increase encompassing various fields of application, from geodynamics study and deformation monitoring to land administration, transportation and recreation applications. In this case, static surveying and real time (absolute and differential) positioning are the two most positioning modes being used. Since 1992, the Indonesian National Coordinating Agency for Surveys and Mapping (Bakosurtanal) has also systematically conducted precise GPS surveys for refining and densifying the national geodetic control network

Indonesia Country Report IUGG General Assembly
Melbourne, Australia June 28 – July 7, 2011
127
of Indonesia [Subarya, 2004]. In this case, Bakosurtanal is responsible for establishing the 0th and 1st order national geodetic network. At present, these networks consisted of more than 950 GPS stations all over Indonesia, defined in the ITRF2005 reference frame. Since 1994, the National Land Agency (BPN) has also started using GPS surveys for establishing the cadastral control networks of Indonesia [Abidin et al., 1998]. These cadastral networks are the considered as the 2nd and 3rd order national geodetic networks, and are connected to the 0th and 1st geodetic networks maintained by Bakosurtanal. Since 1993, the Indonesian Ministry of Forestry has also started to use GPS surveys for establishing the control network for forest surveying, mapping and management [Soetardjo, 1999]. This forestry control network is connected to the national geodetic control networks. GPS based local geodetic networks were also established sporadically by the govermental agencies and private sectors (e.g. deformation monitoring, mining and energy, real estates, and construction of public utilities ), mainly to serve their specific needs. The GPS CORS (Continuously Operating Reference Stations) in Indonesia were firstly operated by Bakosurtanal since 1996, consisting of three stations in Cibinong,West Java (BAKO station), in Medan, North Sumatra (SAMP station), and Parepare, South Sulawesi (PARE station) [Matindas and Subarya, 2009]. Afterward, Bakosurtanal expanded this GPS CORS network, and by October 2009 the network has consisted of 51 stations. Other national agencies, such as the Indonesian Institute of Sciences (LIPI) and BPN have also started establishing their own GPS CORS network. LIPI, in collaboration with the California Institute of Technology (Caltech) and the Earth Observatory of Singapore (EOS), has established the SUGAR (Sumatera GPS Array) [Caltech, 2010; EOS, 2010]. This CORS network is mainly aimed to study the nature of large earthquakes in the subduction zones of the Sumatra Island. Recently, BPN has also tested the possibility of using GPS CORS stations for speeding up the land administration process in Indonesia [Adiyanto et al., 2009]. Several smaller and localized GPS CORS networks in Indonesia are also established by the private sectors and universities [Sunantyo, 2009]. The National GPS Cors Of Indonesia In principle, the national GPS CORS network of Indonesia, is officially the one that is established by Bakosurtanal [Subarya, 2004; Matindas and Subarya, 2009]. This network is usually termed as the Indonesian Permanent GPS Station Network (IPGSN). The primary purpose of the IPGSN is to maintain an accurate and precise geodetic reference frame over Indonesian region, and also to support a wide range of scientific and practical applications such as geodynamics and deformation monitoring, meteorological and ionospheric studies, sea level monitoring, intelligent transportation systems, and real-time based surveying and mapping applications. The establishment of IPGSN network was initiated in 1996 which is started with three stations in Cibinong (West Java), Sampali Medan (North Sumatra) and Parepare (South Sulawesi). The network was afterward systematically strengthened with more stations, and after the

Indonesia Country Report IUGG General Assembly
Melbourne, Australia June 28 – July 7, 2011
128
Sumatra-Andaman earthquake and tsunami of 26 December 2004, the IPGSN network was rapidly developed. This rapid development is part of the development of the Indonesian Tsunami Early Warning System (InaTEWS). Afterward, Bakosurtanal expanded this GPS CORS network, and by October 2009 the network has consisted of 51 stations. The current status of IPGSN is depicted in Figure 1.
Figure 1. The current status of the Indonesian Permanent GPS Stations Network
(IPGSN). It consists of 14 stations located around the Sunda Strait and West Java and 7 stations in the eastern end of Java and Bali Island (inside open red ellipses); 10 stations are located along Flores thrust-fault (inside open blue square); 7 stations near seismometer stations (orange circles); 7 stations near or on tide gauge stations (reverse triangles); 7 geodetic (old) stations (green squares); and 10 stations will be install in 2010 (blue circle). After Matindas and Subarya (2009).

Indonesia Country Report IUGG General Assembly
Melbourne, Australia June 28 – July 7, 2011
129
Figure 2. The IPGSN geodetic monument types: (a) on the top of concrete roof, (b) concrete pillar, (c) stainless-steel rod, and (d) on a tide gauge station. Photos are taken by Cecep Subarya.
All stations of IPGSN use the high precision L1/L2 geodetic type GPS receivers (i.e. Ashtech UZ-12, Leica GRX1200 family, Topcon GB-1000 and Net G3, and Septrentio PolarX2) with choke ring antennas and radomes, and most of the GPS receivers equipped with meteorological (temperature, pressure and humidity) sensors [Subarya et al., 2010]. Besides GPS receiver, the station also equipped with a radio or VPN-IP modem for data communication, sufficient batteries and solar panels to charge the batteries. GPS data is recorded at 1Hz rate and streamed in real time or near real time of 1 hour latency to the data processing center at Bakosurtanal office in Cibinong, West Java. Considering the stringent geodetic requirements for the IPGSN, stable geodetic monuments are constructed at all locations with various types of geodetic monuments as shown in Figure 2. Status Of Other GPS Cors In Indonesia Besides the national GPS CORS established and maintained by Bakosurtanal, other national agencies, such as the Indonesian Institute of Sciences (LIPI) and BPN have also started establishing their own GPS CORS network. LIPI, in collaboration with the California Institute of Technology (Caltech) and the Earth Observatory of Singapore (EOS), has established the SUGAR (Sumatera GPS Array) network, consisting of 32 continuous stations [Natawidjaja, 2010]. The location and distribution of these stations are shown in Figure 3. The location and distribution of these stations are shown in Figure 3. All stations are equipped with the dual-frequency geodetic type receivers, with choke ring antennas and radomes; and record the data with 1 Hz data rate. The data collected by this CORS network has been used to study the deformation related characteristics of large earthquakes in the subduction zones of the Sumatra island.

Indonesia Country Report IUGG General Assembly
Melbourne, Australia June 28 – July 7, 2011
130
Figure 3. The location and distribution of 32 SUGAR stations. In order to speed up the land administration process in Indonesia, BPN has also started to establish GPS CORS, consisting of Class-A and Class-B type stations (see Figure 4). Three stations around the capital city of Jakarta, i.e. Tangerang, Bekasi and Bogor, have been established and tested [Adiyanto et al., 2009]. In 2010, other 33 CORS stations will be established in Java and Bali and other strategic areas outside Java and Bali.
Figure 4. Planned location and distribution of BPN GPS CORS station in Java
[Adiyanto and Wibisono, 2009]. Class-A and Class-B stations are denoted with red and yellow circles respectively.
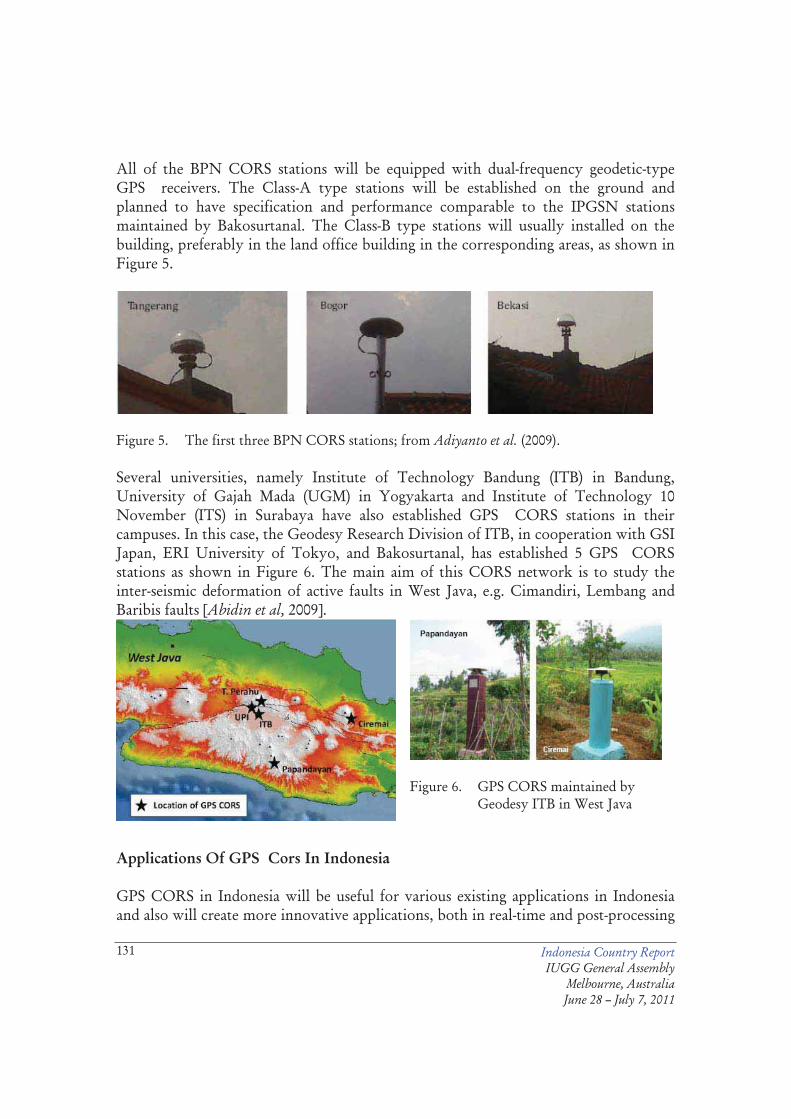
Indonesia Country Report IUGG General Assembly
Melbourne, Australia June 28 – July 7, 2011
131
All of the BPN CORS stations will be equipped with dual-frequency geodetic-type GPS receivers. The Class-A type stations will be established on the ground and planned to have specification and performance comparable to the IPGSN stations maintained by Bakosurtanal. The Class-B type stations will usually installed on the building, preferably in the land office building in the corresponding areas, as shown in Figure 5.
Figure 5. The first three BPN CORS stations; from Adiyanto et al. (2009). Several universities, namely Institute of Technology Bandung (ITB) in Bandung, University of Gajah Mada (UGM) in Yogyakarta and Institute of Technology 10 November (ITS) in Surabaya have also established GPS CORS stations in their campuses. In this case, the Geodesy Research Division of ITB, in cooperation with GSI Japan, ERI University of Tokyo, and Bakosurtanal, has established 5 GPS CORS stations as shown in Figure 6. The main aim of this CORS network is to study the inter-seismic deformation of active faults in West Java, e.g. Cimandiri, Lembang and Baribis faults [Abidin et al, 2009].
Figure 6. GPS CORS maintained by
Geodesy ITB in West Java
Applications Of GPS Cors In Indonesia GPS CORS in Indonesia will be useful for various existing applications in Indonesia and also will create more innovative applications, both in real-time and post-processing

Indonesia Country Report IUGG General Assembly
Melbourne, Australia June 28 – July 7, 2011
132
modes, as shown in Table 1. The existence of GPS CORS networks will be very useful for Indonesia, a vast archipelago consisting of more than 17.000 islands and has population of more than 200 millions. GPS CORS stations will be useful as the reference stations for various GPS -based positioning, surveying and mapping applications. Differential based GPS positioning for various applications, such as for topographic and thematic mapping, marine surveying, photogrammetry, oil and gas exploration and exploitation, cadastral surveying, construction surveys, forestry and agriculture mapping, and for boundary demarcation; will be benefitted by GPS CORS stations. Table 1. Existing and potential utilization and function of GPS CORS.
Utilization and Function of GPS CORS
Real-time mode Post-processing mode
Early warning system for various natural hazards in Indonesia
The coordinate reference frame for various positioning, surveying and mapping applications in Indonesia.
The Network-RTK system for surveying and mapping applications.
The coordinate reference frame for monitoring andstudying natural hazard phenomena in Indonesia
The reference stations for supporting various navigation and transportation applications (land, marine, air).
The monitoring network for geodynamics and tectonic studies in Indonesian region.
Integration, checking and validation for various coordination reference systems
Studying and mapping the characteristics of troposphere and ionosphere above Indonesian territory.
GPS CORS will also have significant impact for natural hazard mitigation applications. The Indonesian archipelago located at the junction of the Eurasia, Australia, Pacific, and Philippine Sea plates, resulting in wide spectrum topography, frequent earthquakes, and volcanism [Hamilton, 1979]. In the west, the Australia plate subducts beneath the Eurasia plate along the Java trench while to the east, the continental part to the east, the continental part of the Australia plate collides with the Banda arc and the Pacific-oceanic plate. Indonesian region is therefore prone to earthquakes, tsunamis and volcanic eruptions. Considering is rugged topography and usually heavy rainfall, landslide and flooding are also other prominent natural hazards that continuously affecting Indonesia. Land subsidence moreover also affecting some large cities in Indonesia. Up to now since about 1992, GPS surveys have been extensively used to study the characteristics and aspects of several natural hazard phenomena, namely earthquake [e.g. Bock et al., 2003; Subarya et al., 2006; Abidin et al., 2009], volcanic eruption [e.g. Abidin et al., 2004; 2005; 2008c], land subsidence [e.g.

Indonesia Country Report IUGG General Assembly
Melbourne, Australia June 28 – July 7, 2011
133
Abidin et al., 2008a; 2008b], and landslide [e.g. Abidin et al., 2007]. By also using continuous GPS data from GPS CORS stations, then more detail characteristics of natural hazard phenomena can be studied, as shown by the examples in Figure 7. These results based on GPS continuous data are related to the 13 September 2007 Bengkulu earthquake [Meilano et al., 2009] and the eruption of Papandayan volcano on 20 November 2002 [Abidin et al., 2005]. Based on the examples shown in Figure 7 it can be realized that by locating GPS CORS stations on specific areas on and around subduction zones, active faults and active volcanoes, the CORS system may also function as the early warning system for earthquake and volcano eruption. However, in order to realize it, this potential use of GPS CORS for the early warning systems have to be supported by the reliable real-time data communication andpowerful and sophisticated real-time GPS data processing.
Figure 7. The potential applications of GPS continuous data for studying the characteristics of deformation related to the eruption of Papandayan volcano on 20 Nov. 2002 (above) and the 13 Sept. 2002 Bengkulu earthquake (below)
The existence of dense and reliable GPS CORS stations in Indonesia will actually be beneficial not only for natural hazard mitigation; but it will also important for supporting surveying and mapping applications, GPS -based meteorology, and Intelligent Transport System (ITS) of Indonesia. In order to support the transportation sectors, the CORS should also have a functional capability of being as regular DGPS (Differential GPS ) system. In the case of surveying and mapping, GPS CORS will have tremendous impacts in Indonesia, mainly for cadastral, construction and public utility, and mining surveying and positioning related activities. In the case of transportation sector, land and marine sectors will be most benefitted. The potential use of GPS continuous data for mapping of Total Electron Content (TEC) over Indonesian region is indicated by the results shown in Figure 8. These monthly TEC models were derived using data from 10 GPS CORS data in and around Indonesia, i.e.

Indonesia Country Report IUGG General Assembly
Melbourne, Australia June 28 – July 7, 2011
134
from 6 IPGSN stations (SAMP, BAKO, KOEP, TOLI, PARN and BIKL) and 4 IGS stations (NTUS, COCO, DARW, and PIMO). More detail and comprehensive results on this ionospheric study can be seen in Muslim (2009). As in the case of GPS derived coordinate variation, the GPS derived TEC values have also the potential to be used as a kind of early warning for large earthquake, as shown by example given in Figure 9. In this case, it can be seen that a few days prior to the 26 December 2004 mega thrust Sumatra-Andaman earthquake, the ionospheric anomalies can be seen in GPS derived TEC using SAMP, NTUS and IISC continuous GPS data [Muslim, 2009]. However more research is still needed to clarify this pre-seismic GPS derived ionospheric anomaly.
Figure 8. Example of Monthly TEC Model for Indonesia from GPS Continuous Data
[Muslim, 2009].
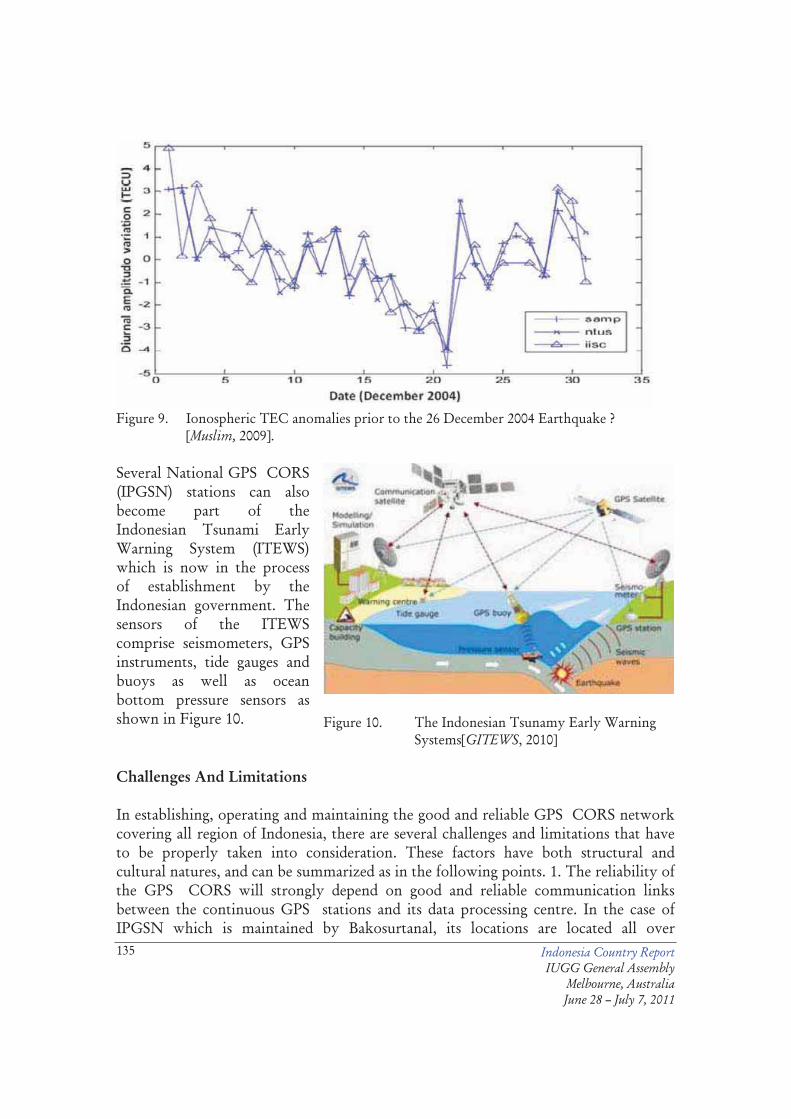
Indonesia Country Report IUGG General Assembly
Melbourne, Australia June 28 – July 7, 2011
135
Figure 9. Ionospheric TEC anomalies prior to the 26 December 2004 Earthquake ?
[Muslim, 2009]. Several National GPS CORS (IPGSN) stations can also become part of the Indonesian Tsunami Early Warning System (ITEWS) which is now in the process of establishment by the Indonesian government. The sensors of the ITEWS comprise seismometers, GPS instruments, tide gauges and buoys as well as ocean bottom pressure sensors as shown in Figure 10.
Figure 10. The Indonesian Tsunamy Early Warning
Systems[GITEWS, 2010] Challenges And Limitations In establishing, operating and maintaining the good and reliable GPS CORS network covering all region of Indonesia, there are several challenges and limitations that have to be properly taken into consideration. These factors have both structural and cultural natures, and can be summarized as in the following points. 1. The reliability of the GPS CORS will strongly depend on good and reliable communication links between the continuous GPS stations and its data processing centre. In the case of IPGSN which is maintained by Bakosurtanal, its locations are located all over

Indonesia Country Report IUGG General Assembly
Melbourne, Australia June 28 – July 7, 2011
136
Indonesia, and the data processing centre at Bakosurtanal, Cibinong in West Java. Considering the vast area being cover, the archipelagic nature of Indonesia, relatively high spatial divide in the communication infrastructure inside the Indonesian region, and the remoteness of most of continuous GPS stations, the internet and satellite-based communication link seem to be the most effective solution for IPGSN. However, this mode of communication is relatively expensive; and in the case of internet connection, the 100% integrity and reliability cannot always be achieved, even in Java island region which has a relatively best communication infrastructure. 2. In order to have good, reliable and continuous mode of operation, all remote continuous GPS stations will also require proper and continuous maintenance and caring. Each station will therefore need proper resources all year long, e.g. electrical power supply, related hardware and software resources, and human resources for checking and taking care the station site and equipments. The difficulty in operating and maintaining the GPS CORS station in Indonesia will vary and usually getting more difficult when its location getting farther away from Java island and/or from the urban areas. The financial support for the daily operation and maintenance of GPS CORS stations therefore should always be considered, preferably in the long term basis. In the case of national GPS CORS such as IPGSN, the political will and continuous support from the central government is indeed necessary. 3. Maintenance and operation of the relatively large scale GPS CORS networks in Indonesia, such as those presently maintained by Bakosurtanal and in future also by BPN; will require also conducive and professional working culture, and also good support from dedicated and professional human resources. This human capital, is not needed just to operate and maintain the whole system, but also to process the collected data and analyze the obtain results for various applications and interests. At present times, the working culture in the government offices are not always compatible and suitable with the working culture needed for maintaining and operating the good and reliable GPS CORS networks. The number of qualified and dedicated persons for maintaining and operating GPS CORS should also be increased and provided with proper reward and remuneration. In this case, outsourcing part of the operational and maintenance activities of GPS CORS network to the private company may also be considered. 4. Since the large scale GPS CORS network covering Indonesian region will require substantial amount of qualified human capital, the related human resource development program should also be systematically planned by the related institutions (e.g. Bakosurtanal and BPN). In terms of high learning institutions, at present times in Indonesia there are four state universities (ITB Bandung, UGM Yogyakarta, ITS Surabaya, and Undip Semarang) and three private universities (Itenas Bandung, ITN Malang, University of Pakuan Bogor) that have study programs on surveying, geodesy and/or geomatics engineering. In the context of GPS CORS related capacity building in related institution, those high learning institutions, besides supplying their graduates can also offer various Continuing Education Programs (CEP) for enhancing the competency of human resources belonging to various agencies related to the GPS

Indonesia Country Report IUGG General Assembly
Melbourne, Australia June 28 – July 7, 2011
137
CORS programs. 5. Since the development of good and reliable national GPS CORS network (e.g. IPGSN) will absorb a lot of money and efforts, the use of the system is preferably not just only for supporting one specific sector such as positioning, surveying and mapping. Instead it should also support other national needs and interests, such as natural hazard mitigation and intelligent support system. Since each application usually will have their own specification on data requirement and management, then the GPS CORS system should beadaptively designed and operated to fully support those various applications. Closing Remarks World-wide development of GPS CORS is increasing rapidly, due to increasing availability, accuracy, reliability and integrity of GPS systems; and also to advancements in electronics, instrumentation and control fields. The applications of GPS CORS in Indonesia has also steadily growing and has good opportunity to serve various national, regional and local needs and interests. The existence of good and reliable GPS CORS network covering the Indonesian archipelago would greatly increase our ability of observing the Earth system dynamics and phenomena in the region; and at the same time increasing the accuracy and reability of the national spatial (geodetic) reference system for supporting various applications and needs related to positioning, navigation, surveying and mapping in the Indonesian region. The advancements of GPS CORS networks in Indonesia should also be supported by proper legal infrastructures and qualified human resources. The support and endorsements from central government, parliament, related governmental agencies and high learning institutions will therefore also be important for suistainable development of GPS CORS in Indonesia. Finally, it should be emphasized that some of GPS CORS applications in Indonesia (e.g. positioning, surveying and mapping and also intelligent transportation systems), if professionally managed can generate a substantial amount of revenue for government and also private sector. Therefore if is considered suitable, the business prospects and plan of the national GPS CORS system of Indonesia should also be taken into consideration and systematically be prepared. REFERENCES Abidin, H. Z., A. Jones, K. Sarah, and R. Anshari (1998). "GPS Groundwork :
Building Indonesia’s Cadastral Network." GPS World, September, Volume 9, Number 9, pp. 56 - 62.
Abidin, H.Z., H. Andreas, M. Gamal, M. Hendrasto, Ony K. Suganda, M.A. Purbawinata, Irwan Meilano, and F. Kimata (2004). “The Deformation of Bromo Volcano as Detected by GPS Surveys Method”. Journal of Global Positioning Systems, Vol.3, No. 1-2, pp.16-24.
Abidin, H.Z., H. Andreas, M. Gamal, O.K. Suganda, I. Meilano, M. Hendrasto, M.A. Kusuma, D. Darmawan, M.A. Purbawinata, A.D. Wirakusumah, F. Kimata

Indonesia Country Report IUGG General Assembly
Melbourne, Australia June 28 – July 7, 2011
138
(2005). " Ground Deformation of Papandayan Volcano Before, During and After Eruption 2002 as Detected by GPS Surveys." GPS Solutions. Springer-Verlag GmbH, ISSN: 1080-5370 (Paper) 1521-1886 (Online), DOI: 10.1007/s10291-005-0009-1.
Abidin, H. Z., Andreas, H., Gamal, M., Sadarviana, V., Darmawan, D., Surono, Hendrasto, M. and Suganda, O. K. (2007) Studying Landslide Displacements in the Ciloto Area (Indonesia) Using GPS Surveys, Journal of Spatial Science, Mapping Science Institute Australia, Vol. 52, No. 1. Website : http://www.mappingsciences.org.au/journal/june_07.html
Abidin, H.Z. , H. Andreas, R. Djaja, D.Darmawan and M. Gamal (2008a). “Land subsidence characteristics of Jakarta between 1997 and 2005, as estimated using GPS surveys”, GPS Solutions, Springer Berlin / Heidelberg, Vol. 12, No. 1, pp. 23-32.
Abidin, H.Z., H. Andreas, M. Gamal, A. D. Wirakusumah, D. Darmawan, T. Deguchi, Y. Maruyama (2008b). “Land subsidence characteristics of the Bandung Basin, Indonesia, as estimated from GPS and InSAR”, Journal of Applied Geodesy, September 2008, Vol. 2, No. 3 : Pages 167–177, de Gruyter, DOI : 10.1515/JAG.2008.019.
Abidin, H.Z., R. J. Davies, M. A. Kusuma, H. Andreas, T. Deguchi (2008c). “Subsidence and uplift of Sidoarjo (East Java) due to the eruption of the Lusi mud volcano (2006–present)”, Environmental Geology, Springer, DOI 10.1007/s00254-008-1363-4.
Abidin, H.Z., H.Andreas, T. Kato, T. Ito, I. Meilano, F. Kimata, D.H. Natawidjaya and H. Harjono (2009). “Crustal Deformation Studies in Java (Indonesia) Using GPS . Journal of Earthquake and Tsunami, World Scientific Publishing Company, Vol. 3, No. 2 (2009) 77–88.
Adiyanto, F.H. and G. Wibisono (2009). “Application and Development of National CadastralReference System at BPN”, in Indonesian, Paper presented at the Annual Scientific Forum of the Indonesian Surveyor of Indonesia (FIT ISI) 2009, 3 December, Semarang
Adiyanto, F.H., G. Wibisono, and B. Ardiantoro (2009). ”Roadmap of developing GNSS CORS networks for cadastral surveying in Indonesia”, Proceedings of the 10th South East Asian Survey Congress, 4 - 7 August 2009, BICC, Nusadua, Bali, Indonesia, pp. 226-234.
Bock, Y., L. Prawirodirdjo, J. F. Genrich, C. W. Stevens, R. McCaffrey, C. Subarya, S. S. O. Puntodewo and E. Calais (2003).” Crustal motion in Indonesia from Global Positioning System Measurements.” Journal of Geophysical Research, Vol. 108, No. B8, 23-67.
Caltech (2010). Website of the Sumatran Plate Boundary Project, California Institute of Technology (Caltech). Site address: http://www.tectonics.caltech.edu/sumatra/index.html, accessed 4 January 2010.

Indonesia Country Report IUGG General Assembly
Melbourne, Australia June 28 – July 7, 2011
139
Caltech DGPS (2010). Website of the Division of Geological and Planetary Sciences, California Institute of Technology (Caltech). Site address: http://www.gps.caltech.edu/feature_articles/show/16, accessed 11 January 2010.
EOS (2010). Website of the Earth Observatory of Singapore (EOS). Site address: http://www.earthobservatory.sg/, accessed 11 January 2010.
GITEWS (2010). Website of the German Indonesian Tsunami Early Warning System. Site address: http://www.gitews.org/, accessed 18 January 2010.
Hamilton, W. (1979) “Tectonics of the Indonesian region”, USGS Profesional Paper 1078, U. S. Geological Survey, Boulder, Colorado.
Matindas, R.W. and C. Subarya (2009). ”Present Status of the Indonesian Permanent GPS Station Network and Development”, Paper presented at the 7th FIG Regional Conference 2009, Hanoi, Vietnam, 19 - 22 October.
Meilano, I., H.Z. Abidin, D.A. Sarsito and D. Gunawan (2009). ”GPS observation of Coseismic and Post-seismic Deformation of the 2007 Bengkulu Earthquake”, paper presented at the Seminar on GNSS Applications: Tools for Earth Studies and Tsunami Hazard, UTHM, Johor, August 10.
Muslim, B. (2009). ”Low Latitude Ionospheric Modeling Over Indonesia from GPS Data”, PhD Thesis, Department of Geodesy and Geomatics Engineering, Institute of Technology Bandung.
Natawidjaja, D.H. (2010). Personal Communication. Researcher at the Geotechnology Research and Development Center of LIPI, by e-mail ([email protected]), Wednesday, January 06.
Soetardjo,D.P. (1999). "Penelusuran Sejarah Penataan Batas Areal Hutan di Indonesia dan Perspekti Perubahan Teknologi Dalam Penataan Batas Areal Hutan dengan Menggunakan Metode GPS ." Proceedings of One-day Seminar on the Application of GPS Technology for Boundary Governance of Forest Areas, Bogor, 2 December, Paper no. 2.
Subarya, C. (2004). ”The Maintenance of Indonesia Geodetic Control Network - In the EarthDeforming Zones”, Paper of the 3rd FIG Regional Conference, Session TS8 – Reference Frame in Practice, Jakarta, Indonesia, October 3-7.
Subarya, C., M. Chlieh, L. Prawirodirdjo, J.P. Avouac, Y. Bock, K. Sieh, A.J. Meltzner, D.H. Natawidjaja, R. McCaffrey (2006). ”Plate-boundary deformation associated with the great Sumatra–Andaman earthquake”, Nature, Vol 440, 2 March, doi:10.1038/nature04522, pp. 46-51.
Subarya, C., H.Z. Abidin, W. Kuncoro and J. Efendi (2010). ”GPS Analysis Strategies to Minimize the Error Contribution to Geodetic GPS Determination”, Paper to be presented at the FIG Congress 2010, Sydney, Australia, 11-16 April.
Sunantyo, A. (2009). ”GNSS CORS Infrastructure and Standard in Indonesia”, Paper presented at the 7th FIG Regional Conference 2009, Hanoi, Vietnam, 19 - 22 October.

Indonesia Country Report IUGG General Assembly
Melbourne, Australia June 28 – July 7, 2011
140
Biographical Notes Prof. Dr. Hasanuddin Z. Abidin, is a Professor and Head of Geodesy Research Division, Faculty of Earth Science and Technology, Institute of Technology Bandung, Indonesia. He obtained his Insinyur degree from Dept. of Geodetic Engineering, ITB in 1985, and his MSc.Eng and PhD degrees from the Department of Geodesy and Geomatics Engineering (previously Dept. of Surveying Engineering), Univ. of New Brunswick, Canada, in 1989 and 1992 respectively. His academic background is related to the theory and applications of satellite geodesy; and his research works up to the present times includes the following areas, namely : ambiguity resolution of GPS signals; the use of GPS system for geodetic surveying, land surveying, cadastral surveying, and marine applications; use of GPS survey method for monitoring volcano deformation, land subsidence, landslide, and dam deformation; geodetics aspects of the international boundary; and integration of GPS and INSAR for deformation study. Contacts Prof. Dr. Hasanuddin Z. Abidin Geodesy Research Division Faculty of Earth Science and Technology Institute of Technology Bandung, Jl. Ganesa 10 Bandung INDONESIA Tel. + 62-22-2534286 Fax + 62-22-2534286 Email: [email protected] and [email protected] Web site: http://geodesy.gd.itb.ac.id/hzabidin

Indonesia Country Report IUGG General Assembly
Melbourne, Australia June 28 – July 7, 2011
141
Land Subsidence Characteristics of the Jakarta Basin (Indonesia) and its Relation with Groundwater Extraction
and Sea Level Rise [1]Hasanuddin Z. Abidin, [1]Heri Andreas, [1]M. Gamal, [1]Irwan Gumilar, [2]Maurits Napitupulu,
[3]Yoichi Fukuda, [4]T. Deguchi, [4]Y. Maruyama, [5]Edi Riawan
[1] Geodesy Research Division, Institute of Technology Bandung, Jl. Ganesha 10, Bandung, Indonesia, E-mail : [email protected]
[2] Provincial Industry and Energy Agency of DKI Jakarta, Indonesia [3] Graduate School of Science, Kyoto University, Japan [4] Earth Remote Sensing Data Analysis Centre (ERSDAC), Tokyo, Japan [5] Centre for Coastal and Marine Development, Institute of Technology Bandung, Jl.
Ganesha 10, Bandung, Indonesia Abstract Jakarta is the capital city of Indonesia with a population of about 9 million people, inhabiting an area of about 660 km2. It has been reported for many years that several places in Jakarta are subsiding at different rates. Over the period of 1982–1997, subsidence ranging from 20 to 200 cm is evident in several places in Jakarta. There are four different types of land subsidence that can be expected to occur in the Jakarta basin, namely: subsidence due to groundwater extraction, subsidence induced by the load of constructions (i.e., settlement of high compressibility soil), subsidence caused by natural consolidation of alluvial soil and tectonic subsidence. In addition to the levelling surveys, GPS survey methods and InSAR measurements have been used to study land subsidence in Jakarta. This paper describes the characteristics of subsidence in Jakarta over the period of 1982 to 2007 as observed by the three methods. In general land subsidence in Jakarta exhibits spatial and temporal variations, with rates of about 1 to 15 cm/year. A few locations can have subsidence rates up to about 20-25 cm/year. It was found that the spatial and temporal variations in land subsidence correlate with variations in groundwater extraction, coupled with the characteristics of sedimentary layers and building loads above it. The observed subsidence rates in several locations show a positive correlation with known volumes of groundwater extraction. However, the relative magnitude and spatial variability of the effect of groundwater extraction on land subsidence in the whole Jakarta basin is not yet fully understood. In the coastal areas of Jakarta, the combined effects of land subsidence and sea level rise also introduce other collateral hazards, namely the tidal flooding phenomena. Keywords: Jakarta, Land subsidence, Levelling, GPS , InSAR, Groundwater, Sea Level Rise

Indonesia Country Report IUGG General Assembly
Melbourne, Australia June 28 – July 7, 2011
142
Introduction
Land subsidence is not a new phenomenon for Jakarta, the capital city of Indonesia. It has been reported for many years that several areas of Jakarta are subsiding at different rates [Murdohardono &Tirtomihardjo, 1993; Murdohardono & Sudarsono, 1998; Rajiyowiryono, 1999]. The impact of land subsidence in Jakarta is observed in several forms, such as cracking of permanent constructions and roads, wider expansion of flooding areas, malfunction of drainage systems, and increased inland seawater intrusion. Based on several studies [Murdohardono and Sudarsono, 1998; Rismianto and Mak, 1993; Harsolumakso, 2001; Hutasoit, 2001], there are four different types of land subsidence that can be expected to occur in the Jakarta basin, namely: subsidence due to groundwater extraction, subsidence induced by the load of constructions (i.e. settlement of high compressibility soil), subsidence caused by natural consolidation of alluvial soil, and geotectonic subsidence. The first three are thought to be the dominant types of land subsidence in Jakarta basin. In the case of Jakarta, comprehensive information on the characteristics of land subsidence is applicable to several important planning and mitigation efforts (see Figure 1), such as spatial-based groundwater extraction regulation, effective control of flood and seawater intrusion, environmental conservation, design and construction of infrastructure, and spatial development planning. Considering the importance of land subsidence information for supporting development activities in the Jakarta area, monitoring and studying the characteristics of this subsidence phenomenon becomes morevaluable. Since the early 1980's, land subsidence in several areas of Jakarta has been measured using a variety of measurement techniques including levelling surveys, extensometer measurements, groundwater level observations, GPS (Global Positioning System) surveys, and INSAR (Interferometric Synthetic Aperture Radar) [Abidin, 2005; Abidin et al., 2001, 2004, 2008]. The prediction of ground subsidence, based on models incorporating geological and
Figure 1. The importance of land subsidence
information.
hydrological parameters of Jakarta, has also been investigated [Murdohardono and Tirtomihardjo, 1993; Yong et al., 1995; Purnomo et al., 1999]. This paper describes the characteristics of land subsidence in the Jakarta basin during the period of 1982 to

Indonesia Country Report IUGG General Assembly
Melbourne, Australia June 28 – July 7, 2011
143
2007, as observed by levelling surveys, GPS surveys and InSAR. Theoretically, groundwater extraction that exceeds aquifer recharge could lead to a decline in groundwater levels (piezometric head), reducing the hydrostatic pressures supporting the aquifer material and causing land subsidence. Therefore the correlation between the observed subsidence and groundwater extraction volumes in the Jakarta area will also be studied. Jakarta and its characteristics The city of Jakarta has a population of about 9 million people [BPS Jakarta, 2007], inhabiting an area of about 661.52 km2. Jakarta is located on the lowland of the northern coast of the West Java province (centred at coordinates of about -6o15' latitude and +106o50' longitude), as shown in Figure 2. The area is relatively flat, with topographical slopes ranging between 0o and 2o in the northern and central parts, and between 0o and 5o in the southern part. The southernmost area of Jakarta has an altitude of about 50 m above mean sea level (MSL). The average annual rainfall in the Jakarta area is about 2000 mm/year, with the maximum monthly average occurring in January and the minimum occurring in September.
Figure 2. Jakarta and its
surrounding areas.
Regionally speaking, Jakarta is a lowland area which has five main landforms, namely: (1) volcanic alluvial fan landforms, which are located in the southern part; (2) landforms of marine-origin, which are found in the northern part adjacent to the coastline; (3) beach ridge landforms, which are located in the northwest and northeast parts; (4) swamp and mangrove-swamp landforms, which are encountered in the coastal fringe; and (5) former river channels, which run perpendicular to the coastline [Rimbaman and Suparan, 1999; Sampurno, 2001]. It should also be noted that there are about 13 natural and artificial rivers flowing through Jakarta, of which the main rivers, such as Ciliwung, Sunter, Pesanggrahan, Grogol and their tributaries, form the main drainage system of Jakarta. In terms of geological and hydrological settings, according to Yong et al. (1995), the Jakarta basin consists of a 200 to 250 m thick sequence of Quaternary deposits which overlies Tertiary sediments. The base of the Quaternary deposits has been defined as the lower boundary of the groundwater basin. The Quaternary sequence can be further subdivided into three major units, which, in ascending order are: a sequence of Pleistocene marine and non-marine sediments, a late

Indonesia Country Report IUGG General Assembly
Melbourne, Australia June 28 – July 7, 2011
144
Pleistocene volcanic fan deposit, and Holocene marine and floodplain deposits. Three aquifers are recognized within the 250 m thick sequence of Quaternary sediment of the Jakarta basin, namely: the Upper Aquifer, an unconfined aquifer, occurs at a depth of less than 40 m; the Middle Aquifer, a confined aquifer, occurs at a depth between 40 and 140 m; and the Lower Aquifer, a confined aquifer, occurs at a depth between 140 and 250 m [Soetrisno et al.,1997; Hadipurwo,1999]. The geologic materials confining these aquifers are silt and clay. Inside those aquifers, the groundwater generally flows from south to the north [Lubis et al., 2008]. Below a depth of 250 m, an aquifer in the Tertiary sediments also has been identified. But according to Murdohardono and Tirtomihardjo (1993), it is less productive and its water quality is relatively poor. Land subsidence as observed by levelling surveys The first reliable information about subsidence in Jakarta came from results of levelling surveys. The systematic levelling surveys covering much of the Jakarta area were conducted in 1978, 1982, 1991, 1993, and 1997. Except for the last survey, which was performed by the Local Mines Agency of Jakarta, the levelling surveys were done by the Local Surveying and Mapping Agency of Jakarta. The levelling surveys were done using Wild N3, Zeiss Ni002, and Wild NAK precise levelling instruments. Each levelling line was measured in double-standing mode, and each levelling session was measured forward and backward to provide survey closure and to verify accuracy. The levelling line for each session is about 1 km in length. The tolerance for the difference between the forward and backward height-difference measurements is set to be 4�D mm, where D is the length of levelling line in km. After applying relatively strict quality assurance criteria, only three surveys were considered sufficiently accurate for investigating the land subsidence in Jakarta; those conducted in 1982, 1991, and 1997. Moreover, only the results from specific levelling points in the network, which are considered the most reliable, are used for investigating land subsidence. In this case, repeatability of the heights obtained from different surveys and different loops, and stability of the monument with respect to its local environment, are used as the main criteria for selecting the points. The distribution of these levelling points is shown in
Figure 3. Levelling network in Jakarta.

Indonesia Country Report IUGG General Assembly
Melbourne, Australia June 28 – July 7, 2011
145
Figure 3. The network consists of about 80 points distributed across Jakarta. The magnitude of land subsidence was estimated using 45 selected points from the levelling networks of 1982, 1991, and 1997. Based on those levelling surveys, over the 15-year period of 1982 to 1997, subsidence ranging from 20 cm to 200 cm is evident at several places in Jakarta. Figure 4 shows that the maximum land subsidence observed by the levelling surveys during the period of 1991-97 is about 160 cm, while for the period of 1982-91 it is about 80 cm. The rates of land subsidence during the period of 1991-97 are also, in general, larger than those during the 1982-91 period, as indicated by the box-and-whisker plot shown in Figure 5. In general the subsidence rates in Jakarta area during this period are about 1-5 cm/year and can reach 25 cm/year at several locations (see Figure 5). From Figure 4 it can be seen that land subsidence in the northern part of Jakarta, which is close to the sea, is larger than in the southern part of Jakarta. In this case, three regions, namely two in the northwestern part (Cengkareng and Kalideres districts) and one in the northeastern part of Jakarta (Kemayoran-Sunter district), show the largest subsidence compared to the other regions. More comprehensive results on levelling-based subsidence in Jakarta can be seen in Abidin et al. (2001).
Figure 4. Land subsidence in Jakarta measured from levelling surveys (in metres),
Over the periods of 1982 – 1991 (left) and 1991 – 1997 (right).

Indonesia Country Report IUGG General Assembly
Melbourne, Australia June 28 – July 7, 2011
146
Figure 5. Box-and-Whisker plots of levelling-derived land subsidence rates in Jakarta. In
this Figure: MN = sample minimum, Q1 = lower quartile (25th percentile), Q2 = median (50th percentile), Q3 = upper quartile (75th percentile), and MX = sample maximum.
Land subsidence as observed by GPS surveys Besides using levelling surveys, land subsidence in Jakarta has also been studied using GPS survey methods [Abidin et al, 2002; Leick, 2003; Abidin, 2007]. The GPS -based land-subsidence study has been conducted by the Geodesy Research Division of ITB since December 1997. Up to now, ten GPS surveys has been conducted, namely on: 24 - 26 December 1997, 29 - 30 June 1999, 31 May - 3 June 2000, 14 - 19 June 2001, 26 - 31 October 2001, 02 - 07 July 2002, 21 - 26 December 2002, 21 – 25 September 2005, 10-14 July 2006 and 3-7 September 2007. The configuration of this GPS monitoring network is shown in Figure 6. These surveys did not always occupy the same stations. The first survey started with 13 stations, and the network then expanded subsequently to 27 stations. At certain epochs, some stations could not be observed due to the destruction of monuments, or severe signal obstruction caused by growing trees and/or new construction. Station BAKO is the southernmost point in the network and is also the Indonesian zero order geodetic point. It is used as the reference point. In this case the relative ellipsoidal heights of all stations are determined relative to BAKO station. BAKO is an IGS station, operated by the National Coordinating Agency for Survey and Mapping of Indonesia.

Indonesia Country Report IUGG General Assembly
Melbourne, Australia June 28 – July 7, 2011
147
The GPS surveys exclusively used dual-frequency geodetictype GPS receivers. The length of surveying sessions was in general between 9 to 11 hours. The data were collected with a 30 second interval using an elevation mask of 150. The data were processed using the software Bernese 4.2 [Beutler et al., 2001]. Since we are mostly interested with the relative heights with respect to a stable point, the radial processing mode was used instead of network adjustment mode. The standard deviations of GPS -derived relative ellipsoidal heights from all surveys were in general better than 1 cm [Abidin et al., 2008].
Figure 6. GPS network for monitoring subsidence in
Jakarta.
Examples of GPS -derived land subsidence at several observing stations are shown in Figures 7, 8 and 9. On these Figures, the first measurement at each point established the baseline elevation for that site and, therefore, is shown as zero elevation change. The different color codes for the individual bars in these figures indicate that they were estimated from different GPS surveys. In about ten years, i.e. Dec. 1997 to Sept. 2007, the accumulated subsidence at several GPS stations can reach about 80-90 cm. In general the GPS observed subsidence rates during the period between December 1997 and September 2007 are about 1-15 cm/year. It is also found that land subsidence rates in the Jakarta basin have both a spatial and a temporal variation. This indicates that the causes of land subsidence in Jakarta also differ spatially. A more comprehensive review of GPS -derived land subsidence in Jakarta can be found in Abidin (2005) and Abidin et al. (2001, 2008).

Indonesia Country Report IUGG General Assembly
Melbourne, Australia June 28 – July 7, 2011
148
Figure 7. Accumulated GPS derived subsidence (cm) during the period of Dec. 1997 to
Sept. 2007. The baseline elevations are those from GPS Survey-1 (Dec.1999).
Figure 8. Accumulated GPS derived subsidence (cm) during the period of June 2000 to
Sept. 2007. The baseline elevations are those from GPS Survey-3 (June 2000).

Indonesia Country Report IUGG General Assembly
Melbourne, Australia June 28 – July 7, 2011
149
Figure 9. Accumulated GPS derived subsidence (cm) during the period of June 2001 to
Sept. 2007. The baseline elevations are those from GPS Survey-4 (June 2001). Land subsidence as observed by InSAR Since 2004, subsidence phenomena in Jakarta also have been studied using InSAR (Interferometric Synthetic Aperture Radar) techniques [Schreier, 1993; Massonnet, and Feigl, 1998]. The initial results are provided in Abidin et al. (2004). Recently, InSAR techniques were applied to study land subsidence in the Jakarta area using data from the ALOS/PALSAR satellite, which was launched in January 2006 as a successor of JERS-1/SAR. The SAR data observed during June 2006 and February 2007 were used. They were acquired in Fine Beam Single Polarization mode (HH polarization) with off-nadir angle of 41.5 degrees. InSAR processing has been performed using Level 1.1 products (SLC: Single Look Complex) distributed to the public by ERSDAC (Earth Remote Sensing Data Analysis Center) in Japan. The processing software for InSAR was developed by Deguchi (2005) and Deguchi et al. (2006).
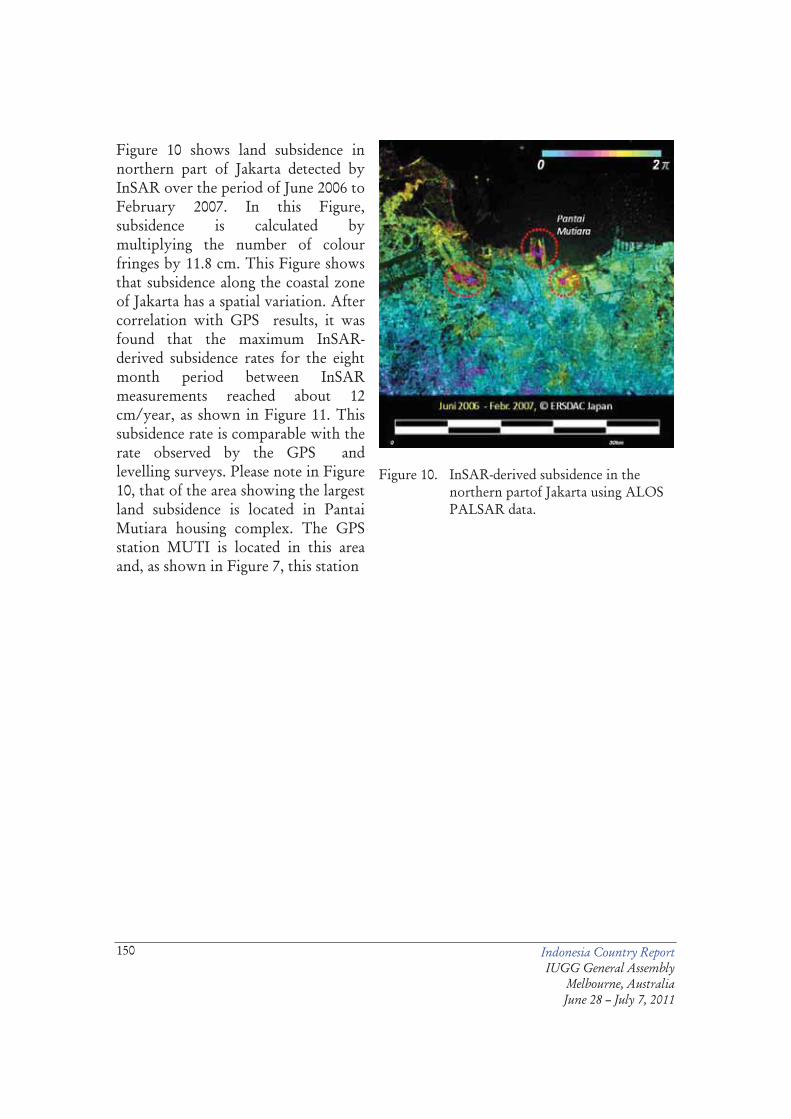
Indonesia Country Report IUGG General Assembly
Melbourne, Australia June 28 – July 7, 2011
150
Figure 10 shows land subsidence in northern part of Jakarta detected by InSAR over the period of June 2006 to February 2007. In this Figure, subsidence is calculated by multiplying the number of colour fringes by 11.8 cm. This Figure shows that subsidence along the coastal zone of Jakarta has a spatial variation. After correlation with GPS results, it was found that the maximum InSAR-derived subsidence rates for the eight month period between InSAR measurements reached about 12 cm/year, as shown in Figure 11. This subsidence rate is comparable with the rate observed by the GPS and levelling surveys. Please note in Figure 10, that of the area showing the largest land subsidence is located in Pantai Mutiara housing complex. The GPS station MUTI is located in this area and, as shown in Figure 7, this station
Figure 10. InSAR-derived subsidence in the
northern partof Jakarta using ALOS PALSAR data.

Indonesia Country Report IUGG General Assembly
Melbourne, Australia June 28 – July 7, 2011
151
Figure 11. InSAR-derived subsidence rate in the northern part of Jakarta using ALOS
PALSAR data. The red arrows are pointing toward the relatively large subsidence areas.
Land subsidence and groundwater extraction Land subsidence in Jakarta is thought to be caused by four factors, namely: groundwater extraction, loading of buildings and other constructions, natural consolidation of alluvial soil, and tectonic movement. Up to now, there has been no information about the relative contribution of each factor to localized subsidence or their spatial distribution. In the case of Jakarta, tectonic movement is thought to be the least dominant factor for progressive subsidence, while groundwater extraction is considered to be one of dominant factors. In the context of groundwater extraction, if the spatial distribution of land-surface subsidence in the period between 1982 and 1991 (Figure 4) is compared with changes in the elevation of the groundwater piezometric surface (Figure 12), it can be seen that a correlation exists. From this comparison it is suggested that the cones of depression within the piezometric surface inside the middle and lower aquifers more or less coincide with the cones of largest land subsidence measured by the levelling. In addition, each of the areas with the largest amount of land subsidence are situated in the areas consisting of sand bar and beach-river deposits; sediments that have high compressibility [Murdohardono and Sudarsono, 1998].

Indonesia Country Report IUGG General Assembly
Melbourne, Australia June 28 – July 7, 2011
152
Currently, these areas are industrial areas with relatively highdensity settlement, both of which consume a lot of groundwater. This intensive groundwater abstraction appears to have deepened the piezometric water level inside the middle and lower aquifers and in turn caused land-surface subsidence above it. The subsidence rate is closely related to the rate of piezometric water level (head) deepening in the middle and lower aquifers. According to Hadipurwo (1999), the maximum depth of the piezometric head inside the middle and lower aquifers of Jakarta tends to deepen with time, as shown in Figure 13. In the case of Jakarta, the increases in both population and industry, which require a lot of groundwater, likely explain the declining trend of piezometric heads. This ever increasing demand on the groundwater resource appears to accelerate the deepening of piezometric head and, in a way, explains the higher maximum rate of subsidence in the period of 1991-1997 compared to those in 1982 to 1991 as observed by the levelling surveys (see Figure 5). Moreover, Hadipurwo (1999) also observed that up to 1995 the depression cones of the piezometric heads tend to widen with time. This may explain the aforementioned increase in the number of subsidence cones in the period of 1991-1997 compared to those in 1982-1991 (see Figure 4).
Figure 12. Piezometric water level contours relative to MSL (in metres) inside Middle and
Lower Aquifers of Jakarta in 1992; adapted from [Murdohardono and Tirtomihardjo, 1993].
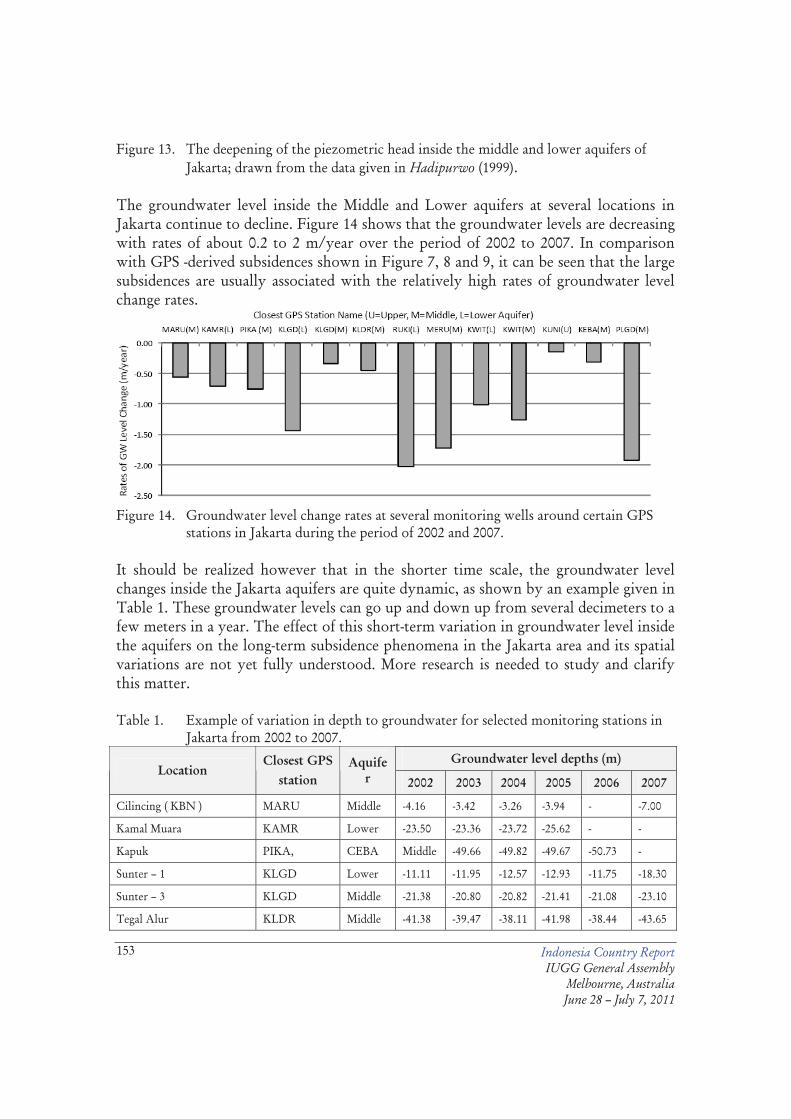
Indonesia Country Report IUGG General Assembly
Melbourne, Australia June 28 – July 7, 2011
153
Figure 13. The deepening of the piezometric head inside the middle and lower aquifers of Jakarta; drawn from the data given in Hadipurwo (1999).
The groundwater level inside the Middle and Lower aquifers at several locations in Jakarta continue to decline. Figure 14 shows that the groundwater levels are decreasing with rates of about 0.2 to 2 m/year over the period of 2002 to 2007. In comparison with GPS -derived subsidences shown in Figure 7, 8 and 9, it can be seen that the large subsidences are usually associated with the relatively high rates of groundwater level change rates.
Figure 14. Groundwater level change rates at several monitoring wells around certain GPS
stations in Jakarta during the period of 2002 and 2007. It should be realized however that in the shorter time scale, the groundwater level changes inside the Jakarta aquifers are quite dynamic, as shown by an example given in Table 1. These groundwater levels can go up and down up from several decimeters to a few meters in a year. The effect of this short-term variation in groundwater level inside the aquifers on the long-term subsidence phenomena in the Jakarta area and its spatial variations are not yet fully understood. More research is needed to study and clarify this matter. Table 1. Example of variation in depth to groundwater for selected monitoring stations in
Jakarta from 2002 to 2007. Groundwater level depths (m)
Location Closest GPS
station Aquife
r 2002 2003 2004 2005 2006 2007
Cilincing ( KBN ) MARU Middle -4.16 -3.42 -3.26 -3.94 - -7.00
Kamal Muara KAMR Lower -23.50 -23.36 -23.72 -25.62 - -
Kapuk PIKA, CEBA Middle -49.66 -49.82 -49.67 -50.73 -
Sunter – 1 KLGD Lower -11.11 -11.95 -12.57 -12.93 -11.75 -18.30
Sunter – 3 KLGD Middle -21.38 -20.80 -20.82 -21.41 -21.08 -23.10
Tegal Alur KLDR Middle -41.38 -39.47 -38.11 -41.98 -38.44 -43.65

Indonesia Country Report IUGG General Assembly
Melbourne, Australia June 28 – July 7, 2011
154
Tongkol – 5 RUKI Upper -4.71 -3.30 -3.29 -10.20 -4.19 -
Tongkol – 7 RUKI Lower -25.13 -23.67 -22.47 -17.56 -23.54 -35.26
Tongkol – 8 RUKI Lower -24.50 -23.67 -23.35 -27.67 -24.24 -28.85
Tongkol – 9 RUKI Middle -8.73 -5.73 -6.21 -5.14 -7.12 -6.11
Joglo MERU Middle -18.28 -20.15 -20.14 -24.48 -20.21 -26.92
Parkir Gd. Jaya KWIT Lower -20.20 -20.60 -20.88 -21.86 - -
Atrium, Senen KWIT Middle -12.26 -21.36 -21.66 -12.66 - -
Bapedalda Kngn KUNI Upper -5.57 -5.42 -5.77 -4.56 -4.94 -
Dharmawangsa KEBA 92-125 -31.95 -33.29 -33.75 -32.26 - -
PT. YamahaM-2 PLGD Middle -16.29 -12.51 -12.50 -13.54 - -25.91
Pulogadung PLGD Middle -28.13 -28.30 -29.46 -28.40 -28.47 -28.66
Land subsidence and sea level rise in northern coast of Jakarta The levelling, GPS and InSAR derived results show that the coastal areas of Jakarta are affected by subsidence phenomena with rates of about 1 to 15 cm/year. During high tides, tidal flooding is already affecting some of these coastal areas. The extent and magnitude of subsidence related flooding will worsen with the likely continuation of sea level rise along the coastal area of Jakarta, which is bordered by the Java sea. Figure 15 shows the tide gauge data from Tanjung Priok station located close to the Jakarta harbour. The sea level rise trend is apparent in this tide gauge record from 1984 to 2004, with the rate of about 9 mm/year. This trend is also shown by the satellite altimetry results (see Figure 16), with the slightly higher rate of about 15 mm/year. Based on these two data sets, it can be hypothesized that there is a sea level rise trend of about 1 cm/year in the coastal area of Jakarta. This sea level rise rate is much less than the subsidence rates of the coastal land area of Jakarta. The combined effects of land subsidence and sea level rise in the coastal areas of Jakarta should be considered in vulnerability assessments of the areas to the tidal flooding phenomena. Table 2 shows two possible scenarios of future tidal flooding conditions, the first being a conservative estimate (most probable case) and the second being a pessimistic (worst case) scenario.

Indonesia Country Report IUGG General Assembly
Melbourne, Australia June 28 – July 7, 2011
155
Figure 15. Trend of sea level rise in the coastal area of Jakarta, as derived from tide gauge
data; courtesy of Dr. Parluhutan Manurung, Bakosurtanal, Indonesia. The coefficient of determination (R2)
is about 0.85.
Figure 16. Trend of sea level rise in the offshore area of Jakarta, as derived from satellite
altimetry data (TOPEX/Poseidon and JAS-1), courtesy of Ir. Kosasih Prijatna MSc, KK Geodesy ITB, Indonesia. The coefficient of determination (R2) is about 0.86.
In the conservative scenario, a subsidence rate of about 2.5 cm/year and a minimum global sea level rise rate of about 2-3 mm/year [Gornitz, 1995; IPCC, 2007] are used. In the pessimistic scenario, a subsidence rate of about 10 cm/year and a local sea level rise rate of about 1 cm/year (as information from the tide gauge and satellite altimetry data) are used. In the conservative scenario, the possible rise in sea level relative to the coastal areas of Jakarta could be up to 0.3 m in 2020 and 1.1 m in 2050, compared to its reference condition in the beginning of 2008. In the pessimistic scenario, these values would be a 1.3 m rise in 2020 and a 4.6 m rise in 2050. Considering the relatively flat nature (i.e. 0-2 m above MSL) of most coastal areas of in Jakarta, this combined effect of land subsidence and sea level rise will certainly have disastrous consequences for

Indonesia Country Report IUGG General Assembly
Melbourne, Australia June 28 – July 7, 2011
156
habitation, industry, and fresh groundwater supplies from the coastal aquifers. Figure 17 shows the possible inundated areas estimated using the scenarios given in Table 2. Table 2. Possible combined effect of land subsidence and sea level rise in the coastal area of
Jakarta. CONSERVATIVE SCENARIO
Land subsidence rate 2.5 cm/year
Sea level (MSL) rise rate 0.2 cm/year
Separation rate between MSL and land surface 2.7 cm/year
Possible increase of sea level inundation in the coastal areas of Jakarta in 2020 (since beginning of 2008) 0.3 m
Possible increase of sea level inundation in the coastal areas of Jakarta in 2050 (since beginning of 2008) 1.1 m
PESIMISTIC SCENARIO
Land subsidence rate 10 cm/year
Sea level (MSL) rise rate 1 cm/year
Separation rate between MSL and land surface 11 cm/year
Possible increase of sea level inundation in the coastal areas of Jakarta in 2020 (since beginning of 2008) 1.3 m
Possible increase of sea level inundation in the coastal areas of Jakarta in 2050 (since beginning of 2008) 4.6 m

Indonesia Country Report IUGG General Assembly
Melbourne, Australia June 28 – July 7, 2011
157
Figure 17. Possible inundation areas (in black) in the coastal areas of Jakarta; with the
assumption of homogeneous subsidence rates along the coast. It should be noted however that the land subsidence rate is not uniform over the entire coastal area of Jakarta, as shown in the previous Figures 4,7,8,9,10 and 11. These Figures show some coastal areas are more susceptible to tidal flooding than the others. If the spatially different rates of subsidences as derived by InSAR (see Figure 11) are integrated with the scenarios of sea level rise rates given in Table 2, then the possible inundation maps as given in Figure 18 are obtained.
Figure 18. Possible inundation areas (in black) in the coastal areas of Jakarta; with the
assumption of spatially different subsidence rates along the coast. Closing Remarks The results obtained from levelling surveys, GPS surveys and the InSAR technique over the period between 1982 and 2007 show that land subsidence in Jakarta has spatial and temporal variations. In general, the observed subsidence rates are about 1 to 15 cm/year, and can be up to 20-25 cm/year at certain locations and for certain time periods. There is a strong indication that land subsidence in the Jakarta area is related to the high volume of groundwater extraction from the middle and lower aquifers, with secondary contributions by building/construction loading and natural consolidation of sedimentary layers. The large volume of groundwater extraction causes a rapid decrease in groundwater levels inside the aquifers reducing the hydrostatic pressures on aquifer material, and in turn, causing the land surface above it to subside. However, the relation between land subsidence and localized groundwater
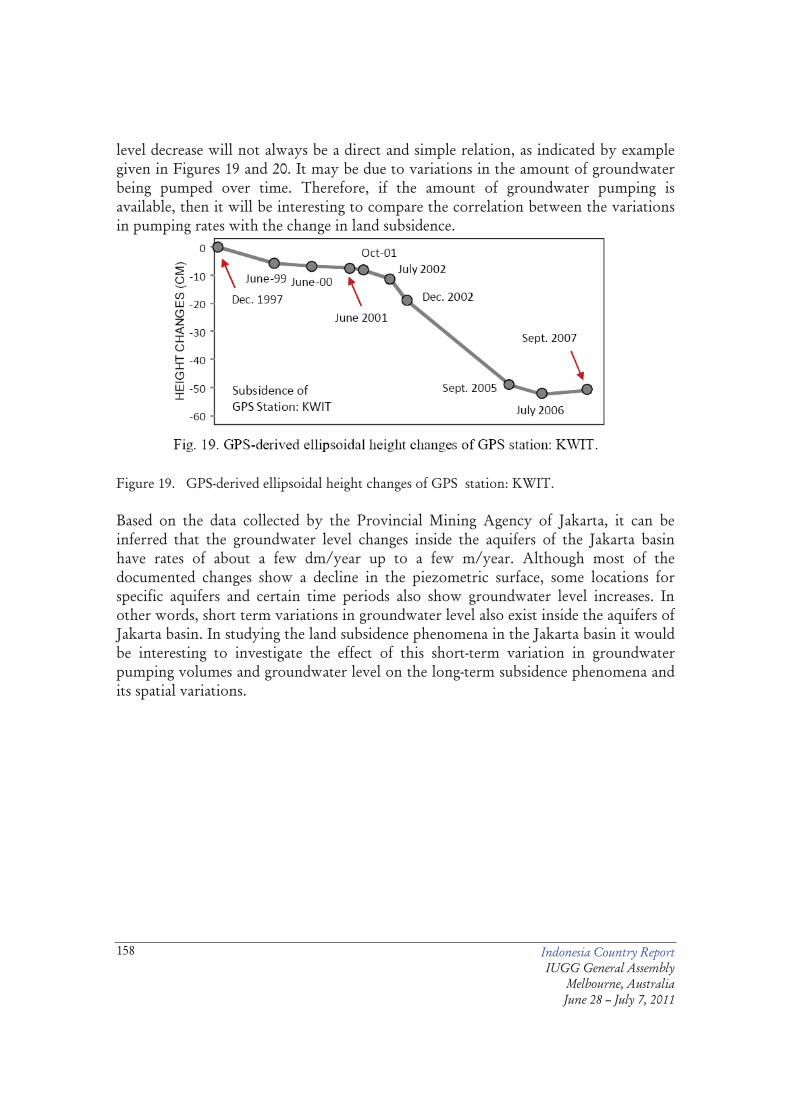
Indonesia Country Report IUGG General Assembly
Melbourne, Australia June 28 – July 7, 2011
158
level decrease will not always be a direct and simple relation, as indicated by example given in Figures 19 and 20. It may be due to variations in the amount of groundwater being pumped over time. Therefore, if the amount of groundwater pumping is available, then it will be interesting to compare the correlation between the variations in pumping rates with the change in land subsidence.
Figure 19. GPS-derived ellipsoidal height changes of GPS station: KWIT. Based on the data collected by the Provincial Mining Agency of Jakarta, it can be inferred that the groundwater level changes inside the aquifers of the Jakarta basin have rates of about a few dm/year up to a few m/year. Although most of the documented changes show a decline in the piezometric surface, some locations for specific aquifers and certain time periods also show groundwater level increases. In other words, short term variations in groundwater level also exist inside the aquifers of Jakarta basin. In studying the land subsidence phenomena in the Jakarta basin it would be interesting to investigate the effect of this short-term variation in groundwater pumping volumes and groundwater level on the long-term subsidence phenomena and its spatial variations.
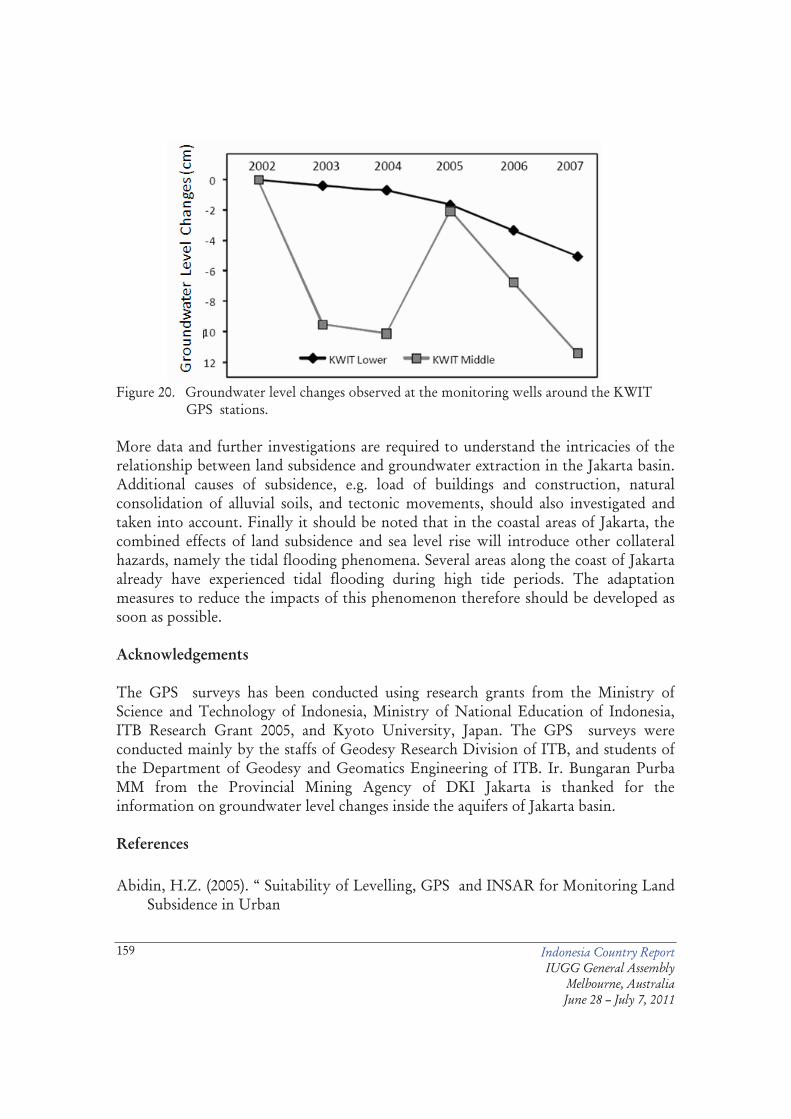
Indonesia Country Report IUGG General Assembly
Melbourne, Australia June 28 – July 7, 2011
159
Figure 20. Groundwater level changes observed at the monitoring wells around the KWIT
GPS stations. More data and further investigations are required to understand the intricacies of the relationship between land subsidence and groundwater extraction in the Jakarta basin. Additional causes of subsidence, e.g. load of buildings and construction, natural consolidation of alluvial soils, and tectonic movements, should also investigated and taken into account. Finally it should be noted that in the coastal areas of Jakarta, the combined effects of land subsidence and sea level rise will introduce other collateral hazards, namely the tidal flooding phenomena. Several areas along the coast of Jakarta already have experienced tidal flooding during high tide periods. The adaptation measures to reduce the impacts of this phenomenon therefore should be developed as soon as possible. Acknowledgements The GPS surveys has been conducted using research grants from the Ministry of Science and Technology of Indonesia, Ministry of National Education of Indonesia, ITB Research Grant 2005, and Kyoto University, Japan. The GPS surveys were conducted mainly by the staffs of Geodesy Research Division of ITB, and students of the Department of Geodesy and Geomatics Engineering of ITB. Ir. Bungaran Purba MM from the Provincial Mining Agency of DKI Jakarta is thanked for the information on groundwater level changes inside the aquifers of Jakarta basin. References Abidin, H.Z. (2005). “ Suitability of Levelling, GPS and INSAR for Monitoring Land
Subsidence in Urban
Indonesia Country Report IUGG General Assembly
Melbourne, Australia June 28 – July 7, 2011
160
Areas of Indonesia”. GIM International. The Global Magazine for Geomatics, GITC Publication, Volume 19, Issue 7, July, pp. 12-15.
Abidin, H.Z. (2007). GPS Positioning and Apllications. In Indonesian languange. P.T. Pradnya Paramita, Jakarta. Edisi ke 3. ISBN 978-979-408-377-2. 398 pp.
Abidin, H. Z., R. Djaja, D. Darmawan, S. Hadi, A. Akbar, H. Rajiyowiryono, Y. Sudibyo, I. Meilano, M. A.
Kusuma, J. Kahar, C. Subarya (2001). "Land Subsidence of Jakarta (Indonesia) and its Geodetic-Based Monitoring System." Natural Hazards. Journal of the International Society of the Preventation and Mitigation of Natural Hazards, Vol. 23, No. 2/3, March, pp. 365 - 387.
Abidin, H.Z., A. Jones, J. Kahar (2002). GPS Surveying. In Indonesian languange. P.T. Pradnya Paramita, Jakarta. ISBN 979-408-380-1. Edisi ke 2. 280 pp.
Abidin, H.Z., R. Djaja, H. Andreas, M. Gamal, Indonesia K. Hirose, Y. Maruyama (2004). “Capabilities and Constraints of Geodetic Techniques for Monitoring Land Subsidence in the Urban Areas of Indonesia”. Geomatics Research Australia. No.81, December, pp. 45-58.
Abidin, H.Z. , H. Andreas, R. Djaja, D.Darmawa and M. Gamal (2008). “Land subsidence characteristics of Jakarta between 1997 and 2005, as estimated using GPS surveys”, GPS Solutions, Springer Berlin /Heidelberg, Vol. 12, No. 1, pp. 23-32.
Beutler G, Bock H, Brockmann E, Dach R, Fridez P, Gurtner W, Hugentobler U, Ineichen D, Johnson J, Meindl M, Mervant L, Rothacher M, Schaer S, Springer T, Weber R (2001), “Bernese GPS software Version 4.2”, In: Hugentobler U, Schaer S, Fridez P (eds) Astronomical Institute, University of Berne, 515pp.
BPS Jakarta (2007). “Jakarta Dalam Angka 2007”, Katalog BPS: 1403.31, Badan Pusat Statistik Propinsi DKI Jakarta, 520 pp.
Deguchi, T. (2005). Automatic InSAR processing and introduction of its application studies. Proceedings the 26th Asian Conference on Remote Sensing, Hanoi, Vietnam.
Deguchi, T., M. Kato, H. Akcin and H.S. Kutoglu (2006). Automatic processing of Interferometric SAR and accuracy of surface deformation measurement. SPIE Europe Remote Sensing, Stockholm, Sweden.
Gornitz, V. (1995). "Sea-level rise: A review of recent past and near-future trends." Earth Surf. Proc. Landforms 20, pp. 7-20.
Hadipurwo,S. (1999). "Groundwater." In COASTPLAN JAKARTA BAY PROJECT, Coastal Environmental Geology of the Jakarta Reclamation Project and Adjacent Areas, CCOP COASTPLAN Case Study Report No. 2, Jakarta/Bangkok, pp. 39 - 49.
Harsolumakso, A.H. (2001). “Struktur Geologi dan Daerah Genangan”, Buletin Geologi, Vol. 33, No. 1, pp. 29-45.

Indonesia Country Report IUGG General Assembly
Melbourne, Australia June 28 – July 7, 2011
161
Hutasoit, L.M. (2001). “Kemungkinan Hubungan antara Kompaksi Alamiah Dengan Daerah Genangan Air di DKI Jakarta”, Buletin Geologi, Vol. 33, No. 1, pp. 21-28.
IPCC (2007). ”Climate Change 2007: The Physical Science Basis, Summary for Policymakers”, Report of Intergovernmental Panel On Climate Change, Can be accessed at: http://www.ipcc.ch/.
Leick, A. (2003). GPS Satellite Surveying. John Wiley & Sons, Third edition, New York, ISBN 0471059307, 435 pp.
Lubis, R.F., Y. Sakura and R. Delinom (2008). “Groundwater recharge and discharge processes in the Jakarta groundwater basin, Indonesia”, Hydrogeology Journal, Springer, DOI 10.1007/s10040-008-0278-1
Massonnet, D. and K.L. Feigl (1998). "Radar Interferometry and its Application to Changes in the Earth's Surface." Reviews of Geophysics, Vol. 36, No. 4, November, pp. 441-500.
Murdohardono,D. and H. Tirtomihardjo (1993). "Penurunan tananh di Jakarta dan rencana pemantauannya." Proceedings of the 22nd Annual Convention of the Indonesian Association of Geologists, Bandung, 6-9 December, pp. 346 - 354.
Murdohardono,D. and U. Sudarsono (1998). "Land subsidence monitoring system in Jakarta." Proceedings of Symposium on Japan-Indonesia IDNDR Project : Volcanology, Tectonics, Flood and Sediment Hazards, Bandung, 21-23 September, pp. 243 - 256.
Purnomo, H., D. Murdohardono, and H. Pindratno (1999). "Land Subsidence Study in Jakarta." Proceedings of Indonesian Association of Geologists, Volume IV : Development in Engineering, Environment, and Numerical Geology, Jakarta, 30 Nov.-1 Dec., pp. 53-72.
Rajiyowiryono, H. (1999). "Groundwater and Landsubsidence Monitoring along the North Coastal Plain of Java Island.". CCOP Newsletter, Vol. 24, No. 3, pp.19, July-September.
Rimbaman and P. Suparan (1999). "Geomorphology." In COASTPLAN JAKARTA BAY PROJECT, Coastal Environmental Geology of the Jakarta Reclamation Project and Adjacent Areas, CCOP COASTPLAN Case Study Report No. 2, Jakarta/Bangkok, pp. 21-25.
Rismianto,D. and W. Mak (1993). "Environmental aspects of groundwater extraction in DKI Jakarta: Changing views." Proceedings of the 22nd Annual Convention of the Indonesian Association of Geologists, Bandung, 6-9 December, pp. 327 - 345.
Sampurno (2001). “Geomorfologi dan Daerah Genangan DKI Jakarta”, Buletin Geologi, Vol. 33, No. 1, pp. 1-12.
Schreier, G. (Ed.) (1993). SAR Geocoding: Data and Systems. Wichmaann Verlag, Karlsruhe, ISBN 3-87907-247-7, 435 pp.

Indonesia Country Report IUGG General Assembly
Melbourne, Australia June 28 – July 7, 2011
162
Soetrisno,S., Satrio H., and Haryadi T. (1997). "To Anticipate Impacts of Reclamation of Jakarta Bay, A Groundwater Conservation's Perspective." Paper presented at Workshop on Coastal and Nearshore Geological/Oceanographical Assessment of Jakarta Bay : A Basis for Coastal Zone Management and Development, Jakarta, 25 - 28 June.
Yong,R.N., E. Turcott, and H. Maathuis (1995). "Groundwater extraction-induced land subsidence prediction: Bangkok and Jakarta case studies." Proceedings of the Fifth International Symposium on Land Subsidence, IAHS Publication no. 234, October, pp. 89-97.