international waters: identifying basins at risk · water policy 5 (2003) 29–60 international...
TRANSCRIPT

Water Policy 5 (2003) 29–60
International waters: identifying basins at risk
Aaron T. Wolf*, Shira B. Yoffe** and Mark Giordano****Corresponding author. Associate Professor of Geography. Department of Geosciences, 104 Wilkinson Hall,
Oregon State University, Corvallis, OR 97331-5506, USA (Tel: +1-541-737-2722,
fax: +1-541-737-1200. E-mail address: [email protected].)
**Diplomacy Fellow, American Association for the Advancement of Science, Washington, DC, USA.
***Senior Researcher, International Water Management Institute, Colombo, Sri Lanka.
Received 23 October 2001; accepted in revised form 31 January 2003
Abstract
Despite the growing literature on water and conflict in international river basins, little empirical work has beendone to bolster common conclusions which are so widely reported. In order to address this gap, we set out to assessall reported events of either conflict or cooperation between nations over water resources during the last 50 yearsand to use these events to inform the identification of basins at greatest risk of political stress in the near future(5–10 years). The study is divided into three components:
1. Compilation and assessment of relevant biophysical, socio-economic and geopolitical data in a globalGeographic Information System (GIS), and use of these factors to determine history-based indicators for futuretensions along international waterways.
2. Using these indicators, identification of basins at risk for the coming decade.3. Identification and assessment of the potential for mitigating factors and new technologies resulting in a future
different than that predicted by history-based indicators.
In general, we find that most of the parameters regularly identified as indicators of water conflict are actuallyonly weakly linked to disputes, but that institutional capacity within a basin, whether defined as water managementbodies or treaties, or generally positive international relations are as important, if not more so, than the physicalaspects of a system. It turns out then that very rapid changes, either on the institutional side or in the physicalsystem, which outpace the institutional capacity to absorb that change, are at the root of most water conflict, asreflected in two sets of indicators: 1) “internationalized” basins, i.e. basins which include the managementstructures of newly independent states, and 2) basins which include unilateral development projects and theabsence of cooperative regimes. By taking our parameters of rapid change as indicators—internationalized basins and major planned projects in hostile and/or institution-less basins—we are able to identify the basins with settings which suggest the potential for political stresses in the coming five to ten years. These basins include:the Ganges–Brahmaputra, Han, Incomati, Kunene, Kura-Araks, Lake Chad, La Plata, Lempa, Limpopo, Mekong,Ob (Ertis), Okavango, Orange, Salween, Senegal, Tumen and Zambezi.
We then identify “red flags,” or markers related to these indicators, which might be monitored in the future.
© IWA Publishing 2003

Finally, recognizing that history-based indicators may lose validity over time in a rapidly changing world, we ask, “what about the future, which may look nothing like the past,” and focus on four topics: new technologies for negotiation and management; globalization, privatization and the WTO; the geopolitics of desalination; and thechanging sources of water and the changing nature of conflict.
Keywords: Conflict; Cooperation; Environmental security; Fresh water resources; Indicators; International riverbasins
Background
Much of the thinking about the concept of “environmental security” has moved beyond a presumedcausal relationship between environmental stress and violent conflict to a broader notion of “humansecurity”—a more inclusive concept focusing on the intricate sets of relationships between environmentand society. Within this framework, water resources—their scarcity, distribution and quality—havebeen named as the factor most likely to lead to intense political pressures. Water ignores politicalboundaries, evades institutional classification and eludes legal generalizations. Worldwide, waterdemands are increasing, groundwater levels are dropping, water bodies are increasingly contaminatedand delivery and treatment infrastructure is aging. Although wars over water have not occurred, there isample evidence showing that the lack of clean freshwater has led to intense political instability and thatacute violence has occasionally been the result. As water quality degrades—or quantity diminishes—over time, the effect on the stability of a region can be unsettling.
Nonetheless, the record of acute conflict over international water resources is overwhelmed by therecord of cooperation. The only recorded incident of an outright war over water was 4500 years agobetween two Mesopotamian city-states, Lagash and Umma, in the region we now call southern Iraq.Conversely, between the years 805 and 1984, countries signed more than 3600 water-related treaties,many showing great creativity in dealing with this critical resource (Wolf, 1998). Overall, sharedinterests, human creativity and institutional capacity along a waterway seem to consistently amelioratewater’s conflict-inducing characteristics. Furthermore, once cooperative water regimes are establishedthrough treaties, they turn out to be impressively resilient over time, even when between otherwisehostile riparians, and even as conflict is waged over other issues. These patterns suggest that the morevaluable lesson of international water may be as a resource whose characteristics tend to inducecooperation, and incite violence only in the exception.
Despite the growing literature on water and conflict, there is currently little empirical work being doneto bolster any of the common conclusions being so widely reported. Westing (1986) suggests that“competition for limited . . . freshwater . . . leads to severe political tensions and even to war”; Gleick(1993) describes water resources as military and political goals, using the Jordan and Nile as examples;Remans (1995) uses case studies from the Middle East, South Asia and South America as “well-knownexamples” of water as a cause of armed conflict; Samson and Charrier (1997) write that “a number ofconflicts linked to freshwater are already apparent,” and suggest that “growing conflict looms ahead”;Butts (1997) suggests that “history is replete with examples of violent conflict over water,” and namesfour Middle Eastern water sources particularly at risk; and Homer-Dixon (1994), citing the Jordan andother water disputes, comes to the conclusion that “the renewable resource most likely to stimulateinterstate resource war is river water”. To be fair, there is also a smaller body of work which argues more
30 A.T. Wolf et al. / Water Policy 5 (2003) 29–60

strongly for the possibilities and historic evidence of cooperation between co-riparians. See, for example,Libiszewski (1995), Wolf (1998) and Salman & Boisson de Chazournes (1998) for historic assessmentsof cooperation, while Delli Priscoli (1998) suggests water as a “training ground for civilization.”
There are several problems with the approaches of much current literature and, as a consequence,questions about their conclusions as well:
� Loose definitions. Terms such as conflict, dispute, tensions and war are regularly usedinterchangeably. So too are several types of incidents all relating to water but which are otherwisevastly dissimilar, such as water as a tool, weapon or victim of warfare1.
� Exclusion of cooperative events. An entire branch of the conflict–cooperation spectrum is missingfrom almost all studies relating water to international relations, such that any tests of causality are, bydefinition, incomplete.
� Lack of consideration of spatial variability. Such popular measures as “water stress” are regularlydetermined by country (e.g. population per unit of water), whereas political interactions over watergenerally are precipitated at the basin (watershed) level. The variability of spatially diverseparameters such as population, climate, water availability and national groups are either ignored ortheir significance is generalized2.
� Case studies selected only from the “hottest” basins. Most studies of trends in international basinstend to focus on the world’s most volatile basins—the Jordan, Tigris–Euphrates, Indus and Nile, forexample—making general conclusions concerning international basins as a whole incomplete andquestionable.
Each of these issues informs the design of the current study, pointing to the need for work thatincludes: consistent and precise definitions of conflict and cooperation; events along the entire spectrumof conflict and cooperation, ranked by intensity; allowance for spatial variability; and inclusion of thewidest possible set of international basins—all of the world’s international watersheds.
Study objectives
Given our design criteria as outlined above, we set out to develop a study of international waterswhich would allow for the settings of historic events to be identified, and which would in turn informthe identification of basins at greatest risk of political stress in the near future (5–10 years).
The study is divided into three components:
1. Compilation and assessment of relevant biophysical, socio-economic and geopolitical data in a globalGeographic Information System (GIS), and use of these factors to determine history-based indicatorsfor future tensions along international waterways.
2. Using these indicators, identification of basins at risk for the coming decade.3. Identification and assessment of the potential for mitigating factors and new technologies which may
result in a future different from that predicted by history-based indicators.
1 For thorough documentation of these other types of violence associated with water, see Peter Gleick’s excellentchronology at www.worldwater.org/conflict.htm.
2 A useful exception, at least for physical parameters, is Revenga et al. (1998), which describes 15 biophysical variables for145 of the world’s major watersheds.
A.T. Wolf et al. / Water Policy 5 (2003) 29–60 31
Methodology3
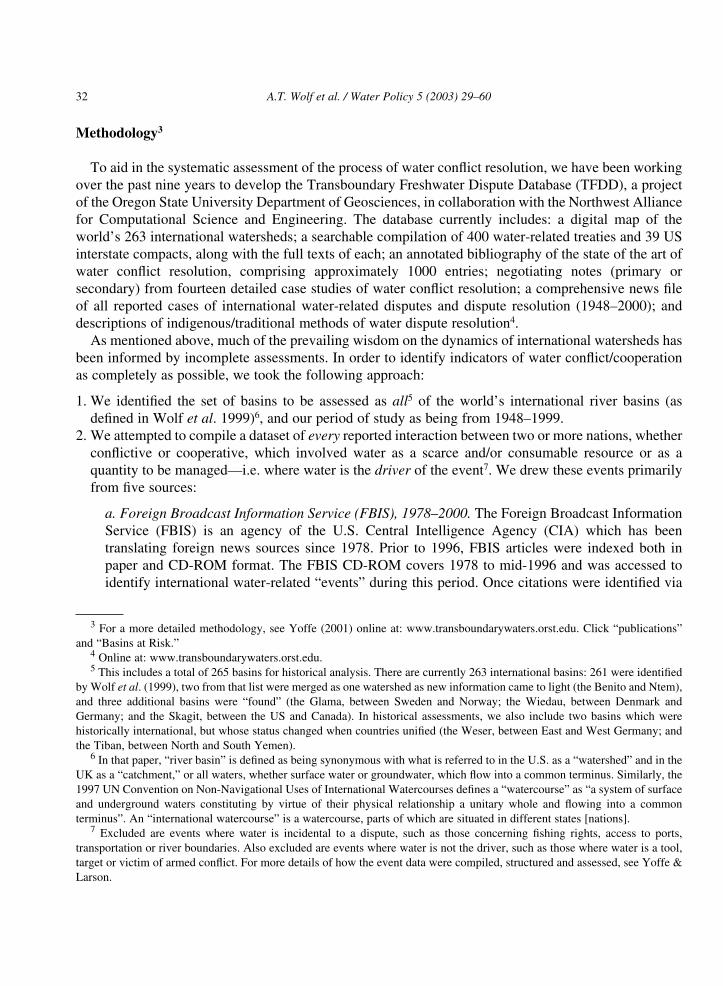
To aid in the systematic assessment of the process of water conflict resolution, we have been workingover the past nine years to develop the Transboundary Freshwater Dispute Database (TFDD), a projectof the Oregon State University Department of Geosciences, in collaboration with the Northwest Alliancefor Computational Science and Engineering. The database currently includes: a digital map of theworld’s 263 international watersheds; a searchable compilation of 400 water-related treaties and 39 USinterstate compacts, along with the full texts of each; an annotated bibliography of the state of the art ofwater conflict resolution, comprising approximately 1000 entries; negotiating notes (primary orsecondary) from fourteen detailed case studies of water conflict resolution; a comprehensive news fileof all reported cases of international water-related disputes and dispute resolution (1948–2000); anddescriptions of indigenous/traditional methods of water dispute resolution4.
As mentioned above, much of the prevailing wisdom on the dynamics of international watersheds hasbeen informed by incomplete assessments. In order to identify indicators of water conflict/cooperationas completely as possible, we took the following approach:
1. We identified the set of basins to be assessed as all5 of the world’s international river basins (asdefined in Wolf et al. 1999)6, and our period of study as being from 1948–1999.
2. We attempted to compile a dataset of every reported interaction between two or more nations, whetherconflictive or cooperative, which involved water as a scarce and/or consumable resource or as aquantity to be managed—i.e. where water is the driver of the event7. We drew these events primarilyfrom five sources:
a. Foreign Broadcast Information Service (FBIS), 1978–2000. The Foreign Broadcast InformationService (FBIS) is an agency of the U.S. Central Intelligence Agency (CIA) which has beentranslating foreign news sources since 1978. Prior to 1996, FBIS articles were indexed both inpaper and CD-ROM format. The FBIS CD-ROM covers 1978 to mid-1996 and was accessed toidentify international water-related “events” during this period. Once citations were identified via
3 For a more detailed methodology, see Yoffe (2001) online at: www.transboundarywaters.orst.edu. Click “publications”and “Basins at Risk.”
4 Online at: www.transboundarywaters.orst.edu.5 This includes a total of 265 basins for historical analysis. There are currently 263 international basins: 261 were identified
by Wolf et al. (1999), two from that list were merged as one watershed as new information came to light (the Benito and Ntem),and three additional basins were “found” (the Glama, between Sweden and Norway; the Wiedau, between Denmark andGermany; and the Skagit, between the US and Canada). In historical assessments, we also include two basins which werehistorically international, but whose status changed when countries unified (the Weser, between East and West Germany; andthe Tiban, between North and South Yemen).
6 In that paper, “river basin” is defined as being synonymous with what is referred to in the U.S. as a “watershed” and in theUK as a “catchment,” or all waters, whether surface water or groundwater, which flow into a common terminus. Similarly, the1997 UN Convention on Non-Navigational Uses of International Watercourses defines a “watercourse” as “a system of surfaceand underground waters constituting by virtue of their physical relationship a unitary whole and flowing into a commonterminus”. An “international watercourse” is a watercourse, parts of which are situated in different states [nations].
7 Excluded are events where water is incidental to a dispute, such as those concerning fishing rights, access to ports,transportation or river boundaries. Also excluded are events where water is not the driver, such as those where water is a tool,target or victim of armed conflict. For more details of how the event data were compiled, structured and assessed, see Yoffe &Larson.
32 A.T. Wolf et al. / Water Policy 5 (2003) 29–60

keyword searches, the full-text microfiche articles were collected from the Oregon State Universityand University of Oregon libraries for the relevant news events. The World News Connection(WNC) is the on-line, searchable version of FBIS which covers material from 1996 to the presentday. Full-text articles were retrieved via an on-line subscription. Since FBIS systematically coversonly non-US news sources, the New York Times was searched, through Lexis-Nexis, for water-related event data for North America.b. Conflict and Peace Data Bank (COPDAB), 1948–1978. This dataset, directed by ProfessorEdward E. Azar, codes inter- and intra-national events for approximately 135 countries. Eventrecords include variables for date of event, initiating actor, event target, information source, issueareas and textual information about the activity, and a number evaluating the event on a scale ofconflict and cooperation. The dataset does not include any water-specific coding, but the textualinformation has enough detail to provide a guide to possible water related events. Basins at Risk(BAR) uses COPDAB data to identify water events from 1948 to 1978.c. Global Event Data System (GEDS) Project, 1979–1994. GEDS tracks day-to-day interactionsamong nations and other international actors using online news reports. Directed by John Daviesat the University of Maryland, GEDS builds on the Conflict and Peace Data Bank (COPDAB) ofEdward Azar. Data archives contain over 300,000 event records from 1979 to 1994.d. Transboundary Freshwater Dispute Database. OSU’s TFDD project includes a collection ofwater-related treaties, 157 of which are applicable to our criteria and study period.e. Literature review. A rich literature exists on various aspects of international waters, much ofwhich has clear descriptions of international events. By tapping the available literature (describedin Beach et al., 2000), we were able to confirm many of the events culled from the above sources,as well as to supplement many which have gone unreported in the press.
Over the course of one year, we were able to compile a seamless, systematic database for waterconflict/cooperation of 1831 events—507 conflictive, 1228 cooperative and 96 neutral or non-significant. Each event includes a brief summary and source of information, and was coded by date,country pair (dyad), basin, issue area8 and intensity of conflict/cooperation. For event intensity, wemodified COPDAB’s scale, adding water-specific actions and definitions, as described in Yoffe &Larson, to define events from –7, the most conflictive (war), through 0 (neutral events), and up to +7,the most cooperative (voluntary merging of countries) (see Table 1 and Fig. 1). In addition, we compileda tributary database, which links a tributary’s name to its major international basin, and a“friendship–hostility” scale—a ratio of all cooperative to conflictive events between nations from theCOPDAB and GEDS data combined, to gage general (non-water) relations between countries (see Yoffe& Giordano (forthcoming) for more information on this last parameter).
3. We developed a Geographic Information System (GIS), including approximately 100 layers of globaland/or regional spatial data falling into one of three general categories: biophysical (e.g. topography,surface runoff, climate), socio-economic (e.g. GDP, dependence on hydropower) and geopolitical
8 Event issue areas were defined as: quantity, infrastructure, joint management, hydropower, quality, flood control, technicalcooperation, irrigation, border issues, general economic development and navigation. As mentioned earlier, in order to beincluded, water had to be treated as a scarce and/or consumable resource or as a quantity to be managed. For example,navigation events were included only if the issue involved a quantity of water required to allow for ship passage, not if it onlyinvolved rules of conduct or tonnage.
A.T. Wolf et al. / Water Policy 5 (2003) 29–60 33

(e.g. style of government, present and historic boundaries). We back-dated relevant parameters suchthat the GIS is both uniformly formatted and historically accurate (e.g. 1964 boundaries coincide with1964 GDPs and government types). We used each international watershed, sub-divided by nationalboundaries, as the unit for analysis (see Table 2 and Fig. 2).
34 A.T. Wolf et al. / Water Policy 5 (2003) 29–60
Fig. 1. Events database: example.
Table 1. BAR Event intensity scale. (Modified from Azar’s COPDAB International Conflict and Cooperation Scale.)
BAR scale COPDAB scale BAR event description
–7 15 Formal declaration of war; extensive war acts causing deaths, dislocation or highstrategic costs
–6 14 Extensive military acts–5 13 Small scale military acts–4 12 Political–military hostile actions–3 11 Diplomatic–economic hostile actions–2 10 Strong verbal expressions displaying hostility in interaction–1 9 Mild verbal expressions displaying discord in interaction0 8 Neutral or non-significant acts for the inter-nation situation1 7 Minor official exchanges, talks or policy expressons—mild verbal support2 6 Official verbal support of goals, values or regime3 5 Cultural or scientific agreement or support (non-strategic)4 4 Non-military economic, technological or industrial agreement5 3 Military economic or strategic support6 2 International freshwater treaty; major strategic alliance (regional or international)7 1 Voluntary unification into one nation

Table 2. GIS data layers.
Category GIS layer Coverage Data sourceextent
GeoPolitical International Boundaries Global ESRIGeoPolitical Intra-national Administrative Boundaries Global ESRIBiophysical International Basins Global TFDDBiophysical Area of International Basins for 1999, total & by country Global TFDDBiophysical International Basins from 1950 to current Global TFDDGeoPolitical Intersection of Basins with Countries Global TFDDGeoPolitical International River Treaties Global TFDDGeoPolitical Basin Tributary Names Global TFDDBiophysical Riparian Position of Basin Countries Global TFDDGeoPolitical Water Conflict-Coop. Events 1948–1999 Global COPDAB, GEDS,
FBIS/WNC, Lexis-Nexus,TFDD
GeoPolitical Additional Event Data (historical records, other sources) Global TFDDGeoPolitical Degree of democratization, by year from 1800 Global Polity Data ArchivesGeoPolitical Date of change in government regime, by year Global Polity Data ArchivesSocioEconomic Gridded Population of the World Global Dobson, et al. LandScan
2000SocioEconomic Population by basin by year Global Dobson, et al. LandScan
2000, TFDDSocioEconomic Population by country by year Global Dobson, et al. LandScan
2000, TFDDSocioEconomic List and Location of Ethnic Minority Groups Global GEDSSocioEconomic Human Poverty Index Global UNDPSocioEconomic Human Development Index Global UNDPSocioEconomic Future Major Dams or Water Development Projects Global TFDDSocioEconomic Major Dams or Development Projects by basin and year Global ICOLD, TFDDSocioEconomic Roads and Railways Global ESRISocioEconomic Major Cities Global ESRISocioEconomic Utilities, Electricity Grids Global ESRISocioEconomic Hydroelectric Capacity and Production by Country, 1996 Global WRISocioEconomic Hydroelectric Production as Fraction of Total Energy
Produced, by Country Global WRISocioEconomic Commercial Electricity Production—Total, by Country and
Year Global WRISocioEconomic Commercial Electricity Production—Hydroelectric, by
Country and Year Global WRISocioEconomic Electricity Imports and Exports Global WRISocioEconomic Desalination Capacity by Country, January 1, 1996 Global WRISocioEconomic Water Stress Index by country and by basin Global Fekete, et al., TFDDSocioEconomic Social Water Stress Index—1975–1999, by basin and Global Fekete, et al., Ohlsson,
by country TFDDSocioEconomic Gross National Product Global WRISocioEconomic Gross National Product Per Capita Global WRISocioEconomic Mean Rate of Population Growth by Country Global WRISocioEconomic Labor Force—Percent in Agriculture Global WRISocioEconomic Total Urban Population Global WRISocioEconomic Urban Population Percent Global WRISocioEconomic Urban Population Growth Rates Global WRI
A.T. Wolf et al. / Water Policy 5 (2003) 29–60 35

Table 2. (continued)
Category GIS layer Coverage Data sourceextent
SocioEconomic Total Rural Population Global WRISocioEconomic Rural Population Growth Rates Global WRISocioEconomic Rural Population With Access to Safe Water Global WRISocioEconomic Urban Population With Access to Safe Water Global WRISocioEconomic Population With Access to Safe Water: Urban and Rural Global WRISocioEconomic Urban Population With Access to Adequate Sanitation Global WRISocioEconomic Rural Population with Access to Adequate Sanitation Global WRISocioEconomic Population With Access to Adequate Sanitation: Urban
and Rural Global WRISocioEconomic Total Forest Deforestation Global WRISocioEconomic Total Freshwater Catch by Country Global WRISocioEconomic Aquaculture Production—Freshwater Fish Global WRISocioEconomic Technical Disasters by Country—Oil spill/Chemical Fires. . . Global USAID-CREDBiophysical Natural Disasters by Country—Flood/Drought. . . Global USAID-CREDBiophysical Renewable Freshwater Supply by Basin and by Country Global Gleick, Peter. The
World’s Water, 1998,Fekete, et al., TFDD
SocioEconomic Freshwater Withdrawal by Country and Sector Global Gleick, Peter. TheWorld’s Water, 1998
Biophysical USGS Land Use/Land Cover Global USGSBiophysical Global Assessment of Human Induced Soil Degradation Global UNEP/GRID—EROS
Data CenterBiophysical Global Vegetation, Intensity of Cultivation Global UNEP/GRID—EROS
Data CenterBiophysical Global Map of Irrigated Areas Global Petra DöllSocioEconomic Irrigated Area by Basin and by Country Global TFDDBiophysical Water pollution, runoff, sediment load (selected rivers) 80 Rivers UNEP/GEMSGeoPolitical State of Water Management by Country Limited Gleick, Peter. The
World’s Water, 1998SocioEconomic Sources and Uses of Surface/Groundwater Resources Global Gleick, Peter. The
World’s Water, 1998Biophysical Wetlands of International Importance—Number/Area Global WRISocioEconomic Distribution of Gross Domestic Product—Agric/Ind/
Services/Manufact Global WRISocioEconomic Total Fertilizer Consumption Global WRIBiophysical Arable Land Global WRIBiophysical Land in Permanent Crops Global WRISocioEconomic Fertilizer Production Global WRISocioEconomic Fertilizer Imports Global WRISocioEconomic Fertilizer Exports Global WRISocioEconomic Annual fertilizer use Global WRISocioEconomic Grain Fed to Livestock as % of Total Grain Consumption Global WRISocioEconomic Labor Force—Percent in Industry, Percent in Services Global WRISocioEconomic Total Economically Active Population Global WRISocioEconomic Number of Cholera Cases and Deaths from Cholera Limited Gleick, Peter. The
World’s Water, 1998Biophysical Land Area by Country Global WRIBiophysical Arable and Permanent Cropland Global WRI
36 A.T. Wolf et al. / Water Policy 5 (2003) 29–60

Table 2. (continued)
Category GIS layer Coverage Data sourceextent
SocioEconomic Population Density by Country Global WRIBiophysical Permanent Pasture Global WRIBiophysical Forest and Woodland Global WRIBiophysical All Other Land Global WRIBiophysical Domesticated Land as a Percent of Land Area Global WRIBiophysical Natural Forest Extent and Change Global WRIBiophysical Extent of Plantations and Change Global WRIBiophysical Extent of Total Forest Global WRIBiophysical Hydrologic Network (Rivers) Global USGS-EROS-HYDRO1k,
ESRIBiophysical River length Global ESRI, TFDDBiophysical Climatic Data (Temp, Precip) Global IPCCBiophysical Climatic Zones of basins Global UNFAO, TFDDBiophysical Digital Elevation Models Global USGS-EROS-GTOPO30Biophysical Slope in basin by percent area Global USGS-EROS-
GTOPO30/LandScan,TFDD
Biophysical Global Soil Texture Global UNEP/GRID—EROSData Center
Biophysical River Discharge Global Vörösmarty, et al.Biophysical Flooding since 1995 Global Dartmouth Flood
ObservatoryBiophysical Annual river flows Global Fekete, et al., TFDDBiophysical Freshwater Fish Species Information Global WRIGeoPolitical Protected Areas Global WRI
Table 2. Sources and abbreviationsCOPDAB: Azar, Edward E. Conflict and Peace Data Bank (COPDAB), 1948–1978. [Computer file]. 3rd release. College
Park, MD: University of Maryland, Center for International Development and Conflict Management [producer], 1993. AnnArbor, MI: Inter-university Consortium for Political and Social Research [distributor], 1993.
Dartmouth Flood Observatory: Dartmouth Flood Observatory—NASA supported.http://www.dartmouth.edu/artsci/geog/floods/.
Dobson, et al. LandScan 2000: Dobson, J.E., Bright, E.A., Coleman, P.R., Durfee, R.C. & Worley, B.A. (2000). LandScan: aglobal population database for estimating populations and risk. Photogrammetric Engineering & Remote Sensing, 66 (7),849–857.
Döll, P. & Siebert, S. (1999). A digital global map of irrigated areas. Report A9901, Center for Environmental SystemsResearch, University of Kassel.
ESRI: Environmental Systems Research Institute. http://www.esri.com/.FBIS: Foreign Broadcast Information Service, US Central Intelligence Agency.Fekete, et al.: Fekete, B., Vorosmarty, C.J., Grabs, W. (2000) Global, composite runoff fields based on observed river
discharge and simulated water balances. February 4, 2000.GEDS: Davies, J.L. (1998) The Global Event-Data System: Coders’ Manual, Center for International Development and
Conflict Management and Department of Government and Politics, University of Maryland, College Park, MD, August,1998 Revision, http://geds.umd.edu/geds/.
Gleick, Peter. The World’s Water, 1998: Gleick, P.H. (1998) The World’s Water: The Biennial Report on FreshwaterResources. Island Press, Washington, D.C..
ICOLD: International Commission on Large Dams, World Register of Dams, 1998.
A.T. Wolf et al. / Water Policy 5 (2003) 29–60 37

IPCC: Intergovernmental Panel on Climate Change, Leemans, R. & Cramer, W.P.(1991). The IIASA Database for MeanMonthly Values of Temperature, Precipitation and Cloudiness of a Global Terrestrial Grid. IIASA, Laxenburg, Austria,RR-91–18. http://ipcc-ddc.cru.uea.ac.uk/.
Ohlsson: Ohlsson, L. (1999). Environment, Scarcity, And Conflict: A Study of Malthusian Concerns. Department of Peaceand Development Research, Goteborg University, Goteborg, Switzerland.
Polity Data Archives: McLaughlin, S., Gates, S., Hegre, H., Gissinger, R. & Gleditsch, N.P. (1998). Polity 3D: the timing ofpolity changes. Journal of Conflict Resolution, April. http://www.colorado.edu/IBS/GAD/spacetime/data/Polity.html.
UNDP: United Nations Development Programme, Human Development Report,http://www.undp.org/hdro/indicators.html#developing.
UNEP/GEMS: United Nations Environment Programme/Global Environment Monitoring System; Fraser, A. S., Meybeck,M. & Ongley, E. D. (1996). Annotated Digital Atlas of Global Water Quality (computerized). UNEP GEMS/WaterCollaborating Centre, Canada. Global Environment Monitoring System (GEMS/Water);http://www.cciw.ca/gems/intro.html.
UNEP/GRID—EROS: http://grid2.cr.usgs.gov/; http://edcwww.cr.usgs.gov/UNFAO: United Nations Food and Agriculture Programme; FAO’s Environment and Natural Resources Service (SDRN)
global climate maps series.—FAO-SDRN Agrometeorology Group, 1997.http://www.fao.org/sd/eidirect/CLIMATE/EIsp0001.htm.
USAID-CRED: US Agency for International Development, Office of US Foreign Disaster Assistance (OFDA) & the WHOCollaborative Center for Research on the Epidemiology of Disasters (CRED); EM-DAT: The OFDA/CRED InternationalDisaster Database—www.md.ucl.ac.be/cred—Université Catholique de Louvain, Brussels, Belgium.
USGS-EROS-GTOPO30: US Geological Service—EROS Data Center. http://edcdaac.usgs.gov/gtopo30/gtopo30.htmlUSGS-EROS-HYDRO1k: US Geological Service—EROS Data Center, http://edcdaac.usgs.gov/gtopo30/hydro/.Vörösmarty, et al.: Vörösmarty, C.J., Fekete, B. & Tucker, B.A. (1998). River Discharge Database, Version 1.1 (RivDIS
v1.0 supplement). Available through the Institute for the Study of Earth, Oceans, and Space, University of NewHampshire, Durham NH (USA) at http://pyramid.unh.edu/csrc/hydro/. Vörösmarty, C.J., Fekete, B. & Tucker, B.A.(1996). River Discharge Database, Version 1.0 (RivDIS v1.0), Volumes 0 through 6. A contribution to IHP-V Theme 1.Technical Documents in Hydrology Series. UNESCO, Paris.
WNC: World News Connection, US Central Intelligence Agency.WRI: World Resources 1998–1999 Database, World Resources Institute, 1998.
With this GIS in place, we were able to assess the historical setting within which each event ofconflict/cooperation took place. By hypothesizing the relevance of sets of parameters, and by testingeach set running single and multivariate statistical analyses of the events against the parameters whichdefine their historical settings, factors that seemed to be indicators of conflict/cooperation were able tobe culled from the database as a whole9.
Findings
Summary statistics
Our overall distribution of events over the 50-year period of assessment is shown in Fig. 3. In general,we delineated a total of 1831 events, and found the following:
a. No events on the extremes. In modern times, there has been no war (–7 on the BAR Scale) foughtover water resources. In fact, one has to go back 4500 years to find the single historical example of a
9 Details are provided in Shira Yoffe’s online methodology, cf. footnote 4, and in Fiske and Yoffe (in review).
38 A.T. Wolf et al. / Water Policy 5 (2003) 29–60

true “water war,” to a dispute between the city-states of Lagash and Umma on the Tigris–Euphrates(Wolf, 1998).
Likewise, there is no example of nations voluntarily unifying because of water resources (+7 on theBAR Scale).b. Most interactions are cooperative. Cooperative events are more than twice as common asconflictive events—there are 1228 cooperative events (67.1%) and 507 conflictive events (27.7%).Ninety-six events (5.2%) were delineated as neutral or non-significant.c. Most interactions are mild. Seven-hundred and eighty-four events, or 42.8% of all events, fallbetween mild verbal support (+1) and mild verbal hostility (–1). If we add the next level on eitherside—official verbal support (+2) and official verbal hostility (–2)—we account for 1138 events, or 62% of the total. Another way to look at this is that almost two-thirds of all events are only verbal and, of these verbal events, more than two-thirds are reported as having no official sanctionat all.
Even the record of acute conflict, that in which violence ensues (–5 and –6 on the BAR Scale), isneither widespread nor recent. Of the 37 cases of acute conflict, 30 are between Israel and one or otherof its neighbors, violence which ended in 1970. Non-Middle East cases account for only five acuteevents.
A.T. Wolf et al. / Water Policy 5 (2003) 29–60 39
Fig. 2. Basins at risk: geographic information system.

d. Water acts as an irritant. Despite the lack of violence, water resources can make good relationsbad and bad relations worse. Threats and disputes have raged across boundaries with relations asdiverse as those between Indians and Pakistanis and between Americans and Canadians. Water wasthe last and most contentious issue resolved in negotiations over a 1994 peace treaty between Israeland Jordan, and was relegated to “final status” negotiations—along with many other of the mostdifficult issues, such as Jerusalem and refugees—between Israel and the Palestinians.e. Water acts as unifier. The historical record shows that water disputes do get resolved, even amongbitter enemies, and even as conflicts rage over other issues. Some of the most vociferous enemiesaround the world have negotiated water agreements or are in the process of doing so. The MekongCommittee has functioned since 1957, exchanging data throughout the Vietnam War. Secret “picnictable” talks have been held between Israel and Jordan since the unsuccessful Johnston negotiations of1953–55, even as these riparians, until only recently, were still in a legal state of war. The Indus RiverCommission survived through two wars between India and Pakistan. And all ten Nile riparians arecurrently involved in negotiations over cooperative development of the basin.f. Overall, the major water-related issues are quantity and infrastructure. Figure 4 shows the numberof events by issue area and the distribution of those events. Sixty-four percent of events are primarilyabout water quantity and infrastructure (which are often inextricably related). Quality-related eventsonly account for 6% of the total (see Fig. 4).g. Nations cooperate over a wide variety of issues. Figure 5 shows the distribution of cooperativeevents and indicates a broad spectrum of issue types. If we look specifically at treaties, the most
40 A.T. Wolf et al. / Water Policy 5 (2003) 29–60
Fig. 3. Number of events by BAR Conflict/Cooperation Scale.

cooperative type of event, the breadth of cooperative issues is even wider, including quantity, quality,economic development, hydropower and joint management (see Fig. 5).h. Nations conflict over quantity and infrastructure. Finally, Fig. 5 shows the distribution of con-flictive events by issue area—87% relate to water quantity and infrastructure. Again, if we lookspecifically at extensive military acts, the most extreme cases of conflict, almost 100% of events fallwithin these two categories.
Indicators
Little exists in the environmental security literature regarding empirical identification of indicators offuture water conflict. The most widely cited measure for water resources management is Falkenmark’s(1989) Water Stress Index, which divides the volume of available water resources for each country byits population. She then defines “stress” levels as follows:
— Above 10,000 m3/person: Limited management problems— 10,000–1600 m3/person General management problems— 1600–1000 m3/person Water stress— 1000–500 m3/person Chronic scarcity— Less than 500 m3/person Beyond the management “water barrier”
Though commonly used, Falkenmark’s index has been critiqued on a number of grounds, mostly thatit accounts neither for spatial variability in water resources within countries, nor for the technological oreconomic adaptability of nations at different levels of development. To account for the latter critique,but not the former, Ohlsson (1999) developed a “Social Water Stress Index,” which incorporates“adaptive capacity” into Falkenmark’s measure, essentially weighting the index by a factor based onUNDP’s Human Development Index. While Ohlsson’s is a useful contribution, he also misses the
A.T. Wolf et al. / Water Policy 5 (2003) 29–60 41
Water Quantity45%
Hydropower10%
Joint Management12%
Infrastructure19%
Water Quality6%
Other4%
Flood Control/Relief2%
Technical Coop.2%
Fig. 4. Distribution of total events by issue area.

spatial component. Similarly, neither Falkenmark nor Ohlsson suggest much about the geopoliticalresults of scarcity, focusing instead on implications for water management.
The only author to explicitly identify indices of vulnerability which might suggest “regions at risk”for international water conflicts is Peter Gleick who, in 1993, suggested four: 1) ratio of water demandto supply; 2) water availability per person (Falkenmark’s water stress index); 3) fraction of water supplyoriginating outside a nation’s borders; and 4) dependence on hydroelectricity as a fraction of totalelectrical supply. Gleick’s indices, like Falkenmark’s and Ohlsson’s, focus on the nation as the unit ofanalysis and on physical components of water and energy. These indicators were neither empiricallyderived nor tested.
In our approach, we consider two very distinct aspects as to why nations may choose to dispute orcooperate. First, along with the authors cited above, we look at the water resources themselves andvarious aspects of stress—supply versus demand, droughts, changes in the physical system. Since thesechanges take place within very distinct physical units, we use basins as our fundamental unit of analysisrather than nations. There is another side to the equation, though, related to the capacity of a nation toabsorb the physical aspects of stress, either within a nation, between pairs of nations, or among all thenations of a watershed. This institutional capacity to absorb stress, we feel, is broader than simply acountry’s economic strength, although that certainly plays a major role. Other issues, such as theexistence or absence of joint water management bodies or treaties, general friendship/hostility over non-
42 A.T. Wolf et al. / Water Policy 5 (2003) 29–60
Water Quantity61%
Infrastructure25%
Water Quality5%
Other6%
JointManagement
3%
Distribution of Cooperative Events By Issue Area Country-Pair Events by Issue TypeExtreme (BAR Scale 6) Cooperation
Distribution of Conflictive Events by Issue Area Country-Pair Events by Issue TypeExtreme (BAR Scale 6) Conflict
Water Quantity90%
Infrastructure10%
Water Quantity29%
Economic Dev.4%
Hydropower30%
FloodControl/Relief
5%
Water Quality11%
Other8%
JointManagement
13%
FloodControl/Relief
3%
Water Quality6%
Technical Coop.3%
Other4%
Water Quantity37%
Hydropower13%
Infrastructure17% Joint
Management17%
Fig. 5. Number of events by issue area.

water issues, and stability and types of governments within a basin, are all components contributing tofunctional institutional capacity.
The working hypothesis which we tested, then, regards the relationship between change in conditionsin a basin and the attendant institutions, as follows:
“The likelihood and intensity of dispute rises as the rate of change within a basin exceeds theinstitutional capacity to absorb that change.”
Indicators—prevailing wisdom
According to this hypothesis, most common measures of water stress should not, in and ofthemselves, be indicators of conflict. And, according to our data, they are not. The Appendix describesthe results of single variable correlations of a number of parameters commonly assumed to indicatetensions, none of which explain much in terms of variation:
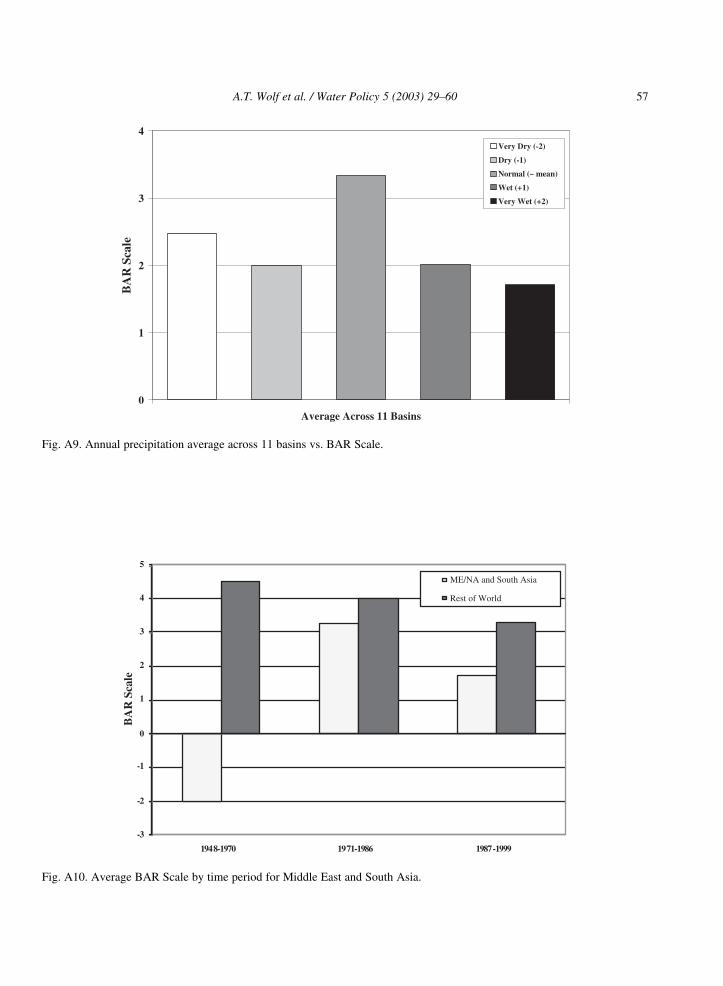
a. Countries which cooperate in general cooperate about water; countries which dispute in general,dispute over water (see Appendix, Fig. A1). Comparing general friendship/hostility with BAR eventsshows only a moderate positive correlation.b. The higher the per capita GDP, or the lower the population density, the greater the cooperation—barely. Appendix, Fig. A2 show a weak relationship between a country’s per capita GDP and the levelof water related cooperation with its neighbors. The relationship is even weaker if we use the UNHuman Development Index (not shown). Similar relationships are shown between the level ofconflict/cooperation and population density in Fig. A3 and population growth rates in Fig. A410.c. Regardless of how it is measured, water stress is not a significant indicator of water dispute.Appendix, Fig. A5 show Falkenmark’s water stress index (water available per capita by country) andFig. A6 shows water stress by basin. While there is a slight correlation in the former, neitherparameter explains much of the variation in the data. Ohlsson’s “Social Water Stress Index,” whichweights water stress by level of development, does not change either relationship (not shown).d. Neither government type nor climate show any patterns of impact on water disputes. Appendix,Fig. A7 show governments by their level of democracy/autocracy and Fig. A8 shows dominantclimate type within each basin; neither displays any discernible pattern. We should notice thatprevailing wisdom seems to be challenged in both figures—Fig. A7 appears to suggest thatdemocracies seem not to be more cooperative than other types of government (in fact, autocraticcountries are only barely less cooperative than the strongest democracies) and Fig. A8 disputes thecommonly held perception that disputes are more common in arid environments—there is littleperceptible difference between most climate types (with the notable exception of humid meso-thermal, apparently the most cooperative climate). We also do not seem to find disputes in “creepingproblems,” such as gradual degradation of water quality or climate change induced hydrologicvariability.Another set of preliminary findings regarding precipitation, shown in Appendix, Fig. A9, seems to
confirm that, perhaps not surprisingly, years of normal precipitation tend to be the most cooperative, and
10 Interestingly, Yoffe (2001, Chap. 5) found a better relationship between the rate of population growth and general (non-water) levels of conflict/cooperation.
A.T. Wolf et al. / Water Policy 5 (2003) 29–60 43

that the greater the fluctuation in any given year either towards drought or towards flood, the more tensethe basin11.
Indicators—rapid change
If most commonly assumed indicators do not actually indicate water dispute, then what does?The answer seems to lie in introducing the institutional side of the equation. If institutional capacity
is a moderating factor, then it would stand to reason that the most significant indicators would be relatedto extremely rapid changes, either on the institutional side or in the physical system. The most rapidchange institutionally would be associated with “internationalized” basins—i.e. basins whosemanagement institution was developed under one single jurisdiction, but which was dramatically alteredas that jurisdiction suddenly became divided among two or more nations. On the physical side, the mostrapid change would be the development of a large-scale dam or diversion project. But here, too, theinstitutional capacity should make a difference.
a. “Internationalized” basins. The clearest examples of this “internationalizing” process is the break-up of empires, notably the British Empire in the 1940s and the USSR in the late 1980s. Figure 6 showscooperative events as a percentage of total events from 1948–2000. We notice that this chronologysuggests three distinct periods—1971–86 is relatively more cooperative, while 1948–70 and1987–2000 are moderately more conflictive. These last two time periods coincide with years ofintense internationalization—the former of the British Empire in the Middle East and South Asia, andthe latter of the Soviet Union. This pattern is shown more clearly in Appendix, Figs. A10 and A11,which compare the conflict levels for these regions during these periods with those of the rest of theworld. Conflicts in the world’s most tense basins—the Jordan, Nile, Tigris–Euphrates, Indus andAral—were all precipitated by these break-ups. Recent internationalization seems to be one of themost significant indicators of dispute.b. Unilateral basin development in the absence of a cooperative transboundary institution. Appendix,Fig. A12 shows the relationship between dam density per basin and the level of dispute. Dams, bythemselves, seem not to be strong indicators—Table 3 shows a 12% drop in overall conflict/cooperation level in basins with high dam density versus basins with low dam density (see Table 3).Yet, according to our hypothesis, physical changes such as dams or diversions are only half theequation. Institutional capacity, in the form of a treaty, river basin organization, generally goodrelations or even a technical working group, should help ameliorate the political impacts of change.
When we factor in the institutional capacity, as represented by the presence or absence of treaties(one readily quantifiable measure of capacity), the differences are, in fact, enhanced. Basins withouttreaties and high dam density are 11% lower in their average conflict/cooperation levels than basinswithout treaties and low dam density, but the overall level is more conflictive than those basins withtreaties. Looking only at basins with treaties, the cooperation level is actually higher in basins withhigh dam density than in those with low dam density. Yet the conflict/cooperation level on basins withtreaties and high dam density is 40% lower than on similar basins with treaties.
11 These preliminary findings are based on detailed annual precipitation data for eleven basins: Aral, Danube, Ganges, Indus,Jordan, La Plata, Mekong, Nile, Orange, Salween and Tigris–Euphrates.
44 A.T. Wolf et al. / Water Policy 5 (2003) 29–60
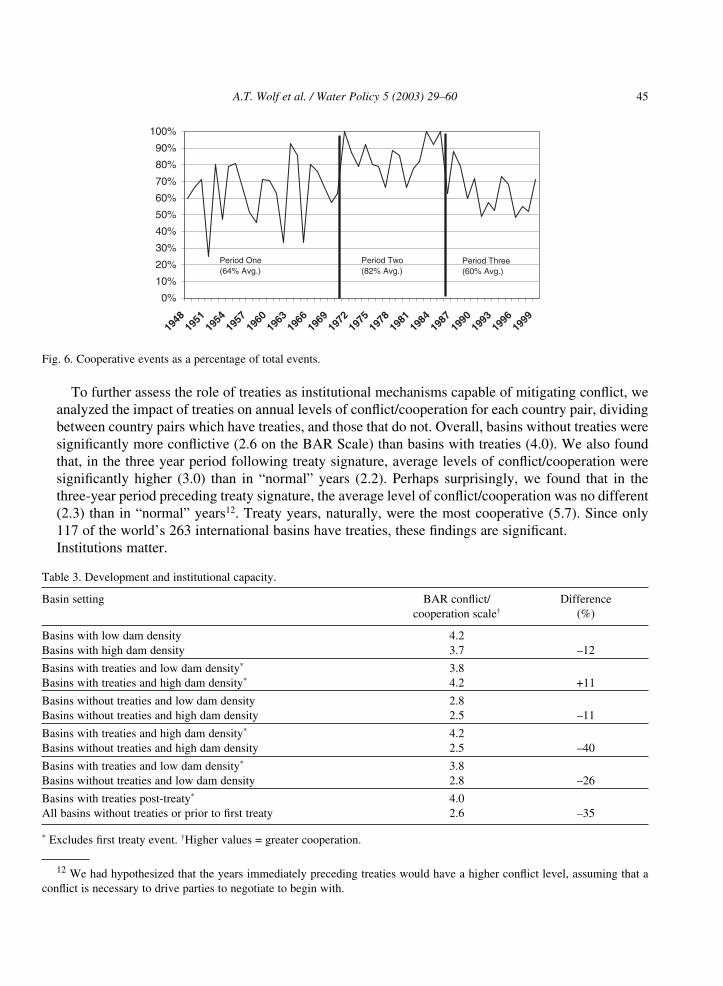
To further assess the role of treaties as institutional mechanisms capable of mitigating conflict, weanalyzed the impact of treaties on annual levels of conflict/cooperation for each country pair, dividingbetween country pairs which have treaties, and those that do not. Overall, basins without treaties weresignificantly more conflictive (2.6 on the BAR Scale) than basins with treaties (4.0). We also foundthat, in the three year period following treaty signature, average levels of conflict/cooperation weresignificantly higher (3.0) than in “normal” years (2.2). Perhaps surprisingly, we found that in thethree-year period preceding treaty signature, the average level of conflict/cooperation was no different(2.3) than in “normal” years12. Treaty years, naturally, were the most cooperative (5.7). Since only117 of the world’s 263 international basins have treaties, these findings are significant.Institutions matter.
A.T. Wolf et al. / Water Policy 5 (2003) 29–60 45
Table 3. Development and institutional capacity.
Basin setting BAR conflict/ Differencecooperation scale† (%)
Basins with low dam density 4.2Basins with high dam density 3.7 –12
Basins with treaties and low dam density* 3.8Basins with treaties and high dam density* 4.2 +11
Basins without treaties and low dam density 2.8Basins without treaties and high dam density 2.5 –11
Basins with treaties and high dam density* 4.2Basins without treaties and high dam density 2.5 –40
Basins with treaties and low dam density* 3.8Basins without treaties and low dam density 2.8 –26
Basins with treaties post-treaty* 4.0All basins without treaties or prior to first treaty 2.6 –35
* Excludes first treaty event. †Higher values = greater cooperation.
12 We had hypothesized that the years immediately preceding treaties would have a higher conflict level, assuming that aconflict is necessary to drive parties to negotiate to begin with.
0%
10%
20%
30%
40%
50%
60%
70%
80%
90%
100%
1948
1951
1954
1957
1960
1963
1966
1969
1972
1975
1978
1981
1984
1987
1990
1993
1996
1999
Period One (64% Avg.)
Period Two (82% Avg.)
Period Three (60% Avg.)
Fig. 6. Cooperative events as a percentage of total events.

c. Convergence of exacerbating factors. As demonstrated, with the exception of internationalizedbasins and unilateral development, no single parameter acts as a strong indicator of water disputes—the nature of international interaction over water resources seem more complex than most singleissues. Yet we can identify sets of factors which, when they coalesce, provide conditions for greaterlikelihoods of hostility. For example, Table 4 shows the results of a multivariate analysis in which theoverall level of friendship/hostility, the number of water related treaties signed by a country and percapita GDP were regressed against the average BAR Scale of each country; all parameters were foundto be significant and of the hypothesized sign13.
Other exacerbating factors include general hostility (non-water related) between co-riparians and,possibly, the presence of a downstream hegemon in a hostile basin (e.g. Israel, Egypt or India),although this last parameter has proven difficult to test.
We also hypothesized that, for a given pair of countries, relatively high heterogeneity between co-riparians in conditions such as population, per capita GDP, water availability, religious/ethnic groupsand/or water stress levels in neighboring basins would be correlated with higher levels of conflictintensity, as might rapid growth rates in any of these parameters. In fact, we generally found nocorrelation with the growth rate of any parameter, and little between heterogeneity andconflict/cooperation14, with two exceptions: 1) ardent democracies neighboring fervent autocraciesseem to be more conflictive than other mixes of government type (Appendix, Fig. A13 showsheterogeneity in government types); and 2) high differences in population densities between countrieswithin a basin15 actually seem to tend towards a slightly greater level of cooperation between thosetwo countries16.
Basins at risk
By taking our parameters of rapid change as indicators—internationalized basins and major plannedprojects in hostile and/or institution-less basins—we are able to identify the basins with settingssuggesting the potential for political stresses or conflicting interests in the coming 5–10 years. These
46 A.T. Wolf et al. / Water Policy 5 (2003) 29–60
13 The results of this and other multivariate regressions should be used with caution, because serial correlation betweenindependent variables (for example, in this case correlation between per capita GDP and overall friendship/hostility) can causethe significance of regression results to be overstated.
14 Interestingly, while we find no correlations between these parameters and water related conflict, Yoffe & Giordano(forthcoming) do find correlations with general levels of (non-water related) conflict.
15 Measured as the ratio of densities in the two countries, not as absolute quantities.16 We have no explanation for why this might be so. This could be an interesting finding, worthy of more exploration.
Table 4. Convergence of indicators.
Coefficient t value Probability (>t)
Intercept 0.564 0.81 0.43Friendship/hostility index 0.222 2.45 0.02*Per capita GDP (ln) 0.234 2.44 0.02*Number of treaties 0.100 5.89 0.00*
R2 = 0.3993; *denotes significant at 5% level.

basins include: the Ganges–Brahmaputra, Han, Incomati, Kunene, Kura-Araks, Lake Chad, La Plata,Lempa, Limpopo, Mekong, Ob (Ertis), Okavango, Orange, Salween, Senegal, Tumen and Zambezi.Each is mapped in Fig. 7, which also includes those basins currently in conflict or in the midst of activenegotiations: the Aral, Jordan, Nile and Tigris–Euphrates.
Monitoring for indicators
Almost more important than helping identify the basins at risk themselves, these indicators allow usto monitor for “red flags,” or markers which may suggest new basins at risk as they arise:
a. Tenders for future projects. The best sources for cutting through the rhetoric and wishful thinkinginherent in public pronouncements of development projects are the public calls for project tenders.Tenders are not put out until project funding has been ascertained, so countries must be fairly certainthat a project will actually be developed, but they still can give 3–5 years lead time (more for largeprojects) before any impact will be felt in neighboring countries—enough time to exercise preventivediplomacy. There are two good print sources for water development tenders: the Financial Times’Global Water Report (biweekly) and the Global Water Intelligence (monthly). Also, the website ofWater International Publishing Ltd. (www.e-waternews.com/) provides daily updates of water projecttenders and contracts in developing countries.b. Countries with active nationalist movements. If internationalizing a basin provides a setting ofpotential dispute, one might monitor the world’s nationalist movements and ethnic conflicts and, if
A.T. Wolf et al. / Water Policy 5 (2003) 29–60 47
Fig. 7. Basins at risk.

one wanted to act proactively, one could assess the potential impacts of a successful drive forindependence. Figure 8 maps those countries around the world with active nationalist movements.This draw from two sources: 1) armed self-determination conflicts in 2000 (with darker shading), asidentified by Professor Ted Gurr’s Minorities at Risk Project, at the University of Maryland’s Centerfor International Development and Conflict Management (as of June 2000) [http://www.bsos.umd.edu/cidcm/mar/autonomy.htm]; and 2) Unrepresented Nations and Peoples Organisations(UNPO) (with moderate shading). Participation in UNPO is open to all nations and peoples who “areinadequately represented as such at the United Nations and who declare adherence to theOrganisation’s Charter”. Since these principles espouse non-violence, the conflict level associatedwith many of these movements is lower. Data on unrepresented nations and peoples are drawn fromthe UNPO website [http://www.unpo.org/].
Why might the future look nothing like the past?
The entire basis of this study rests on the not unassailable assumption that we can tell something aboutthe future by looking at the past. It is worth stopping at this point, then, and challenging the veryfoundation of that assumption: why might the future look nothing at all like the past? What newapproaches or technologies are on the horizon to change or ameliorate the risk to the basins we haveidentified, or even to the whole approach to basins at risk?
48 A.T. Wolf et al. / Water Policy 5 (2003) 29–60
Fig. 8. Countries with active nationalist movements.

By definition, a discussion of the future cannot have the same empirical backing as a historicalstudy—the data just do not yet exist. Yet there are cutting edge developments and recent trends which,if one examined them within the context of this study, might suggest some possible changes in store fortransboundary waters in the near future. What follows, then, are four possibly fundamental changes inthe way we approach transboundary waters.
a. New technologies for negotiation and management. Our event dataset goes back to 1948. In someways, water management is very similar now as it was then (or, for that matter, as it was 5000 yearsago). But some fundamental aspects are profoundly different. While global water stresses areincreasing, institutions are getting better and more resilient, management and understanding areimproving, and these issues are increasingly on the radar screen of global and local decision-makers.But most importantly, the 21st century has access to new technology which could not be dreamed ofin 1948, and which adds substantially to the ability both to negotiate and to manage transboundarywaters more effectively:
� Modular modeling systems (MMSs) such as STELLA, Waterware and Riverware can now be usedfor comprehensive modeling of hydrologic and human systems. Because of their modular design,they can also act as a facilitation tool by allowing managers/negotiators to cooperatively build themodel, increasing the joint knowledge base and communications;
� GIS and remote sensing allow several spatial data layers, encompassing biophysical, socioeconomicand geopolitical parameters, to be viewed and analyzed graphically; and Graphical User Interfaces(GUIs) allow for each component to be brought together into an intuitive, user-friendly setting.
� Real-time monitoring tools, such as remotely controlled gaging stations, add new options for real-time management and allocations based on existing hydrologic settings rather than fixed quantities;
� Technologies and management practices which increase water use efficiency, such as dripirrigation, biotechnology and market mechanisms, help reduce political pressures on existingsupplies.
While new technologies and data cannot replace the political goodwill necessary for creativesolutions, nor are they widely available outside the developed world, they can, if appropriatelydeployed, allow for more robust negotiations and greater flexibility in joint management.b. Globalization: private capital, WTO, and circumvented ethics. Very little of the recent attention onglobalization and the World Trade Organization (WTO) has centered on water resources, but there isa definite water component to these trends. One of the most profound is the shift of developmentfunds from global and regional development banks, such as the World Bank and the AsiaDevelopment Bank, to private multinationals, such as Bechtel, Vivendi and Ondeo (formallyLyonnaise des Eaux). Development banks have, over the years, been susceptible to public pressuresand ethics and, as such, have developed procedures for evaluating social and environmental impactsof projects and incorporating them in decision making. On international waters, each developmentbank has guidelines that generally prohibit development unless all riparians agree to the project,which in and of itself has promoted successful negotiations in the past. Private enterprises have nosuch restrictions, and nations eager to develop controversial projects have been increasingly turningto private capital to circumvent public ethics. The most controversial projects of the day—Turkey’sGAP project, India’s Narmada River project and China’s Three Gorges Dam—are all proceedingthrough the studied avoidance of development banks and their mores.
A.T. Wolf et al. / Water Policy 5 (2003) 29–60 49

There is a more subtle effect of globalization, though, which has to do with the World TradeOrganization (WTO) and its emphasis on privatization and full cost recovery of investments. Localand national governments, which have traditionally implemented and subsidized water developmentsystems to keep water prices down, are under increasing pressure from the forces of globalization todevelop these systems through private companies. These large multinational water companies in turnmanage for profit and, if they use development capital, both push and are pushed to recover the fullcost of their investment. This situation can translate not only into immediate and substantial rises inthe cost of water, disproportionately affecting the poor, but also to greater eradication of local andindigenous management systems and cultures. If there is to be water related violence in the future, itis much more liable to be like the “water riots” against a Bechtel development in Bolivia in 1999 than“water wars” across national boundaries.
As WTO rules are elaborated and negotiated, real questions remain as to how much of this processwill be required of nations in the future, simply to retain membership in the organization. The“commodification” of water as a result of these forces is a case in point. Over the last 20 years, noglobal water policy meeting has neglected to pass a resolution which, among other issues, definedwater as an “economic good,” setting the stage at the 2000 World Water Forum for an unresolvedshowdown against those who would define water as a human or ecosystem right. The debate loomslarge over the future of water resources: if water is a commodity, and if WTO rules disallow obstaclesto the trade of commodities, will nations be forced to sell their water? While far-fetched now (eventhough a California company is challenging British Columbia over precisely such an issue underNAFTA rules), the globalization debate between market forces and social forces continue to play outin microcosm in the world of water resources.c. The geopolitics of desalination. Twice in the last 80 years—during the 1960s nuclear energy fervor,and in the late 1980s, with “discoveries” in cold fusion—much of the world briefly thought it was onthe verge of having access to close-to-free energy supplies. “Too cheap to meter” was the phraseduring the Atoms for Peace Conference. While neither the economics nor the technology finallysupported these claims, it is not far fetched to picture changes that could profoundly alter theeconomics of desalination.
The marginal cost of desalinated water (between US$0.55–$0.80/m3) makes it currently cost-effective only in the developed world where: 1) the water will be used for drinking water; 2) thepopulation to whom the water will be delivered lives along a coast and at low elevations; and 3) thereare no alternatives. The only places not so restricted are where energy costs are especially low,notably the Arabian Peninsula. A fundamental shift either in energy prices or in membranetechnology could bring costs down substantially. If either happened to the extent that the marginalcost allowed for agricultural irrigation with sea water (around US$0.08/m3 on average), a largeproportion of the world’s water supplies would shift from rivers and shallow aquifers to the sea (anunlikely, but plausible, scenario).
Besides the fundamental economic changes which would result, geopolitical thinking on watersystems would also need to shift. Currently, there is inherent political power in being an upstreamriparian, and thus controlling the headwaters. In the above scenario for cheap desalination, that spatialposition of power would shift from mountains to the valleys, and from the headwaters to the sea.Many nations, such as Israel, Egypt and Iraq, currently dependent on upstream neighbors for theirwater supply would, by virtue of their coastlines, suddenly find their roles reversed. Again, unlikely,but plausible.
50 A.T. Wolf et al. / Water Policy 5 (2003) 29–60

d. The changing sources of water and the changing nature of conflict. Both the worlds of water andof conflict are undergoing slow but steady changes which may obviate much of the thinking in thispaper. Lack of access to a safe, stable supply of water is reaching unprecedented proportions.Furthermore, as surface water supplies and easy groundwater sources are increasingly exploitedthroughout the world, two major changes result: quality is steadily becoming a more serious issue tomany than quantity, and water use is shifting to less traditional sources. Many of these sources—suchas deep fossil aquifers, wastewater reclamation and interbasin transfers—are not restricted by theconfines of watershed boundaries, our fundamental unit of analysis in this study.
Conflict, too, is becoming less traditional, increasingly being driven by internal or local pressures,or more subtle issues of poverty and stability. The combination of changes, in water resources and inconflict, suggest that tomorrow’s water disputes may look very different from today’s.
Conclusions
Despite the growing literature on water and conflict in international river basins, little empirical workhas been done to bolster the common conclusions so widely reported. Existing works regularly self-select case studies from the most volatile basins and exclude cooperative events, spatial variability andprecise definitions of conflict. In order to be as thorough as possible in our approach to internationalwaters, our analysis included: consistent and precise definitions of conflict and cooperation; events overthe entire spectrum of conflict and cooperation, ranked by intensity; allowance for spatial variability;and inclusion of the widest possible set of international basins—all of the world’s internationalwatersheds, over the past 50 years. Given our design criteria, we set out to develop a study ofinternational waters that would allow for the settings of historic events to be identified, and which wouldin turn inform the identification of basins at greatest risk of political stresses in the near future (5–10years).
The study was divided into three components:
1. Compilation and assessment of relevant biophysical, socio-economic and geopolitical data in a globalGIS, and use of these factors to determine history-based indicators for future tensions alonginternational waterways.
2. Using these indicators, identification of basins at risk for the coming decade.3. Identification and assessment of the potential for mitigating factors and new technologies, resulting
in a future different than that predicted by the history-based indicators.
In general, we found that most of the parameters commonly identified as indicators of water conflictare actually only weakly linked to dispute. These parameters include: climate, water stress, population;dependence on hydropower, dams or development per se, level of development or “creeping changes,”such as gradual degradation of water quality or climate-change-induced hydrologic variability. In fact,our study suggests that institutional capacity within a basin, whether defined as water managementbodies or treaties, or generally positive international relations are as important, if not more so, than thephysical aspects of a system. The relationship was hypothesized as follows:
“The likelihood and intensity of dispute rises as the rate of change within a basin exceeds theinstitutional capacity to absorb that change.”
A.T. Wolf et al. / Water Policy 5 (2003) 29–60 51

If institutional capacity is a driver, then it would stand to reason that the most significant indicatorswould be related to extremely rapid changes, either on the institutional side or in the physical system.The most significant indicators, then, would reflect this relationship:
1. “Internationalized” basins. The most rapid changes institutionally are associated with “internationalized”basins—i.e. basins whose management institution was developed under a single jurisdiction, but whichwas altered or shattered as that jurisdiction suddenly became divided among two or more nations.
2. Unilateral development in the absence of a treaty or commission. On the physical system side, themost rapid change is typically the development of a large-scale dam or diversion project. But here,too, the institutional capacity makes a difference. In other words, high levels of animosity and/or theabsence of a transboundary institution can exacerbate the setting, while positive international relationsand/or the presence of transboundary institutions can mitigate the negative effects of such projects.
By taking our parameters of rapid change as indicators—internationalized basins and major plannedprojects in hostile and/or institutionless basins—we were able to identify the basins with settings whichsuggest the potential for tensions in the coming 5–10 years. These basins include: the Ganges–Brahmaputra, Han, Incomati, Kunene, Kura-Araks, Lake Chad, La Plata, Lempa, Limpopo, Mekong,Ob (Ertis), Okavango, Orange, Salween, Senegal, Tumen and Zambezi.
Almost more important than helping identify the basins at risk themselves, these indicators allow usto monitor for “red flags”, or markers, which may suggest new basins at risk as they arise, among themtenders for future projects and nations with active nationalist movements.
Finally, recognizing that history-based indicators may lose validity over time in a rapidly changingworld, we asked what if the future looks nothing like the past, and focused on four topics: newtechnologies for negotiation and management; globalization, privatization and the WTO; the geopoliticsof desalination; and the changing sources of water and the changing nature of conflict.
52 A.T. Wolf et al. / Water Policy 5 (2003) 29–60

A.T. Wolf et al. / Water Policy 5 (2003) 29–60 53
-5
-3
-1
1
3
5
7
3 4 5 6 7 8 9 10 11
Ln of Per Capita GDP
BA
R S
cale
Fig. A2. Per capita GDP vs. BAR Scale. n = 114, R2 = 0.05, coeff. = 5.11, significant at 5% level.
-5
-3
-1
1
3
5
7
-3 -2 -1 0 1 2 3 4
Friendship-Hostility Index
BA
R S
cale
Fig. A1. Friendship/hostility (excluding water events) by country pair vs. BAR Scale. n = 130, R2 = 0.12, coeff. = 1.74,significant at 5% level.
Appendix: results of analyses

54 A.T. Wolf et al. / Water Policy 5 (2003) 29–60
-5
-3
-1
1
3
5
7
0 0.5 1 1.5 2 2.5 3
Ln of Population Growth Rate by Country
BA
R S
cale
Fig. A4. Population growth rate by country vs. BAR Scale. n = 126, R2 = 0.02, coeff. = –11.77, not significant at 5% level.
-5
-3
-1
1
3
5
7
0 1 2 3 4 5 6 7
Ln of Population Density (people/sq. km.) by Basin
BA
R S
cale
Fig. A3. Population density by basin vs. BAR Scale. n = 121, R2 = 0.04, coeff. = –0.30, significant at 5% level.

A.T. Wolf et al. / Water Policy 5 (2003) 29–60 55
-5
-3
-1
1
3
5
7
5 6 7 8 9 10 11 12 13 14
Ln of Water Stress by Basin
BA
R S
cale
Fig. A6. Freshwater availability per capita by basin vs. BAR Scale. n = 86, R2 = 0.01, coeff. = 6.56, not significant at 5%level.
-5
-3
-1
1
3
5
7
-2 -1 0 1 2 3 4 5 6
Ln of Water Stress by Country
BA
R S
cale
Fig. A5. Freshwater availability per capita by country vs. BAR Scale. n = 113, R2 = 0.04, coeff. = 4.19, significant at 5%level.

56 A.T. Wolf et al. / Water Policy 5 (2003) 29–60
0
1
2
3
4
5
Tropical Rainy Dry HumidMeso-thermal
HumidMicro-thermal
BA
R S
cale
Fig. A8. Primary climate type vs. BAR Scale by basin.
0
1
2
3
4
5
6
-10 -9 -8 -7 -6 -5 -4 -3 -2 -1 0 1 2 3 4 5 6 7 8 9 10
<========== Increasingly Autocratic Increasingly Democratic ==========>
BA
R S
cale
Fig. A7. Regime type vs. BAR Scale, 1948–1999.
A.T. Wolf et al. / Water Policy 5 (2003) 29–60 57
-3
-2
-1
0
1
2
3
4
5
1948-1970 1971-1986 1987-1999
BA
R S
cale
ME/NA and South Asia
Rest of World
Fig. A10. Average BAR Scale by time period for Middle East and South Asia.
0
1
2
3
4
Average Across 11 Basins
BA
R S
cale
Very Dry (-2)
Dry (-1)
Normal (~ mean)
Wet (+1)
Very Wet (+2)
Fig. A9. Annual precipitation average across 11 basins vs. BAR Scale.

58 A.T. Wolf et al. / Water Policy 5 (2003) 29–60
-5
-3
-1
1
3
5
7
-2 -1 0 1 2 3 4 5 6 7 8
Ln of Dam Density (dams/million sq. km.) by Basin
BA
R S
cale
Fig. A12. Dam density by basin vs. BAR Scale. n = 82, R2 = 0.02, coeff. = –3.93, not significant at 5% level.
0
1
2
3
4
5
6
1948-1970 1971-1986 1987-1999
BA
R S
cale
Eastern Europe andSoviet Union/FSU
Rest of World
Fig. A11. Average BAR Scale by time period for Eastern Europe and Soviet Union/FSU.

Acknowledgements
The BAR project was a team effort at its best, relying on the dedication and generosity of a vastnumber of researchers and professionals. I am more indebted than I can say for the commitment of theresearch group at OSU: Sara Ashley, Case Bowman, Kuuipo Burleigh, Becci Dale, Greg Fiske,Meredith Giordano, Jeanne Hoadley, Kelli Larson, Kyoko Matsumoto, Marc Rothgery and Daniel Wise.Their skill and long hours are extraordinarily appreciated.
This project simply would not have been possible without the support of a number of other individualsas well. First and foremost, we are grateful for the leadership, assistance and insight of Dr. Norm Kahn.Warm thanks too are due to Uri Shamir, Ken Hollett, David Hanig and Aaron Salzberg for their closereading and helpful comments on the manuscript. We would also like to thank Phil Jackson, JonKimerling, Chuck Rosenfeld and Dawn Wright of OSU’s Department of Geosciences; George Taylor,Oregon State Climatologist, and his assistants Nathaniel De Young and Melanie Mitchell; Joe Toth andCarrie Ottow at the OSU Valley Library; Glenda Pearson at the University of Washington Library, andBrian Smith.
This was also an extraordinarily data-intensive project, which relied on the generosity of manyresearchers around the world who are committed to open distribution of their incredibly rich data sets,among them Mark Levy, Center for International Earth Science Information Network; Jake Brunner andKirsten Thompson, World Resources Institute; Petra Doell, University of Kassel, Germany; BalazsFekete, Complex Systems Research Center, University of New Hampshire; David B. Kynoch, President,Pacific Northwest GIS Consulting, Inc.; Michael D. Ward, Department of Political Science, Universityof Washington (Seattle); Jerome E. Dobson, Oak Ridge National Laboratory; Jeff Danielson and Kent
A.T. Wolf et al. / Water Policy 5 (2003) 29–60 59
-2
-1
0
1
2
3
4
5
6
0 1 2 3 4 5 6 7 8 9 10 11 12 13 14 15 16 17 18 19
Difference in Democracy-Autocracy Index Values by Country-Pair
BA
R S
cale
Fig. A13. Difference in regime type by country pair vs. BAR Scale, 1948–1999.
Lethcoe, EROS Data Center; researchers at the Global Event Data System, University of Maryland; andthe National Geographic Society. Shira Yoffe’s studies at OSU were funded by the National ScienceFoundation Landscape Studies Fellowship, for which we are grateful.
References
Beach, L., Hamner, J., Hewitt, J., Kaufman, E., Kurki, A., Oppenheimer, J. & Wolf, A. (2000). Transboundary FreshwaterDispute Resolution: Theory, Practice and Annotated References. United Nations University Press, New York.
Butts, K. (1997). The strategic importance of water. Parameters. Spring, 65–83.Delli Priscoli, J. (1998). Water and civilization: using history to reframe water policy debates and to build a new ecological
realism. Water Policy, 1 (6), 623–636.Falkenmark, M. (1989). The massive water scarcity now threatening Africa—why isn’t it being addressed? Ambio, 18 (2),
112–118.Fiske, G. & Yoffe, S. B. Utilizing GIS for variable derivation and spatial and temporal analysis of conflict and cooperation over
international waters. In review; online at www.transboundarywaters.orst.edu.Gleick, P. (1993). Water and conflict: fresh water resources and international security. International Security. 18 (1), 79–112.Homer-Dixon, T. (1994). Environmental scarcities and violent conflict. International Security, Summer.Libiszewski, S. (1995). Water Disputes in the Jordan Basin Region and their Role in the Resolution of the Arab-Israeli Conflict.
Center for Security Studies and Conflict Research, Zurich, Occasional Paper #13, August.Ohlsson, L. (1999). Environment, Scarcity and Conflict: A Study of Malthusian Concerns. Department of Peace and
Development Research, University of Göteborg.Remans, W. (1995). Water and war. Humantäres Völkerrecht, 8 (1).Revenga, C., Murray, S., Abrams, J. & Hammond, A. (1998). Watersheds of the World. World Resources Institute,
Washington, DC.Salman, S.M.A. & Boisson de Chazournes, L. (eds.) (1998). International Watercourses: Enhancing Cooperation and
Managing Conflict. The World Bank, Washington DC, Technical Paper No. 414.Samson, P. & Charrier, B. (1997). International freshwater conflict: issues and prevention strategies. Green Cross Draft Report,
May.Westing, A.H. (ed.) (1986). Global Resources and International Conflict: Environmental Factors in Strategic Policy and
Action. Oxford University Press, New York.Wolf, A. (1998). Conflict and cooperation along international waterways. Water Policy, 1 (2), 251–265.Wolf, A., Natharius, J., Danielson, J., Ward, B. & Pender, J. (1999). International river basins of the world. International
Journal of Water Resources Development, 15 (4), 387–427.Yoffe, S. B. (2001). Basins at risk: conflict and cooperation over international freshwater resources. PhD Dissertation,
unpublished. Department of Geosciences, Oregon State University. Online at: www.transboundarywaters.orst.edu.Yoffe, S.B. & Giordano, M. Measuring friendship-hostility between nation-states: a variable for quantitative analysis. In
review; online at: www.transboundarywaters.orst.edu.Yoffe, S.B. & Larson, K.L. Basins at risk: event data methodology and findings. In review; online at:
www.transboundarywaters.orst.edu.
60 A.T. Wolf et al. / Water Policy 5 (2003) 29–60