internet panels, twitter, and crowdsourcing · in defense of probability (has it come to this?)...
TRANSCRIPT
New Frontiers: Internet Panels, Twitter, and Crowdsourcing
A Summary of Research from the 2012 AAPOR Conference
in Orlando, FL
Sarah Cho Kaiser Family Foundation PAPOR Conference Chair
June 2012
Disclaimer Papers/presentations obtained with author permission. Any misinterpretations are my own.
Sarah Cho Kaiser Family Foundation PAPOR Conference Chair
June 2012
Furthering the Debate on Non-Probability Sampling
A Systematic Review of Studies Investigating the Quality of Data Obtained with Online Panels Mario Callegaro, Google UK Ana Villar, Independent Consultant Jon A. Krosnick, Stanford University David S. Yeager, Stanford University Some Thoughts on a Framework for Statistical Inference From Non-Probability Samples Rob Santos, The Urban Institute In Defense of Probability: Are the Times a-Changing? Gary Langer, Langer Research Associates Comparison of Dual Frame Telephone and Non-Probability Online Panels Regarding Accuracy of Political Opinion Polling Clifford Young, Ipsos Chris Jackson, Ipsos Jon A. Krosnick, Stanford University

In Defense of Probability
(Has it come to this?)
Gary Langer Langer Research Associates
American Association for Public Opinion Research Orlando, Florida
May 18, 2012
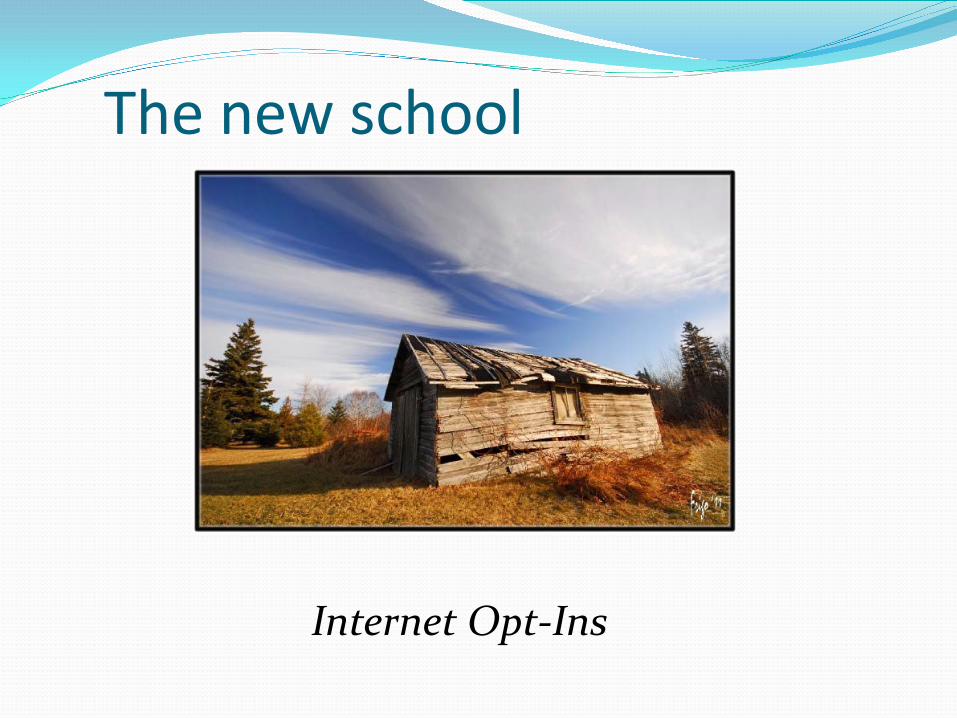
Internet Opt-Ins
The new school


Opt-in online panelist 32-year-old Spanish-speaking female
African-American physician residing in Billings, MT

Professional Respondents? Among 10 largest opt-in panels: 10% of panel participants account for 81% of survey responses; 1% of participants account for 34% of responses. Gian Fulgoni, chairman, comScore, Council of American Survey Research Organizations annual conference, Los Angeles, October 2006.

One claim: Convenience Sample MOE Zogby Interactive: "The margin of error is +/- 0.6 percentage points.”
Ipsos/Reuters: “The margin of error is plus or minus 3.1 percentage points."
Kelton Research: “The survey results indicate a margin of error of +/- 3.1 percent at a 95 percent confidence level.”
Economist/YouGov/Polimetrix: “Margin of error: +/- 4%.”
PNC/HNW/Harris Interactive: “Findings are significant at the 95 percent confidence level with a margin of error of +/- 2.5 percent.”
Radio One/Yankelovich: “Margin of error: +/-2 percentage points.”
Citi Credit-ED/Synovate: “The margin of error is +/- 3.0 percentage points.”
Spectrem: “The data have a margin of error of plus or minus 6.2 percentage points.”
Luntz: “+3.5% margin of error”
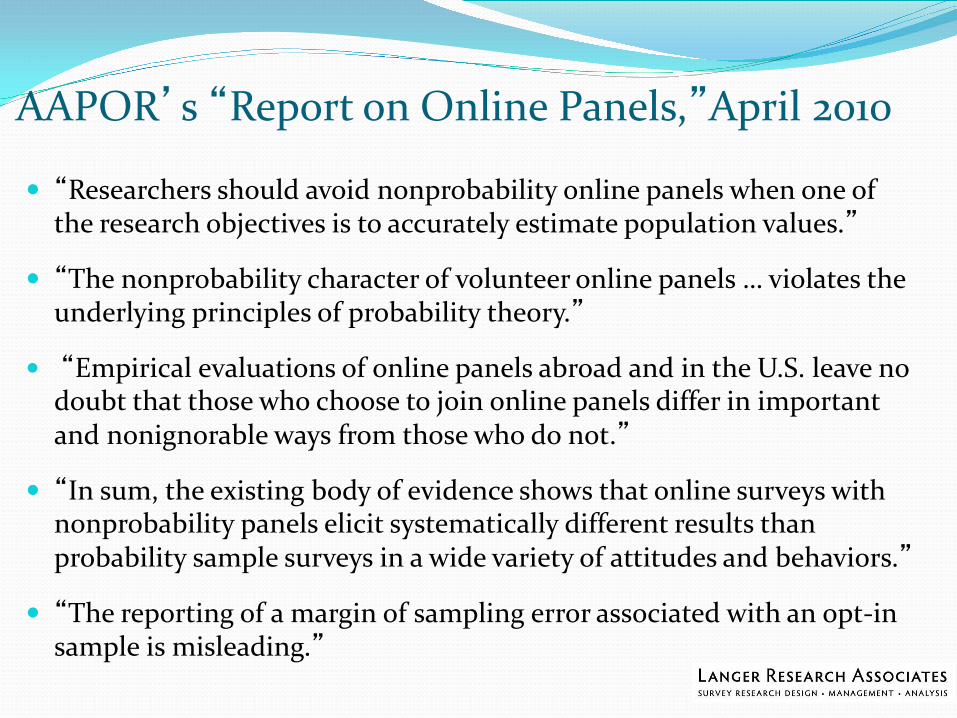
AAPOR’s “Report on Online Panels,”April 2010 “Researchers should avoid nonprobability online panels when one of
the research objectives is to accurately estimate population values.”
“The nonprobability character of volunteer online panels … violates the underlying principles of probability theory.”
“Empirical evaluations of online panels abroad and in the U.S. leave no doubt that those who choose to join online panels differ in important and nonignorable ways from those who do not.”
“In sum, the existing body of evidence shows that online surveys with nonprobability panels elicit systematically different results than probability sample surveys in a wide variety of attitudes and behaviors.”
“The reporting of a margin of sampling error associated with an opt-in sample is misleading.”
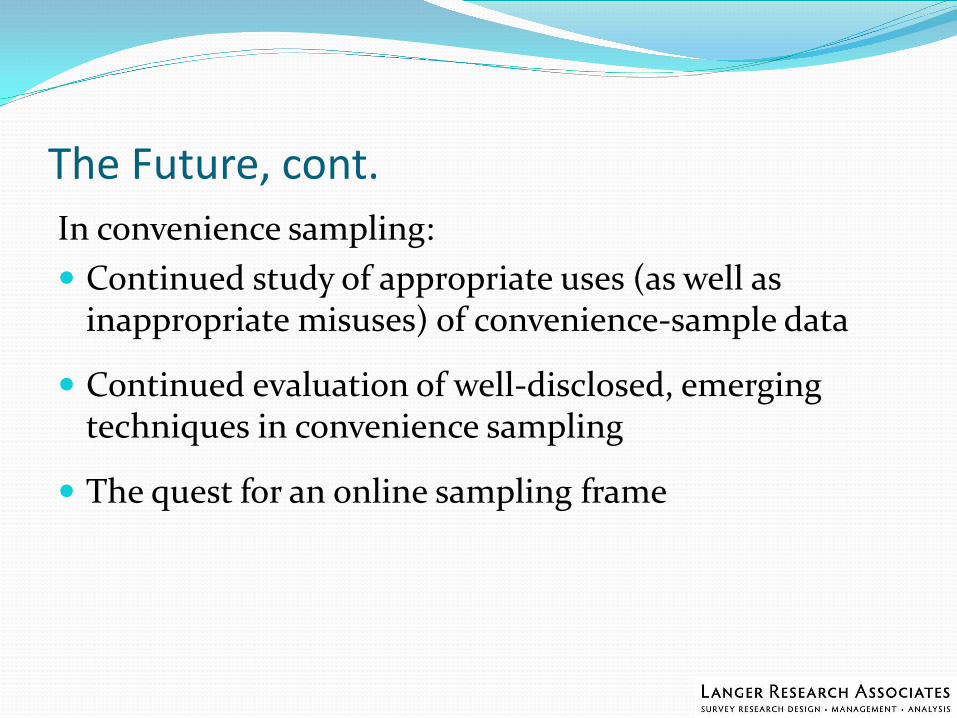
The Future, cont. In convenience sampling: Continued study of appropriate uses (as well as
inappropriate misuses) of convenience-sample data
Continued evaluation of well-disclosed, emerging techniques in convenience sampling
The quest for an online sampling frame

Thank you!
Gary Langer
Langer Research Associates [email protected]
American Association for Public Opinion Research Orlando, Florida
May 18, 2012
Nobody’s Unpredictable
Comparisons of Dual Frame Telephone Polls & Non-Probability Online Polls Regarding Accuracy of Political Opinion Polling Chris Jackson, Ipsos Public Affairs Cliff Young, Ipsos Public Affairs Neale El-Dash, Ipsos Public Affairs Darrell Bricker, Ipsos Public Affairs Jon Krosnick, Stanford University
14
© 2
012
Ipso
s
AAPOR Presentation: Comparison of Methodology Regarding Accuracy of Political Opinion Polling
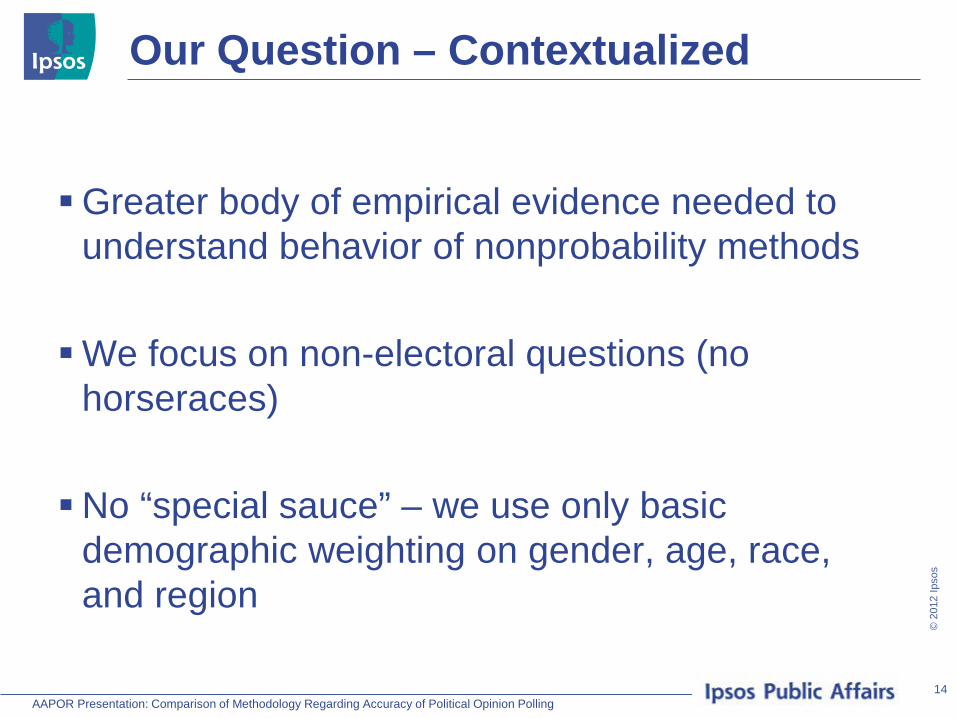
Our Question – Contextualized
Greater body of empirical evidence needed to
understand behavior of nonprobability methods We focus on non-electoral questions (no
horseraces) No “special sauce” – we use only basic
demographic weighting on gender, age, race, and region
15
© 2
012
Ipso
s
AAPOR Presentation: Comparison of Methodology Regarding Accuracy of Political Opinion Polling
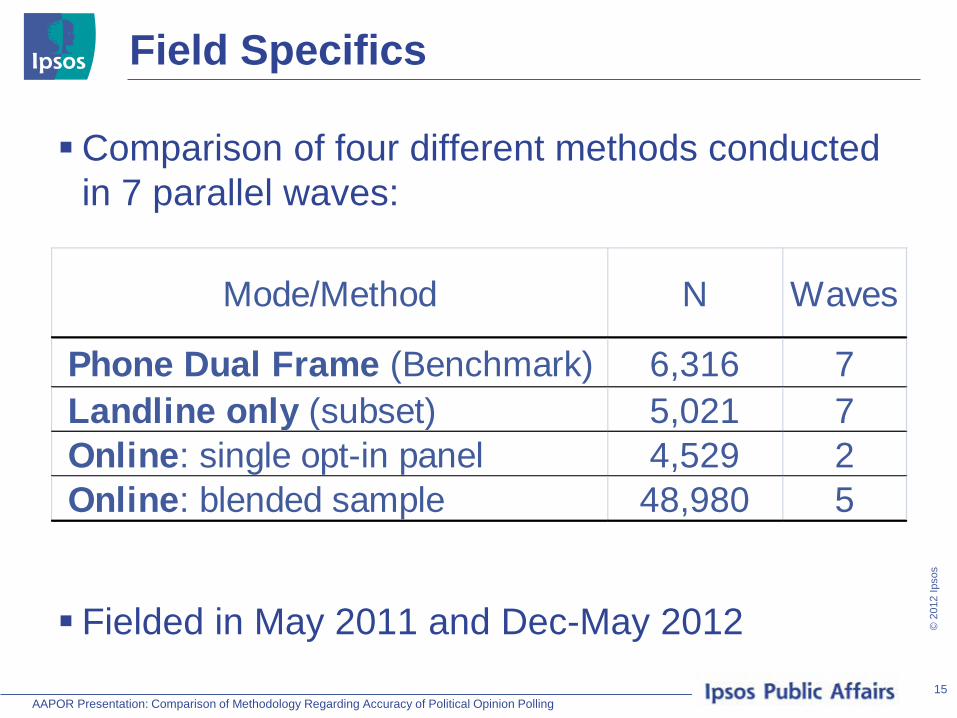
Field Specifics
Comparison of four different methods conducted in 7 parallel waves: Fielded in May 2011 and Dec-May 2012
Mode/Method N Waves
Phone Dual Frame (Benchmark) 6,316 7Landline only (subset) 5,021 7Online: single opt-in panel 4,529 2Online: blended sample 48,980 5
16
© 2
012
Ipso
s
AAPOR Presentation: Comparison of Methodology Regarding Accuracy of Political Opinion Polling
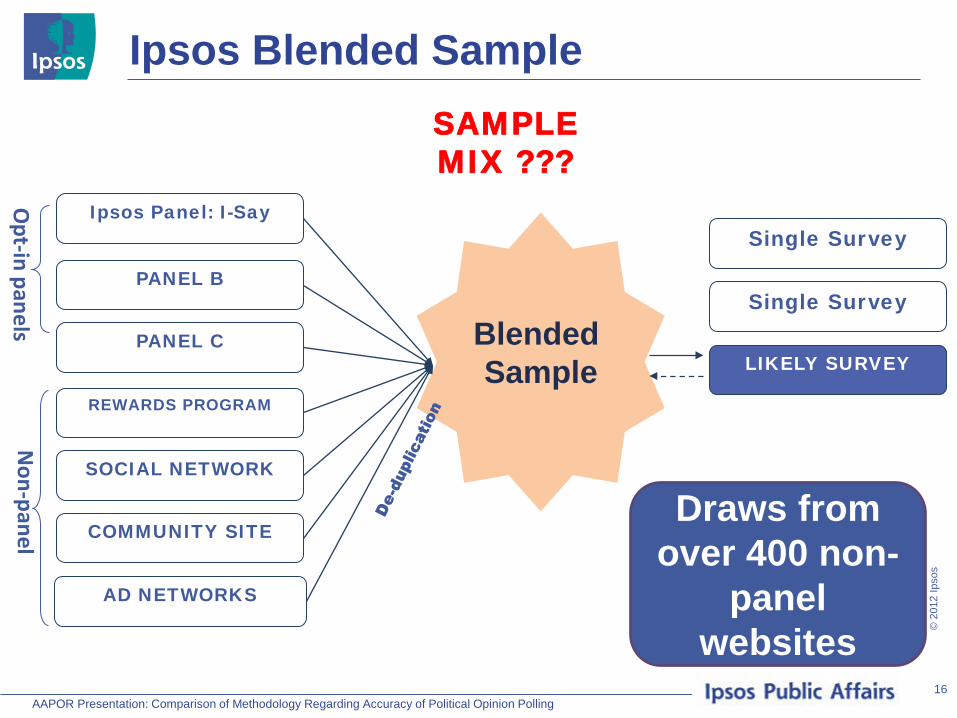
Ipsos Blended Sample
Ipsos Panel: I-Say
PANEL B
COMMUNITY SITE
SOCIAL NETWORK
REWARDS PROGRAM
PANEL C
AD NETWORKS
Non-panel
Opt-in panels
LIKELY SURVEY
Single Survey
Single Survey
Blended Sample
Draws from over 400 non-
panel websites
SAMPLE MIX ???

17
© 2
012
Ipso
s
AAPOR Presentation: Comparison of Methodology Regarding Accuracy of Political Opinion Polling
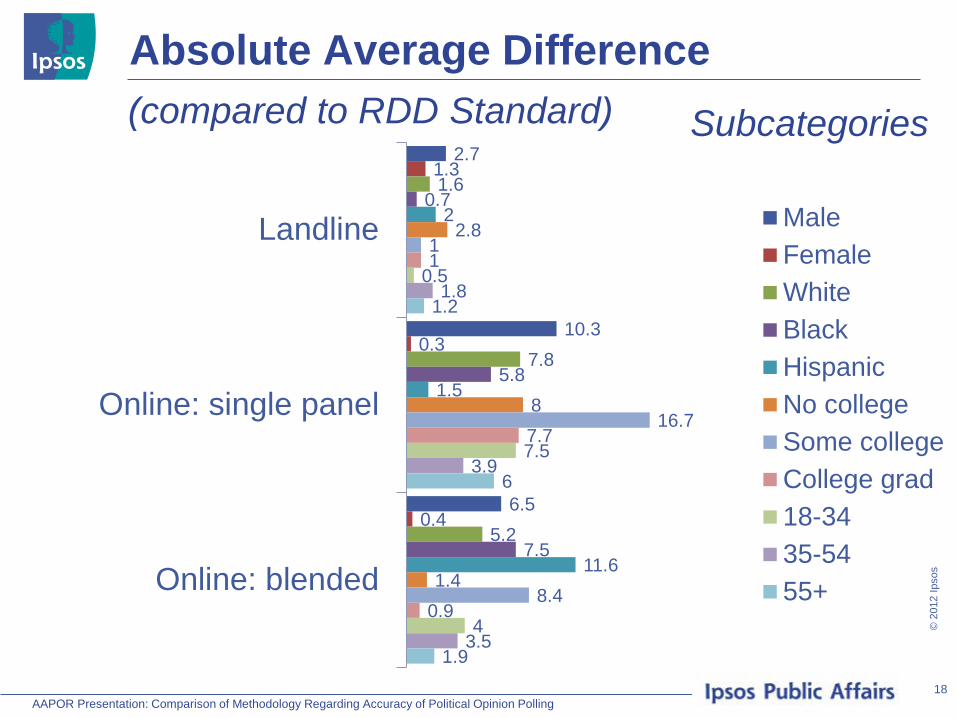
Absolute Average Difference
3
5.7
1.4
Online:blended
Online: singlepanel
Landline
(compared to RDD Standard)
2.6
2
18
© 2
012
Ipso
s
AAPOR Presentation: Comparison of Methodology Regarding Accuracy of Political Opinion Polling
Absolute Average Difference
2.7
10.3
6.5
1.3
0.3
0.4
1.6
7.8
5.2
0.7
5.8
7.5
2
1.5
11.6
2.8
8
1.4
1
16.7
8.4
1
7.7
0.9
0.5
7.5
4
1.8
3.9
3.5
1.2
6
1.9
Landline
Online: single panel
Online: blended
MaleFemaleWhiteBlackHispanicNo collegeSome collegeCollege grad18-3435-5455+
(compared to RDD Standard) Subcategories

19
© 2
012
Ipso
s
AAPOR Presentation: Comparison of Methodology Regarding Accuracy of Political Opinion Polling
Conclusions
1. Adding cell phones to RDD surveys result in small reduction of bias.
2. Single-panel online studies are notably different from RDD surveys
3. Blended multiple online respondent sources yield results more similar to dual frame RDD
– Individual online panels may be disadvantage by idiosyncrasies of their recruiting methods
New Frontiers: Survey Responses vs. Tweets – New Choices for Social Measurement
Social Media and Implications for Public Opinion and Survey Research Jeff Hancock, Cornell University Jamie Guillory, Cornell University New Data Sources for Statistics: Experiences at Statistics Netherlands Piet Daas, Statistics Netherlands Marko R. Roos, Statistics Netherlands Chris de Blois, Statistics Netherlands Rutger Hoekstra, Statistics Netherlands Olav Ten Bosch, Statistics Netherlands Text Mining and Lightweight Online Surveys in Facebook Roddy Lindsay, Facebook When Twitter Predicts: Philosophical and Empirical Considerations for Population Inferences Josh Pasek, University of Michigan From Tweets to Polls: Linking Text Sentiment to Public Opinion Time Series Brendan O’Connor, Carnegie Mellon University
New Frontiers: Challenges in Using Twitter to Measure Public Opinion
The Challenges in Analyzing Twitter Data for Public Opinion Researchers Masahiko Aida, Greenberg Quinlan Rosner Do Social Media Affect Public Discourses? A Sentiment Analysis of Political Tweets During the French Presidential Election Campaign Steve Schwarzer, Marie Curie Initial Training Network ELECDEM Leendert de Voogd, TNS (Political & Social) Pascal Chelala, TNS Opinion Methodological Considerations in Analyzing Twitter Data Annice Kim, RTI International Heather Hansen, RTI International Joe Murphy, RTI International Can Automated Sentiment Analysis of Twitter Data Replace Human Coding? Annice Kim, RTI International Ashley Richards, RTI International Joe Murphy, RTI International Adam Sage, RTI International Heather Hansen, RTI International

RTI International
RTI International is a trade name of Research Triangle Institute. www.rti.org
Methodological Considerations in Analyzing Twitter Data
Annice Kim, Heather Hansen, Joe Murphy Presentation at AAPOR Annual Conference, May 2012, Orlando, FL.

RTI International
Purpose In this session, we use examples from an ongoing study of Twitter
data to illustrate methodological issues in analyzing Twitter data. We will discuss insights on:
1) sampling 2) data cleaning 3) volume + data management 4) metrics 5) time frame and unit of analysis
We will conclude with areas for future research.

RTI International
1. Sample Frame
API Firehose Data Available 1-10%+
Sample Full Sample
Historical Data No Yes (availability varies by vendor)
Cost Free Varies by Vendor/Volume ($500+)
Twitter default search only goes back 1-week + cannot handle multiple keyword searches Third party sources: Application Programming Interface (API) vs. firehose access
RTI International
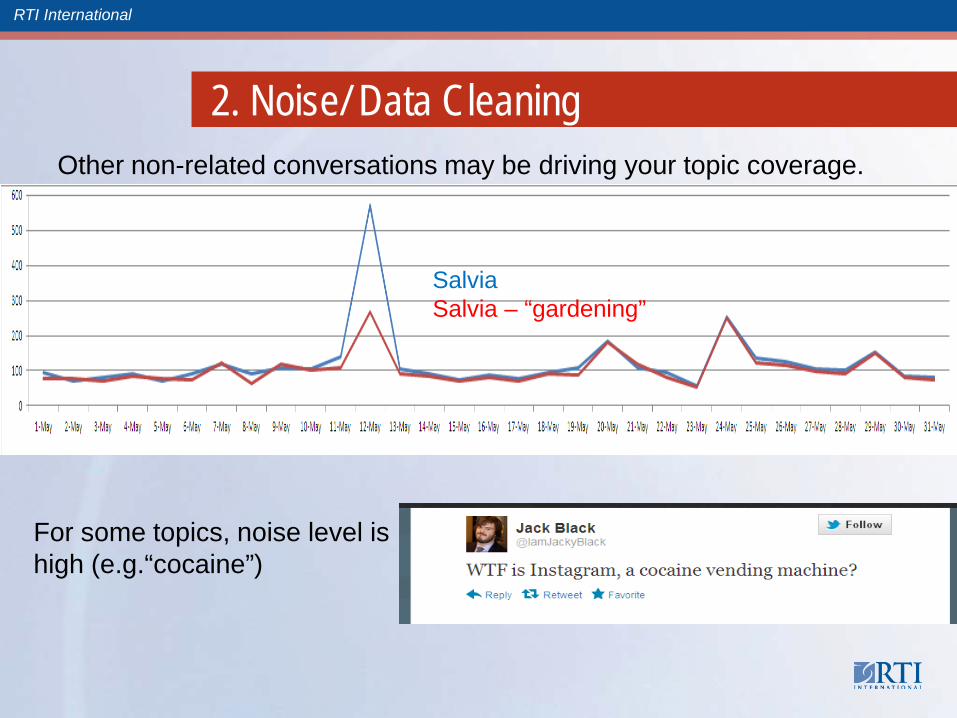
2. Noise/ Data Cleaning Other non-related conversations may be driving your topic coverage.
For some topics, noise level is high (e.g.“cocaine”)
Salvia Salvia – “gardening”

RTI International
3) Volume + Data Management
o Limits on the amount of data that can be exported at one time e.g. radian6 allows only 5,000 cases
o Tweet files need to be merged for use with text analysis software, which also have limits on volume of data it can import and analyze.
17 months of healthcare reform Tweets
1.5 million Tweets
300 radian6 exports
26 CSV files
78 STAS files (~20k tweets per run)
RTI International
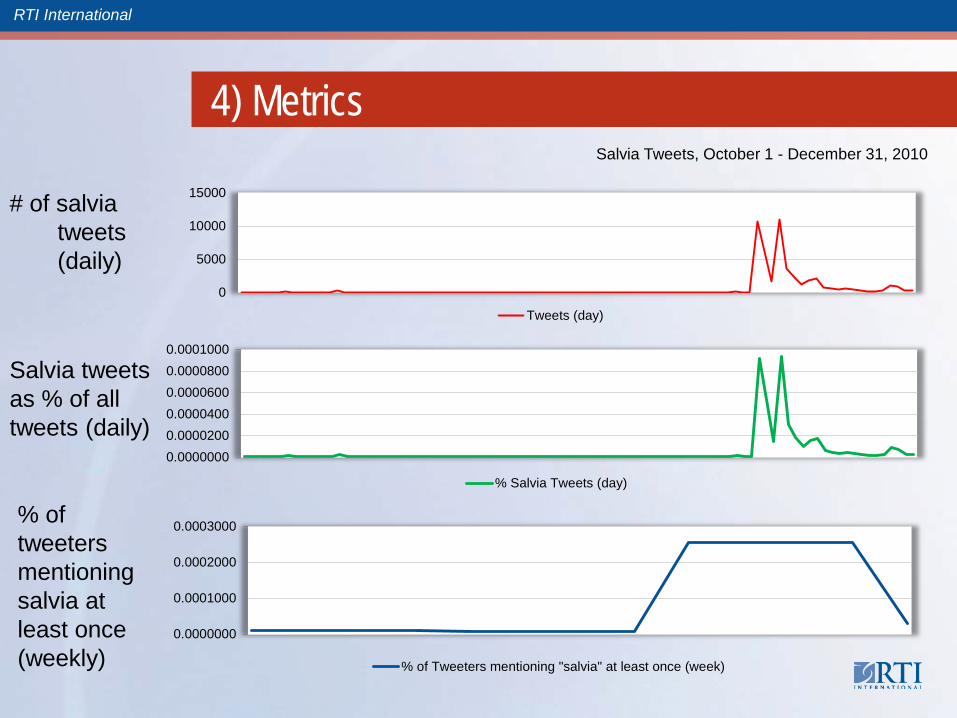
4) Metrics
# of salvia tweets (daily)
0
5000
10000
15000
Salvia Tweets, October 1 - December 31, 2010
Tweets (day)
% of tweeters mentioning salvia at least once (weekly)
0.0000000
0.0001000
0.0002000
0.0003000
% of Tweeters mentioning "salvia" at least once (week)
Salvia tweets as % of all tweets (daily)
0.00000000.00002000.00004000.00006000.00008000.0001000
% Salvia Tweets (day)

RTI International
5) Time Frame/ Unit of Analysis
0.000000
0.000010
0.000020
0.000030
0.000040
0.000050
0.000060
0.000070
0.000080
0.000090
0.000100
1-M
ay-0
8
1-Ju
n-08
1-Ju
l-08
1-A
ug-0
8
1-S
ep-0
8
1-O
ct-0
8
1-N
ov-0
8
1-D
ec-0
8
1-Ja
n-09
1-Fe
b-09
1-M
ar-0
9
1-A
pr-0
9
1-M
ay-0
9
1-Ju
n-09
1-Ju
l-09
1-A
ug-0
9
1-S
ep-0
9
1-O
ct-0
9
1-N
ov-0
9
1-D
ec-0
9
1-Ja
n-10
1-Fe
b-10
1-M
ar-1
0
1-A
pr-1
0
1-M
ay-1
0
1-Ju
n-10
1-Ju
l-10
1-A
ug-1
0
1-S
ep-1
0
1-O
ct-1
0
1-N
ov-1
0
1-D
ec-1
0
% Salvia Tweets (day) May 1, 2008 - December 31, 2010
% Salvia Tweets

RTI International
5) Time Frame/ Unit of Analysis (cont)
0.00000000.00000500.00001000.00001500.00002000.00002500.00003000.0000350
3-O
ct
10-O
ct
17-O
ct
24-O
ct
31-O
ct
7-N
ov
14-N
ov
21-N
ov
28-N
ov
5-D
ec
12-D
ec
19-D
ec
26-D
ec
% Salvia Tweets (week)
0.0000000
0.0000200
0.0000400
0.0000600
0.0000800
0.00010001-
Oct
8-O
ct
15-O
ct
22-O
ct
29-O
ct
5-N
ov
12-N
ov
19-N
ov
26-N
ov
3-D
ec
10-D
ec
17-D
ec
24-D
ec
31-D
ec
% Salvia Tweets (day)
RTI International
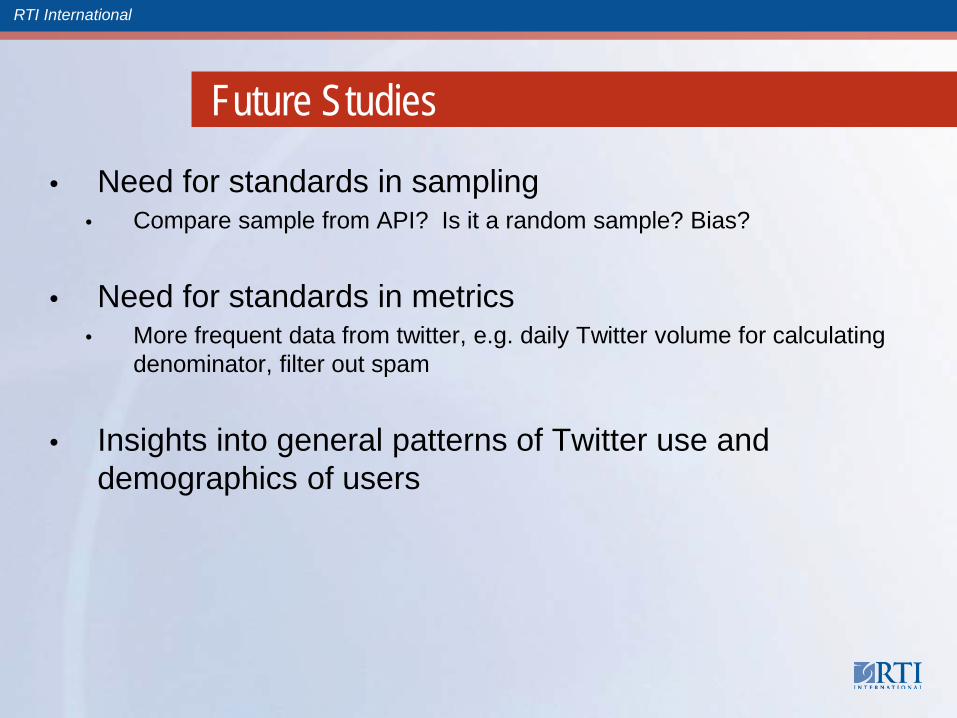
Future Studies
• Need for standards in sampling • Compare sample from API? Is it a random sample? Bias?
• Need for standards in metrics • More frequent data from twitter, e.g. daily Twitter volume for calculating
denominator, filter out spam
• Insights into general patterns of Twitter use and demographics of users
RTI International
More Information
Annice Kim RTI International - RTP 919.316.3972 [email protected]
Heather Hansen RTI International – D.C. 202.728.2043 [email protected] Joe Murphy RTI International - Chicago 312.456.5261 [email protected]
RTI International
RTI International is a trade name of Research Triangle Institute. www.rti.org
Can automated sentiment analysis of Twitter
data replace human coding?
Annice Kim, Ashley Richards, Joe Murphy, Adam Sage, Heather Hansen
Presentation at AAPOR Annual Conference, May 2012, Orlando, FL.

RTI International
Comparison of tools used
SPSS Text Analytics Software
Method Dictionary-based Dictionary-based Customizable dictionary
Customizable None Moderate High
Time Instant, part of dashboard
Nearly instant, plus time to refine
Minutes to hours
Cost Cost for dashboard access, keyword
Free for < 1000 Tweets; $0.15/Tweet, minimum of $150
Thousands of dollars; one price for unlimited # of Tweets
Volume Unlimited Unlimited ~50k tweets
Difficulty Easy Moderate High
RTI International
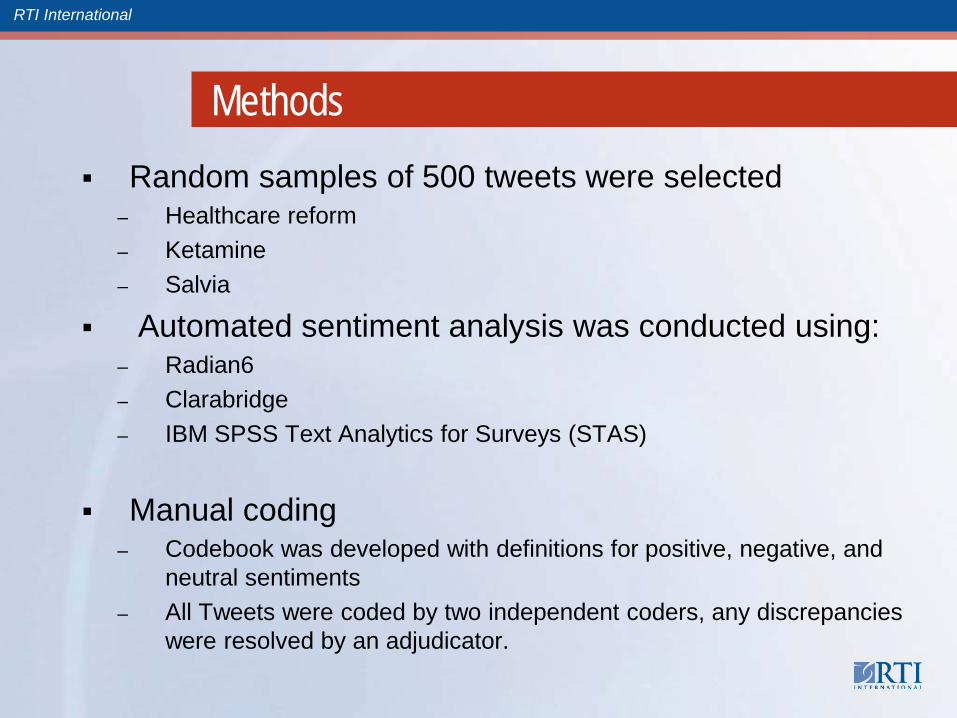
Methods Random samples of 500 tweets were selected
– Healthcare reform – Ketamine – Salvia
Automated sentiment analysis was conducted using: – Radian6 – Clarabridge – IBM SPSS Text Analytics for Surveys (STAS)
Manual coding – Codebook was developed with definitions for positive, negative, and
neutral sentiments – All Tweets were coded by two independent coders, any discrepancies
were resolved by an adjudicator.
RTI International
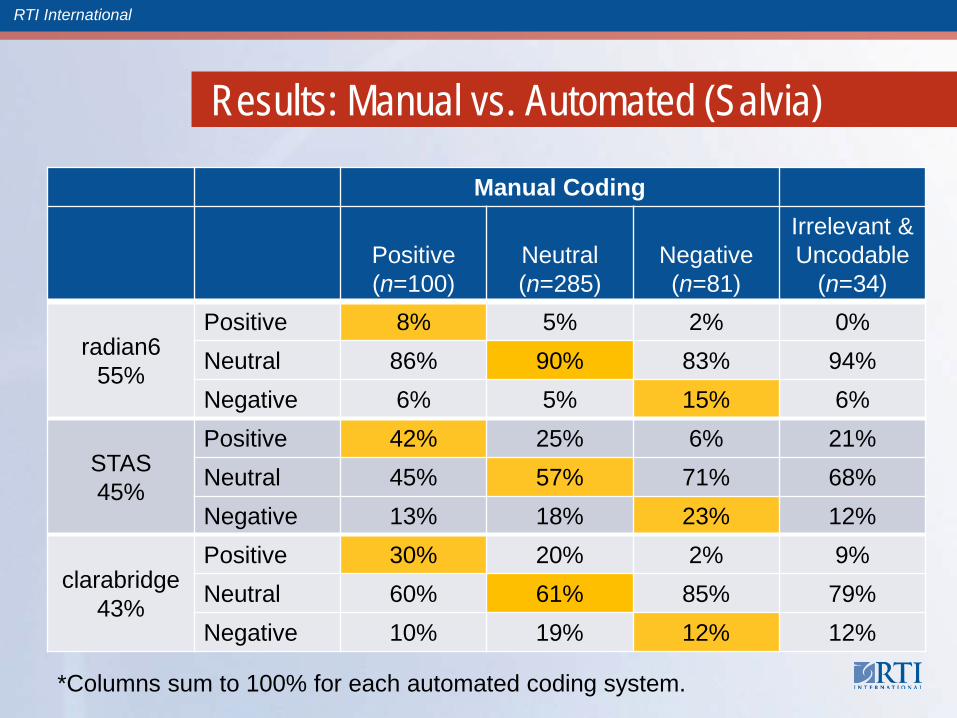
Results: Manual vs. Automated (Salvia)
Manual Coding
Positive (n=100)
Neutral (n=285)
Negative (n=81)
Irrelevant & Uncodable
(n=34)
radian6 55%
Positive 8% 5% 2% 0% Neutral 86% 90% 83% 94% Negative 6% 5% 15% 6%
STAS 45%
Positive 42% 25% 6% 21% Neutral 45% 57% 71% 68% Negative 13% 18% 23% 12%
clarabridge 43%
Positive 30% 20% 2% 9% Neutral 60% 61% 85% 79% Negative 10% 19% 12% 12%
*Columns sum to 100% for each automated coding system.

RTI International
Challenge: Sarcasm, hashtags, need existing knowledge of topic
Manual Automated RT @idillionaire: Demi's in rehab, Miley's smoking salvia, Zac Efron & Vanessa Hudgens have split. Disney has more drama than Jersey Shore.
Negative Neutral
RT @wishsong1976: RT @capflowwatch: CNN Poll: Obamacare About as Popular as Joran Van der Sloot on a Blind Date | http://capital-flow-wa ...
Negative Positive
RT @foxnews: BREAKING: President Obama signs health care reform bill into law #hcr Sh!t #politics #tcot
Negative Neutral
RT@RANKIS: Met a retired Navy Teaparty member yesterday that hates Obama care. Met at the V.A. hospital while we received our socialist health care.
Neutral Neutral
RTI International
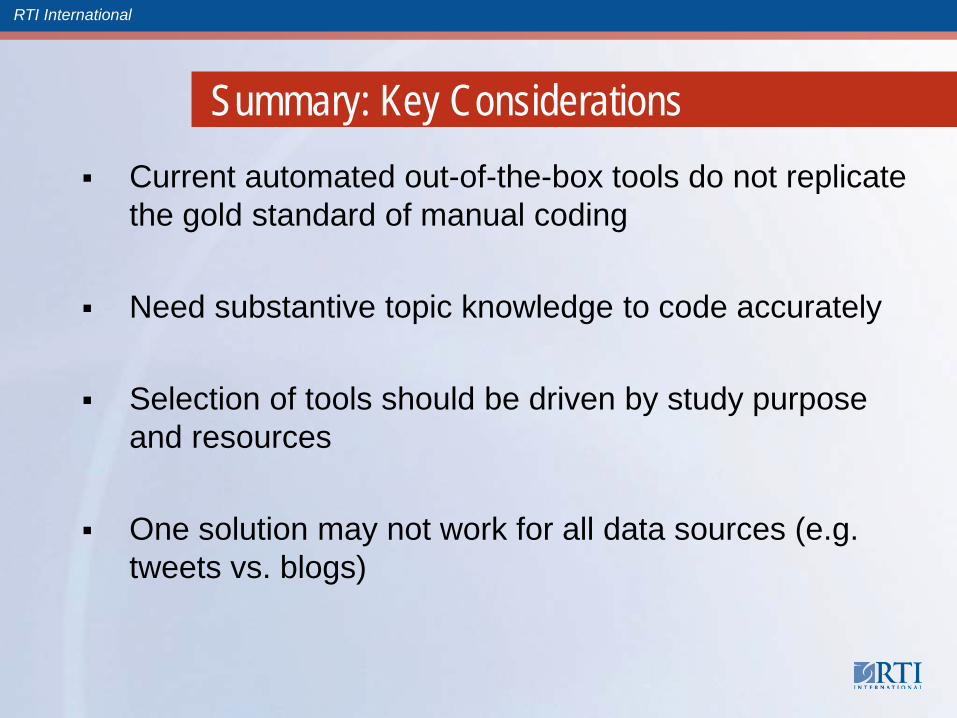
Summary: Key Considerations Current automated out-of-the-box tools do not replicate
the gold standard of manual coding
Need substantive topic knowledge to code accurately
Selection of tools should be driven by study purpose and resources
One solution may not work for all data sources (e.g. tweets vs. blogs)
RTI International
Future: CrowdSourcing?

RTI International
More Information
Annice Kim RTI International - RTP 919.316.3972 [email protected]
Ashley Richards RTI International – RTP 919.541.8050 [email protected] Joe Murphy RTI International - Chicago 312.456.5261 [email protected]
New Frontiers: Social Media Analysis
The Brave New World of Social Communication: Exploring Patterns of Opinion Dissemination in Online News Environments Kristin Runge, University of Wisconsin-Madison Dominique Brossard, University of Wisconsin-Madison Dietram A. Scheufele, University of Wisconsin-Madison If you Ask Me I Won’t Tell You, But I’ll Tell the World When I Feel Like Doing So! The Frequency of Answering a Survey About a Specific Topic vs. Posting Comments About This Same Topic on Social Media Sites Michael G. Elasmar, Boston University Appealing to the Masses: How Crowdsourcing Can Be Effectively Used as a Data Collection Tool Justin T. Bailey, The Nielsen Company Michael W. Link, The Nielsen Company
Copyright © 2011 The Nielsen Company. Confidential and proprietary.
Justin T. Bailey & Michael W. Link
Appealing to the masses: How crowdsourcing can be effectively used as a data collection tool

42
Copyright © 2011 The Nielsen Company. Confidential and proprietary.
Our crowdsourcing method
• Used in emerging/developing markets
• Augmentation of a probability-based enumeration
• Quick, cost-effective method to supplement the enumeration
• Respondents complete “mobile” crowdsourcing tasks.
43
Copyright © 2011 The Nielsen Company. Confidential and proprietary.
Mobile Crowdsourcing • Tasks that require respondent to leave
computer • Photos of store front • Collected address and other important info
• Required a photo for each entry
• Series of two pilots
• Pilot 1 – mobile app recruitment • Pilot 2 – social network recruitment
44
Copyright © 2011 The Nielsen Company. Confidential and proprietary.
Quality control method 1. Each response was tagged and coded
2. Quality score given to each photo
3. Physically checked the existence of
30% of the locations provided.
45
Copyright © 2011 The Nielsen Company. Confidential and proprietary.
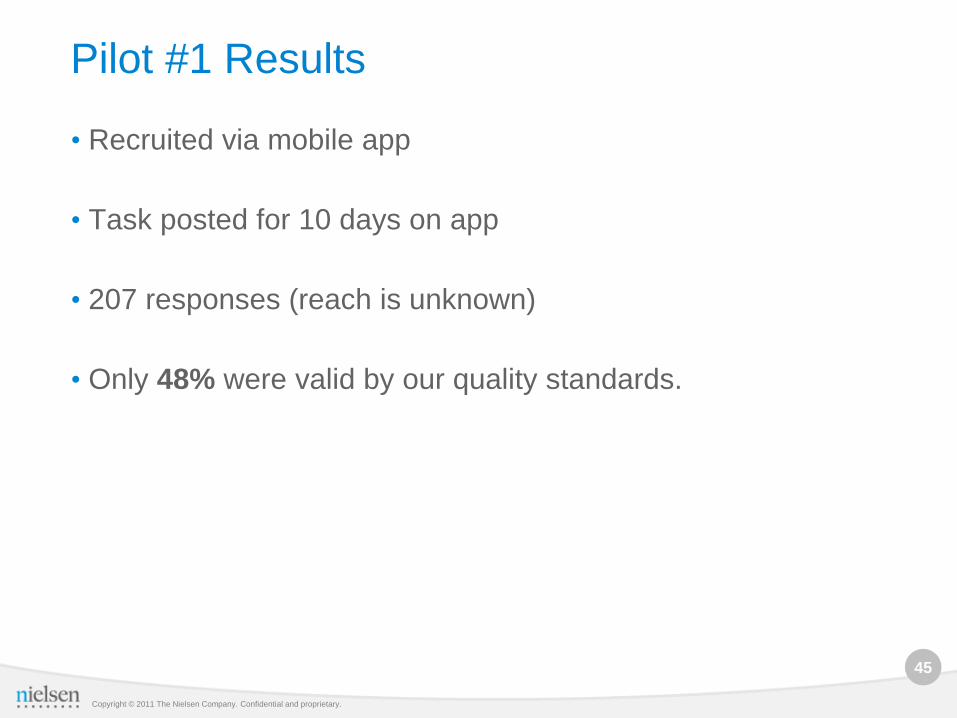
Pilot #1 Results
• Recruited via mobile app
• Task posted for 10 days on app
• 207 responses (reach is unknown)
• Only 48% were valid by our quality standards.
46
Copyright © 2011 The Nielsen Company. Confidential and proprietary.
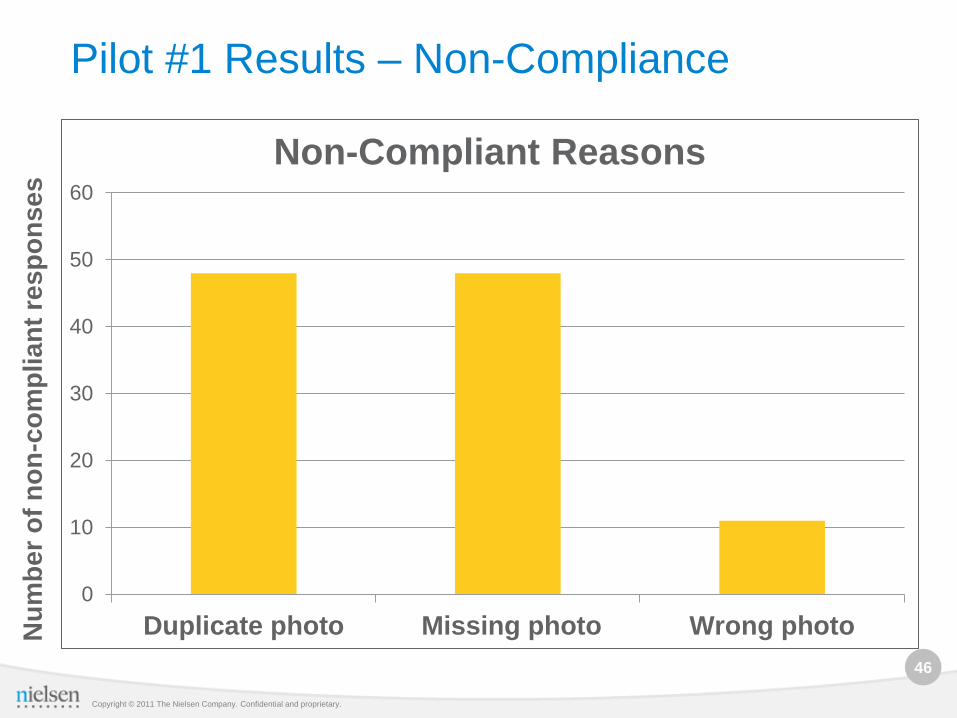
Pilot #1 Results – Non-Compliance
0
10
20
30
40
50
60
Duplicate photo Missing photo Wrong photo
Non-Compliant Reasons
Num
ber o
f non
-com
plia
nt re
spon
ses

47
Copyright © 2011 The Nielsen Company. Confidential and proprietary.
Pilot #1 Results – Photo Quality Ratings
7%
11%
7%
25%
50%
Photo Quality
Unusable
Poor
Average
Good
Excellent
83% were usable based on our coding
48
Copyright © 2011 The Nielsen Company. Confidential and proprietary.
Pilot #1 – Physical Store checks
•Only able to check 23% of stores – Others did not provide full address
•Of the 23%, only half of the stores were found at the address provided
•Our validation process revealed highly unreliable data in Pilot 1.

49
Copyright © 2011 The Nielsen Company. Confidential and proprietary.
Pilot #2 - Methodology
Similar quality control process to Pilot #1
Recruited on China Weibo (microblog)
Posted tasks to “Event” page on Weibo site
3 tasks, each 2 weeks in duration
Photograph specific store type
50
Copyright © 2011 The Nielsen Company. Confidential and proprietary.
Pilot #2 - Methodology
Asked respondents to provide full store address
Limited types of data we collected to factual
info only
Added in gamification

51
Copyright © 2011 The Nielsen Company. Confidential and proprietary.
Pilot #2 – Results Event Cosmetics Liquor
Stores Baby Stores Total
Total Responses 141 184 797 1122 Unique Respondents 102 86 200 388 % of compliant entries 82.3% 92.3% 82.3% 84.0% Average Photo Quality* 3.84 3.92 3.07 3.32 Full address provided 92.6% 97.1% 89.6% 91.1% % of total usable entries 79.4 91.3 74.8 78.1 *Out of a possible 4

52
Copyright © 2011 The Nielsen Company. Confidential and proprietary.
Pilot #2 – Results
From Pilot 1 to Pilot 2 …. • Improved reliability of responses by:
– Switching modes of recruitment • Mobile phones are used differently in China
– Creating unambiguous tasks • People were unclear what to do/how to upload
– Adding gamification
• Matched 80% of the store addresses and names.

53
Copyright © 2011 The Nielsen Company. Confidential and proprietary.
Next Steps • Further developing the crowdsourced
respondents • Require “practice task” • Introduce real-time training component • Include additional gamification (leveling-up,
badges, etc.) • Create scores for each respondent
• Catch/Recatch methodology