internship project report,predictive modelling
DESCRIPTION
TRANSCRIPT

Digit Recognizer (Machine Learning)
Internship Project Report
Submitted to:
Persistent System Limited
Product Engineering Unit-1 for Data Mining, Pune
Submitted By:-
Amit Kumar
PGPBA Praxis Business School, Kolkata
Project Mentor:-Mr. Yogesh Badhe
(Technical Specialist, Product Engineering Unit-1)
Start Date of Internship: 16th July 2012
End date of Internship: 15th October 2012
Report Date: 15th October 2012

Preface
This report documents is the work done during the summer internship at Persistent System Limited, Pune on the classify handwritten digits, under the supervision of Mr. Yohesh Badhe. The report will give an overview of the tasks completed during the period of internship with technical details. Then the results obtained are discussed and analyzed. I have tried my best to keep report simple yet technically correct. I hope I succeed in my attempt. Amit Kumar

ACKNOWLEDGEMENT
Simply, I could not have done this work without the lots of help I received cheerfully from Data Mining Team. The work culture in Persistent System Limited is really motivates.Everybody is such a friendly and cheerful companion here that work stress is never comes in way. I would specially like to thank Mr. Mukund Deshpande who gave me this project to learn and understand the business implication of statistical algorithm. Once again I would be thankful to Mr. Yogesh Badhe who helped me from the understanding of the project to the building the statistical model. He not only advised me in the project, but listened my arguments in our discussion. I am also very thankful to Ms. Deepti Takale who helped me lot to absorb the statistical concepts.
Amit Kumar

Abstract
The report presents the three tasks completed during summer internship at Persistent System Limited Which are listed below: 1. Understand of the Problem objective & business implication 2. Understanding the data & build the model 3. Evaluation of the model All these tasks have been completed successfully and results were according to Expectations. All the tasks were need very systematic approach, starting from the behavior of the data to the application of the algorithm and till evaluation of the model. The most challenging task was the domain knowledge, to understand the behavior of the data. Once the data has been prepared, we applied statistical algorithm for model building. It is one of the major area and really need very fundamental and conceptual knowledge of Advanced Statistics. Amit Kumar
Introduction:- This project is taken from kaggle. It is a platform for predictive modeling and Analytics
competitions. Here organization and researchers post the data. Statisticians and data scientist from all
over the world compete to produce the best models.
Problem Statement:- There is a image of hand written digit and each image is 28pixels in height & 28 pixels
in width, for a total of 784 pixels. Each pixel has a single pixel value associated with it, indicating the lightness
or darkness of that pixel, with higher meaning darker. The pixel value is an integer between 0 and 255,
inclusive. Each pixel column in the training set has a name like pixelx, where x is an integer between 0 and
783, inclusive. To locate this pixel on the image, suppose that we have decomposed x as x = i * 28 + j, where i
and j are integers between 0 and 27, inclusive. Then pixelx is located on row i and column j of a 28 x 28 matrix, (indexing by zero).
Goal of the Competition:- take an image of a handwritten single digit, and determine what that digit is?
Approach for the model building:-
Develop the Analysis Plan:- For the conceptual model establishment, we need to understand the selected
techniques and model implementation issue. Here we will establish predictive model, which will be in based
on random forest algorithm. This will our model consideration based upon sample size and required type of
variable(metric versus nonmetric).
Evaluation of Underlying techniques:-Since all multivariate techniques rely on underlying assumption, both
statistical & conceptual, that substantially affect their ability to represent multivariate relationships. For the
techniques based on the statistical inference, the assumptions of the multivariate normality, linearity,
independence of the error term, and equality of variance in a dependence relationship must all be met. Since
our data is categorical so we do not need to identify the linearity or any independence relation.
Estimate the Model and Assess Overall Model Fit:- With the assumption satisfied, the analysis proceeds to
the actual estimation of the model and assessment of overall model fit. In the estimation process we can
choose option to meet specific characteristics of the data or to maximize the fit of data. After the model is
estimated, the overall model fit is evaluated to ascertain whether it achieves acceptable levels on statistical
criteria. Many times, the model will be specified in an attempt to better level of overall fit or explanation.
Interpret the variate:- With the acceptable level of model fit, interpreting the variate reveals the nature of
relationship. The interpretation of effects for individual variables is made by examining the estimated weight
for each variable in the variate.
Validate the Model:-Before accepting the results, we must subject them to one final set of diagnostic
analyses that assess the degree of generalization of the results by the available validation methods. The
attempt to validate the model is directed towards demonstrating the generalization of the results to the total
population. These diagnostic analyses add little to the interpretation of the results but can be viewed as
insurance that the results are the most descriptive of the data.
Required statistical concepts for this project:-
Data Mining:-In another words we say it Knowledge Discovery in Database. It is a field at the interaction
of computer science and statistics to attempt to discover the pattern in large data set. It utilize
methods at the intersection of artificial intelligence , machine learning, statistics and database system.
The overall goal of the data mining process is to extract information from a data set and transform it
into an understandable structure for future use.
Decision Tree:- Decision tree can be used to predict a pattern or to classify the class of a data. It is commonly used in data mining. The goal to use the decision tree algorithm is to create the model that predict the target variable based upon the several input variables. In decision tree each leaf represents a value of target variable given the value of input variables represented by the path from the root of the leaf. A tree can be learned by splitting the source set into the subset based on an attribute value test. This process repeated in each derived subset called recursive. The general fashion for tree is top down induction.
Decision tree used in data mining are of two main types:-
1. Classification Tree:- When the predicted outcome is the class to which the data belongs. 2. Regression Tree:- When the predicted outcome can be consider a real number.
The term classification & regression tree(CART) analysis is an umbrella term used to refer to both of the above procedure.
Some other techniques constructs more than one decision tree like, Bagging, Random Forest, Boosted tree etc. We have used Random Forest decision tree for this project. The algorithm that are used for constructing decision trees usually work top-down by choosing a variable at each step, that is next best variable to use in splitting the set of variables. “Best” is defined by how well the variable splits the set into homogeneous subsets that have the same value as target variable. Different algorithm use different formulae for measuring “Best”.
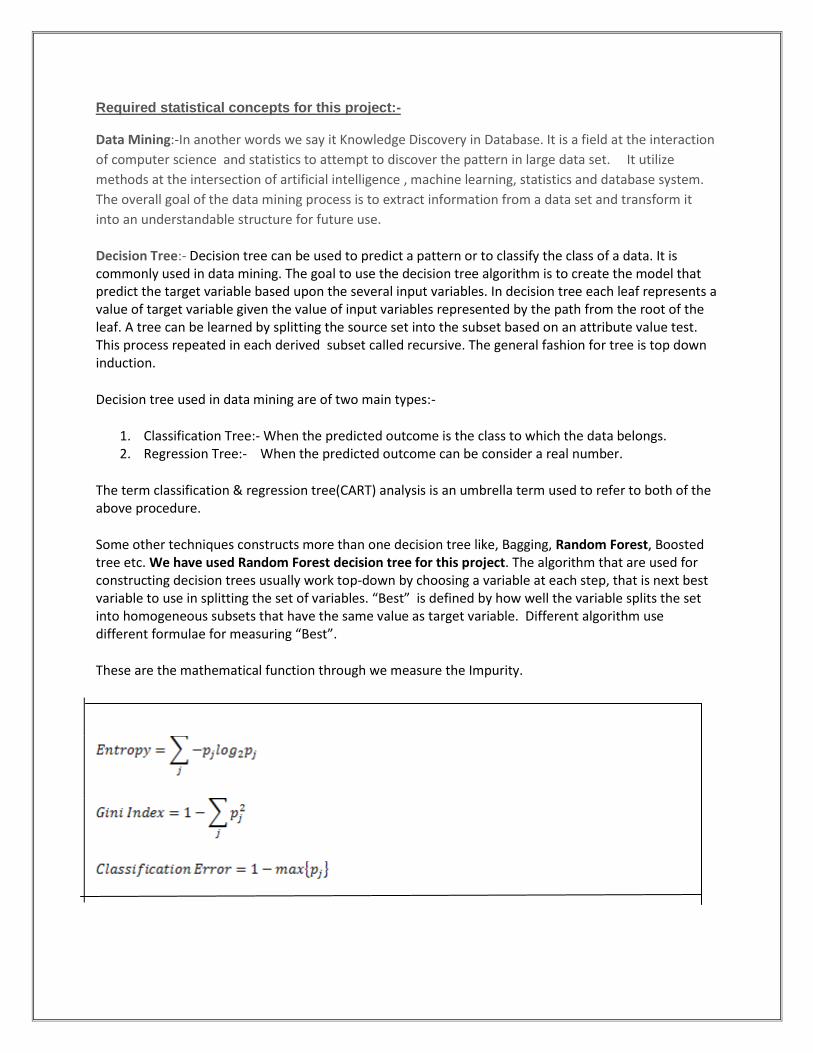
These are the mathematical function through we measure the Impurity.

Random Forest:- Recently lot of interest in “ensemble learning” methods that generates many classifier and aggregates their results. Two well-known methods are Boosting & bagging of classification trees. In
Boosting Successive tree give extra weight to points incorrectly predicted by earlier predictor. In the End, a weighted vote is taken for prediction. In bagging, successive trees do not depend on earlier trees each is independently constructed using a bootstrap sample of the data set. In the end, a simple majority vote is taken for prediction. Breiman (2001) proposed random forests, which add an additional layer of randomness to bagging. In addition to constructing each tree using a different bootstrap sample of the data, random forests change how the classification or regression trees are constructed. In standard trees, each node is split using the best split among all variables. In a random forest, each node is split using the best among a subset of predictors randomly chosen at that node. This somewhat counterintuitive strategy turns out to perform Very well compared to many other classifiers, including discriminant analysis, support vector machines and neural networks, and is robust against over fitting. In addition, it is very user-friendly in the sense that it has only two parameters (the number of variables in the random subset at each node and the number of trees in the forest), and is usually not very sensitive to their value. The algorithm:- The random forests algorithm (for both classification and regression) is as follows: 1. Draw ntree bootstrap samples from the original data. 2. For each of the bootstrap samples, grow an unpruned classification or regression tree, with the following modification: at each node, rather than choosing the best split among all predictors, randomly sample mtry of the predictors and choose the best split from among those Variables. (Bagging can be thought of as the special case of random forests obtained when mtry = p, the number of predictors.) 3. Predict new data by aggregating the predictions of the ntree trees (i.e., majority votes for Classification, Average for regression). An estimate of the error rate can be obtained, based on the training data, by the following: 1. At each bootstrap iteration, predict the data not in the bootstrap sample (what Breiman Calls “out-of-bag”, or OOB, data) using the tree grown with the bootstrap sample. 2. Aggregate the OOB predictions. (On the average, each data point would be out-of-bag around 36% of the times, so aggregate these predictions.) Calculate the error rate, and call it the OOB estimate of error rate.

Source Code:- # makes the random forest submission
library(randomForest)
train <- read.csv("../data/train.csv", header=TRUE)
test <- read.csv("../data/test.csv", header=TRUE)
labels <- as.factor(train[,1])
train <- train[,-1]
rf <- randomForest(train, labels, xtest=test, ntree=1000)
predictions <- levels(labels)[rf$test$predicted]
write(predictions, file="rf_benchmark.csv", ncolumns=1)

Solutions:--For this train data set we are taking the five random sample(20percent) and making five
different model. Since our data set is large we need to combine the respective model results to validate the
overall model accuracy.. Our approach can be vary, like we can build a model on the 80percent of the train
data and keep 20percent of the data to validate the model.
Model-1(Random Forest Algorithm,
sample=train.csv)
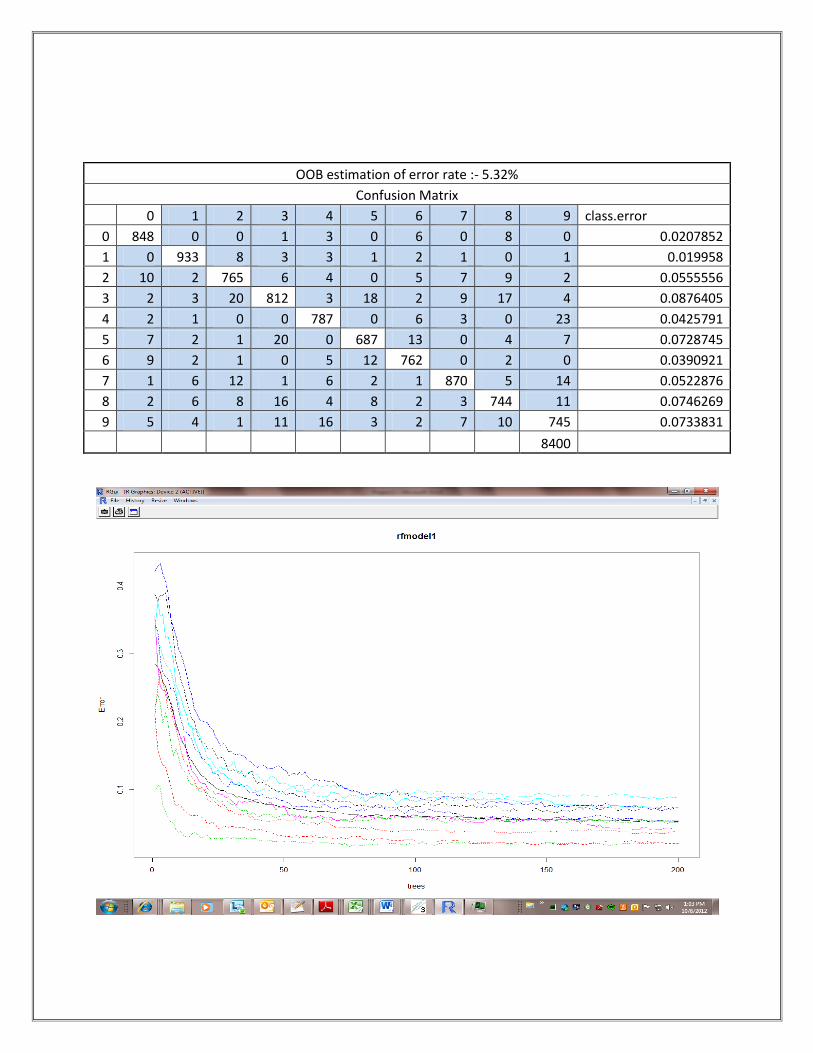
OOB estimation of error rate :- 5.32%
Confusion Matrix
0 1 2 3 4 5 6 7 8 9 class.error
0 848 0 0 1 3 0 6 0 8 0 0.0207852
1 0 933 8 3 3 1 2 1 0 1 0.019958
2 10 2 765 6 4 0 5 7 9 2 0.0555556
3 2 3 20 812 3 18 2 9 17 4 0.0876405
4 2 1 0 0 787 0 6 3 0 23 0.0425791
5 7 2 1 20 0 687 13 0 4 7 0.0728745
6 9 2 1 0 5 12 762 0 2 0 0.0390921
7 1 6 12 1 6 2 1 870 5 14 0.0522876
8 2 6 8 16 4 8 2 3 744 11 0.0746269
9 5 4 1 11 16 3 2 7 10 745 0.0733831
8400
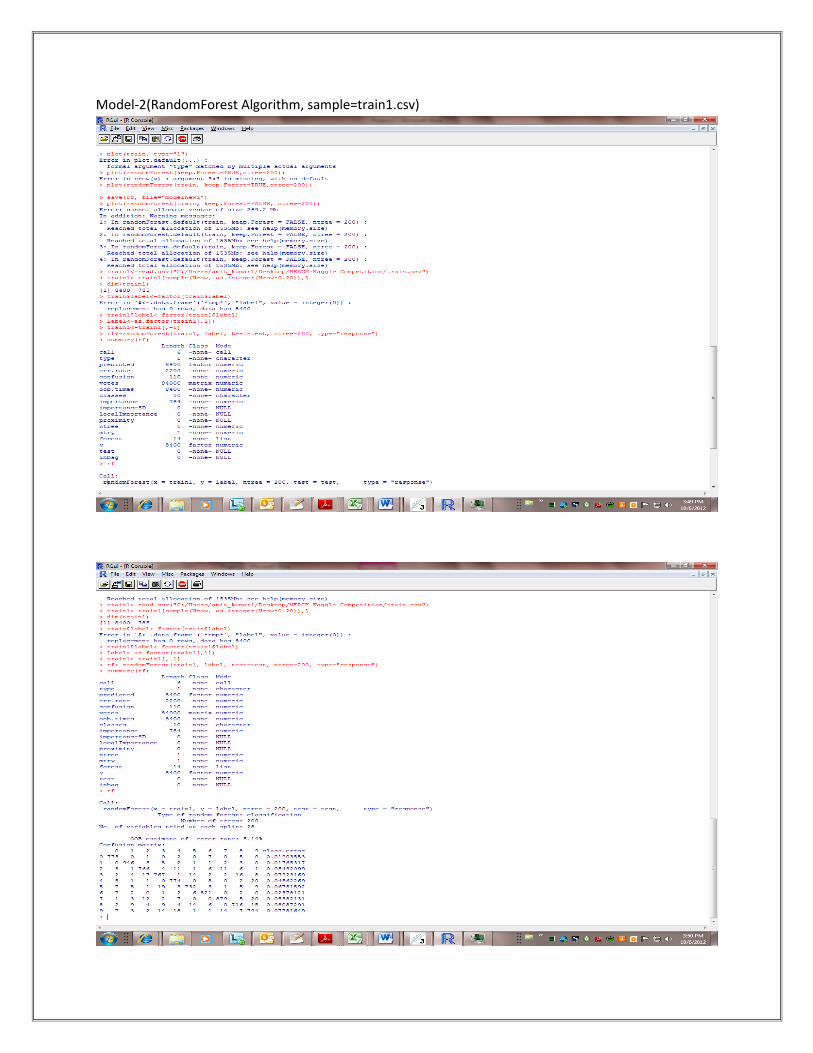
Model-2(RandomForest Algorithm, sample=train1.csv)
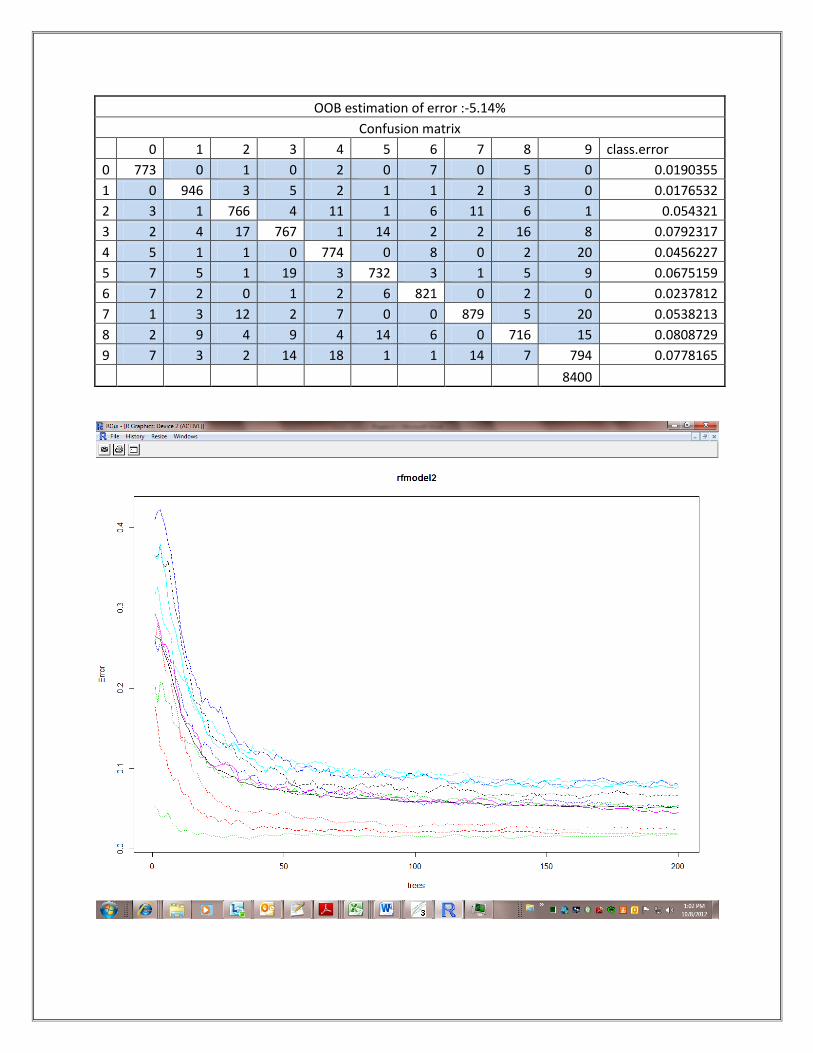
OOB estimation of error :-5.14%
Confusion matrix
0 1 2 3 4 5 6 7 8 9 class.error
0 773 0 1 0 2 0 7 0 5 0 0.0190355
1 0 946 3 5 2 1 1 2 3 0 0.0176532
2 3 1 766 4 11 1 6 11 6 1 0.054321
3 2 4 17 767 1 14 2 2 16 8 0.0792317
4 5 1 1 0 774 0 8 0 2 20 0.0456227
5 7 5 1 19 3 732 3 1 5 9 0.0675159
6 7 2 0 1 2 6 821 0 2 0 0.0237812
7 1 3 12 2 7 0 0 879 5 20 0.0538213
8 2 9 4 9 4 14 6 0 716 15 0.0808729
9 7 3 2 14 18 1 1 14 7 794 0.0778165
8400

Model-3(RandomForest Algorithm , sample=train2.csv)

OOB estimation of error:-5.63%
Confusion matrix
0 1 2 3 4 5 6 7 8 9 class.error
0 864 0 2 0 1 1 4 0 7 1 0.0181818
1 0 896 6 2 4 2 1 3 4 2 0.026087
2 6 4 810 6 8 2 8 11 5 0 0.0581395
3 5 3 18 788 1 14 3 11 18 5 0.0900693
4 3 3 3 1 714 2 4 2 5 21 0.0580475
5 7 3 0 18 2 709 9 1 6 4 0.0658762
6 7 2 0 0 4 9 790 0 3 0 0.0306749
7 1 7 11 0 6 0 0 838 3 24 0.058427
8 4 11 5 18 4 9 3 3 745 13 0.0858896
9 8 5 2 14 14 2 0 10 9 773 0.0764636
8400

Model 4:- (RandomForest Algorithm Used)
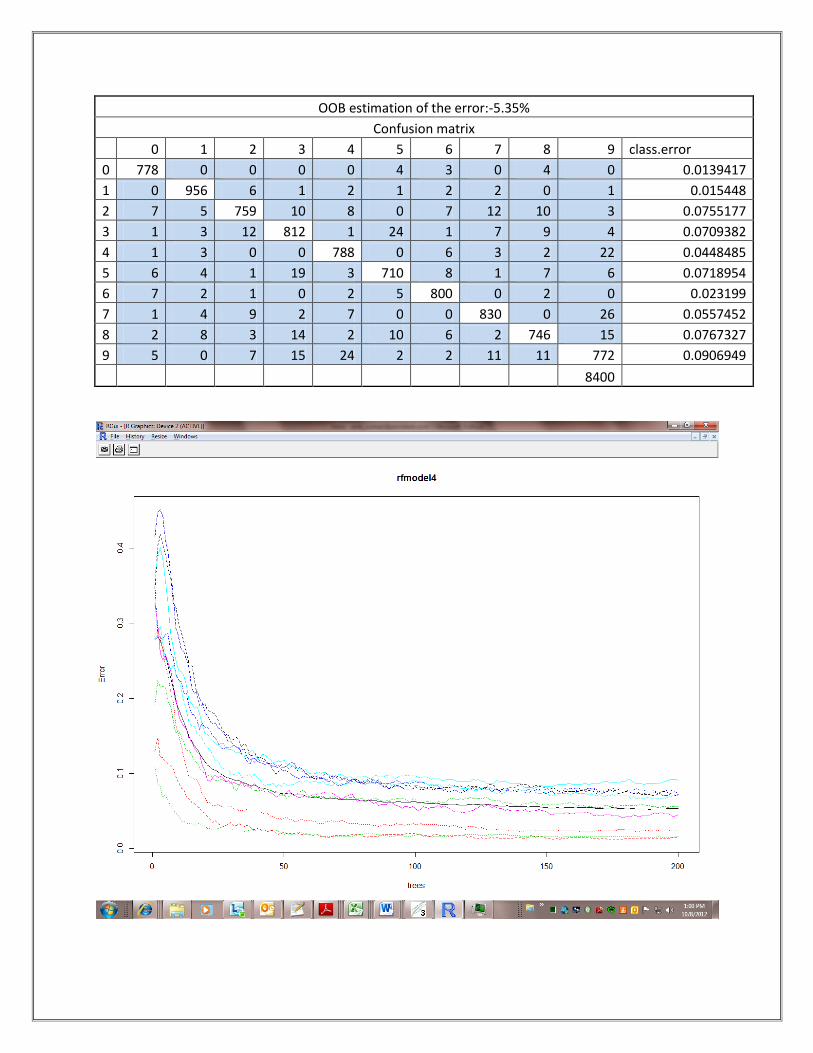
OOB estimation of the error:-5.35%
Confusion matrix
0 1 2 3 4 5 6 7 8 9 class.error
0 778 0 0 0 0 4 3 0 4 0 0.0139417
1 0 956 6 1 2 1 2 2 0 1 0.015448
2 7 5 759 10 8 0 7 12 10 3 0.0755177
3 1 3 12 812 1 24 1 7 9 4 0.0709382
4 1 3 0 0 788 0 6 3 2 22 0.0448485
5 6 4 1 19 3 710 8 1 7 6 0.0718954
6 7 2 1 0 2 5 800 0 2 0 0.023199
7 1 4 9 2 7 0 0 830 0 26 0.0557452
8 2 8 3 14 2 10 6 2 746 15 0.0767327
9 5 0 7 15 24 2 2 11 11 772 0.0906949
8400

Model 5:-(RandomForest Algorithm Used)

OOB estimation of the error:-5.30%
Confusion matrix
0 1 2 3 4 5 6 7 8 9 class.error
0 782 0 0 1 1 1 4 1 5 1 0.0175879
1 0 927 5 5 1 2 3 1 1 1 0.0200846
2 6 1 802 8 6 0 5 14 5 3 0.0564706
3 1 2 9 815 2 20 2 9 11 7 0.071754
4 1 3 1 0 776 0 12 2 5 21 0.0548112
5 6 4 2 12 4 696 10 0 5 6 0.0657718
6 6 1 5 0 3 8 796 0 2 0 0.0304507
7 1 9 14 1 7 1 0 825 4 8 0.0517241
8 0 8 11 15 8 11 7 0 727 17 0.0957711
9 5 2 0 12 12 4 1 11 13 809 0.0690449
8400

Model Validation:-
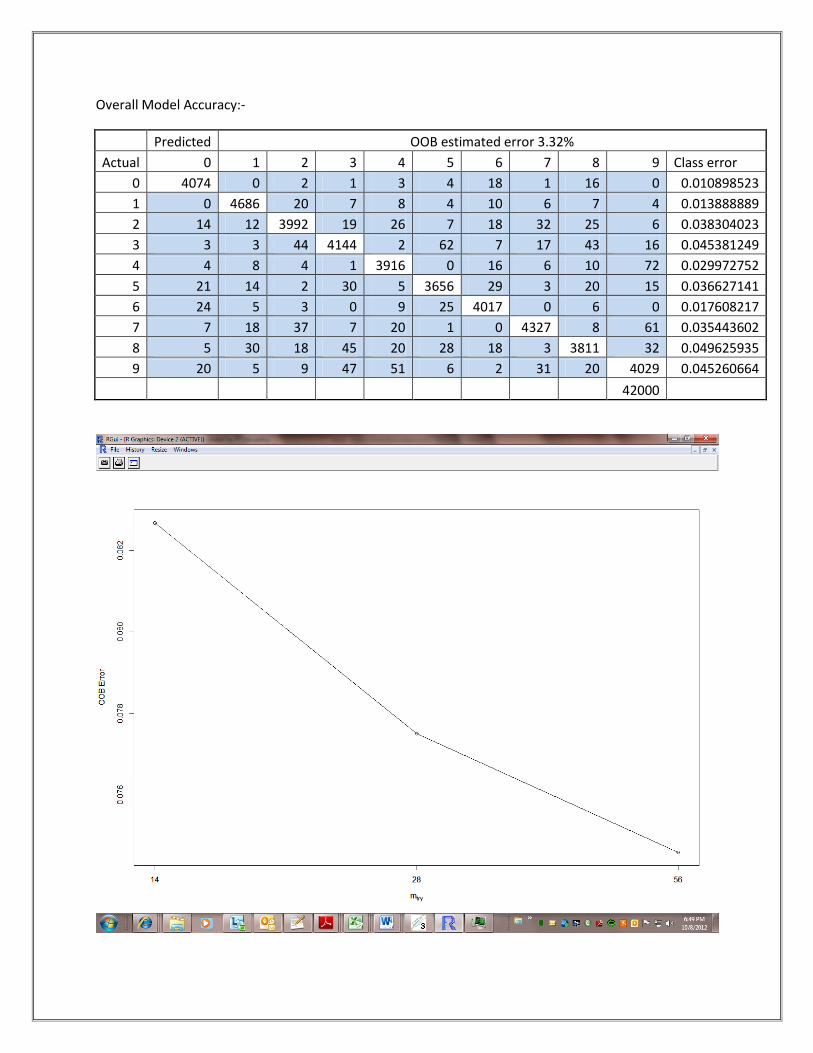
Overall Model Accuracy:-
Predicted OOB estimated error 3.32%
Actual 0 1 2 3 4 5 6 7 8 9 Class error
0 4074 0 2 1 3 4 18 1 16 0 0.010898523
1 0 4686 20 7 8 4 10 6 7 4 0.013888889
2 14 12 3992 19 26 7 18 32 25 6 0.038304023
3 3 3 44 4144 2 62 7 17 43 16 0.045381249
4 4 8 4 1 3916 0 16 6 10 72 0.029972752
5 21 14 2 30 5 3656 29 3 20 15 0.036627141
6 24 5 3 0 9 25 4017 0 6 0 0.017608217
7 7 18 37 7 20 1 0 4327 8 61 0.035443602
8 5 30 18 45 20 28 18 3 3811 32 0.049625935
9 20 5 9 47 51 6 2 31 20 4029 0.045260664
42000

Interpretation of the Model:-
The prediction of model in the test data set taken as the collective results of all the five model and the
weighted average taken to determine the best fit of result. Based upon the confusion matrix and
recursive pattern of data set to build the model is show that the average confidence is .954. Here we
have avoided over fitting because in the Random Forest algorithm data taken to build the model is
random & unbiased. Here the interesting thing is Random Forest can handle missing values and it
doesn’t require the pruning. In random Forest roughly 30-35% of the samples are not selected in
bootstrap, which we call as (OOB) sample. Using OOB sample as input to the corresponding tree,
predictions are made.
Bibliography:-
Multivariate Data Analysis by:- Hair black & tatham
http://www.webchem.science.ru.nl:8080/PRiNS/rF.pdf
http://people.revoledu.com/kardi/tutorial/DecisionTree/index.html
http://www.statmethods.net/interface/workspace.html