interplay of dissolution, solubility and non-sink
TRANSCRIPT

DMD #32680
1
Interplay of Dissolution, Solubility and Non-Sink Permeation
Determines the Oral Absorption of the Hedgehog Pathway
Inhibitor, GDC-0449, in Dogs: An Investigation using Preclinical
Studies and Physiologically- Based Pharmacokinetic Modeling
Harvey Wong1, Frank-Peter Theil, Yong Cui, James C. Marsters Jr., S. Cyrus Khojasteh, Laurent
Vernillet, Hank La, Xiling Song, Hong Wang, Eric J. Morinello, Yuzhong Deng, and Cornelis E.C.A.
Hop.
Departments of Drug Metabolism and Pharmacokinetics (Harvey W, SCK, HL, YD,
CECAH), Pharmacokinetic and Pharmacodynamic Sciences (FPT, LV), Exploratory Clinical
Development (JCM Jr.) and Pharmaceutics (YC, XS), Non-Clinical Safety Assessment (Hong
W, EJM), Genentech, Inc., South San Francisco, CA, USA
DMD Fast Forward. Published on April 20, 2010 as doi:10.1124/dmd.110.032680
Copyright 2010 by the American Society for Pharmacology and Experimental Therapeutics.
This article has not been copyedited and formatted. The final version may differ from this version.DMD Fast Forward. Published on April 20, 2010 as DOI: 10.1124/dmd.110.032680
at ASPE
T Journals on D
ecember 23, 2021
dmd.aspetjournals.org
Dow
nloaded from
DMD #32680
2
RUNNING TITLE: PBPK Modeling of GDC-0449
Author to whom correspondence should be addressed:
Harvey Wong, PhD Drug Metabolism and Pharmacokinetics Genentech, Inc. 1 DNA Way, MS 412a South San Francisco, CA 94080 Phone: 650-225-5739 Fax: 650-467-3487 E-mail: [email protected]
Number of pages: 40
Number of Tables: 4
Number of Figures: 10
Number of References: 28
Number of Words in Abstract: 232
Introduction: 507
Discussion: 1446
List of abbreviations: AUC0-∞: Area under the plasma concentration-time profile
extrapolated to infinity; AUC0-24: Area under the plasma concentration-time profile from
time 0 to 24 hours post-dose; AUC0-168: Area under the plasma concentration-time profile
from time 0 to 168 hours post-dose; Cmax: highest observed plasma concentration; CL:
plasma clearance; CLbiliary: biliary clearance; IV: intravenous; PO: oral; t1/2: half-life; tmax:
time at which Cmax is observed; Vss: Volume of distribution at steady-state.
This article has not been copyedited and formatted. The final version may differ from this version.DMD Fast Forward. Published on April 20, 2010 as DOI: 10.1124/dmd.110.032680
at ASPE
T Journals on D
ecember 23, 2021
dmd.aspetjournals.org
Dow
nloaded from
DMD #32680
3
ABSTRACT
Factors determining the pharmacokinetics of GDC-0449 (2-chloro-N-(4-chloro-3-(pyridine-2-
yl)phenyl)-4-(methylsulfonyl)benzamide) were investigated using preclinical studies and
physiologically-based pharmacokinetic (PBPK) modeling. Multiple dose studies where dogs
were given twice daily oral (PO) doses of either 7.5 mg/kg or 25 mg/kg GDC-0449 showed less
than dose proportional increases in exposure on Day 1. At steady-state, exposures were
comparable between the two dose groups. Oral administration of activated charcoal to dogs
receiving PO or intravenous (IV) GDC-0449 (25 mg) showed a more rapid decrease in plasma
concentrations suggesting that the concentration gradient driving intestinal membrane
permeation was reversible. The biliary clearance of GDC-0449 in dogs was low (0.04
ml/min/kg) and did not account for the majority of the estimated systemic clearance (~ 19% of
systemic clearance). Similarly, in vitro studies using sandwich-cultured human hepatocytes
showed negligible biliary excretion. The effect of particle size on oral absorption was
demonstrated in a single dose study where 150 mg of GDC-0449 of two particle sizes was
administered. An oral PBPK model was used to investigate mechanisms determining the oral
pharmacokinetics of GDC-0449. The overall oral absorption of GDC-0449 appears dependent
on the interplay between the dissolution and intestinal membrane permeation processes. A
unique feature of GDC-0449 distinguishing it from other Biopharmaceutics Classification
System II compounds was that incorporation of the effects of solubility rate-limited absorption
and non-sink permeation on the intestinal membrane permeation process was necessary to
describe its pharmacokinetic behavior.
This article has not been copyedited and formatted. The final version may differ from this version.DMD Fast Forward. Published on April 20, 2010 as DOI: 10.1124/dmd.110.032680
at ASPE
T Journals on D
ecember 23, 2021
dmd.aspetjournals.org
Dow
nloaded from
DMD #32680
4
INTRODUCTION
The hedgehog (Hh) signaling pathway regulates proliferation and differentiation during
embryogenesis. Hh ligands bind to Patched (PTCH1), a transmembrane protein on target
cells. In the absence of Hh, the role of PTCH1 is to inhibit the activity of Smoothened
(SMO), a seven-transmembrane protein that serves as the signaling component of the
pathway. Binding of Hh proteins to PTCH1 relieves this inhibition and initiates
activation of SMO. The increase in SMO activity causes increases in activated forms of
Gli, transcriptional factors which serve to regulate the expression of Hh target genes.
Activation of the Hh pathway has been implicated in a number of cancers (Scales and de
Sauvage, 2009). Mutations in the Hh receptor components, PTCH1 or SMO, result in
constitutive pathway activation and have been identified in basal cell carcinoma (Hahn et
al., 1996; Johnson et al., 1996) and medulloblastoma (Pietsch et al., 1997; Raffel et al.,
1997; Vorechovsky et al., 1997). It has also been observed that aberrant Hh ligand
production can contribute to the growth of other tumor types such as colorectal and
pancreatic cancer (Yauch et al., 2008), prostate cancer (Fan et al., 2004), and B cell
lymphoma (Dierks et al., 2007) through paracrine activation of the Hh pathway.
Paracrine signaling typically involves ligand expressed on the cancer cells signaling
adjacent stromal components in the case of solid tumors, or signaling from stromally
produced Hh ligand to cancer cells in the case of hematopoietic cancers. The growing
scientific data associating Hh signaling pathway activation with certain types of cancers
has made this pathway an attractive target for the development of selective small
molecule inhibitors.
This article has not been copyedited and formatted. The final version may differ from this version.DMD Fast Forward. Published on April 20, 2010 as DOI: 10.1124/dmd.110.032680
at ASPE
T Journals on D
ecember 23, 2021
dmd.aspetjournals.org
Dow
nloaded from

DMD #32680
5
GDC-0449, 2-chloro-N-(4-chloro-3-(pyridin-2-yl)phenyl)-4-
(methylsulfonyl)benzamide (Figure 1) is a small molecule inhibitor of the Hh signaling
pathway currently being developed at Genentech, Inc. It inhibits Hh signaling with IC50s
of 13 and 2.8 nM in Hh responsive cell lines derived from mouse (10T1/2) and human
embryonic palatal mesenchyme cells, respectively. Hh signaling is blocked by GDC-
0449 through binding to and inhibiting SMO (Yauch et al., 2009). Previously, we
described the preclinical absorption, distribution, metabolism and excretion properties of
GDC-0449 (Wong et al., 2009). The compound exhibited low plasma clearance in
mouse, rat, and dog and moderate clearance in the monkey. These in vivo observations
were consistent with in vitro metabolic stability studies performed using hepatocytes.
Recently, the oral pharmacokinetics of GDC-0449 in humans has been described (Von
Hoff et al., 2009; Ding et al., 2010). The clinical pharmacokinetics was characterized by
remarkably high plasma exposures suggestive of a low systemic clearance. Of the
preclinical species tested, the dog exhibits characteristics most similar to humans having
the lowest plasma clearance and longest t1/2 in vivo, and showing virtually no turnover
after a 3 hour incubation with dog and human hepatocytes (Wong et al., 2009). Detailed
studies aimed at understanding the disposition of new chemical entities in humans are
often difficult to perform due to obvious ethical restrictions. Here we describe the results
of the preclinical studies and physiologically-based pharmacokinetic (PBPK) modeling
using the dog to provide insight into understanding the pharmacokinetic characteristics of
GDC-0449.
This article has not been copyedited and formatted. The final version may differ from this version.DMD Fast Forward. Published on April 20, 2010 as DOI: 10.1124/dmd.110.032680
at ASPE
T Journals on D
ecember 23, 2021
dmd.aspetjournals.org
Dow
nloaded from

DMD #32680
6
METHODS
In Vivo Pharmacokinetic Studies in Dogs
Bile-Duct Cannulated Dog Study: This study was performed to assess the role of biliary
clearance on the in vivo disposition of GDC-0449 in dogs. At study initiation, dogs used
weighed from 7.9 to 9.9 kg. Intact (n=4) and bile-duct cannulated (n=4) male beagle
dogs (Wuxi Pharmatech Co. Ltd., Shanghai, China) were given a single 25 mg IV bolus
dose of GDC 0449 (Genentech Inc., South San Francisco, CA) in 80% v/v polyethylene
glycol 400 in water. Animals were not fasted prior to dosing. Blood samples
(approximately 0.5 mL per sample) were collected from a peripheral vessel into tubes
containing potassium ethylenediaminetetraacetic acid (K2EDTA) at the following
timepoints: predose and 0.033, 0.083, 0.25, 0.5, 1, 2, 4, 8, 12, 24, 48, 72, 96, 120, 144,
and 168 hours post dose. Samples were centrifuged within 1 hour of collection. Plasma
was collected and kept frozen on dry ice before storage at approximately -70 oC. Bile
was collected from bile-duct cannulated dogs at the following time intervals: predose,
between 0 and 8 hours post dose, between 8 and 24 hours post dose, between 24 and 48
hours post dose, and between 48 and 72 hours post dose. Bile was collected into
containers cooled by wet ice and volumes for different intervals were measured and
recorded. All bile samples were stored at approximately -80oC. GDC-0449 in plasma
and bile was measured using a liquid chromatography tandem mass spectrometric method
(LC/MS/MS) (Wong et al., 2009).
This article has not been copyedited and formatted. The final version may differ from this version.DMD Fast Forward. Published on April 20, 2010 as DOI: 10.1124/dmd.110.032680
at ASPE
T Journals on D
ecember 23, 2021
dmd.aspetjournals.org
Dow
nloaded from

DMD #32680
7
Activated Charcoal Studies: The purpose of this study was to examine the effect of oral
administration of activated charcoal on the oral and intravenous pharmacokinetics of
GDC-0449 in dogs. At study initiation, dogs used weighed from 8.3 to 11.8 kg. Two
groups of male beagle dogs (n=4 per group) (Covance, Kalamazoo, MI) received a single
oral (PO) dose of GDC-0449 as a 25-mg capsule. A third group of dogs (n=4) received a
single 25-mg IV dose of GDC-0449 in 80% PEG 400 via a cephalic vein. One group of
orally dosed animals and all intravenously dosed animals received a 2 g/kg dose of
activated charcoal (Sigma-Aldrich, St. Louis, MO) as a slurry, via oral gavage, at
approximately 24, 27, 31, 36, 48, 60, 72, 84, and 96 hours following GDC-0449
administration. All animals were fasted overnight before dosing until approximately 4
hours following the GDC-0449 dose. At approximately 30 minutes before GDC-0449
administration, all animals received a single intramuscular injection of 0.024 mL/kg
pentagastrin (6 μg/kg) in the left thigh. Blood samples (approximately 3 mL per sample)
were collected from the jugular vein of each animal at the following timepoints: predose
and 0.083, 0.25, 0.5, 1, 2, 4, 8, 12, 24, 72, 96, 120, and 168 hours post-dose. All blood
samples were collected into tubes containing K2 EDTA and then chilled on ice until
centrifugation. Samples were centrifuged within 1 hour of collection. Plasma was
collected and kept frozen on dry ice before storage at approximately -70 oC.
Concentrations of GDC-0449 in plasma were quantitated by LC/MS/MS (Wong et al.,
2009).
Multiple Dose Pharmacokinetics of GDC-0449: Multiple dose oral pharmacokinetics of
GDC-0449 was obtained from toxicology studies with GDC-0449. Male beagle dogs
This article has not been copyedited and formatted. The final version may differ from this version.DMD Fast Forward. Published on April 20, 2010 as DOI: 10.1124/dmd.110.032680
at ASPE
T Journals on D
ecember 23, 2021
dmd.aspetjournals.org
Dow
nloaded from

DMD #32680
8
(Covance, Kalamazoo, MI) were given twice-daily oral doses of 7.5 mg/kg (15
mg/kg/day) or 25 mg/kg (50 mg/kg/day) of GDC 0449, respectively, for 91 days. The
two daily doses were administered 6 hours apart on each dosing day. At the initiation of
the study, dogs were at least 8 months old and weighed 7.0 to 10.7 kg. Blood samples
were collected for a 24 hour period starting after the administration of the first dose on
days 1, 44, and 90 at predose (30 minutes before the first daily dose) and at 1, 3, 5.75,
6.5, 10, and 24 hours post dose. Blood samples (approximately 1 mL each) were
collected from a jugular vein into tubes containing K2EDTA and then chilled until
centrifugation. Samples were centrifuged within 1 hour of collection. Plasma was
collected and stored frozen at approximately -60oC to -80oC. Concentrations of GDC-
0449 in plasma were quantitated using a validated LC/MS/MS method similar to one
described previously (Wong et al., 2009). Results from Day 1 and Day 44 are presented
in this manuscript as steady-state was achieved by Day 44.
Oral Formulation Comparison Study: The purpose of this study was to evaluate the
impact of alterations in compound particle size on oral exposure of GDC-0449. At the
initiation of this study, dogs weighed from 12.7 to 15.6 kg. Male beagle dogs (Covance,
Kalamazoo, MI) were given an oral 150 mg dose of GDC-0449 as a single 150 mg
capsule (n=6; smaller particle size; d(50) 21 µm) or as 25 and 125 mg capsules (n=6;
larger particle size; d(50) 120 µm). Approximately 30 minutes prior to GDC-0449
administration, animals in both groups received a single 6 µg/kg intramuscular dose of
pentagastrin (Sigma-Aldrich, St. Louis, MO) at 0.024 mL/kg. Animals were fasted
overnight prior to dosing through approximately 4 hours postdose. Blood samples
This article has not been copyedited and formatted. The final version may differ from this version.DMD Fast Forward. Published on April 20, 2010 as DOI: 10.1124/dmd.110.032680
at ASPE
T Journals on D
ecember 23, 2021
dmd.aspetjournals.org
Dow
nloaded from
DMD #32680
9
(approximately 3 mL per sample) were collected from the jugular vein of each animal at
the following timepoints: predose and 0.083, 0.25, 0.5, 1, 2, 4, 8, 12, 24, 72, 96, 120 and
168 hours postdose. All blood samples were collected into tubes containing K2EDTA
and then chilled until centrifugation. Samples were centrifuged within 1 hour of
collection. Plasma was collected and kept frozen on dry ice before storage at
approximately -70 oC. Concentrations of GDC-0449 in plasma were quantitated by
LC/MS/MS (Wong et al., 2009).
Pharmacokinetic Data Analysis
All pharmacokinetic parameters were calculated by noncompartmental methods as
described by Gilbaldi and Perrier (1982). Pharmacokinetic parameters (aside from tmax)
are reported as the mean ± SD. tmax is presented as the median along with the observed
range in parentheses.
Physiologically-Based Pharmacokinetic (PBPK) Modeling
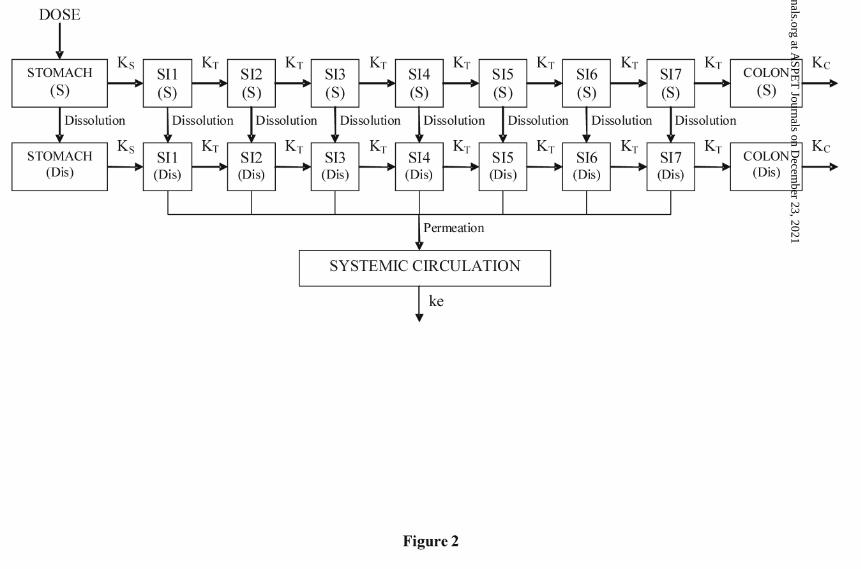
A nine intestinal segment oral absorption PBPK model was constructed in ModelMaker
Version 4.0 (Oxford, UK) based upon a modified version of the advanced compartmental
absorption and transit model (ACAT) (Agoram et al., 2001). The configuration of the
described model is shown in Figure 2. The first segment represents the stomach followed
by seven small intestine (SI) segments and the colon segment. Two compartments were
assigned for each of the nine segments representing the gastrointestinal (GI) tract and
This article has not been copyedited and formatted. The final version may differ from this version.DMD Fast Forward. Published on April 20, 2010 as DOI: 10.1124/dmd.110.032680
at ASPE
T Journals on D
ecember 23, 2021
dmd.aspetjournals.org
Dow
nloaded from
DMD #32680
10
were designated to contain either solid (S) or dissolved (Dis) drug. Rate constants
describing gastric emptying (KS), small intestine compartmental transit (KT), and colon
emptying (KC) were set 4 hr-1, 3.85 hr-1, and 0.0833 hr-1, respectively, in order to reflect
the GI transit times presented for the Beagle Model in GastroPlus (Simulations Plus, Inc.,
Lancaster, CA). Specific pH for the GI compartments were set at pH values presented
for the Beagle Model in GastroPlus as follows: SI1 – pH 6.2; SI2 – pH 6.2; SI3 – pH 6.2;
SI4 – pH 6.4; SI5 – pH 6.6; SI6 - pH 6.68; SI7 – pH 6.75; Colon – pH 6.45. The
exception was the stomach compartment which was set to be similar to human gastric pH
(pH-1.2) since our studies involved either pentagastrin pre-treated dogs or fed dogs which
have stomach pH similar to man (Sagawa et al., 2009). Solubility of the stomach
compartment was set at 0.49 mg/mL, the solubility of GDC-0449 in simulated gastric
fluid at the stomach pH. The volume in the stomach compartment was set at 450 mL.
Aside from the stomach, the volume of the lumen for each GI compartment was
calculated using following equation: Vlumen = πLR2, where L is the length of the intestinal
section, R is the radius. A radius of 0.5 cm was used for all SI compartments and 2 cm
was used for the colon. The following lengths (in cm) were used for each GI
compartment as per the Beagle Model in GastroPlus: SI1 – 44.76; SI2 – 32.98; SI3 –
24.3; SI4 – 17.9; SI5 – 13.19; SI6 – 9.72; SI7 – 7.16; Colon – 6.25
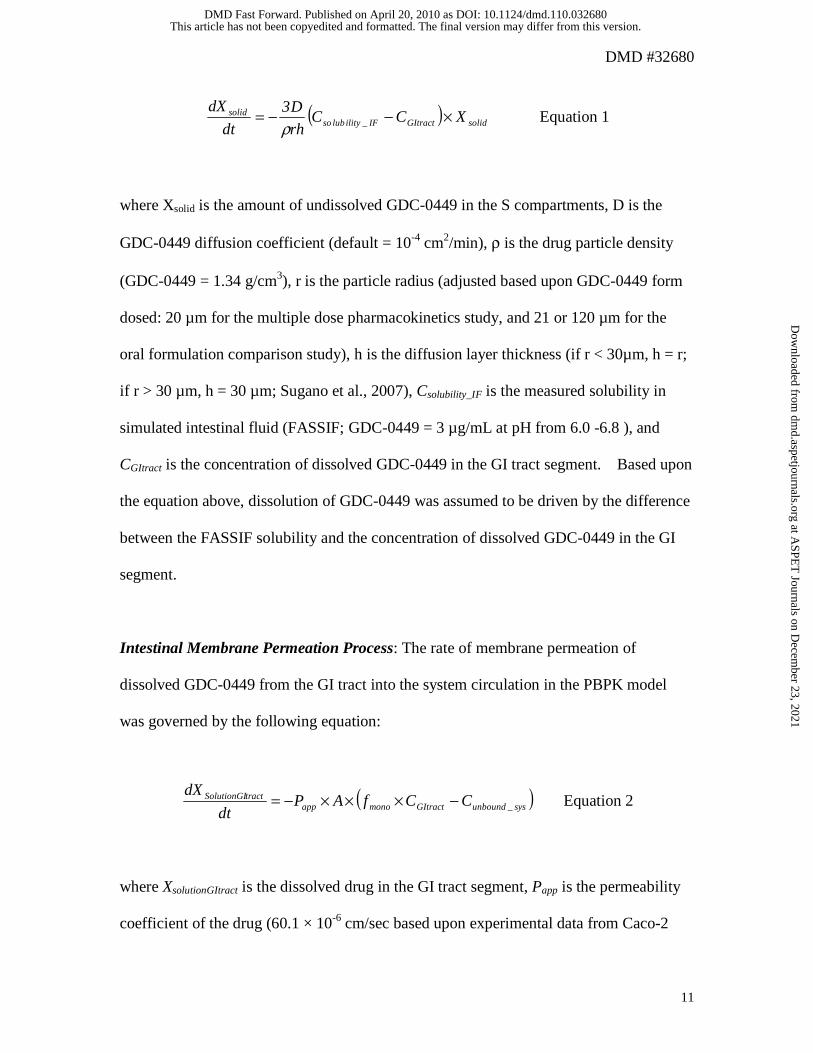
Dissolution Process: Dissolution rate of solid drug in the oral absorption PBPK model
was governed by the following equation based upon the Noyes-Whitney equation:
This article has not been copyedited and formatted. The final version may differ from this version.DMD Fast Forward. Published on April 20, 2010 as DOI: 10.1124/dmd.110.032680
at ASPE
T Journals on D
ecember 23, 2021
dmd.aspetjournals.org
Dow
nloaded from
DMD #32680
11
( ) solidGItractIF_ilitylubsosolid XCC
rh
D3
dt
dX×−−=
ρ Equation 1
where Xsolid is the amount of undissolved GDC-0449 in the S compartments, D is the
GDC-0449 diffusion coefficient (default = 10-4 cm2/min), ρ is the drug particle density
(GDC-0449 = 1.34 g/cm3), r is the particle radius (adjusted based upon GDC-0449 form
dosed: 20 µm for the multiple dose pharmacokinetics study, and 21 or 120 µm for the
oral formulation comparison study), h is the diffusion layer thickness (if r < 30µm, h = r;
if r > 30 µm, h = 30 µm; Sugano et al., 2007), Csolubility_IF is the measured solubility in
simulated intestinal fluid (FASSIF; GDC-0449 = 3 µg/mL at pH from 6.0 -6.8 ), and
CGItract is the concentration of dissolved GDC-0449 in the GI tract segment. Based upon
the equation above, dissolution of GDC-0449 was assumed to be driven by the difference
between the FASSIF solubility and the concentration of dissolved GDC-0449 in the GI
segment.
Intestinal Membrane Permeation Process: The rate of membrane permeation of
dissolved GDC-0449 from the GI tract into the system circulation in the PBPK model
was governed by the following equation:
( )sys_unboundGItractmonoapptractSolutionGI CCfAP
dt
dX−×××−= Equation 2
where XsolutionGItract is the dissolved drug in the GI tract segment, Papp is the permeability
coefficient of the drug (60.1 × 10⁻⁶ cm/sec based upon experimental data from Caco-2
This article has not been copyedited and formatted. The final version may differ from this version.DMD Fast Forward. Published on April 20, 2010 as DOI: 10.1124/dmd.110.032680
at ASPE
T Journals on D
ecember 23, 2021
dmd.aspetjournals.org
Dow
nloaded from

DMD #32680
12
cells; Additional Note: Efflux ratio in Caco-2 cells is 0.79 (Genentech Inc.)), A is the
surface total area available for absorption; fmono is the fraction of GDC-0449 that is not in
micelles (equal to solubility in buffer divided by solubility in FASSIF), and Cunbound_sys is
the unbound concentration of GDC-0449 in the systemic circulation. An unbound
fraction of 1.50% (determined ex vivo by equilibrium dialysis in 12 dogs) was used to
determine unbound concentrations in simulations. For the oral formulation comparison
study, the actual measured mean unbound fraction from animals from that study was used
(2.77%).
If fmono × CGItract > CsolBuffer (Solubility in buffer), then the rate of permeation
would be governed by the following equation:
( )sys_unboundsolBufferapptractSolutionGI CCAP
dt
dX−××−= Equation 3
Only the free monomer (fmono × CGItract; GDC-0449 not associated with micelles in
FASSIF) was assumed to be available for diffusion across the intestinal membrane. The
upper limit of free monomer concentration was set as the GDC-0449 aqueous solubility
associated with the pH of the intestinal segment of interest. Aqueous solubility of GDC-
0449 aqueous solubility was determined twice giving values of 0.1 and 0.4 µg/mL from
pH 6.5 to 7.0 (Genentech Inc.). Both estimates of aqueous solubility produced PK
profiles with similar phramacokinetic characteristics (data not shown). GDC-0449
aqueous solubility was set at 0.4 µg/mL for all simulations presented since this estimate
was the most conservative for demonstrating non-sink permeation conditions. The total
surface area available for absorption (A) was calculated as (2πRL) × total amplification
This article has not been copyedited and formatted. The final version may differ from this version.DMD Fast Forward. Published on April 20, 2010 as DOI: 10.1124/dmd.110.032680
at ASPE
T Journals on D
ecember 23, 2021
dmd.aspetjournals.org
Dow
nloaded from
DMD #32680
13
factor. Mammals have been shown to have a total surface area amplification factor due
to villi and microvilli of approximately 450 (Ferraris et al., 1989). An additional
amplification factor of 3 was incorporated as dog is believed to have a higher
permeability than humans (Parrott et al., 2009). Absorption was assumed to only occur
in the small intestine.
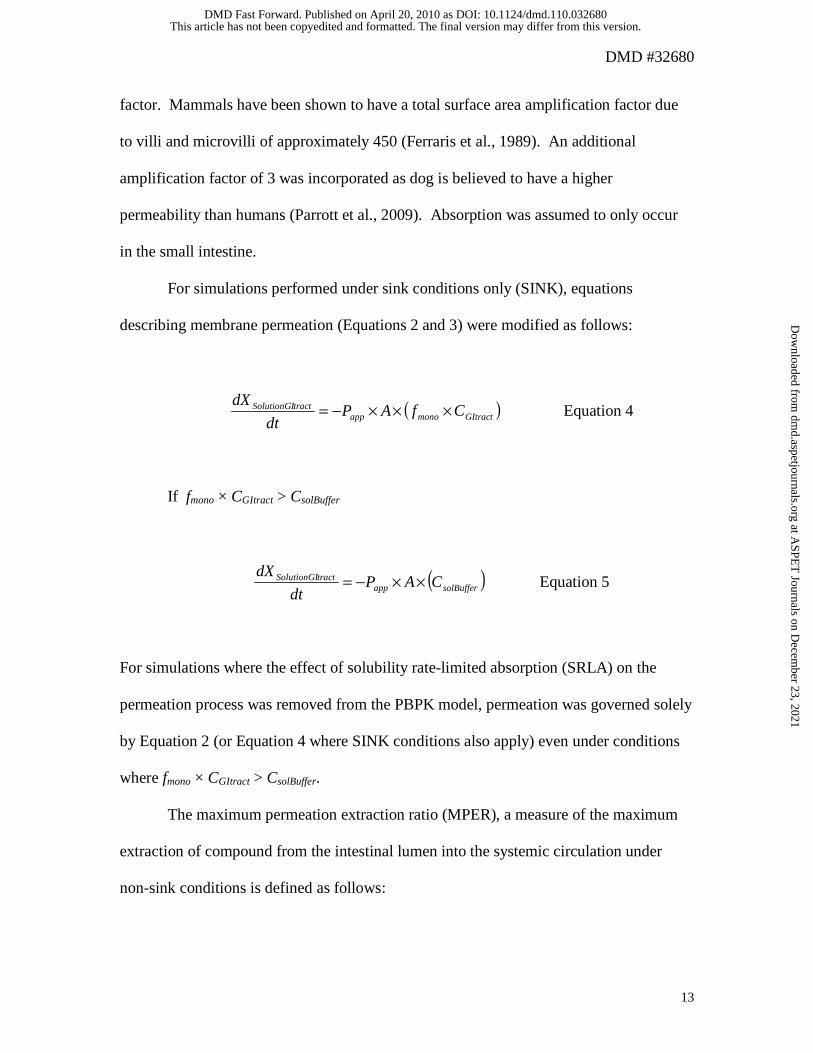
For simulations performed under sink conditions only (SINK), equations
describing membrane permeation (Equations 2 and 3) were modified as follows:
( )GItractmonoapptractSolutionGI CfAP
dt
dX×××−= Equation 4
If fmono × CGItract > CsolBuffer
( )solBufferapptractSolutionGI CAP
dt
dX××−= Equation 5
For simulations where the effect of solubility rate-limited absorption (SRLA) on the
permeation process was removed from the PBPK model, permeation was governed solely
by Equation 2 (or Equation 4 where SINK conditions also apply) even under conditions
where fmono × CGItract > CsolBuffer.
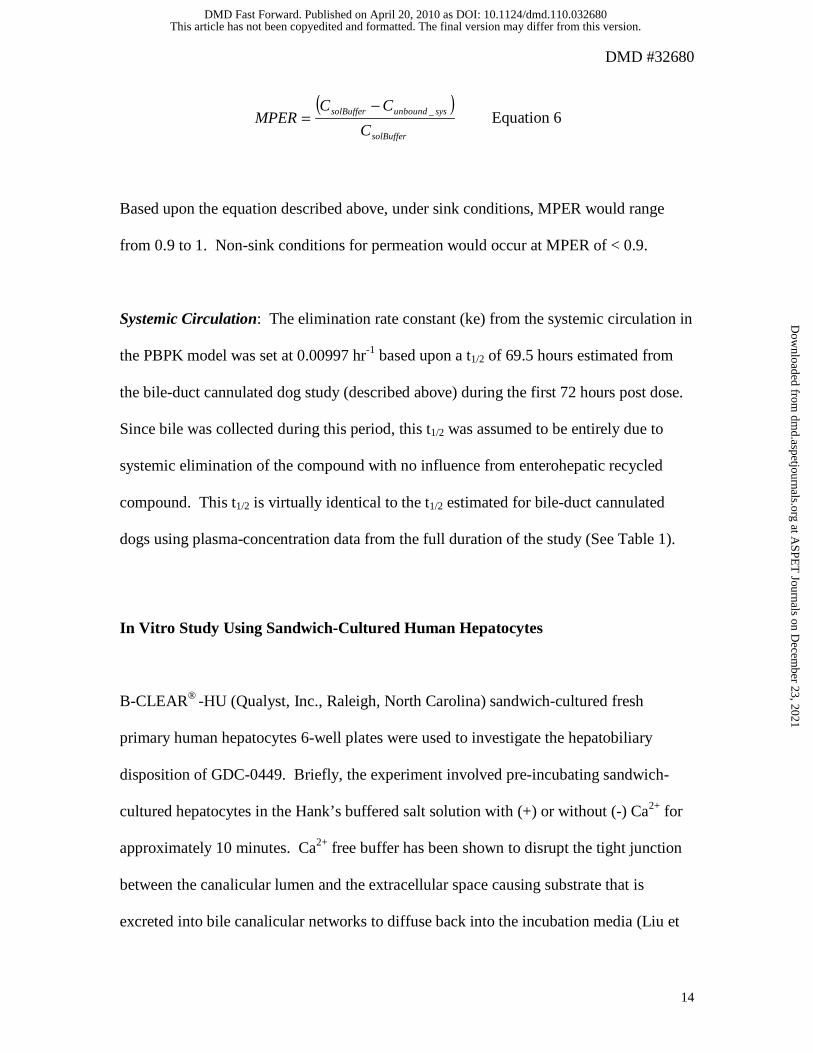
The maximum permeation extraction ratio (MPER), a measure of the maximum
extraction of compound from the intestinal lumen into the systemic circulation under
non-sink conditions is defined as follows:
This article has not been copyedited and formatted. The final version may differ from this version.DMD Fast Forward. Published on April 20, 2010 as DOI: 10.1124/dmd.110.032680
at ASPE
T Journals on D
ecember 23, 2021
dmd.aspetjournals.org
Dow
nloaded from
DMD #32680
14
( )solBuffer
sys_unboundsolBuffer
C
CCMPER
−= Equation 6
Based upon the equation described above, under sink conditions, MPER would range
from 0.9 to 1. Non-sink conditions for permeation would occur at MPER of < 0.9.
Systemic Circulation: The elimination rate constant (ke) from the systemic circulation in
the PBPK model was set at 0.00997 hr-1 based upon a t1/2 of 69.5 hours estimated from
the bile-duct cannulated dog study (described above) during the first 72 hours post dose.
Since bile was collected during this period, this t1/2 was assumed to be entirely due to
systemic elimination of the compound with no influence from enterohepatic recycled
compound. This t1/2 is virtually identical to the t1/2 estimated for bile-duct cannulated
dogs using plasma-concentration data from the full duration of the study (See Table 1).
In Vitro Study Using Sandwich-Cultured Human Hepatocytes
B-CLEAR® -HU (Qualyst, Inc., Raleigh, North Carolina) sandwich-cultured fresh
primary human hepatocytes 6-well plates were used to investigate the hepatobiliary
disposition of GDC-0449. Briefly, the experiment involved pre-incubating sandwich-
cultured hepatocytes in the Hank’s buffered salt solution with (+) or without (-) Ca2+ for
approximately 10 minutes. Ca2+ free buffer has been shown to disrupt the tight junction
between the canalicular lumen and the extracellular space causing substrate that is
excreted into bile canalicular networks to diffuse back into the incubation media (Liu et
This article has not been copyedited and formatted. The final version may differ from this version.DMD Fast Forward. Published on April 20, 2010 as DOI: 10.1124/dmd.110.032680
at ASPE
T Journals on D
ecember 23, 2021
dmd.aspetjournals.org
Dow
nloaded from
DMD #32680
15
al., 1999). At the end of the pre-incubation period, GDC-0449 (5 or 50 μM) in Hank’s
buffered salt solution (+) Ca2+ was added and incubated for approximately 20 minutes.
At the end of the incubation, an aliquot of incubation buffer was taken for measurement
of GDC-0449 by LC/MS/MS. The remaining buffer was aspirated, cells were washed
three times with ice cold (+) Ca2+ buffer, and 1 mL of acetonitrile containing 0.188 µM
of deuterated internal standard was added to each well and mixed for at least 20 minutes.
The resulting lysate was collected and protein (Lowry et al., 1951) and GDC-0449
concentrations were assessed. GDC-0449 uptake was normalized by protein
concentrations. Incubations were performed in three donors and in triplicate. The biliary
excretion index (BEI) and in vitro biliary clearance (CLbiliary) were calculated as
described by the following equations (Liu et al., 1999):
100Uptake
UptakeUptakeBEI
2
22
Ca)(
Ca)(Ca)( ×−
=+
++
+
−+ Equation 7
)vitro_in(
Ca)(Ca)(biliary AUC
UptakeUptakeCL
22 ++ −+ −= Equation 8
where Uptake(+)Ca2+ and Uptake(-)Ca
2+ are the cumulative uptake of GDC-0449 over the 20
minute incubation period for hepatocyte cultures pre-incubated in buffer with and without
Ca2+, respectively. AUC(in_vitro) is the area under the concentration-time curve of the
sandwich culture incubations calculated by multiplying the average concentration of
GDC-0449 at the start and end of the incubation by the duration of the incubation (i.e. 20
minutes). Taurocholate and digoxin were run as positive controls (data not shown).
This article has not been copyedited and formatted. The final version may differ from this version.DMD Fast Forward. Published on April 20, 2010 as DOI: 10.1124/dmd.110.032680
at ASPE
T Journals on D
ecember 23, 2021
dmd.aspetjournals.org
Dow
nloaded from
DMD #32680
16
RESULTS
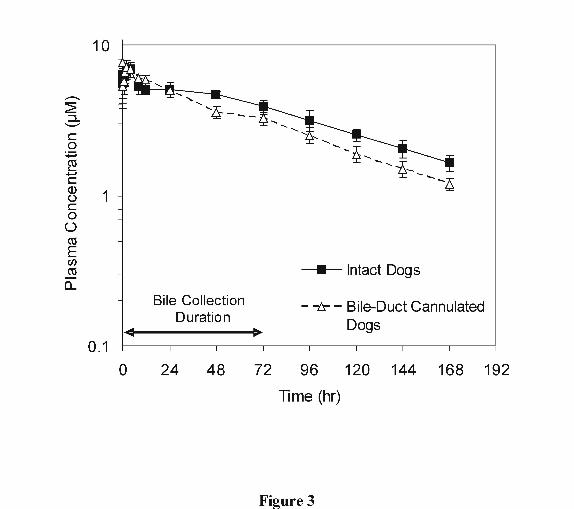
Bile-Duct Cannulated Dog Study
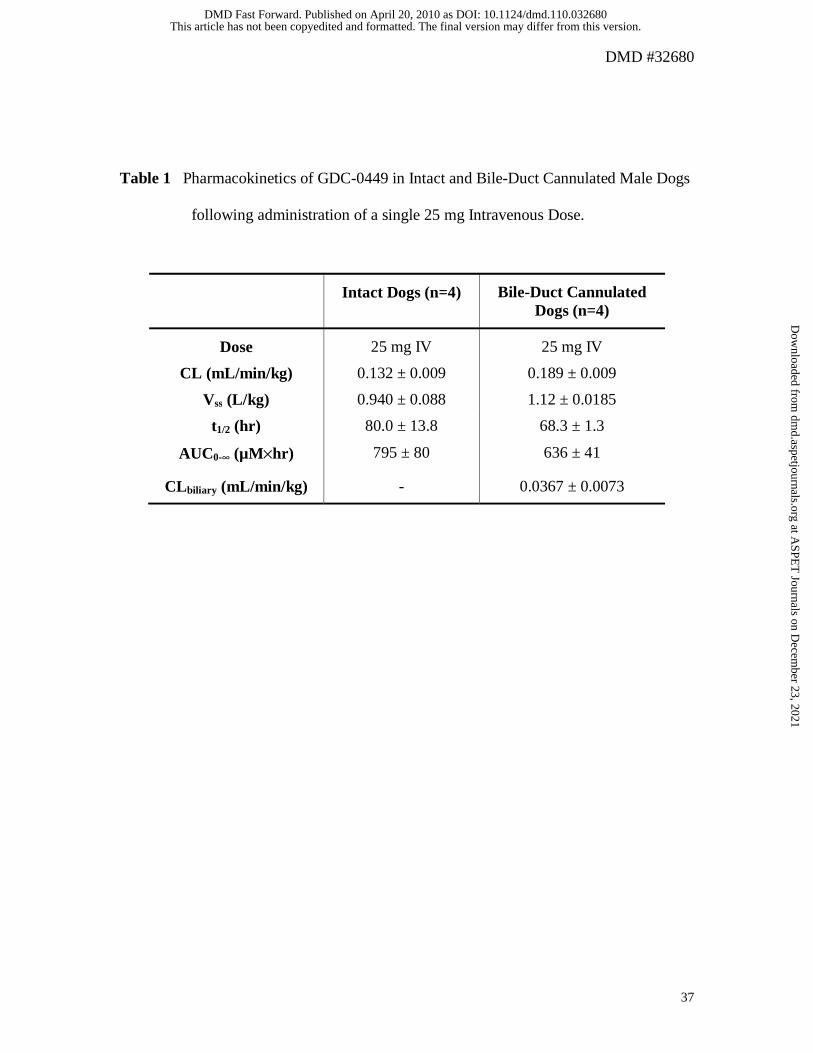
Figure 3 is concentration-time profile of GDC-0449 following an intravenous dose of 25
mg administered to intact and bile-duct cannulated dogs. The estimated pharmacokinetic
parameters are presented in Table 1. The mean plasma clearance (CL) of GDC 0449 in
both intact and bile-duct cannulated dogs was very low, approximately 0.4 and 0.6% of
hepatic blood flow, respectively. The mean volume of distribution (Vss) at steady state in
intact and bile-duct cannulated dogs was approximately 1.6 and 1.9 times, respectively,
of total body water volume (Davies and Morris, 1993). Half-life (t1/2) was long being
approximately 80 hours in intact animals and approximately 68 hours in bile-duct
cannulated dogs. The mean biliary clearance of GDC-0449 in bile-duct cannulated dogs
was very low, at approximately 0.04 mL/min/kg, and was approximately 19% of plasma
clearance in bile-duct cannulated dogs.
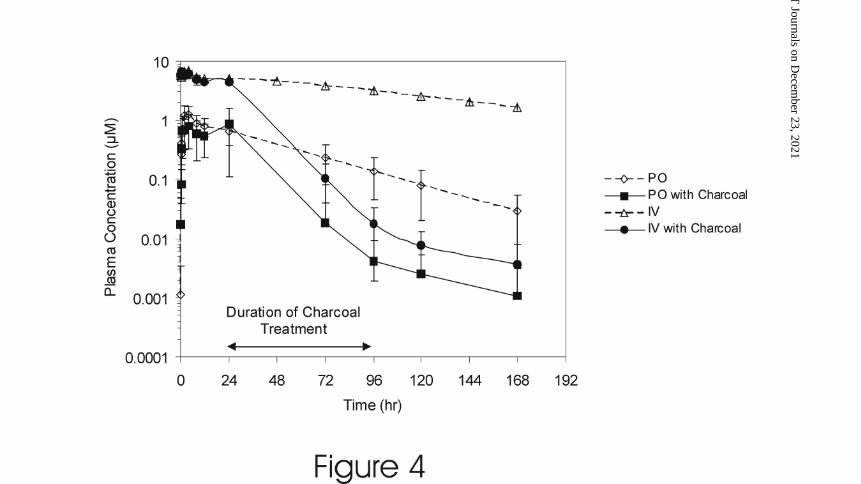
Activated Charcoal Studies:
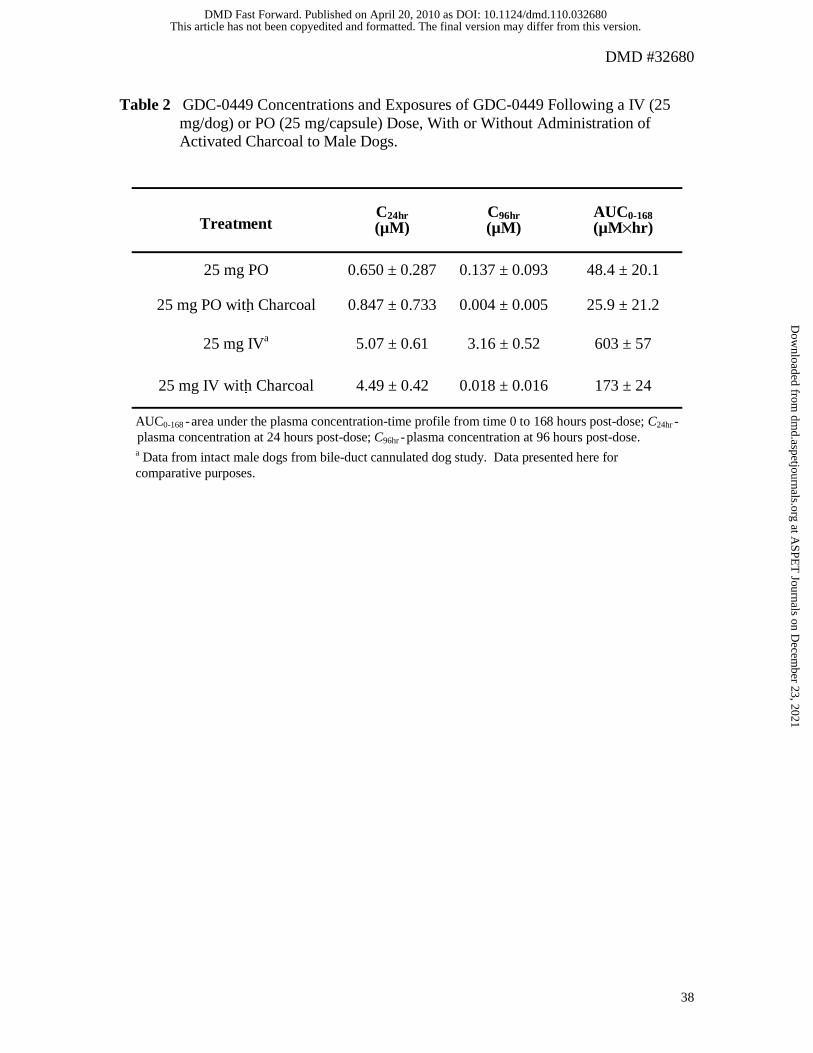
Figure 4 presents a plot of the mean plasma concentration-time profile for dogs that
received a 25 mg IV or PO dose of GDC 0449, with or without administration of
activated charcoal. GDC-0449 concentrations at the start and end of charcoal
administration (24 and 96 hours, respectively) and the area under the concentration-time
profile up to 168 hours post-dose (AUC0-168) are presented in Table 2. The mean GDC
0449 concentration at 96 hours post dose for dogs given 25 mg of GDC-0449 orally
(0.137 µM) was approximately 21.0% of the concentration observed at the 24 hour post
This article has not been copyedited and formatted. The final version may differ from this version.DMD Fast Forward. Published on April 20, 2010 as DOI: 10.1124/dmd.110.032680
at ASPE
T Journals on D
ecember 23, 2021
dmd.aspetjournals.org
Dow
nloaded from
DMD #32680
17
dose timepoint (0.650 µM). In contrast, PO administration of activated charcoal, from 24
to 96 hours post dose, to dogs given either a PO or IV dose of 25 mg GDC-0449 resulted
in mean GDC-0449 concentrations at 96 hours (0.004 and 0.018 µM, respectively) that
were approximately 0.5% of the concentrations observed at the 24 hour post dose
timepoint (0.847 and 4.49 µM, respectively). Oral administration of activated charcoal to
dogs given a 25 mg oral dose of GDC-0449 resulted in a modest reduction of AUC0-168
causing a decrease by approximately 50% (see Table 2). This was because a significant
portion of the AUC0-168 originates from the time prior to the administration of charcoal (0
to 24 hours post-dose).
Intravenous data from intact dogs from the bile-duct cannulated dog study
(described above) is also presented in Table 2 and Figure 4 for comparative purposes.
When compared to the dogs given 25 mg IV GDC-0449 with oral activated charcoal,
both the mean GDC-0449 concentration at 96 hours post-dose and the AUC0-168 were
higher in the intact dogs from the bile-duct cannulated dog study.
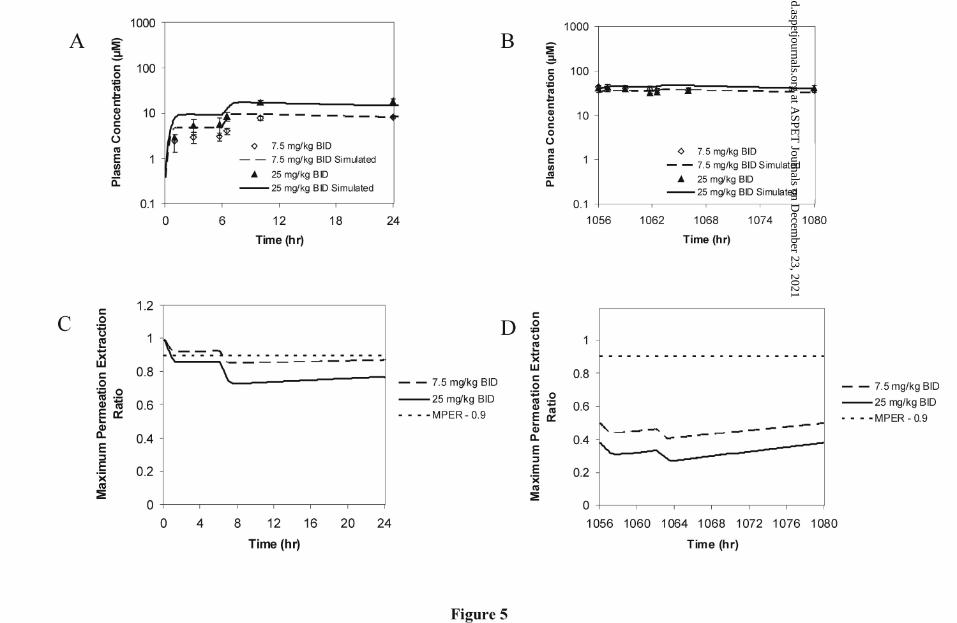
Multiple Dose Pharmacokinetics of GDC-0449:
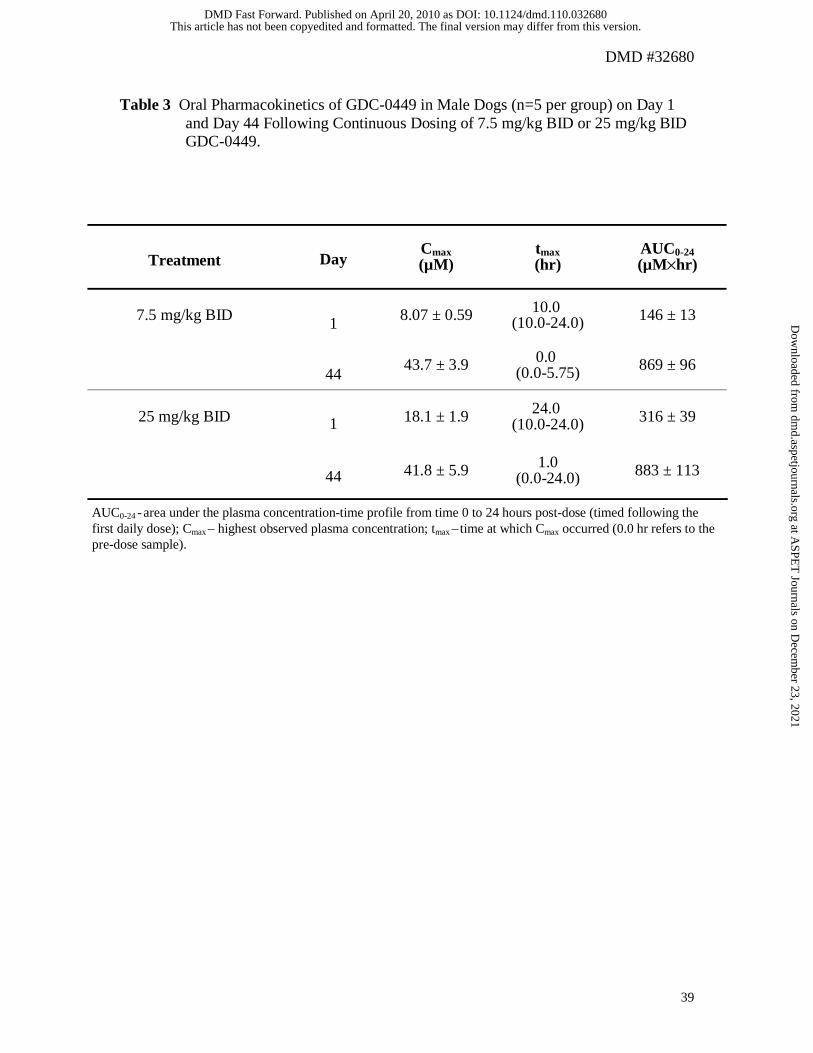
Estimates of oral pharmacokinetic parameters for GDC-0449 on Day 1 and Day 44 in
male dogs given either 7.5 mg/kg BID or 25 mg/kg BID are presented in Table 3.
Corresponding mean plasma concentration-time profiles are presented in Figure 5A and
B. Increases in oral exposure were less than dose proportional on Day 1. An
approximate three fold increase in dose (7.5 mg/kg BID to 25 mg/kg BID) resulted in
only an approximate two fold increase in AUC0-24 and Cmax (Table 3). GDC-0449 plasma
concentrations on Day 1 showed no signs of decline by 24 hours for both dose groups
This article has not been copyedited and formatted. The final version may differ from this version.DMD Fast Forward. Published on April 20, 2010 as DOI: 10.1124/dmd.110.032680
at ASPE
T Journals on D
ecember 23, 2021
dmd.aspetjournals.org
Dow
nloaded from
DMD #32680
18
(Figure 5A). Finally, an expected secondary increase in GDC-0449 plasma
concentrations was observed on Day 1 following the administration of the second daily
dose at 6 hours. In contrast to Day 1, AUC0-24 and Cmax estimates were very similar for
both dose groups on Day 44 (Table 3). GDC-0449 plasma concentration-time profiles on
Day 44 were unusually flat showing little increase in GDC-0449 plasma concentration
following the administration of the second daily dose. Continuous dosing of 7.5 mg/kg
BID for 44 days resulted in accumulation of GDC-0449 with Cmax and AUC0-24 estimates
being approximately 5 and 6 fold higher, respectively, on Day 44 when compared to Day
1. The extent of accumulation was less for the 25 mg/kg BID dose group with Cmax and
AUC0-24 being approximately 2 and 3-fold higher, respectively, on Day 44 when
compared to Day 1.
Predicted concentrations from simulations using the oral PBPK model show an
approximately 2-fold increase in exposure with dose on Day 1 (Figure 5A). At steady-
state (Figure 5B), this difference in exposure was almost nonexistent and is consistent
with observed data. Figure 5C and D show the simulated maximum permeation
extraction ratio (MPER) for Day 1 and Day 44. The simulations suggest non-sink
conditions exist for the oral permeation GDC-0449 in dogs. In particular, non-sink
permeation conditions were more prominent at steady-state (Day 44) where the MPER is
< 0.5 throughout the entire 24 hours post dose for both dose levels.
Additional simulations were performed to assess the mechanistic influence of
solubility–rate limited absorption and non-sink permeation on the less than dose
proportional increases in exposure observed for GDC-0449 in dogs. Modifications were
made to the equations describing the intestinal membrane permeation process of the full
This article has not been copyedited and formatted. The final version may differ from this version.DMD Fast Forward. Published on April 20, 2010 as DOI: 10.1124/dmd.110.032680
at ASPE
T Journals on D
ecember 23, 2021
dmd.aspetjournals.org
Dow
nloaded from

DMD #32680
19
PBPK model (as described in the Methods) by removing solubility rate-limited
absorption conditions (NO SRLA), removing non-sink permeation conditions (SINK),
and removing both non-sink permeation and solubility rate-limited absorption conditions
(SINK and NO SRLA). Little effect was observed for the 7.5 mg/kg BID dose on Day 1
(Figure 6A) and at Steady-State (Day 44) (Figure 7A). In contrast, for the 25 mg/kg BID
dose, incorporation of solubility-rate limited absorption into the PBPK model appeared
necessary to better simulate the plasma profile on Day 1 (Figure 6B). Removal of
solubility rate limited absorption from the model (“NO SRLA” and “SINK and NO
SRLA” scenarios) resulted in a doubling of the average Day 1 concentrations of GDC-
0449 causing a larger deviation from the observed concentrations. Removal of either or
both solubility-rate limited absorption and non-sink membrane permeation conditions
caused ~ 2 to 3.5 fold increases in the simulated average GDC-0449 steady-state (Day
44) concentrations (Figure 7B). The full model incorporating both conditions appeared
provided the best simulation of the observed Day 44 data.
Oral Formulation Comparison Study:
The mean GDC-0449 plasma concentration-time profile in dogs from the oral
formulation comparison study is shown in Figure 8 along with the simulated plasma
concentration-time profiles generated using the oral PBPK model. The effect of particle
size on the oral pharmacokinetics of GDC-0449 in male dogs is presented in Table 4.
Estimates of AUC0-168 and Cmax were both approximately 3-fold higher when particle size
was reduced for GDC-0449. The median tmax was comparable between the two groups
being 4.0 and 3.0 hours. However, the tmax appeared more variable for the in dogs given
This article has not been copyedited and formatted. The final version may differ from this version.DMD Fast Forward. Published on April 20, 2010 as DOI: 10.1124/dmd.110.032680
at ASPE
T Journals on D
ecember 23, 2021
dmd.aspetjournals.org
Dow
nloaded from
DMD #32680
20
GDC-0449 as larger particles. As seen in Figure 8, the PBPK model was able to nicely
capture the observed particle size effect.
A simulation study using the oral PBPK model was performed to better
understand the impact of changing dose and dose regimen on the observed particle size
effect. For this purpose, simulations were performed at total doses of 600 mg (600 mg
once daily (QD) and 150 mg QID (four times daily); Figure 9). The doses were chosen
such that steady concentrations achieved in the simulation approached relevant
concentrations that have been observed clinically. The effect of particle size on oral
absorption was predicted to decrease with increasing dose when comparing the particle
size effect following a single 150 mg dose (Figure 8) to the simulation of a single dose of
600 mg (Figure 9A). The effect of administering the 600 mg total dose over four 150 mg
doses (i.e. 150 mg QID) was predicted to increase the effect of particle size (Figure 9A
and 9C). The effect of particle size on oral absorption was predicted to be minimal at
steady-state regardless of the dose regimen (Figure 9B and 9D).
Sandwich-Cultured Human Hepatocytes Studies
No biliary excretion was observed for GDC-0449 (at 5 and 50 µM) from sandwich-
cultured human hepatocytes. Accordingly, estimates of BEI and CLbiliary for GDC-0449
were negligible suggesting that biliary elimination of GDC-0449 is either very low or
absent.
This article has not been copyedited and formatted. The final version may differ from this version.DMD Fast Forward. Published on April 20, 2010 as DOI: 10.1124/dmd.110.032680
at ASPE
T Journals on D
ecember 23, 2021
dmd.aspetjournals.org
Dow
nloaded from

DMD #32680
21
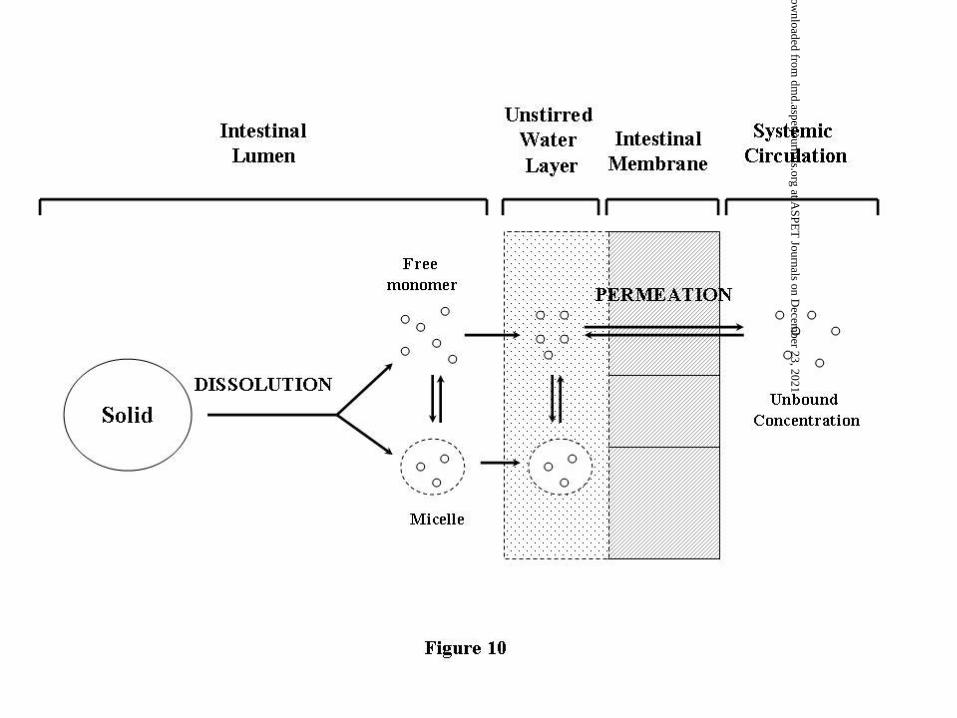
DISCUSSION
The oral absorption of drugs is dependent on the sequential processes of dissolution and
intestinal membrane permeation (Figure 10). The overall absorption characteristics are a
result of the interaction between these two processes. The dissolution rate, described
commonly by the Noyes-Whitney equation (Equation 1), is influenced by compound
characteristics such as solubility in intestinal fluid, and more controllable properties such
as particle size. The driving force for dissolution is the gradient between intestinal fluid
solubility and compound concentration in the intestinal compartment of interest.
Following dissolution in the intestinal lumen, drug in solution exists as free molecules or
is solubilized by bile micelles (Sugano et al., 2007). Solubilization in micelles can act to
enhance intestinal membrane permeation by assisting the movement across the unstirred
water layer adjacent to the intestinal membrane (Amidon et al., 1981). As micelle bound
molecules are not available for membrane permeation, those carried across the unstirred
water layer by micelles must be released prior to crossing the intestinal membrane. Thus,
the driving force for membrane permeation is the concentration gradient between the free
molecules in the intestinal lumen and the unbound molecules in the systemic circulation
as described by Equations 2 and 3. For most drugs, the free molecule concentration in
the lumen is much higher than the unbound concentrations in the systemic circulation
such that membrane permeation occurs under “sink” conditions (see Equations 4 and 5).
In these cases, the rate limiting step for permeation is movement across the unstirred
water layer (Sugano et al., 2007).
This article has not been copyedited and formatted. The final version may differ from this version.DMD Fast Forward. Published on April 20, 2010 as DOI: 10.1124/dmd.110.032680
at ASPE
T Journals on D
ecember 23, 2021
dmd.aspetjournals.org
Dow
nloaded from
DMD #32680
22
Inhibition of the Hedgehog signaling pathway and its potential implications on the
treatment of certain cancers has resulted in the synthesis of small molecule inhibitors of
this pathway (Borzilla and Lippa 2005; Scales and de Sauvage, 2009). Previously, we
reported the preclinical absorption, distribution, metabolism and excretion properties of
GDC-0449, a small molecule inhibitor of the Hedgehog signaling pathway currently in
Phase II clinical trials (Wong et al., 2009). GDC-0449 is extremely stable in dog and
human hepatocytes displaying minimal turnover in 3 hour hepatocyte incubations. The
systemic clearance of GDC-0449 is exceptionally low in dog being ~ 1% of hepatic blood
flow (Davies and Morris, 1993) and this was reflected in the long terminal half-life. The
systemic clearance in intact and bile-duct cannulated dogs in the current study is similarly
low being ~ 0.4% and 0.6% of hepatic blood flow, respectively. Half-life in intact and
bile-duct cannulated dogs was ~80 and 68 hours, respectively and was similar (within 2-
fold biological variability) to the previously reported t1/2 of ~42 hours (Wong et al.,
2009). The low systemic clearance and the associated long t1/2 in dogs contribute to high
steady-state concentrations of GDC-0449 observed in the current study. In terms of the
Biopharmaceutical Classification System (BCS), GDC-0449 is considered a BCS class II
compound (Dahan et al., 2009) based upon its very low solubility and high Caco-2
permeability. The oral absorption of BCS class II compounds are usually limited by
particle size effects or intestinal fluid solubility on the dissolution process. Membrane
permeation is usually not considered rate limiting for BCS class II compounds (Takano et
al., 2008).
Physiologically-based pharmacokinetic modeling is a useful tool to understand
the interplay between different biological processes and their overall effect on the
This article has not been copyedited and formatted. The final version may differ from this version.DMD Fast Forward. Published on April 20, 2010 as DOI: 10.1124/dmd.110.032680
at ASPE
T Journals on D
ecember 23, 2021
dmd.aspetjournals.org
Dow
nloaded from
DMD #32680
23
disposition of a particular molecule over time (Theil et al., 2003). The complexity of the
oral absorption process has made the use of physiological modeling widespread. In
particular, models based upon the compartmental absorption transit (CAT) model
described by Yu and Amidon (1999) have been used extensively. (Agoram et al., 2001;
Parrott et al., 2009). In the current manuscript, we utilize a CAT model that divides to GI
tract into 9 segments where solid and dissolved material are represented as two separate
compartments (18 compartments total; Figure 2), and dissolution and permeation
processes are consistent with the scenario described in Figure 10. The described oral
PBPK model was used to investigate the factors influencing the oral absorption of GDC-
0449.
The pharmaceutical and biological characteristics of GDC-0449 make it uniquely
distinct from most BCS class II compounds. As discussed, for BCS class II compounds,
membrane permeation is usually not considered rate limiting. The permeation process is
often governed by a form of Equation 4 which implies that permeation occurs under sink
conditions (Sugano et al., 2007). The permeation equation used in the current model
(Equation 2) is based upon Fick’s Law of diffusion where the driving force is the
concentration gradient between the free molecules in the intestinal lumen (i.e. molecules
not associated with micelles) and the unbound molecules in the systemic circulation.
Equation 3 “caps” the free molecule concentration at the aqueous solubility of GDC-0449
and serves to describe a solubility rate-limited scenario for the membrane permeation
process. A combination of low compound solubility along with high steady-state
unbound concentrations act in unison to reduce the concentration gradient that serves as
the driving force for membrane permeation. Based upon the in vivo properties of GDC-
This article has not been copyedited and formatted. The final version may differ from this version.DMD Fast Forward. Published on April 20, 2010 as DOI: 10.1124/dmd.110.032680
at ASPE
T Journals on D
ecember 23, 2021
dmd.aspetjournals.org
Dow
nloaded from
DMD #32680
24
0449, the use of these equations that allow for nonlinear membrane permeation is
appropriate.
Our simulations of the multiple dose studies show that inclusion of solubility rate-
limited absorption in the permeation process is necessary to describe the steady-state oral
pharmacokinetics of GDC-0449 at the doses administered. More unique is the non-sink
permeation characteristics that are also required to describe steady-state concentrations.
At steady-state, the unbound concentrations are such that significant non-sink permeation
can exist which is illustrated in our simulations presented in Figure 5D. As mentioned
above, the permeation process is driven by the concentration gradient between the free
molecules in the intestinal lumen and the unbound molecules in the systemic circulation.
The MPER is calculated based upon the maximum possible concentration gradient at a
given plasma concentration since the upper limit of free concentration in the intestinal
lumen (i.e. aqueous solubility) is used in its calculation. Regardless, the MPER ratio is
well under 0.9 during the entire 24 hour interval at steady-state suggesting significant
non-sink permeation working to decrease the movement of GDC-0449 across the
intestinal membrane into the systemic circulation at both doses tested. Our studies with
charcoal clearly demonstrate that the permeation across the intestinal membrane is
dependent on a concentration gradient that can be reversed with the application of
charcoal making a non-sink permeation situation entirely plausible.
The oral formulation comparison study demonstrates a particle size effect on the
oral absorption of GDC-0449. This is consistent with previous observations for BCS
class II compounds such as danazol, griseofulvin, and aprepitant (Takano et al., 2008).
Results of our simulation study using the described oral PBPK model, suggest that
This article has not been copyedited and formatted. The final version may differ from this version.DMD Fast Forward. Published on April 20, 2010 as DOI: 10.1124/dmd.110.032680
at ASPE
T Journals on D
ecember 23, 2021
dmd.aspetjournals.org
Dow
nloaded from

DMD #32680
25
increasing dose and or applying multiple doses of GDC-0449 to steady-state reduces the
effect of particle size on oral absorption. The predicted reduction in the particle size
effect can be attributed to a shift from a situation where absorption is rate limited by
dissolution to a situation where absorption is rate limited by solubility and/or the
intestinal membrane permeation process where changes in particle size have minimal
impact (Sugano et al., 2007).
Biliary clearance presents additional complexity in that compounds eliminated via
the bile are reabsorbed and can have a significant impact on the shape of the plasma
concentration-time profile. We investigated the contribution of biliary clearance to the
disposition of GDC-0449 in vivo using bile-duct cannulated dogs, and in vitro using
sandwich-cultured human hepatocytes. Both studies suggested that biliary clearance does
not appear to be a primary determinant of the disposition of GDC-0449 following oral
administration in dogs or humans. In addition, biliary clearance was incorporated into
the oral PBPK model and tested (data not shown). The inclusion of biliary clearance had
minimal to no effect on simulations generated by the model, and thus biliary clearance
was subsequently removed from final model presented.
The clinical pharmacokinetics of GDC-0449 has also been recently described
(Von Hoff et al., 2009). The compound showed high steady-state plasma concentrations
with a median concentration of approximately 16.1 µM (inter-quartile range, 13.7 to
21.6), and an apparent lack of dose dependency from 150 to 540 mg. Data from healthy
volunteers show that the half-life (t1/2) of GDC-0449 in humans is very long, being in the
order of approximately 12 days (Ding et al., 2010). Based upon the pharmacokinetic
This article has not been copyedited and formatted. The final version may differ from this version.DMD Fast Forward. Published on April 20, 2010 as DOI: 10.1124/dmd.110.032680
at ASPE
T Journals on D
ecember 23, 2021
dmd.aspetjournals.org
Dow
nloaded from

DMD #32680
26
characteristics, and systemic concentrations observed in humans thus far, the factors
influencing oral absorption of GDC-0449 in dogs may play a role in humans.
Since most drugs are delivered via the oral route, an understanding of the factors
influencing the rate and extent of oral absorption is important during the drug
development process. The dissolution of GDC-0449 is dependent on properties such as
particle size and compound solubility. Solubility also influences the permeation process;
however; others biological characteristics including metabolic intrinsic clearance (a
controlling factor of in vivo unbound concentrations) also contribute. As described
above, a unique feature of GDC-0449 distinguishing it from other Biopharmaceutics
Classification System II compounds was that incorporation of both the effects of
solubility rate-limited absorption and non-sink permeation on the intestinal membrane
permeation process was necessary to describe its pharmacokinetic behavior. Overall, the
oral disposition of GDC-0449 is dependent on the interplay between the dissolution and
permeation processes. Finally, PBPK modeling is an invaluable tool to understand
complex dynamic processes such as oral absorption.
This article has not been copyedited and formatted. The final version may differ from this version.DMD Fast Forward. Published on April 20, 2010 as DOI: 10.1124/dmd.110.032680
at ASPE
T Journals on D
ecember 23, 2021
dmd.aspetjournals.org
Dow
nloaded from

DMD #32680
27
ACKNOWLEDGEMENTS
The authors would like to thank Dr. Malcolm Rowland for his insightful discussion. We
would also like to recognize Drs. Richard Graham, Bert Lum, Karin Jorga, Mingxin
Qian, Stephen E Gould, Jennifer Low, Minli Xie, Jin Jin, and Lichuan Liu for their
discussion on this topic. We thank April Yang and Dr. Jae Chang for assistance with
protein binding measurements. All authors are employees of Genentech. GDC-0449 was
discovered by Genentech under a collaboration agreement with Curis, Inc.
This article has not been copyedited and formatted. The final version may differ from this version.DMD Fast Forward. Published on April 20, 2010 as DOI: 10.1124/dmd.110.032680
at ASPE
T Journals on D
ecember 23, 2021
dmd.aspetjournals.org
Dow
nloaded from

DMD #32680
28
REFERENCES
Agoram B, Woltosz WS, and Bolger MB (2001) Predicting the impact of physiological
and biochemical processes on oral bioavailability. Adv Drug Rev 50: S41-S67.
Amidon GE, Higuchi WI and Ho NFH (1981) Theoretical and Experimental Studies of
Transport of Micelle-Solubilized Solutes. J Pharm Sci 71: 77-84.
Borzillo GV and Lippa B. (2005) The Hedgehog signaling pathway as a target for
anticancer drug discovery. Curr Top Med Chem. 5: 147-157.
Dahan A, Miller JM and Amidon GL (2009) Prediction of Solubility and Permeability
Class Membership: Provisional BCS Classification of the World’s Top Oral Drugs.
AAPS J. In press, DOI:10.1208/s12248-009-9144-x.
Davies B and Morris T. Physiological parameters in laboratory animals and humans.
(1993) Pharm Res. 10:1093-1095.
Dierks C, Grbic J, Zirlik K, Beigi R, Englund NP, Guo GR, Veelken H, Engelhardt M,
Mertelsmann R, Kelleher JF, Schultz P and Warmuth M (2007) Essential role of
stromally induced hedgehog signaling in B-cell malignancies. Nat Med. 13: 944-951.
This article has not been copyedited and formatted. The final version may differ from this version.DMD Fast Forward. Published on April 20, 2010 as DOI: 10.1124/dmd.110.032680
at ASPE
T Journals on D
ecember 23, 2021
dmd.aspetjournals.org
Dow
nloaded from

DMD #32680
29
Ding X, Chou B, Graham RA, Cheeti S, Percey S, Matassa LC, Reuschel SA, Meng M,
Liu S, Voelker T, Lum BL, Rudewicz PJ and Hop CECA. (2010) Determination of GDC-
0449, a small molecule inhibitor of the Hedgehog signaling pathway, in human plasma
by solid phase extraction-liquid chromatographic-tandem mass spectrometry. J
Chromatogr B Analyt Technol Biomed Life Sci. doi:10.1016/j.jchromb.2010.01.039 (in
press)
Fan L, Pepicelli CV, Dibble CC, Catbagan W, Zarycki JL, Laciak R, Gipp J, Shaw A,
Lamm ML, Munoz A, Lipinski R, Thrasher JB and Bushman W (2004) Hedgehog
signaling promotes prostate xenograft tumor growth. Endocrinology 145: 3961-3970.
Ferraris RP, Lee PP, and Diamond JM. (1989) Origin of regional and species differences
in intestinal glucose uptake. Am J Physiol. 257: G689-G697.
Gilbaldi M and Perrier D (1982) Pharmacokinetics 2nd Edition , Marcel Dekker Inc., New
York.
Hahn H, Christiansen J, Wicking C, Zaphiropoulos PG, Chidambaram A, Gerrard B,
Vorechovsky I, Bale AE, Toftgard R, Dean M and Wainwright B (1996) A mammalian
patched homolog is expressed in target tissues of sonic hedgehog and maps to a region
associated with developmental abnormalities. J Biol Chem 271: 12125-12128.
This article has not been copyedited and formatted. The final version may differ from this version.DMD Fast Forward. Published on April 20, 2010 as DOI: 10.1124/dmd.110.032680
at ASPE
T Journals on D
ecember 23, 2021
dmd.aspetjournals.org
Dow
nloaded from
DMD #32680
30
Johnson RL, Rothman AL, Xie J, Goodrich LV, Bare JW, Bonifas JM, Quinn AG, Myers
RM, Cox DR, Epstein EH Jr and Scott MP (1996) Human homolog of patched, a
candidate gene for the basal cell nevus syndrome. Science 272: 1668-1671.
Liu X, Chism E, Lecluyse EL, Brouwer KR, and Brouwer KLR (1999) Correlation of
Biliary Excretion in Sandwich-Cultured Rat Hepatocytes and In Vivo in Rats. Drug
Metab and Disp. 27: 637-644.
Lowry OH, Rosebrough NJ, Farr AL, and Randall RJ. (1951) Protein Measurement with
the Folin Phenol Reagent. Journal of Biological Chemistry, 193:265-275.
Parrott N, Lukacova V, Fraczkiewicz G, and Bolger MB (2009) Predicting
Pharmacokinetics of Drugs Using Physiologically Based Modeling – Application to Food
Effects. AAPS Journal 11:45-53.
Pietsch T, Waha A, Koch A, Kraus J, Albrecht S, Tonn J, Sörensen N, Berthold F, Henk
B, Schmandt N, Wolf HK, von Deimling A, Wainwright B, Chenevix-Trench G, Wiestler
OD and Wicking C (1997) Medulloblastomas of the desmoplastic variant carry mutations
of the human homologue of Drosophila patched Cancer Res. 57: 2085-2088.
Raffel C, Jenkins RB, Frederick L, Hebrink D, Alderete B, Fults DW and James CD
(1997) Sporadic medulloblastomas contain PTCH mutations. Cancer Res 57: 842-845.
This article has not been copyedited and formatted. The final version may differ from this version.DMD Fast Forward. Published on April 20, 2010 as DOI: 10.1124/dmd.110.032680
at ASPE
T Journals on D
ecember 23, 2021
dmd.aspetjournals.org
Dow
nloaded from
DMD #32680
31
Sagawa K, Li F, Liese R and Sutton SC (2009) Fed and Fasted Gastric pH and Gastric
Residence Time in Conscious Beagle Dogs. J Pharm Sci. 98: 2494-2500.
Scales SJ and de Sauvage FJ (2009) Mechanisms of Hedgehog pathway activation in
cancer and implications for therapy. Trends Pharmacol Sci 30: 303-312.
Sugano K, Okazaki A, Sugimoto S, Tavornvipas S, Omura A and Mano T (2007)
Solubility and Dissolution Profile Assessment in Drug Discovery. Drug Metab
Pharmacokinet. 22: 225-254.
Takano R, Furumoto K, Shiraki K, Takata N, Hayashi Y, Aso Y and Yamashita S. (2008)
Rate-limiting steps of oral absorption for poorly water-soluble drugs in dogs; prediction
from a miniscale dissolution test and a physiologically-based computer simulation.
Pharm Res 25: 2334-2344.
Theil FP, Guentert TW, Haddad S and Poulin P (2003) Utility of physiologically based
pharmacokinetic models to drug development and rational drug discovery candidate
selection. Toxicology Letters 138: 29-49.
Von Hoff DD, Lorusso PM, Rudin CM, Reddy JC, Yauch RL, Tibes R, Weiss GJ, Borad
MJ, Hann CL, Brahmer JR, Mackey HM, Lum BL, Darbonne WC, Marsters JC Jr, de
Sauvage FJ and Low JA. (2009) Inhibition of the Hedgehog Pathway in Advanced Basal-
Cell Carcinoma. N Engl J Med. 361: 1164-1172.
This article has not been copyedited and formatted. The final version may differ from this version.DMD Fast Forward. Published on April 20, 2010 as DOI: 10.1124/dmd.110.032680
at ASPE
T Journals on D
ecember 23, 2021
dmd.aspetjournals.org
Dow
nloaded from

DMD #32680
32
Vorechovský I, Tingby O, Hartman M, Strömberg B, Nister M, Collins VP, and Toftgård
R (1997) Somatic mutations in the human homologue of Drosophila patched in primitive
neuroectodermal tumours. Oncogene 15: 361-366.
Wong H, Chen JZ, Chou B, Halladay JS, Kenny JR, La H, Marsters JC, Plise E,
Rudewicz PJ, Robarge K, Shin Y, Wong S, Zhang C and Khojasteh SC (2009) Preclinical
assessment of the absorption, distribution, metabolism and excretion of GDC-0449 (2-
chloro-N-(4-chloro-3-(pyridin-2-yl)phenyl)-4-(methylsulfonyl)benzamide), an orally
bioavailable systemic Hedgehog signalling pathway inhibitor. Xenobiotica 39:851-861.
Yauch RL, Gould SE, Scales SJ, Tang T, Tian H, Ahn CP, Marshall D, Fu L, Januario T,
Kallop D, Nannini-Pepe M, Kotkow K, Marsters JC, Rubin LL and de Sauvage FJ (2008)
A paracrine requirement for hedgehog signalling in cancer. Nature 455: 406-410.
Yauch RL, Dijkgraaf GJ, Alicke B, Januario T, Ahn CP, Holcomb T, Pujara K, Stinson J,
Callahan CA, Tang T, Bazan JF, Kan Z, Seshagiri S, Hann CL, Gould SE, Low JA,
Rudin CM and de Sauvage FJ (2009) Smoothened Mutation Confers Resistance to a
Hedgehog Pathway Inhibitor in Medulloblastoma. Science 326: 572 – 574. DOI:
10.1126/science.1179386
Yu LX and Amidon GL (1999) A compartmental absorption and transit model for
estimating oral drug absorption Int J Pharm 186:119-125.
This article has not been copyedited and formatted. The final version may differ from this version.DMD Fast Forward. Published on April 20, 2010 as DOI: 10.1124/dmd.110.032680
at ASPE
T Journals on D
ecember 23, 2021
dmd.aspetjournals.org
Dow
nloaded from
DMD #32680
33
FOOTNOTES
Address correspondence to: Dr. Harvey Wong, Drug Metabolism and Pharmacokinetics,
Genentech, Inc., 1 DNA Way, MS 412a, South San Francisco, CA, 94080. E-mail:
This article has not been copyedited and formatted. The final version may differ from this version.DMD Fast Forward. Published on April 20, 2010 as DOI: 10.1124/dmd.110.032680
at ASPE
T Journals on D
ecember 23, 2021
dmd.aspetjournals.org
Dow
nloaded from

DMD #32680
34
LEGENDS FOR FIGURES
Figure 1 Chemical structure of GDC-0449.
Figure 2 Physiological Oral Absorption Model.
Figure 3 Plasma GDC-0449 Concentration-time Profile of GDC-0449 Following a
Single 25 mg Intravenous (IV) Dose to Intact and Bile-Duct Cannulated Male
Dogs (n = 4 per group). The Duration of Bile Collection for Bile-Duct
Cannulated Dogs is Indicated on the Figure.
Figure 4 Mean GDC-0449 Plasma Concentrations Following a Single IV (25 mg/dog)
or PO (25 mg capsule/dog) Dose of GDC-0449, With Or Without
Administration of Activated Charcoal, in Male Beagle Dogs (n=4 per group).
The Duration of Oral Charcoal Treatment is Indicated on the Figure. Mean
Plasma Concentrations from Intact Male Dogs (IV) from the Bile-Duct
Cannulated Dog Study Shown in Figure 3 is Presented Here for Comparative
Purposes.
Figure 5 Mean Plasma Concentrations and Simulated Profiles on Day 1 (A) and Day 44
(B) for Male Dogs (n=5 per group) Given Twice Daily Doses of 7.5 mg/kg or
25 mg/kg GDC-0449. Corresponding Maximum Permeation Extraction Ratio
are Presented for Day 1 (C) and Day 44 (D).
This article has not been copyedited and formatted. The final version may differ from this version.DMD Fast Forward. Published on April 20, 2010 as DOI: 10.1124/dmd.110.032680
at ASPE
T Journals on D
ecember 23, 2021
dmd.aspetjournals.org
Dow
nloaded from
DMD #32680
35
Figure 6 Effect of Removal of Solubility Rate Limited Absorption (NO SRLA),
Removal of Non-SINK Conditions (SINK) and Removal of Non-Sink
Conditions and Solubility Rate Limited Absorption (SINK and NO SRLA) on
Simulated Day 1 Plasma Concentration-time Profiles for Male Dogs (n=5 per
group) Given Twice Daily Doses of 7.5 mg/kg (A) or 25 mg/kg (B) GDC-
0449.
Figure 7 Effect of Removal of Solubility Rate Limited Absorption (NO SRLA),
Removal of Non-SINK Conditions (SINK) and Removal of Non-Sink
Conditions and Solubility Rate Limited Absorption (SINK and NO SRLA) on
Simulated Steady-State (Day 44) Plasma Concentration-time Profiles for Male
Dogs (n=5 per group) Given Twice Daily Doses of 7.5 mg/kg (A) or 25 mg/kg
(B) GDC-0449.
Figure 8 Mean Plasma Concentrations and Simulated Profiles following PO
Administration of Two Different Particle Sizes of GDC-0449 (150 mg Total
Dose) to Male Dogs (n=6 per group).
Figure 9 Simulations Examining the Impact of Dose and Dosing Regimen on Observed
Particle Size Effects. Presented are Simulations for 600 mg QD on Day 1 (A)
and at Steady-State (B) and, 150 mg QID on Day 1 (C) and at Steady-State
(D).
This article has not been copyedited and formatted. The final version may differ from this version.DMD Fast Forward. Published on April 20, 2010 as DOI: 10.1124/dmd.110.032680
at ASPE
T Journals on D
ecember 23, 2021
dmd.aspetjournals.org
Dow
nloaded from

DMD #32680
36
Figure 10 Process of Oral Absorption
This article has not been copyedited and formatted. The final version may differ from this version.DMD Fast Forward. Published on April 20, 2010 as DOI: 10.1124/dmd.110.032680
at ASPE
T Journals on D
ecember 23, 2021
dmd.aspetjournals.org
Dow
nloaded from
DMD #32680
37
Table 1 Pharmacokinetics of GDC-0449 in Intact and Bile-Duct Cannulated Male Dogs
following administration of a single 25 mg Intravenous Dose.
Intact Dogs (n=4) Bile-Duct Cannulated Dogs (n=4)
Dose 25 mg IV 25 mg IV
CL (mL/min/kg) 0.132 ± 0.009 0.189 ± 0.009
Vss (L/kg) 0.940 ± 0.088 1.12 ± 0.0185
t1/2 (hr) 80.0 ± 13.8 68.3 ± 1.3
AUC0-∞ (µM×hr) 795 ± 80 636 ± 41
CLbiliary (mL/min/kg) - 0.0367 ± 0.0073
This article has not been copyedited and formatted. The final version may differ from this version.DMD Fast Forward. Published on April 20, 2010 as DOI: 10.1124/dmd.110.032680
at ASPE
T Journals on D
ecember 23, 2021
dmd.aspetjournals.org
Dow
nloaded from
DMD #32680
38
Table 2 GDC-0449 Concentrations and Exposures of GDC-0449 Following a IV (25 mg/dog) or PO (25 mg/capsule) Dose, With or Without Administration of Activated Charcoal to Male Dogs.
Treatment
C24hr (µM)
C96hr (µM)
AUC0-168 (µM×hr)
25 mg PO 0.650 ± 0.287 0.137 ± 0.093 48.4 ± 20.1
25 mg PO with Charcoal 0.847 ± 0.733 0.004 ± 0.005 25.9 ± 21.2
25 mg IVa 5.07 ± 0.61 3.16 ± 0.52 603 ± 57
25 mg IV with Charcoal 4.49 ± 0.42 0.018 ± 0.016 173 ± 24
AUC0-168 - area under the plasma concentration-time profile from time 0 to 168 hours post-dose; C24hr - plasma concentration at 24 hours post-dose; C96hr - plasma concentration at 96 hours post-dose. a Data from intact male dogs from bile-duct cannulated dog study. Data presented here for comparative purposes.
This article has not been copyedited and formatted. The final version may differ from this version.DMD Fast Forward. Published on April 20, 2010 as DOI: 10.1124/dmd.110.032680
at ASPE
T Journals on D
ecember 23, 2021
dmd.aspetjournals.org
Dow
nloaded from
DMD #32680
39
Table 3 Oral Pharmacokinetics of GDC-0449 in Male Dogs (n=5 per group) on Day 1 and Day 44 Following Continuous Dosing of 7.5 mg/kg BID or 25 mg/kg BID GDC-0449.
Treatment
Day
Cmax (µM)
tmax (hr)
AUC0-24 (µM×hr)
7.5 mg/kg BID
1 8.07 ± 0.59 10.0 (10.0-24.0) 146 ± 13
44 43.7 ± 3.9 0.0
(0.0-5.75) 869 ± 96
25 mg/kg BID
1 18.1 ± 1.9 24.0 (10.0-24.0) 316 ± 39
44 41.8 ± 5.9 1.0 (0.0-24.0) 883 ± 113
AUC0-24 - area under the plasma concentration-time profile from time 0 to 24 hours post-dose (timed following the first daily dose); Cmax – highest observed plasma concentration; tmax – time at which Cmax occurred (0.0 hr refers to the pre-dose sample).
This article has not been copyedited and formatted. The final version may differ from this version.DMD Fast Forward. Published on April 20, 2010 as DOI: 10.1124/dmd.110.032680
at ASPE
T Journals on D
ecember 23, 2021
dmd.aspetjournals.org
Dow
nloaded from

DMD #32680
40
Table 4 Effect of Particle Size On Oral Exposures of GDC-0449 following PO Administration of Capsules Containing a 150 mg Total Dose to Male Dogs (n=6 per group)
Treatment
Cmax (µM)
tmax (hr)
AUC0-168 (µM×hr)
150 mg capsule
(Small Particles) 8.12 ± 4.01 4.0
(4.0-4.0) 453 ± 271
25 + 125 mg capsules
(Large Particles) 2.66 ± 1.56 3.0
(1.0-4.0) 150 ± 95
AUC0-168 - area under the plasma concentration-time profile from time 0 to 168 hours post-dose; Cmax – highest observed plasma concentration; tmax – time at which Cmax occurred.
This article has not been copyedited and formatted. The final version may differ from this version.DMD Fast Forward. Published on April 20, 2010 as DOI: 10.1124/dmd.110.032680
at ASPE
T Journals on D
ecember 23, 2021
dmd.aspetjournals.org
Dow
nloaded from

This article has not been copyedited and formatted. The final version may differ from this version.DMD Fast Forward. Published on April 20, 2010 as DOI: 10.1124/dmd.110.032680
at ASPE
T Journals on D
ecember 23, 2021
dmd.aspetjournals.org
Dow
nloaded from
This article has not been copyedited and formatted. The final version may differ from this version.DMD Fast Forward. Published on April 20, 2010 as DOI: 10.1124/dmd.110.032680
at ASPE
T Journals on D
ecember 23, 2021
dmd.aspetjournals.org
Dow
nloaded from
This article has not been copyedited and formatted. The final version may differ from this version.DMD Fast Forward. Published on April 20, 2010 as DOI: 10.1124/dmd.110.032680
at ASPE
T Journals on D
ecember 23, 2021
dmd.aspetjournals.org
Dow
nloaded from
This article has not been copyedited and formatted. The final version may differ from this version.DMD Fast Forward. Published on April 20, 2010 as DOI: 10.1124/dmd.110.032680
at ASPE
T Journals on D
ecember 23, 2021
dmd.aspetjournals.org
Dow
nloaded from
This article has not been copyedited and formatted. The final version may differ from this version.DMD Fast Forward. Published on April 20, 2010 as DOI: 10.1124/dmd.110.032680
at ASPE
T Journals on D
ecember 23, 2021
dmd.aspetjournals.org
Dow
nloaded from

This article has not been copyedited and formatted. The final version may differ from this version.DMD Fast Forward. Published on April 20, 2010 as DOI: 10.1124/dmd.110.032680
at ASPE
T Journals on D
ecember 23, 2021
dmd.aspetjournals.org
Dow
nloaded from

This article has not been copyedited and formatted. The final version may differ from this version.DMD Fast Forward. Published on April 20, 2010 as DOI: 10.1124/dmd.110.032680
at ASPE
T Journals on D
ecember 23, 2021
dmd.aspetjournals.org
Dow
nloaded from

This article has not been copyedited and formatted. The final version may differ from this version.DMD Fast Forward. Published on April 20, 2010 as DOI: 10.1124/dmd.110.032680
at ASPE
T Journals on D
ecember 23, 2021
dmd.aspetjournals.org
Dow
nloaded from

This article has not been copyedited and formatted. The final version may differ from this version.DMD Fast Forward. Published on April 20, 2010 as DOI: 10.1124/dmd.110.032680
at ASPE
T Journals on D
ecember 23, 2021
dmd.aspetjournals.org
Dow
nloaded from
This article has not been copyedited and formatted. The final version may differ from this version.DMD Fast Forward. Published on April 20, 2010 as DOI: 10.1124/dmd.110.032680
at ASPE
T Journals on D
ecember 23, 2021
dmd.aspetjournals.org
Dow
nloaded from