interplay of physical, chemical and biological components ... · interplay of physical, chemical...
TRANSCRIPT

10
Interplay of Physical, Chemical and Biological Components in Estuarine Ecosystem with
Special Reference to Sundarbans, India
Suman Manna1, Kaberi Chaudhuri1, Kakoli Sen Sarma1, Pankaj Naskar1, Somenath Bhattacharyya1 and Maitree Bhattacharyya2*
1Institute of Environmental Studies and Wetland Management, 2Department of Biochemistry, University of Calcutta,
Kolkata India
1. Introduction
An estuary is a partly enclosed coastal body of water with one or more rivers or streams flowing into it, and with a free connection to the open sea. (Jara-Marin et al., 2009; Crossland et al. 2005). They are the transition zones or ecotones between riverine and marine habitats, which differ both in abiotic and biotic factors (McLusky & Elliott, 2004) but many of their important physical and biological attributes are not transitional, but unique. These highly dynamic and rapidly changing systems form a complex mixture of many different habitat types. These habitats do not exist in isolation, but rather have physical, chemical and biological links between them, for example, in their hydrology, in sediment transport, in the transfer of nutrients and in the way mobile species move between them both in seasonally and single tidal cycles. The most distinctive feature that contrasts estuaries from other biomes is the nature and the variability of the physicochemical forces that influence this ecosystem. In contrast the low diversity, the estuarine ecosystems achieve very high productivities through the continuous arrival of new nutrients supply. They are very productive biomes and support many important ecosystem functions like biogeochemical cycling and movement of nutrients, mitigation of floods, maintenance of biodiversity and biological production (Patrick et. al., 2005). The estuarine environment is characterized by a constant mixing of freshwater, saline seawater, and sediment, which is carried into the estuary from the sea and land. The mixture and fluctuation of salt and freshwater impose challenges to the animals and microbes. Along the gradient of conditions from the open sea into the sheltered estuary the salinity ranges from full strength seawater to freshwater, and sedimentary conditions also varies from fine sediment to coarse sediments. Other changes include nutrient input, pollutant and chemical concentration along with estuarine flows (McLusky & Elliott, 2004). The productivity and variety of estuarine habitats support a wonderful abundance and diversity of species.
*Corresponding Author

Ecological Water Quality – Water Treatment and Reuse
206
The ecosystem of any estuary is dependent on both the natural processes (like tide, current, bathymetry, nutrient influx etc) as well as anthropogenic activities (like agriculture, aquaculture etc in the adjoining land part and/or the number and frequency of mechanized boats, trawlers plying within the estuary etc). The entire process is extremely complicated where a balance is achieved through interaction between different components, not clearly well understood so far in many estuaries. The movement of water mass and consequent circulation pattern within an estuary is dependent and thereby should be considered as a response to astronomical tides, inflow of fresh water (i. e. head ward discharge of the fresh water), winds, density of saline water and consequent stratification of different water column etc. At the same time, the basin topography (bathymetry), air-water interaction, water sedimentation interface, mixing characteristics, frictional loss at the bottom, and the rotational effects of the earth, together with the above mentioned driving forces, constitute an extremely complicated balance that conserves mass, momentum, energy, and conservative solutes in the system.
Estuaries are highly dynamic systems with large seasonal and spatial gradients of biogeochemical compounds and processes. Linking land to the ocean, they are often greatly influenced by human activities, including enhanced organic matter and nutrient loadings. Among other parameters, the balance between organic matter and nutrient loading is critical in determining the balance between autotrophy and heterotrophy at the ecosystem level (Kemp et. al., 1997). Estuarine dynamics has been well studied in temperate system such as Chesapeake Bay (Boynton et. al., 1982), San Francisco Bay (Cloern, 1996) and the Baltic sea (Conley et. al., 2000). Tropical and subtropical estuaries received comparatively less study but are experiencing noticeable anthropogenic alterations (Eyre, 1997). Sundarbans is an example of tropical, nutrient rich and turbid estuary.
2. Unique features of Sundarbans estuary
Sundarbans is the largest deltaic tidal halophytic mangrove forest in the world, (Blasco, 1977) with an area of 10, 200 sq km area, spreading over India (4263 sq km of Reserve forest) and Bangladesh (5937 sq km of Reserve forest) (Fig 1). Sundarbans, world’s largest delta (80, 000 sq. km. ) formed from sediments deposited by three great rivers, the Ganges, Brahmaputra and Meghna, which converges on the Bengal Basin. The area experiences a subtropical monsoon climate with annual rainfall of about 1600-1800 mm and several cyclonic storms (Manna et. al., 2010).
Indian Sundarbans is known as Hoogly-Matla estuary (Hooghly is the Lower part of River Ganges), where apart from Hoogly and Matla, there are innumerable big & small rivers criss-crossing the Sundarbans namely Bidya, Saptamukhani, Raimangal, Muriganga, Thakuran, Gomor etc. Many rivers have become almost completely cut off from the main freshwater sources (Sanyal & Bal, 1986) as for example Bidya, Matla are devoid of fresh water connection due to siltation in the upstream region and are converted into tidal creeks.
Sundarbans is intersected by a complex network of tidal waterways, mudflats and small islands of salt-tolerant mangrove forests. The waterways in this tiger reserve are maintained largely by the diurnal tidal flow (Lahiri, 1973). Sundarbans is known for the eponymous Royal Bengal Tiger (Panthera tigris tigris), as well as numerous fauna including species of birds, spotted deer, crocodiles and snakes.

Interplay of Physical, Chemical and Biological Components in Estuarine Ecosystem with Special Reference to Sundarbans, India
207
Fig. 1. Geographical location of Sundarban estuary, India
Sundarban delta has the distinction of encompassing the world's largest Mangrove Forest belt and has been identified as World natural heritage site by UNESCO in 1974, National park in 1984 and World heritage site by IUCN in 1989. The mangrove ecosystems in Indian Sundarbans are well known not only for the aerial extent, but also for the species diversity and richness. The biodiversity of Sundarbans includes about 350 species of vascular plants, 250 fishes and 300 birds, along with numerous species of phytoplankton, fungi, bacteria, zooplankton, benthic invertebrates, molluscs, reptiles, amphibians and mammals (Gopal & Chauhan, 2006) It is natural habitat of many rare and endangered species including the Royal Bengal tiger ((Panthera tigris) and it is the only mangrove tiger land in the world. Other important species are Estuarine Crocodile (Crocodilus porosus), Gangetic Dolphin (Platinista gangetica), Snubfin dolphin (Orcella brevirostris), River Terrapin (Batagur baska), Batagur baska, Pelochelys bibroni, Chelonia mydas., marine turtles like Olive Ridley (Lepidochelys olivacea), Green Sea Turtle (Chelonia mydas), Hawksbill Turtle (Eritmochelys imbricata), thus making it a natural biodiversity hot spot.
3. Mangrove of Sundarbans
Mangroves are a community of trees and shrubs growing in intertidal forested wetlands restricted to the tropical and subtropical regions (Tomlinson, 1986). Total global area of mangrove forest is estimated to only 18. 1 million ha (Spalding et. al., 1997), against over 570 million ha of freshwater wetlands including peat lands but excluding paddy fields (Spiers et. al., 1999). Mangroves are the only woody halophytes dominated ecosystem situated at the confluence of land and sea, they occupy a harsh environment, being daily subject to tidal

Ecological Water Quality – Water Treatment and Reuse
208
changes in temperature, water, salt exposure and varying degree of anoxia (Alongi, 2002). Mangrove forests are recognized as highly productive ecosystems that provide large quantities of organic matter to adjacent coastal waters in the form of detritus and live animals (Holguin et. al., 2001). They provide critical habitat for a diverse marine and terrestrial flora and fauna. Healthy mangrove forests are key to healthy marine ecology. They may be considered as self maintaining coastal, inter-tidal estuarine compartment, which thrives due to constant interaction with terrestrial and marine ecosystem. They are vital to coastal communities as they protect them from damage caused by tsunami waves, erosion, and storms and serve as a nursery for fish and other species that support coastal livelihoods. In addition, they have a staggering ability to sequester carbon from the atmosphere and serve as both a source and repository for nutrients and sediments for other inshore marine habitats.
Sundarbans mangrove estuarine ecosystem is one of the largest detritus-based ecosystems of the world (Pillay, 1958 and Ray, 2008). Litterfall of mangroves supplies the detritus and nutrients regulating the productivity of adjacent Hooghly–Brahmaputra estuarine complex which act as an important nursery ground for many commercially important shell and fin fishes. Due to large scale human intervention from the beginning of last century, several species have become extinct or are in very much threatened or degraded state (Gopal &Chauhan, 2006; Sodhi & Brok, 2007), The loss of the mangroves will have devastating economic and environmental consequence. Royal Bengal tiger, Javan rhino, wild buffalo, hog deer, and barking deer are on the verge of extinction. But any systematic approach towards studying the ecosystem dynamics of Sundarbans has not been attempted so far (Alongi, 2009;Gopal & Chauhan, 2006), where we have attempted to fill in the gaps and create a road map for the sustenance of this World heritage site.
4. Materials and methods
4.1 Physico-chemical analysis
4.1.1 Tidal velocity and current speed
Tide measurement was performed by Valeport MIDAS WTR non directional tide gauge serial no. 34890 (Valeport, U. K). The MIDAS WTR Wave Recorder uses the proven Linear Wave. The MIDAS WTR Wave Recorder uses the proven Linear Wave Theory wave analysis method of measurement. It has high accuracy piezo-resistive pressure sensors and a fast response PRT temperature sensor as standard. Current speed and direction was measured with Aanderra made Doppler Current Sensor 4420 Serial no. 282 Signal type CANbus.
4.1.2 Water quality parameters
Water temperature, pH and conductivity were measured in situ with Hach Portable Meters (HQ40d). Turbidity was measured by using portable turbidity meter (Hach 2100P), salinity was determined in practical salinity units by Knudsen method (Knudson, 1901), dissolved oxygen concentration was studied according to the method of Winkler (JGFOS Protocol, 1994) nutrients like inorganic nitrogen (ammonia, nitrite, nitrate, total nitrogen), soluble phosphate, total phosphate, and reactive silicate were measured according to the same methodology (JGFOS Protocol, 1994).

Interplay of Physical, Chemical and Biological Components in Estuarine Ecosystem with Special Reference to Sundarbans, India
209
4.2 Biological analysis
4.2.1 Phytoplankton biomass (Chlorophyll-a)
Chlorophyll samples were filtered through Whatman GF/F (0. 45 μ) filters and extracted in acetone in dark and refrigerated condition. Chlorophyll-a was determined spectrofluorimetrically (Ventrick & Hayward, 1984).
4.2.2 Phytoplankton cell density
Direct estimation of phytoplankton cell abundance and diversity was performed by cell counting method. Surface phytoplankton was collected and the Lugol’s preserved subsamples (1-2 liter) were used for quantitative enumeration utilizing a Sedgwick-Rafter counting chamber and Zeiss research microscope according to UNESCO PROTOCOL (1978). Several keys and illustration were consulted to confirm identification (Perry, 2003; Tomas, 1997).
4.2.3 Zooplankton abundance and diversity
Zooplankton samples were collected monthly basis both in night and day time for comparative and quantitative assay. Collection was performed both vertically and horizontally. A long Bongo net, with mesh size 150 µm was used to collect sample. The volume of water flowing through the net was measured by a digital flow meter (Model no. - 2030R, General oceanics).
4.2.4 Bacterioplankton abundance
Fluorescence microscope was used to estimate the total number of bacteria. Immediately after sampling, 50 ml of seawater was preserved with 25% gluteraldehyde (0. 2-μm-prefiltered) and stored in cold dark environment to prevent reduction of counts. Cells of bacteria were collected onto a 25-mm black polycarbonate nucleopore membrane with a 0. 2 μm pore size and stained with acridine orange. At least twenty random fields were counted in a Zeiss confocal fluorescence microscope coupled with an image analysis system (Bianchi & Giuliano, 1995; Hobbie et. al., 1976). Viable count of Bacterial colonies was also performed using Luria-Bertani medium by serial dilution method (Cappuccino & Sherman, 2007).
4.2.5 Primary productivity
Primary productivity of water was measured by light and dark bottle method according to the guidance of APHA(1998). Samples collected from each pre selected depth (on the basis of light availability) were taken in triplicate light bottles. Dissolved oxygen of the initial bottles was fixed with NaI-NaOH and MnCl2 in the beginning of incubation period. At the end of the incubation period light and dark bottles were similarly fixed and all the bottles were brought back to laboratory in cold condition for analysis. Then dissolved oxygen concentrations were estimated by Winkler’s method (JGFOS Protocol, 1994). NPP (net primary productivity), CR (community respiration) and GPP (gross primary productivity) can be estimated using the following equations

Ecological Water Quality – Water Treatment and Reuse
210
- NPP = Light bottle – Initial bottle - CR = Initial bottle – Dark bottle with nitrification inhibitor. - GPP = Net primary productivity + community respiration
4.3 Statistical analysis
The results were expressed as differences between the groups considered significant at p < 0. 05. Data comparison and influence of the environmental factors on phytoplankton were evaluated by stepwise multiple regression (Manna et. al., 2010) Different statistical analysis and correlation regression analysis were performed using the software STATISTICA.
5. Results and discussions
5.1 Hydrodynamic parameters and their significance
Basic objective of hydrodynamic study is to understand the processes active within the tidal estuaries of Sundarbans; to develop methods so as to quantify the relative importance of river inflow discretely with respect to other forcing parameters like wind, tide, earth’s movement etc as a dynamic forcing; to understand the relative importance of flow pattern as well as quantum of water coming as an input/output from different channels (creeks). Water movement and the consequent distributions of nutrients and other chemicals in an estuary are dependent on the hydrodynamic condition of the estuary. A hydrodynamic model is therefore a tool to understand the distribution pattern and availability of different nutrients within the estuary. This model is dependent on many physical parameters like tidal discharge, wave and meteorological forcing. In an estuarine condition, at the seaward boundary, tidal forcing drives the model. Tidal regime in an estuary ultimately determines the amount of sea water to be pushed into the estuary from the open sea carrying sediments as well as nutrients. Thus the boundary tide is most important and is usually specified by a water level time series, a velocity time series or a set of tidal harmonics. All these data need to be acquired from a set of water level measurements using different kinds of tide gauge and current meters. Unfortunately, for Sundarbans, such work has yet to be carried out. The freshwater discharges from rivers at the uplands also play an important role.
Sundarbans can be characterized with six North – South bound estuaries namely, Saptamukhi, Thankuran, Matla, Bidya, Goasaba and Raimongal. Each of these estuaries is different from each other in hydrodynamic set up. Except Raimongal, none of these estuaries are having freshwater discharge at head ward portion. These estuaries are more than 70 kilometers in length starting from its head ward point to the meeting point at the Bay of Bengal. A considerable portion of these estuaries pass through the inhabited islands, from where the supply of nutrients is in the form of agricultural field wash and aquaculture pond effluents and hardly any mangrove detritus is available. Thus, the availability of nutrients in these estuaries depends on the mixing within the estuaries, which in turn depends on tides and current.
Perhaps the most important data required is for tidal and surge information, however such data are almost entirely absent at the moment (Bhattacharyya et al, 2011). Delta Project report of 1968 (Delft, 1968) may be considered as the only published account of tidal range in Sundarbans. One permanent tide gauge station is located at Sagar Island in the Hooghly

Interplay of Physical, Chemical and Biological Components in Estuarine Ecosystem with Special Reference to Sundarbans, India
211
Estuary and, although records have been kept here since 1937 these are a made using visual staff record operating only during daylight hours and are therefore incomplete. In order to overcome this problem, automatic tide gauge (Valeport make) instruments were placed within several estuaries of Sundarbans which indicated certain interesting hydrodynamic condition.
0
0.5
1
1.5
2
2.5
3
3.5
4
4.5
5
Date
19-12-09
20-12-09
20-12-09
21-12-09
22-12-09
23-12-09
23-12-09
24-12-09
25-12-09
25-12-09
26-12-09
27-12-09
28-12-09
28-12-09
29-12-09
30-12-09
31-12-09
31-12-09
01-01-20
1001
-02-20
1001
-03-20
1001
-03-20
1001
-04-20
1001
-05-20
1001
-06-20
1001
-06-20
1001
-07-20
1001
-08-20
1001
-09-20
1001
-09-20
1001
-10-20
1001
-11-20
1001
-12-20
1001
-12-20
1013
-01-10
14-01-10
15-01-10
15-01-10
16-01-10
17-01-10
18-01-10
18-01-10
19-01-10
20-01-10
20-01-10
Fig. 2. Tidal fluctuation in Saptamuki mouth near Sitarampur
Fig. 3. Saptamukhi tides (in meters) December 2009 Red graph indicates tide at the mouth of Saptamukhi while blue colour indicates tidal fluctuation at Milon More about 50 kilometers away from the Saptamukhi mouth

Ecological Water Quality – Water Treatment and Reuse
212
It was observed that tidal range along the Sundarbans estuaries vary from place to place within the estuary. On an average, tidal fluctuation in Sundarbans estuary is around 5 meters depending on the lunar cycle, as is evident from the Figure. 2. But, tidal fluctuation near the mouth is comparatively smaller in range. As the tidal current pushes within the estuary, tidal range increases due to funneling effect of estuary. In case of Sundarbans, after travelling a certain distance tidal fluctuation starts receding due to bed resistance and ultimately dies down. It is quite interesting to observe the tidal regime along the estuary since ultimately this determines the availability of nutrients within the estuary.
During the period of the present study two automatic tide gauges were simultaneously deployed in the Saptamukhi estuary – one near its mouth (where the width of the estuary is about 1. 3 kilmeters) with Bay of Bengal and the other at the head ward position at a place near Milan More (where the width of estuary is only 60 meters), at a distance of about 50 kilometer northwards from the first tide gauge. Incidentally, Saptamukhi is the westernmost estuary in Sundarbans and a number of mangrove islands including Lothian Island (which is a wildlife sanctuary) are located within it. The variance in tidal behavior pattern is quite obvious (Fig. 3).
It was interesting to note, that near the mouth tide is essentially symmetric in nature indicating that the time taken by high tide to reach the climax is exactly the same as that of low tide. Hence there is no additional residence time of tidal water within the estuary. However, at the Milon More, the tide is asymmetric in nature indicating that time taken by high tide to reach climax is much less compared to that of draining out of tidal water during ebb tide. Current speed within Sundarbans was found to be varying between 140 to 180 cm/sec. The current direction also is also controlled by the geomorphology of the creeks.
The Sundarbans estuary is thus a flood dominated estuary. The nutrient rich tidal water has a more residence time within estuary which is being used by the phytoplankton, the primary producer of this ecosystem. Thus the hydrodynamic set up helps in making this estuary so productive. It should be mentioned that the mangrove islands are all sea facing and water present within the creeks and estuary around the mangrove forest are always rich in nutrient, which is pushed well inside the estuary through tidal water.
Fig. 4. ‘V’ Component i. e. North-South bound current at Bhangadunia Island, Sundarbans
Interplay of Physical, Chemical and Biological Components in Estuarine Ecosystem with Special Reference to Sundarbans, India
213
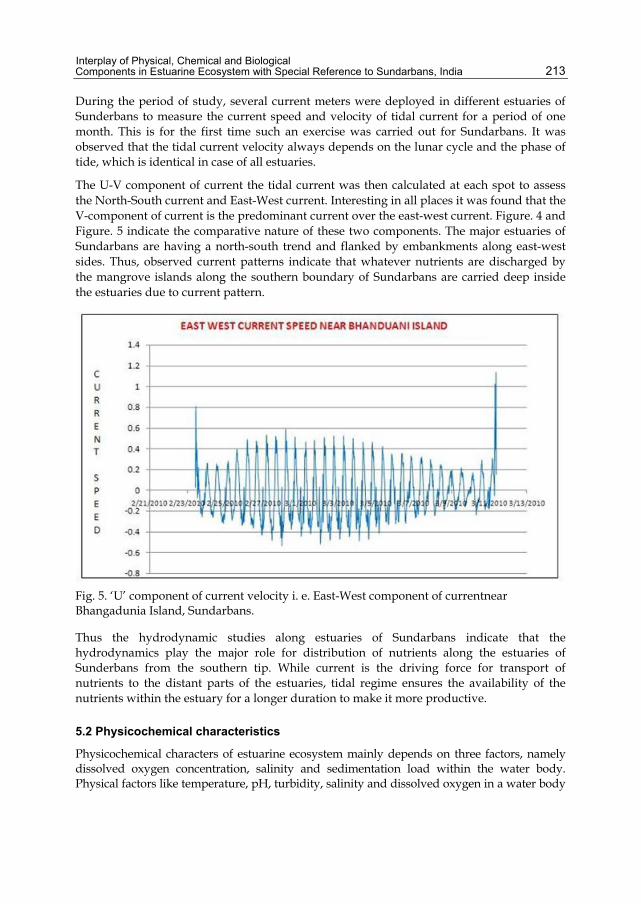
During the period of study, several current meters were deployed in different estuaries of Sunderbans to measure the current speed and velocity of tidal current for a period of one month. This is for the first time such an exercise was carried out for Sundarbans. It was observed that the tidal current velocity always depends on the lunar cycle and the phase of tide, which is identical in case of all estuaries.
The U-V component of current the tidal current was then calculated at each spot to assess the North-South current and East-West current. Interesting in all places it was found that the V-component of current is the predominant current over the east-west current. Figure. 4 and Figure. 5 indicate the comparative nature of these two components. The major estuaries of Sundarbans are having a north-south trend and flanked by embankments along east-west sides. Thus, observed current patterns indicate that whatever nutrients are discharged by the mangrove islands along the southern boundary of Sundarbans are carried deep inside the estuaries due to current pattern.
Fig. 5. ‘U’ component of current velocity i. e. East-West component of currentnear Bhangadunia Island, Sundarbans.
Thus the hydrodynamic studies along estuaries of Sundarbans indicate that the hydrodynamics play the major role for distribution of nutrients along the estuaries of Sunderbans from the southern tip. While current is the driving force for transport of nutrients to the distant parts of the estuaries, tidal regime ensures the availability of the nutrients within the estuary for a longer duration to make it more productive.
5.2 Physicochemical characteristics
Physicochemical characters of estuarine ecosystem mainly depends on three factors, namely dissolved oxygen concentration, salinity and sedimentation load within the water body. Physical factors like temperature, pH, turbidity, salinity and dissolved oxygen in a water body

Ecological Water Quality – Water Treatment and Reuse
214
vary quickly relative to biological and chemical transformations. In general, the estuarine environment is oxidizing near the sediment–water interface and more reduced deeper in the sediment. The estuarine circulation movements are the primary mechanism to change the distribution profile of dissolved material in time and space in fresh and ocean water.
5.3 Temperature, pH, turbidity, salinity and dissolved oxygen
Sundarbans are located on shores in the tropics and enjoys tropical monsoon type of climates. The average rainfall of the region amounts to approximately 1750-1800 mm. summer and winter temperature varies between 260C-400C . The temperature of the surface water varied between 210 C-350C and significant variation is observed in temperature of different locations in the estuary.
Sundarbans estuarine pH levels generally average from 7. 0 - 7. 5 in the fresher sections, between 8. 0 - 8. 6 in the saline areas. Slightly alkaline pH of seawater is due to the natural buffering from carbonate and bicarbonate dissolved in the water (Volunteer Estuary Monitoring, 2006). The pH values of the Sundarbans estuary were slightly basic and remained almost constant (7. 9-8. 2) except during the monsoon months when a slight but insignificant decrease was noticed.
Turbidity indicates water clarity and it is the measured by light scattering by suspended particles in the water column. Several factors are responsible for water turbidity; suspended soil particles (including clay, silt, and sand); tiny floating organisms (e. g., phytoplankton, zooplankton, and bacterioplankton); and small fragments of dead plants (Voluntary Estuary Monitoring Manual, 2006). In Sundarbans estuary turbidity ranges from 35-150 NTU, and highest index being observed in monsoon.
In estuaries mixing of sea water with fresh water causes brackish water to be more saline than fresh water but less saline than sea water. Salinity of estuaries usually increases away from a freshwater source such as a river, although evaporation sometimes causes the salinity at the head of an estuary to exceed seawater. Vertical salinity structure and nature of salinity variation along an estuary is the unique feature of coastal water ways (Santoroet. al. 1989). Sundarbans estuary situated in the delta of Bay of Bengal showed salinity gradient from the upstream to the downstream part and also margin to central part (Baidya, & Choudhury, 1984). In Sundabans estuary salinity ranges from 11-25 PSU, being highest in dry season and lowest in wet season (Manna et. al., 2010). In Sundarbans estuary tidal action is very strong and practically it is the only regulatory factor, thus water is well mixed from top to bottom and the salinity approaches that of the open sea.
5.4 Dissolved oxygen (DO)
DO is one of the most important controlling factor regulating presence of estuarine species. In addition to support respiration, oxygen is needed for decomposition, an integral part of an estuary’s ecological cycle is the breakdown of organic matter (Volunteer Estuary Monitoring Mannual, 2006). DO concentration in the water column is highly dependent on temperature, salinity and biological activity. Tidal estuaries are generally characterized by high DO level. Dissolved oxygen concentration was steady all along the stretch over Sundarban estuary varying between 3. 3 to 9. 5 mg/L with comparatively higher values during November-February (bloom season).

Interplay of Physical, Chemical and Biological Components in Estuarine Ecosystem with Special Reference to Sundarbans, India
215
5.5 Nutrients
Autotrophic nutrients are important for estuarine ecosystems and are essential for sustenance of the marine ecosystems because they are the raw materials for primary producers. Main estuarine nutrients include phosphate, nitrate, nitrite, ammonia and silicate. Nitrogen, phosphorus and silica are the key nutrients that generally limit phytoplankton growth in natural waters. Silicate is a primary growth limiting nutrient for diatoms. It is reported that N-limitation is a wide spread phenomenon in tropical lakes rivers and estuaries, e. g., Mandovi-Zuari (Ram et al., 2003), Cochin estuary (Gupta et. al., 2009) and Hoogly estuary (Mukhopadhyay et al., 2006). Sundarbans estuary was phosphorus limited in postmonsoon and nitrogen-limited in premonsoon and monsoon. However, seasonal phosphorous limitation characteristic was found in several estuaries (eg. Gle et al. 2008; Xu et al. 2008). Sundarbans estuary is a nutient rich tropical estuary with high nutrient influx, where a huge quantity of leaf litter is loaded to the estuarine water from adjacent mangrove forests. Besides, land mass wash off during monsoon and drainage waste from shrimp culture farms also contributed to this huge nutrient load. In Sundarban estuary the phosphate concentration varied from 0. 4 to1. 0 µmol/L, the nitrate concentration varied from 2. 4-39. 9 µmol/L, nitrite concentration ranged from 0. 6-1. 6 µmol/L and silicate concentration varied from 4. 8 to 49. 1 µmol/L.
Seasonal variation of Nutrient concentration
0
10
20
30
40
50
60
Postmonsoon Premonsoon Monsoon
Seasons
Nu
trie
nt
con
cen
trat
ion
(µ
M)
Nitrite
Nitrate
Ammonia
TN
Silicate
TP
Fig. 6. Seasonal variation of nutrient concentration (µmole L-1) in Sundarban estuary.

Ecological Water Quality – Water Treatment and Reuse
216
6. Biological components
6.1 Autotrophic nutrition and food web
In an estuary, the plants and other primary producers (algae) convert energy into living biological materials (Ryther, 1969). Detritus feeders, plant grazers, and zooplankton are the primary consumers, and the secondary consumers and tertiary consumers include estuarine birds, ducks, invertebrate predators, and fish. Excreta and detritus pass to the decomposer tropic level where microorganisms break down the material. At each stage in this trophic sequence matter and energy are consumed, and some of it is excreted as waste, or converted into body growth or heat after respiration (McLusky and Elliott, 2004).
Plankton is one of the important components of any aquatic ecosystem among which phytoplanktons are the primary source of food in the marine pelagic environment, initiating the food-chain which may culminate even in large mammals (Waniek and Holliday, 2006). Studies of phytoplankton are essential to understand food chain dynamics in aquatic ecosystems (Sieburth and Davis, 1982). In oligotrophic waters, the base of the food chain is composed of very small cells in the size range 0. 2–2 μm [‘picoplankton’ (Sieburth et al., 1978)] and the microbial loop dominates the pelagic food web (Fenchel, 1988). Conversely, when an import of mineral nutrients takes place, the base of the food chain comprises larger phytoplankton (diatoms and dinoflagellates), which are more readily eaten by zooplanktons; under these conditions, the classic pelagic food chain dominates (Fenchel, 1988). Autotrophic picoplankton [‘picophytoplankton’ (Fogg, 1986)] is represented by prokaryotic coccoid cyanobacteria, frequently of the genus Synechococcus, prochlorophytes (Chisholm et al., 1988) and small eukaryotic cells (Johnson and Sieburth, 1982). Picophytoplankton is important contributors to total phytoplankton biomass and primary production in all aquatic environments (Stockner, 1988). They dominate the total phytoplankton biomass and production in oligotrophic environments (Fogg, 1986; Weisse, 1993).
Phytoplankton biomass and primary production mainly depend on nutrient dynamics of coastal and estuarine ecosystems (Nixon, 1995; Cloern, 1999). Estuarine phytoplankton production is mostly dependent on either nutrient or light availability (Riley, 1967; Williams, 1972; Fisher et al, 1982). In case of nutrient rich turbid estuaries light is the major controlling factor and restricted light availability may alter phytoplankton production (Wofsy, 1983; Pennock, 1985; Harris, 1978;Falkwski, 1980). Estuarine dynamics is well studied in temperate system such as Chesapeake Bay (Bonyton et. al. 1982; Hording, 1994; Kemp et. al., 2005), San Francisco Bay (Review: Cloern, 1996), and the Baltic sea (Graneli et. al., 1990; Conley, 2000).
6.2 Heterotrophic bacterial production
The production and structure of aquatic ecosystems depend on interactions between energy mobilizers, i. e., phytoplankton and bacterioplankton (Jones, 1992) and the abiotic factors that control their activity (Jones, 1998). Bacteria can vary from being consumers of energy released by phytoplankton, to be independent mobilizers of energy to the ecosystem, using carbon compounds imported from the catchment as a source (allochthonous carbon) of energy (Jones, 1992) Consequently, the role of bacteria as an energy mobilizer for the pelagic ecosystem increases with increasing input of allochthonous DOC (Jansson et. al., 2000).

Interplay of Physical, Chemical and Biological Components in Estuarine Ecosystem with Special Reference to Sundarbans, India
217
Therefore bacterioplankton may be regarded as a highly important component of the pelagic ecosystem. In case of mangrove dominated Sunderbans estuary where a huge quantity of leaf litters is loaded to the adjacent estuarine water nitrogen may be the main currency in determining overall productivity and heterotrophic bacterial production may exceed phytoplankton primary production.
Many different factors may control the heterotrophic bacterial activity of aquatic ecosystem namely, temperature (Oachs et. al., 1995; Rae & Vincent; 1998), inorganic nutrients (Jansson et. al., 1996; Kroer, 1993), dissolved organic carbon (Tranvik, 1988; Hobbie et. al., 1996) etc. Organic carbon metabolism of clear water bodies like lakes usually dominated by autochthonous sources (Baron et. al., 1991) because of low export of organic matter from surrounding soils whereas in case of nutrient rich estuaries and bays receiving high loading of allochthonous DOC, the bacteria may be relieved of their close dependency on phytoplankton carbon. This may cause bacteria growth to be limited by nutrients (Jansson et. al, 1996; Kroer 1993). Temperature also affects the bacterial growth rate (Oachs et. al., 1995; Rae & Vincent 1998, Tulonen et. al., 1994). In case of nutrient rich Sunderbans estuary bacterial population showed an exponential relationship with temperature (Manna et. al., 2010).
6.3 Community respiration and nitrification
In a water body all the living organisms respire and consume oxygen (O2). Respiration provides a simple and straightforward measure of heterotrophic activity that can be directly related to the oxidation of organic matter (Willlams, 1981; Hopkinson et al., 1989 & Biddanda et al., 1994) and it is regarded as a key index of the energy used by consumers at a given time and place (Biddanda et. al., 1994 & Pomeroy et. al., 1968).
Episodic oxygen depletion in the water column is a common feature in many coastal and estuarine areas during summer (Turner & Rabalais, 1991; Kemp et al., 1992). In a variety of estuaries nitrification is a major contributor to total pelagic oxygen consumption(Kausch, 1990; Pakulsht, 1995) and records of nitrification rate in addition to primary production and respiration can be an important parameter to understand variations in oxygen concentration in the water column. However, few measurements of the actual rates of pelagic nitrification have been reported from coastal and estuarine waters and studies on factors regulating marine nitrification are still scant in literature (Owens, 1986; Berounsky & Nixon, 1993).
Sunderbans estuary is designated as a moderately productive estuary with an annual integrated phytoplankton production rate of 2. 9 -5. 4 µgC/L/hr and community respiration 1. 75-3. 2 µgC/L/hr (Unpublished data).
Seasons GPP(µgC/L/hr) CR (µgC/L/hr)
Postmonsoon 4. 5-5. 4 1. 75-1. 95
Premonsoon 4. 2-4. 4 2. 2-3. 2
Monsoon 2. 9-3. 5 1. 8-2. 07
Table 1. Seasonal variation of primary productivity in Sundarban estuary

Ecological Water Quality – Water Treatment and Reuse
218
6.4 Processes associated with microorganisms
Cycle of energy and matter in estuaries is closely related with microbial activity, half of the aerobic and anaerobic transformations of organic matter in salt marsh are the result of microbial metabolism. Chemical transformation mediated by marine microbes play a critical role in global biogeochemical cycles. Coastal regions show the highest concentration of nutrients and microorganisms and the least light penetration whereas the open ocean is largely olegotrophic (extremely low concentration of nutrients and microorganisms). The concentration of heterotrophic microorganisms determines the Biochemical Oxygen Demand (BOD) i. e. the amount of oxygen removed from water by aerobic respiration. So the coastal region has a high BOD compared to open ocean. A huge energy cycle is carried out by the photosynthetic microbes living on the ocean surface. These microscopic communities are responsible for 98% of primary production (Whitman et. al., 1998, Atlas & Bartha, 1993). This makes ocean microbes one of the major sinks of atmospheric carbon dioxide, a process termed “carbon sequestration”. They also mediate all the biogeochemical cycles in the oceans (Atlas & Bartha, 1993).
6.5 Carbon and nitrogen cycles
Bacteria show a variety of metabolic pathways related to carbon flow and cycling. Carbon fixing rate of phytoplankton shows marked seasonal fluctuations in hydrographic and nutrient parameters. As many of the sediment and water-logged soils of estuaries are anoxic, anaerobic decomposition is important. Complex organic matter is used by the fermenters and dissimilatory nitrogenous oxide reducers. The sulfate reducers and methane producers were once thought to have more restricted distributions (John et. al., 1989). Researchers suggested seasonal and inter annual dynamics of free-living bacterioplankton and labile organic carbon available to microbes along the salinity gradient of estuaries. Bacterioplankton abundance may be an important indicator of ecosystem health in eutrophied estuaries, because of the positive relationships between bacterioplankton abundance, microbially labile organic carbon (MLOC), and dissolved oxygen (Leila et. al., 2007).
Nitrogen is a major limiting nutrient for primary production in estuaries. The N-cycling processes that are dominated by microbial activity include nitrification, dissimilatory nitrous oxide reduction, and nitrogen fixation. Nitrogen cycling in estuaries is related to the water mixing and microbial community dynamics.
7. Diversity and distribution of estuarine organisms
7.1 Phytoplankton – The primary producer
Algae belong to a highly diverse group of photoautotrophic organisms with chlorophyll a and unicellular reproductive structures, which are important for aquatic habitats (Ariyadej et. al., 2004) Phytoplankton species composition, richness, population density, and primary productivity vary from coast to coast and sea to sea depending upon the varying hydro biological feature. (Prabhahar et. al., 2011) and seasonal and spatial distribution of plankton in the estuary were discernable). Changes in species composition and dominance of phytoplankton can be mediated by a variety of mechanisms including ambient temperature, light penetration, nutrient supply, and removal by zooplankton (Reynolds 1993).

Interplay of Physical, Chemical and Biological Components in Estuarine Ecosystem with Special Reference to Sundarbans, India
219
Sundarbans estuary is formed by a complex network of upstream rivers where the spatial and seasonal variations of some hydrochemical characters are quite prominent and water quality parameters of rivers showed marked variation in different seasons which greatly influence species composition and quantitative abundance of planktons. In Sunderbans phytoplankton abundance ranged from 7. 25 X 104 cells / l (June) to 9. 8 x10⁶ cells /L
(February) (Manna et al., 2010).
Season (Period)
Planktonic abundance
(Cells/L)
Biomass (Chlorophyll-a concentration,
µg/L)
Dominant taxa
Postmonsoon (Nov – Feb) 9. 25 x 105 – 9. 8 x
106 19. 9 - 36. 5 Coscinodiscus sp., Chaetoceros sp., Baccteriastrum sp., Thalassiosira sp., Planktoniella sp., Triceratium sp.
Premonsoon (Mar– Jun)
7. 25 x 104 - 2. 8 x 10⁵ 10. 5 - 28. 7
Navicula sp., Thalassionema sp., Synedra sp. Diatoma sp., Nitzschia sp, Protoperidinium sp., Chlorella sp. Dunaliella sp.
Monsoon (Jul – Oct)
2. 44 x 105 -5. 2 x 10⁶ 6. 9 - 22. 7
Navicula sp., Thalassionema sp, Cosmarium sp., Closterium sp., Oscillatoria sp. Stigonema sp Pyrocystis sp., Anabena sp Tricodesmium sp.
Table 2. Distribution and Abundance of Phytoplankton in Sundarban estuary
Sunderbans has a highly diverse algal flora comprised of both benthic and planktonic forms ranging from the freshwater to marine environments (Gopal and Chauhan, 2006) and showed the highest species diversity in all seasons. Noticeable variation of phytoplankton forms was also observed in seasons and sampling locations due to variations of water quality parameters, like pH, salinity, TSS and nutrients and DO. Phytoplankton community was observed to be dominated by diatoms (Biacillariophyceae) followed by Pyrrophyceae (Dinoflagellates) and Chlorophyceae and higest abundance was noticed in postmonsoon (Biswas et al. 2010; Manna et al. 2010) Centric Diatoms predominated in winter months and Pennates in summer whereas Chlorophyceae, Cyanohyceae and Euglenoids dominated the estuary in monsoon. During premonsoon the dominant phytoplankton were species of Ditylum, Ceratium, Biddulphia, Chaetoceros, Coscinodiscus, Thalassiothrix, Rhizosolenia Nitzschia and Thalassionema. However, during postmonsoon phytoplankton species of Bacteriastrum, Biddulphia, Protoperidinium and Ceratium were most dominant (Fig 6a) But in monsoon species of Skeletonema, Fragillaria and some blue green algae, green algae and also euglenoids are quite common. The average phytoplankton load is higher mostly in postmonsoon (Manna et al. 2010). The eastern part of the estuary is dominated by phytoplankton species like Biddulphia diatoms and green and blue green algae, while the central part is dominated by a variety of diatom species viz, Chaetoceros, Coscinodiscus, Bacterioastrum, Cyclotella, Ditylum, Skeletonema, Thallassiothrix, Thalassionema and Triceratium. In contrary, the western region is dominantly represented by species of

Ecological Water Quality – Water Treatment and Reuse
220
Fragillaria, Gyrosigma, Nitzschlia and Bacillaria. The seasonal variation of phytoplankton load indicates that there is a bimodal pattern of distribution with one in premonsoon (May) and other in postmonsoon (November) (Bandyopadhyay, 2003 :Biwas et al. 2010; Manna et al., 2010). Such biomodal seasonal cycle is a typical feature throughout the coastlines in India. (Mani, 1986; Gopinath, 1972; Gouda. 1991) The phytoplankton taxa of Sunderban estuary in general resembles with those of coastal waters, estuarine and near shore region of Goa (Devassy. & Goes, 1988) Cochin back waters, (Devary, & Bhattathiri, 1974) Hooghly river, (Santra et al. 1989; Santra & Pal; 1989), Rushikulya estuary (Gouda, R. & Panigrahy, 1989), Bahuda estuary, (Mishra & Panigrahy, 1995) and Porto Novo (Kannan & Vasantha, 1992). Only difference lies in the occurence of bloom forming diatoms. At high salinity level (25 PSU) halo- tolerant phytoplankton species like Dunaliella salina, Chlorella marina, C. salina, Grammatophora marina, Fragillaria oceanica dominated the estuary which are definitely better adapted to the high saline environment. Bio-indicator species like Polykrikos schwartzil, Dinophysis norvegica and Prorocentrum concavum points to moderately polluted water quality of the Sunderbans estuary (Manna et al., 2010).
Class Genus Species
Bacillariophyceae 61 151
Pyrrophyceae 15 53
Cyanophyceae 21 23
Chlorophyceae 34 44
Chrysophyceae 3 8
Euglenophyceae 3 5
Dictyophyceae 3 2
Haptophyceae 1 2
Xanthophyceae 1 1
Table 3. Composition of Phytoplankton Classes.
A) Stephanopyxis palmariana B) Thalassionema costatum C) Trachelomonas volvocinopsis D) Protoperidinium diabolus E) Phaeocystis globosa F) Pediastrum duplex G) Cyclotella stelligera H) Aphanothece smithii I) Chaetoceros impressus J) Peridiniella catenella H) Gonyaulax spinifera L) Gonium pectorale M) Cyclotella striata N) Mallomonas tonsulata
Fig. 7a. Representative phytoplankton taxa of Sundarbans estuary
A B C D EF
H IJ
KL
G
M N

Interplay of Physical, Chemical and Biological Components in Estuarine Ecosystem with Special Reference to Sundarbans, India
221
A. Sabellaria cementarium B. Pagurus longicarpus C. Gastropod veliger D. Corycaeus amizonicus E. Cirriped- Cypris F. Lucifer sp. G. Acrocalanus gracilis H. Cyphonautes larva I. Nematode larva J. Fish larva
Fig. 7b. Representative zooplankton taxa of Sundarbans estuary
7.2 Zooplankton – Primary consumer
Zooplankton are organism that belonging the secondary level in food web and plays major role from producers level to upper most consumer level. They are more abundant within mangrove water-ways than in adjacent coastal waters (Robertson and Blabber 1992). Zooplankton support many major fisheries and mediate fluxes of nutrients and chemical elements essential to life on Earth.
Copepod dominated Zooplankton abundance in Sunderbans estuary (Fig. 6b) forming 40%-65% of total composition except three months. During February, April and September the dominant species were Tintinnopsis cylindrica, Polychaete larvae(all types)and shrimp larvae respectively. Around 52 taxa of nine major phyla and two minor phyla were identified during the study period. The total counting ranged 1. 92×102-7. 6×10³ cells L-1. Monthly average abundance of Zooplankton ranges indicated the health status of the Sundarbans estuarine aquatic ecosystem. The nutrient upload and water mass upwelling changes the whole pattern of species richness throughout all seasons . Species Richness was highest in Monsoon than the other two seasons where as diversity index was lowest in Post monsoon. Mollusc larvae were dominated in some areas. Mysids and Chaetognath were largely found where as Copepod nauplius, Balanus nauplius, Gastropod veliger and Crab Zoea are more or less same in number in all the stations including Lucifer sp., Protozoans and Bryozoan are distinct Zooplankton which were also found. Nematode larva was a complicated one which only found in estuary but also less in number. In all Estuarine system of World Copepods are the dominating one with respect to other taxa but in case of Indian Sundarbans it fluctuates due to species dominancy in particular time with respect to some cause like nutrient availability or any other environmental factors.

Ecological Water Quality – Water Treatment and Reuse
222
7.3 Fungi – The heterotrophs
The number of fungi living in estuaries is extremely large. Some of fungi are unique in estuaries, while others have a broader range of habitats. Aquatic fungi and yeast dominate species in aquatic environment, few of fungi associate with particles or solid matters in the water. In sediments, the active species of fungi primarily are found in surface aerobic zones. The densities of fungi decrease rapidly with soil depth, but the spores of fungi are found throughout sediments (John et al., 1989). Leaf inhabiting fungi of mangrove plants are known. Khuskia oryzae has been reported for the first time from India, among seven species of fungi that exist on mangrove leaf surface of Sunderbanss. There are two new parasitic fungi namely Pestalotiopsis agallochae sp. and Cladosporiummarinum sp. existing on infected leaves of Excoecaria agallocha and Avicenniamarina (Pal and Purkayastha, 1992a). Sixteen fungi are isolated from leaves of mangrove plants of Sunderbanss, West Bengal and their growth response to tannin; extracellular pectolytic enzyme (PE) activity and degree of inactivation of PE due to presence of tannin are tested in vitro.
7.4 Bacterioplankton – The detrivore
Microorganisms constitute a huge and almost unexplained reservoir of resources. Microorganisms are the richest repertoire of molecular and chemical diversity in nature. They underlie basic ecosystem processes such as the biogeochemical cycles, food chains and maintain vital relationships between themselves and higher organisms. The enormous number of microbes, their vast metabolic diversity and the accumulation of mutations during the past 3.5 billion years should have led to very high levels of genetic and phenotypic variation (Sogin et. al., 2006).
The world’s oceans are teeming with microscopic life forms. Normal microbial cell counts are greater than 105 cells per ml in surface sea water (Porter & Feig, 1980). It implies that the oceans harbour 3.6 x 1029 microbial cells with a total cellular carbon content of approximately 3x10¹⁷g (Whitman et. al., 1998). In contrast, the total microbial cell number of deep ocean waters (>1000 m) is only 8x10³ – 9x10⁴ (Karner et. al., 2001 & Cowen, 2003), half of which are archae (Santelli et. al., 2008). Net primary productivity in the global ocean is estimated to fix 45-50 billion tons of carbon dioxide per year (Falkowski et. al., 1998).
Bacteria are the most abundant organisms in the estuary, averaging between 106 to 107 per ml organisms in water and 108 to 1010 per dry weight of sediment. Sediments and salt marsh soil generally harbor more bacteria per unit volume than does the water column. Within the water column, high densities may be found in the surface layer than subsurface layer. Aerobic and facultative anaerobic bacteria are most common, and Pseudomonads and Vibrio are the most often isolated species. Sediment and waterlogged soils show very high densities of bacteria, which decrease in abundant with depth of soils. Higher bacteria densities have been found in most estuaries than in nearby coastal seawater and river water (John et al., 1989). In Sundarban estuary bacterial population ranged from 1.62X10³ – 3. 18X106, lowest in January (3.68 × 10⁶ CFU L-1) and the highest in May (8.9 × 10⁸ CFU L-1) (Manna et. al., 2010).
Marine environment is dominated by microscopic protists and prokaryotes. However, it is widely accepted that current and traditional culture based techniques are inadequate to study microbial diversity from environmental samples. Our understanding of marine

Interplay of Physical, Chemical and Biological Components in Estuarine Ecosystem with Special Reference to Sundarbans, India
223
microbial communities has increased enormously over the past two decades as result of culture independent phylogenetic studies. Recent advances in molecular techniques are adequate to describe the microbial diversity in a marine sample based on 16S rRNA sequence diversity.
Period
Bacterial count
Plate count (CFU ml-1)
Fluorescence count (Cells ml-1)
Postmonsoon (Nov ‘08 - Feb ‘09)
1.62 x 10³ – 4.12 x 10⁴
8.15 x 10⁴ – 1.65x 10⁶
Premonsoon (Mar ‘09 - Jun ‘09)
3.65 x 10⁴ – 1.85 x 10⁶
8.57 x 10⁵ – 6.58 x 10⁷
Monsoon (Jul ‘09 - Oct ‘09)
6.13 x 10⁴ – 3.18 x 10⁶
2.07 x 10⁶ – 9.11 x 10⁷
Table 4. Seasonal variation of bacterial abundance in Sundarban estuary
It is difficult to grow marine bacteria in culture. Only 0. 1- 10% bacteria are culturable in currently used culture media. Culture-dependent methods do not accurately reflect the actual bacterial community structure. Furthermore, (1) all techniques rely on cultivation are time consuming and expensive as are the physiological and biochemical differentiation tests; (2) after many generations necessary to form plate colonies, the organism may deviate from its physiology, and possibly even from genotypic mix, of the population in nature; (3) though many advances have been made in microbiological culture techniques, it is still not possible to grow a majority of bacterial species using the standard laboratory culturing techniques (Bakonyi et. al., 2003). Only a minor fraction (0. 1-10%) of the bacteria can be cultivated using standard techniques; (4) The biggest drawback in exploring bacterial biodiversity is that phenotypic methods can be applied only on bacteria which can be cultured and (4) it offers a very limited insight into the spatial distribution of the microorganisms (Pace et al., 1986; Holben & Tiedje, 1988; Ward et al., 1992; Amann et al., 1995). Microbial ecologists are turning increasingly to culture-independent methods of community analysis because of the inherent limitations of culture- based methods. Quantitative estimation of community composition can be inferred based on advanced fluorescence microscopic techniques using culture-independent methods. Useful
molecules for such studies include phospholipids, fatty acids and nucleic acids (Morgan & Winstanley, 1997) where as the microscopic techniques involve either the hybridization of fluorescent- labeled nucleic acid probes with total RNA extracted from water or hybridizations with cells in situ. Metagenomics, also known as environmental genomics, is the culture independent study of a community of microorganisms (Steele & Streit, 2005; Fieseler et. al., 2006). This relatively new technology provides a chance to study the other 99% of bacteria (Tringe & Rubin, 2005).

Ecological Water Quality – Water Treatment and Reuse
224
8. Water quality of the estuary
8.1 Nutrient influx and water quality
Estuarine water quality and habitat conditions are directly affected by fluxes of nutrients from the sediments, especially in summer when temperature is high and hypoxic and anoxic events typically occur. The magnitudes of these sediment oxygen and nutrient fluxes also appear to be directly influenced by nutrient and organic matter loading to the estuarine systems (Kemp and Boynton 1992). Both annual and interannual patterns demonstrate that when these external nutrient and organic matter loadings decrease, the cycle of organic matter deposition to the sediments, sediment oxygen demand, and the release of nutrients into the water column also decrease and water quality and habitat conditions improve (Boynton et al., 1995). The chemical parameters of water – primarily nitrates and phosphates – used in combination with productivity determine the trophic condition of estuaries as oligotrophic (low nutrient) through mesotrophic to eutrophic (high nutrient) (Bellinger and Sigee, 2011).
Study in Sundarbans estuary suggests that indicators of inorganic nutrients and plant productivity changed widely during the annual cycle of the estuary as shown below (Manna et. al., 2010; Biswas et al., 2010) (Table 7). The study indicates estuary remained eutrophic during winter and meso-eutrophic during monsoon and premonsoon (Manna et. al., 2010).
Parameter Postmonsoon Monsoon Pre monsoon Nutrient concentration (µmoll-1) Total phosphorus 2-2.15 1.1-1.84 .1-1.98 DIN 21-25 6-22 5-15 Chlorophyll a concentration (µg l-1) Mean concentration 28 19.5 17.5 Maximum concentration 40 28.7 22.7 Secchi depth (cm) Mean value 60 25 130 Minimum value 40 20 120
Table 5. Seasonal vaiation of physicochemical parameters in Sunderbans estuary
8.2 Eutrophication of the estuary
Eutrophication seems to be a global problem and nutrient enrichment is one of the most serious threats to near shore coastal ecosystems (Cloern 2001). The balance of water ecosystem is disturbed by eutrophication i. e. excessive fertilization, which, in turn, leads to increases in phytoplankton quantity and primary production. Estuaries receive considerable amounts of freshwater, nutrients, dissolved and particulate organic matter, suspended matter, andcontaminants from land and exchange materials and energy with the open ocean. Estuaries also receive nutrients and organic matter loads from wetlands such as marshes (Meybeck 1982; Kemp 1984, Howarth et al. 1996) and mangroves (Odum and Heald 1972; 1975; Twilley 1988; Robertson et al., 1992) The consequences of nutrient enrichment include algal blooms (Paerl 1997), coral reef degradation (Lapointe 1997& Hughes et al. 2003), loss of diversity and ecosystem resilience (Levine 1998 & Scheffe 2001) and, in

Interplay of Physical, Chemical and Biological Components in Estuarine Ecosystem with Special Reference to Sundarbans, India
225
extreme cases, the development of ‘‘dead zones’’(Rabalais et al. 2002). Eutrophication also initiates changes in phytoplankton community structure, decrease in diversity and frequency of harmful algal blooms. It can have significant deleterious effects on the beneficial uses of estuarine and marine waters.
The eutrophication of coastal waters is a problem of epidemic proportion and has disastrous short- and longterm consequences for water quality and resource utilization (Paerl, 1997; Nixon, 1995; Turner and Rabalais, 2003). Metrices based on phytoplankton quantity and productivity is widely used indicators of eutrophication in the status assessment of surface waters (HELCOM:2002; EEA 2007). There are a number of ways in which eutrophication of estuary manifest itself: increase in phytoplankton biomass (Harding & Perry, 1997) and macroalgae (Valiela et al., 1997) anoxia and hypoxia (Rosenberg 1990 & Kiirikki et al. 2006). The most commonly used indicator of eutrophication in waterbody, however, is chlorophyll a (Kauppila 2007). In Sundarbans estuary, chlorophyll-a concentration remained very high (>10 μg L-1) most of the time throughout the year indicating the estuary was in eutrophic condition (Fig 7) (Jones & Fred Lee, 1982).
The Eutrophication may have detrimental effect on the mangrove vegetation. These negative consequences contrast with observations that marine plant growth, including that of tropical mangroves is enhanced with nutrient enrichment (Paerl 1997; Catherine et al. 2009) However, nutrient enrichment favours growth of shoots relative to roots (Grime; 1979, Lambers &, Poorter 1992 & Catherine et al. 2009) thus enhancing growth rates but increasing vulnerability to environmental stresses such as drought, that require large investment in roots for tolerance (Chapin 1991 & Catherine et al. 2009) Thus the benefits of increased mangrove growth in response to coastal eutrophication is offset by the costs of decreased resilience due to mortality during drought, with mortality increasing with soil water salinity along climatic gradient.
8.3 Phytoplanktons as an indicator of water quality
Phytoplankton is the most important producer of organic substances in the aquatic environment and the rate at which energy is stored up by these tiny organisms determine the basic primary productivity of the ecosystem. Phytoplankton satisfy conditions to qualify as suitable pollution indicators in that they are simple, capable of quantifying changes in water quality, applicable over large geographic areas and can also furnish data on background conditions and natural variability (Lee, 1999). Phytoplanktons are characterized for their rapid responses to alterations in environmental conditions (Reynolds 1984; Stolte et. al. 1994) such as anthropogenically introduced eutrophications of coastal waters (Richardson, 1997). The latter characteristic makes phytoplankton sensitive indicators of changes in aquatic ecosystems (Valdes-Weaver et. al., 2006). Their presence or absence from the community indicates changes in physio-chemical environment of the estuary (Rissik, 2009). More so, micro algal components respond rapidly to perturbations and are suitable bio-indicators of water condition which are beyond the tolerance of many other biota used for monitoring (Nwankwo and Akinsoji, 1992). Species diversity indices when correlated with physical and chemical parameters, provide one of the best ways to detect and evaluate the impact of pollution on aquatic communities (Maraglef, 1968) In India, Ganges-Brahmaputra estuary is particularly vulnerable to anthropogenic perturbations due to high nutrient loads from reverine discharge, increasing human population density and rapid

Ecological Water Quality – Water Treatment and Reuse
226
economic growth (Seitzinger et. al., 2005; Mukhopadhyay et. al., 2006; Biswas et. al., 2010). Eutrophication as well as presence of toxic Dinoflagellates and Cyanophyceae in the tidal creek of Sunderbans estuary definitely revealed the deteriorated status of the water quality. (Manna et. al. 2010).
0 5 10 15 20 25 30 35 40 45 50
Predicted Values
-2.0
-1.5
-1.0
-0.5
0.0
0.5
1.0
1.5
2.0
2.5
Obs
erve
d V
alue
s
95% confidence Fig. 8. Plot of observed versus predicted values of chlorophyll-a in Sundarbans estuary (Manna et al.; 2010)
Phytoplankton is one of the most rapid detectors of environmental changes due to their quick response to toxin and other chemicals. Pollution stess reduces the number of algal species but increases the number of individuals. A marked change in algal community severely affects species diversity (Biligrami, 1988). Eutrophication or organic pollution of aquatic ecosystems results in replacement of algal groups. It has been observed that many species are sensitive to nutritional loading, but equally good numbered are pollution tolerant. A numbers of reports are available on pollution –indicating and pollution tolerant algal species (Desei et. al. 2008). Similarly, a good number of indices have also been evolved to determine the trophic level of water ecosystems like Nygaard’s algal index, Shannon and Weiner’s species diversity indices and Palmer;s pollution index.
In general nutrient-deficient natural water harbouring low populations of algae, on addition of nutrients, increases the growth of the algae. The water appears dark green on excessive algal growth or the algal blooms. These algal blooms occur in highly enriched waters, especially that receiving sewage waste (Trivedi & Goel, 1984). Certain species of

Interplay of Physical, Chemical and Biological Components in Estuarine Ecosystem with Special Reference to Sundarbans, India
227
phytoplankton grow luxuriantly in eutrophic waters while some species cannot tolerate waters that are contaminated with organic or chemical wastes. Some of the species indicate the clean waters are Melosira islandica, Cyclotella ocellata and Dinobryon. Pollution indicating plankton includes Nitzschia palea, aeruginosa and Aphanizomenon flosaquae. The latter two species have been found to produce toxic blooms and anoxic conditions. Some algae were found to cause noxious bloom in polluted water that tastes bad with intolerable odour.
Bioindicators are defined as species or communities which by their presence provide informations on the surrounding physical and chemical environments in a particulary site (Belliger & Sigee 2011) A good indicator species has characteristics like narrow ecological range, wide ranging distribution, easily identifiable characteristics, quick response to environmental stress and well defined taxonomy. The organic pollution influence algal flora more intensely than most other factors including DO, pH, light intensity, hardness of water and other type of pollutants (Palmer, 1969).
Genus Family According to Palmer Sundarbans Estuary
Pollution index Pollution index
Euglena Eu 5 5
Oscillatoria Cy 5 5
Chlamydomonas Ch 4 4
Scenedesmus Ch 4 0
Chlorella Ch 3 3
Nitzschia Ba 3 3
Navicula Ba 3 3
Stigeoclonium Ch 2 2
Synedra Ba 2 6
Ankistrodesmus Ch 2 2
Ba-Bacillariophyceae; Cy-Cyanophyceae; Eu-Euglenophyceae: Ch-Chlorophyceae.
Table 6. Palmer’s family pollution index (1969) with input from Sundarbans estuary
The algal species are rated on a scale of 1 to 6 (intolerant to tolerant) and index is derived by summing up the scores of all taxa that are present in sample. In computing Palmer’s index an alga is considered to be present if there are 50 or more individuals per litre of sample.
Thus, the Palmer’s index for Sunderbanss comes to very high (33). As any value higher than 20 is condidered to be high in Palmer’s index, it tallies quite well with the result of trophic analysis as per OECD norms. Thus, there can be no second opinion about the fact that the estuary is eutrophic for the most time of the year and main reason of eutrophication is high organic load (Manna et. al, 2010).

Ecological Water Quality – Water Treatment and Reuse
228
9. Conclusion
Mangroves are the only woody halophytes dominated ecosystem situated at the confluence of land and sea, they occupy a harsh environment, being daily subject to tidal changes in temperature, water and salt-exposure and varying degree of anoxia (Alongi, 2008). The structure and function of the mangrove food web is unique, driven by both marine and terrestrial components. Little attention has been paid so far to the adaptive responses of mangrove biota to the various disturbances; however they are highly threatened even in this world heritage site, Sundarban. Recently eutrophication seems to be a global problem. The eutrophication of this tidal creek may have detrimental effect on the mangrove vegetation. Nutrient-enrichment i. e. eutrophication of the coastal zone increases the mortality of mangroves by enhancing shoot growth relative to root which makes them vulnerable to environmental stresses like salinity, draught that adversely affect plant water relationships (Catherine et al., 2009). Eutrophication as well as presence of toxic Dinoflagellates and Cyanophyceae in the tidal creek of Sundarban estuary definitely reveals the deteriorated status of the water quality.
Entire mangrove ecosystem of Sundarbans is fragile in nature due to many reasons such as erosion due to sea level rise, increase in salinity, pollution from non-point source like agricultural field wash and point sources like effluent from fishery, Kolkata sewage, loss of biodiversity due to continuous anthropogenic intervention, deforestation due to illegal felling and natural causes, eutrophication etc. Thus, a number of factors are operating in the Sundarbans. Apart from other aspects, different studies on Sundarbans gain its significance for throwing light on one of the most precious natural resource of this biogeographic region. This study indicates that ecosystem dynamics of Sundarbans may facilitate bioinvasion putting a question mark on the sustainability of mangroves. This work will create a roadmap to explore the ecosystem dynamics of Sundarban estuary, which is a great challenge in recent times.
10. Acknowledgement
We are grateful to Ministry of Earth Science, Government of India for the financial support to carry on this work. We express our sincere indebtness to Mr. Arijit Banerjee, Director, IESWM for his continuous support and interest in our work. We acknowledge the instrumental and infrastructural facility provided by UGC and DST, Government of India and ICZM project, West Bengal(World Bank)in the Department of Biochemistry, University of Calcutta. It would not be possible to carry out this immense work without the help and support of the local people of Sundarban. We express our inability to acknowledge them individually.
11. References
[1] Alongi DM. 2009. Life in Tidal Water. The Energetics of Mangrove Forests. Springer Science, pp 65-87.
[2] Alongi DM. 2002. Present state and future of the world’s mangrove forests. Environmental Conservation. 29 (3): 331–349.
[3] Amann RI, Ludwig W, Schleifer KH. 1995. Phylogenetic identification and in situ detection of individual microbial cells without cultivation, Microbiol Rev, 59, 143.

Interplay of Physical, Chemical and Biological Components in Estuarine Ecosystem with Special Reference to Sundarbans, India
229
[4] Anonymous, 2010 : Annual Report for the year 2009-10 of IESWM on the project entitled ‘Oil Spill Trajectory Modeling along Sunderbans and Hooghly estuary’ submitted to ICMAM Project Directorate, Ministry of Earth Sciences, Government of India
[5] APHA. 1998. Standard Methods for the Examination of Water and Wastewater. American Public Health Association, Washington, DC.
[6] Ariyadej, C., Tansakul, R., Tansakul, P. and Angsupanich, S. 2004. Phytoplankton diversity and its relationships to the physico-chemical environment in the Banglang Reservoir, Yala Province Songklanakarin J. Sci. Technol, 26(5) : 595-607.
[7] Atlas RM, Bartha R. 1993. Fundamentals and Applications. Benjamin_Cummings, Redwood City, Backwaters. Indian J. Mar. Sci., 3:46-50.
[8] Baidya AU & Chaudhury A. 1984. Ddtibution and abundance of zooplankton ina tidal creek of Sagar Islands, Sunderbanss, West Bengal. Envir. Ecol. 2: No. 4.
[9] Baidya, A. U. & Choudhury, A. (1984) Distribution and abundance of zooplankton in a tidal creek of Sagar Island, Sundarbans, West Bengal. Envir. & Ecol. 2: No. 4.
[10] Bakonyi T, Derakhshifar I, Grabensteiner L, Nowotny N: Development and evaluation of PCR assays for the detection of Paenibacillus larvae in honey samples: comparison with isolation and biochemical characterization. Appl. Environ Microbiol 2003, 69: 1504-1510.
[11] Bandyopadhyay, Ranjini and Sood, AK (2003) Effect of screening of intermicellar interactions on the linear and nonlinear rheology of a viscoelastic gel. In: Langmuir, 19 (8). pp. 3121-312
[12] Baron J, McKnight D, Denning AS. 1991. Sources of dissolved and particulate organic material in Loch Vale watershed, Rocky Mountain national park, Colorado, USA. Biogeochem 15:89–110.
[13] Bartilotti C, Macia A, Queiroga H. 2000. Larval fluxes at saco mangrove creek, Inhaca island (south Mozambique). In:Macrobenthos of Eastern African mangroves:life cycles and reproductive biology of exploited species. Final Report ERBIC 18-CT96-0127, Part B, Florence. pp 97-111.
[14] Bellinger EG. & Sigee DC. Freshwater algae: identification and use as bioindicator. 2010 John Wiley and Sons, -Science . pp 271 .
[15] Berounsky VM, Nixon SW. 1993 Rates of nitrification along an estuarine gradient in Narragansett Bay, Estuaries. 16: 718-730.
[16] Bhattacharyya, S., Pethick, J. & Sen Sarma K., 2011, Managerial response to sea level rise in the tidal estuaries of the Indian Sunderbans : a geomorphological approach, International Journal of Water policy– In press.
[17] Bianchi A, Giuliano L. 1995. Enumeration of Viable Bacteria in the Marine Pelagic Environment. Appl Enviro Microbiol. 62:174-177.
[18] Biddanda B, Opsahl S, Benner R. 1994. Plankton respiration and carbon flux through bacterioplankton on the Lousiana shelf, Limnol Oceanogr. 39: 1259-1275.
[19] Biswas H, Dey M, Ganguly D, De TK, Ghosh S, Jana TK: Comparative Analysis of Phytoplankton Composition and Abundance over a Two- Decade Period at the Land-Ocean Boundary of a Tropical Mangrove Ecosystem. Estuaries and Coasts 2010, 33:384-394.
[20] Blasco, F. 1977. Outlines of ecology, botany and forestry of the mangals of the Indian subcontinent. In:Chapman, V. (ed. ) Wet Coastal Ecosystems. Ecosystems of the World. Vol. No. 1. Elsevier Scientific Publishing Co., Amsterdam. pp. 241-257.

Ecological Water Quality – Water Treatment and Reuse
230
[21] Boynton WR, Kemp WM, Keefe CW . 1982. A cornparative analysis of nutrients and other factors influencing estuarine phytoplankton production. Kennedy V(eds.). Estuarine comparisons. Academic Press, New York, pp. 69-90.
[22] Boynton WR, . Garber JH, Summers R and Kemp WM. 1995. Inputs, transformations, and transport of N and P in Chesapeake Bay and selected tributaries. Estuaries 18: 285-314.
[23] Boynton, WR, Kemp WM, Keefe CW. 1982. A cornparative analysis of nutrients and other factors influencing estuarine phytoplankton production. In: Kennedy, V, editor, Estuarine comparisons. Academic Press, New York, pp. 69-90.
[24] Cappuccino JG, Sherman N. 2007. Cultivation of Microorganisms. Microbiology: A Laboratory Manual. Cappuccino JG, Sherman N (eds. ). Dorling Kindersley Publishers, India. ISBN 81-317-1437-3 129-134.
[25] Catherine EL, Marilyn CB, Katherine CM, Feller IC. 2009. Nutrient Enrichment Increases Mortality of Mangroves. PLoS ONE 2009, 4(5): e5600.
[26] Chisholm SW, Olson RJ, Zettle JER. Goericke, R., WaterburyJ. B. and Welshmeyer, N. A. (1988) A novel free-living prochlorophyte abundant in the oceanic euphotic zone. Nature. 334:340-343.
[27] Choudhury, A., and Chaudhury, A. B. 1994. Mangroves of the Sunderbanss, Volume one: India. IUCN-The World Conservation Union, Bangkok, Thailand.
[28] Cloern JE . 1996. Phytoplankton bloom dynamics in coastal ecosystems. A review with some general lessons from sustained investigation of San Francisco Bay. California. Rev Geophysics 33: 127-168.
[29] Cloern JE. 2001. Our evolving conceptual model of the coastal eutrophication problem. Mar Ecol Prog Ser. 210: 223–253.
[30] Cloern JE. 1996. Phytoplankton bloom dynamics in coastal ecosystems: A review with some general lessons from sustained investigation of San Francisco Bay. California. Rev Geophysics 33: 127-168.
[31] Cloern JL. 1999. The relative importance of light and nutrient limitation of phytoplankton growth: a simple index of coastal ecosystem sensitivity to nutrient enrichment. Aquatic Ecology 33: 3-16.
[32] Cloern JL. 1999. The relative importance of light and nutrient limitation of phytoplankton growth: a simple index of coastal ecosystem sensitivity to nutrient enrichment. Aquatic Ecology 33: 3-16.
[33] Cole JJ, Caraco NF. 1982. The pelagic microbial food web of oligotrophic lakes. In: Ford T (ed) Aquatic Microbiology. Blackwell Scientific, Cambridge, MA, pp 101–111.
[34] Conley DJ, Kaas F, Mohlenberg F, Rasmussen B, Windolf J (2000) Characteristics of Danish estuaries. Estuaries 23: 820-837.
[35] Conley DJ, Kaas F, Mohlenberg F, Rasmussen B, Windolf J . 2000. Characteristics of Danish estuaries. Estuaries 23: 820-837.
[36] Cowen JP. 2003. Fluids from aging ocean crust that support microbial life. Science. 299: 120-123.
[37] Crossland, C. J. D., Baird, D., Ducrotoy, J. P., Lindeboom, H., 2005. Thecoastalzone—a domain of globalinteractions. In:Crossland, C. J., Kremer, H. H., Lindeboom, H. J., Marshall Crossland, J. I., LeTissier, M. D. A. (Eds. ), CoastalFluxesintheAnthro- pocene. InternationalGeosphere–BiosphereProgrammeSeries. Springer, pp. 1–37.
[38] Delft Hydraulics 1968. Sunderbans Delta Project Phase 1. Report to Rivers Research Institute, Gvt. West Bengal.

Interplay of Physical, Chemical and Biological Components in Estuarine Ecosystem with Special Reference to Sundarbans, India
231
[39] Desai SR, Subash Chandran MD and Ramachandra TV. 2008. Phytoplankton Diversity in Sharavati River Basin, Central Western Ghats. The IUP Journal of Soil and Water. Sciences.
[40] Devassy, V. P. & Bhattathiri, P. M. A. 1974. Phytoplankton ecology of the Cochin Backwaters. Indian J. Mar. Sci., 3:46-50.
[41] Dur G, JS Hwang, S Souissi, LC Tseng, CH Wu, SH Hsiao, QC Chen. 2007. An overview of the influence of hydrodynamics on the spatial and temporal patterns of calanoid copepod communities around Taiwan. J. Plankt. Res. 29: 97-116.
[42] EEA: Europe’s environment - The fourth assessment. State of the environment report No. 1/2007 2007, 452.
[43] Eyre BD . 1997. Water quality changes in an episodically flushed sub-tropical Australian estuary. A 50 year perspective. Mar chem 59: 177-187
[44] Falkowski PG, Barber RT, Smetacek V. 1998. Biogeochemical controls and feedbacks on ocean primary production. Science. 281: 200-206.
[45] Falkowski PG. 1980. hght-shade adaptation in marine phytoplankton. In: Falkowski, P. G, editor. Primary productivity in the sea. Environmental Science Research. Plenum Press, New York. pp. 99-119.
[46] Fenchel T. 1988. Marine plankton food chains. Ann. Rev. Ecol. Syst. 19: 19–38. [47] Fieseler L, Quasier A, Schleper C, Hentschel U. 2006. Analysis of the first genome
fragment from the marine sponge-associated, novel candidate phylum Poribacteria by environmental genomics. Environ Microbiol 2006, 8: 612-624.
[48] Finnish coastal waters. Monogr Boreal Environ Res. 31:1-57. [49] Fogg GE. 1986. Picoplankton. Proc. R. Soc. Lond., 228: 1–30. [50] Gle G, Amo BYD, Laborde SP, and Chardy P. 2008. Variability of nutrients and
phytoplankton primary production in a shallow macrotidal coastal ecosystem (Arcachon Bay, France). Estuarine Coastal and Shelf Sciences, 76 : (), 642-656.
[51] Gopal B, Chauhan M. 2006 Biodiversity and its conservation in the Sunderbans Mangrove Ecosystem. Aquatic Sciences. 69:338-354.
[52] Gopinathan, CP. 1972. Seasonal abundance of phytoplankton in the Cochin Backwaters. J. Mar. biol. Ass. India. 14: 568-577.
[53] Gouda, R. & Panigraphy, R. C. 1996. Seasonal distribution of phytoplankton in the surf waters off Gopalpur, east coast of India. Indian J. Mar. Sci., 25:146-150.
[54] Graneli E, Wallstrom K, Larsson U, Graneli W, Elmgren R. 1990. Nutrient limitation of primary production in marine ecosystems in the Baltic Sea. Ambio. 19: 142-151.
[55] Gupta GVM, Thottathil SD, Balachandran, KK, Madhu NV, Madeswaran P, Nair S. 2009. CO2 Supersaturation and net heterotrophy in a tropical estuary (Cochin, India) : Infiuence of Antropqgenic effect. Ecosystems. 12(12): 1145-1157.
[56] Harding LW Jr. 1993. Long-term trends in the distribution of phytoplankton in Chesapeake Bay: rolcs of light, nutrients and streamflow. Mar Ecol Prog Ser. 104: 267-291.
[57] Harding LW, Perry ES Jr. 1997. Longterm increase of phytoplankton biomass in Chesapeake Bay, 1950-1994. Mar Ecol Prog Ser. 157:39-52.
[58] Harris GP. 1978. Photosynthesis, productivity and growth: The physiological ecology of phytoplankton. Arch. Hydrobiol. Beih. Ergeb. limnol. 10:. 10: 1-71.
[59] HELCOM: Environment of the Baltic Sea area 1994-1998. Balt Sea Environ Proc No. 82B 2002, 214.

Ecological Water Quality – Water Treatment and Reuse
232
[60] High Diversity. Trophial conservation Biology, . Blackwell Publishing Ltd, 1-32, ISBN 978-1-4051-5073-6.
[61] Hobbie JE, Daleyr RJ, Jasper S. 1976. Use of Nuclepore Filters for Counting Bacteria by Fluorescence Microscopy. Appl Environ Microbiol., 33:1225-1228.
[62] Hobbie JE, Kling GW, Rublee PA. 1996. Controls of bacterial numbers and productivity in an arctic lake. Bull Ecol Soc Am 77:197.
[63] Holben WE, Tiedje JM. 1988. Applications of nucleic acid hybridization in microbial ecology, Ecology 1988, 69, 561.
[64] Holguin G, Vazquez P, Bashan Y. 2001. The role of sediment microorganisms in the productivity, conservation, and rehabilitation of mangrove ecosystems: an overview. Biol Fertil Soils . 33:265–278.
[65] Hopkmson CS, Sherr B, Wiebe W. 1989. Size fractionated metabolism of coastal microbial plankton, Mar Eco Prog Ser. 51: 155-166.
[66] Hughes TP, Baird AH, Bellwood DR, Card M, Connolly SR. 2003. Climate change, human impacts and the resilience of coral reefs. Science. 301: 929–933.
[67] Hwang JS, HU Dahms, V Aleeksev. 2008. Novel nursery habitat of hydrothermal vent crabs. Crustaceana 81: 375-380.
[68] International Newsletter of Coastal Management‐Intercoast Network, Special J. Mar. biol. Ass. India. 14: 568-577.
[69] Jansson M, Bergstrom AK, Blomqvist P, Drakare S. 2000. Allochthonous organic carbon and phytoplankton/bacterioplankton production relationships in lakes. Ecology 81:3250– 3255.
[70] Jansson M, Blomqvist P, Jonsson A, Bergstrom AK. 1996. Nutrient limitation of bacterioplankton, autotrophic and mixotrophic phytoplankton, and heterotrophic nanoflagellates in Lake Ortrasket, a large humic lake in northern Sweden. Limnol Oceanogr 41:1552–1559.
[71] Jara-Marini ME, Soto-Jimenez MF, Paez-Osuna F. 2009. Trophic relationships and transference of cadmium, copper, lead and zinc in a subtropical coastal lagoon food web from SE Gulf of California. Chemosphere. 77(10): 1366-1373.
[72] JGFOS Protocol. 1994. Protocol for the Joint Global Flux Study (JGFOS) Core Management. 178.
[73] John WD, Charles AS, Michael W K, Alejandro YA. 1989. "Estuarine Ecology. " Wiley-Interscience; 1 edition. ISBN 0-10-0471062634.
[74] Johnson PW and Sieburt JM. 1982. In situ morphology and occurrence of eukariotic phototrophs of bacterial size in the picoplankton of estuarine and oceani waters. J. Phycol. 8:318–327.
[75] Jones RA, Fred Lee G. 1982. Recent Advances in Assessing Impact of Phosphorus load on eutrophication-related water quality. Water Research 1982, 16:503-515.
[76] Jones RI. 1992. The influence of humic substances on lacustrine planktonic food chains. Hydrobiol 229:73–91.
[77] Jones RI. 1998. Phytoplankton, primary production and nutrient cycling. In: Hessen DO, Tranvik LJ (eds) Aquatic Humic Substances—Ecology and Biogeochemistry. SpringerVerlag, Berlin, pp 145–175.
[78] Kannan, L. & K. Vasantha, 1992. Microphytoplankton of the Pitchavaram mangals, southeast coast of India: Species composition and population density. In Jaccarini,

Interplay of Physical, Chemical and Biological Components in Estuarine Ecosystem with Special Reference to Sundarbans, India
233
V. & E. Martens (eds), The Ecology of Mangrove and Related Ecosystems. Hydrobiologia
[79] Karner MB, Delong EF, Karl DM. 2001. Archaeal dominance in the mesopelagic zone of the Pacific Ocean. Nature. 409: 507-510.
[80] Kauppila P. 2007. Phytoplankton quantity as an indicator of eutrophication in Finnish coastal waters. Monogr Boreal Environ Res. 31:1-57.
[81] Kausch H. 1990. Biologtcal processes m the estuarine environment In Estuarine Water Quality Management edited by Mihaehs W Spnnger-Verlag, Berhn, Coastal and Eatuarine Studies. 36: 353-361.
[82] Kemp WM and. Boynton WR. 1992. Benthic-pelagic interactions: Nutrient and oxygen dynamics, p. 149-209. In D. E. Smith, M. Leffler, and G. Mackiernan (eds. ), Oxygen Dynamics in the Chesapeake Bay: A Synthesis of Recent Research. Maryland Sea Grant, College Park, Maryland.
[83] Kemp WM, Bonyton WR, Adolf JE, Boesch DF, Boicourt WC, Brush G, Cornwell JC, Fisher TR, Glibert PA, Hugy JD, Harding LW, Houde Jr. ED, Kimmel DG, Millar WD, Newell RIE, Roman MR, Smith EM. 2005. Stevenson JC: Eutrophication of Chesapeake Bay: Historical trends and ecological interactions. Mar eco Pro Ser. 303: 1-29.
[84] Kemp WM, Sampou PA, Garber J, Tuttle J, Boynton WR. 1992. Seasonal depletion of oxygen from bottom waters of Chesapeake Bay roles of benthic and planktonic respiration and physical exchange processes. Mar Eco Prog Ser. 85: 137-152.
[85] Kiirikki M, Lehtoranta J, Inkala A, Pitkänen H, Hietanen S, Hall POJ, Tengberg A, Koponen J, Sarkkula J. 2006. A simple sediment process description suitable for 3D-ecosystem modelling - Development and testing in the Gulf of Finland. J Mar Syst. 61:55-66.
[86] Knudson M. 1901. Hydrographical tables. G. E. C. Gad Copenhagen 63. [87] Kroer N. 1993. Bacterial growth efficiency on natural dissolved organic matter. Limnol
Oceanogr 38:1282–1290. [88] Lahiri, R. 1973. Management Plan of Tiger Reserve in Sunderbanss, West Bengal, India.
Department of Forests, West Bengal. 101 pp. [89] Lapointe BE. 1997. Nutrient thresholds for bottom-up control of macroalgal blooms on
coral reefs in Jamaica and southeast Florida. Limnol Oceanogr. 42: 1119–1131. [90] Lee RE. 1999. Psychology. Cambridge University Press, New York, 614 pp. [91] Leila J. Hamdan, and Robert B. Jonas 2007. Seasonal and interannual dynamics of free-
living bacterioplankton and microbially labile organic carbon along the salinity gradient of the Potomac River. Estuaries and Coasts. 29(1):40-53.
[92] Levine J, Brewer S, Bertness M. 1998. Nutrients, competition and plant zonation in a New England salt marsh. J Ecol 86: 285–292.
[93] Mani, P., Krishnamurthy, K. and Palaniappan, R. 1986. Ecology of phytoplankton blooms in the Vellar Estuary, east coast of India. : Indian J. Mar. Sci. 15(1): 24-28.
[94] Manna S, Chaudhuri K, Bhattacharyya S, Bhattacharyya M. 2010. Dynamics of Sunderbans estuarine ecosystem: eutrophication induced threat to mangroves. Saline Systems. 6:8
[95] Margalef DR. 1951. Diversidad de especies en les communideades natural Public Institutte of Biologic Barcelonia . 1951; 9: 5 – 27.

Ecological Water Quality – Water Treatment and Reuse
234
[96] McLusky, D. S., Elliott, M., 2004. The Estuarine Ecosystem: Ecology, Threats and Management, third ed. Oxford University Press, Oxford, pp 216.
[97] Mishra, S., and Panigrahy, RC, 1995. Occurance of diatomblooms in Bahuda estuary, ast coast of India. Indian J. Mar. Sci., 24: 99-101.
[98] Morgan JAW, Winstanley C: Microbial biomarkers. In: van Elsas, JD, Trevors JT, Wellington EMH (Eds. ), Modern Soil Microbiology. Marcel Dekker, New York 1997, 331–352.
[99] Nixon SW. 1995. Coastal marine eutrophication: a definition. social causes and future concerns. Ophelia. 31: 199-219.
[100] Nwankwo DI, Akinsoji A. 1992. Epiphyte community on water hyacinth Eichhornia crassipes (Mart. ). Solms. in coastal waters of southwestern Nigeria. Arch. Hydrobiol. 124(4): 501-511.
[101] Oachs CA, Cole JL, Likens GE. 1995. Population dynamics of bacterioplankton in an oligotrophic lake. J Plank Res 17:265–391.
[102] Owens. NJP: 1986. Estuarine nitrification: a naturally occurring fluidized bed reaction”. Est Coast Shelf Sci. 22: 31-44.
[103] Pace NR, Stahl DA, Lane DJ, and Olsen GJ: The analysis of natural microbial populations by ribosomal RNA sequences, Adv Microb Ecol 1986, 9, 1.
[104] Paerl HW. 1997. Coastal eutrophication and harmful algal blooms: Importance of atmospheric deposition and groundwater as ‘‘new’’ nitrogen and other nutrient sources. Limnol Oceanogr. 42: 1154–11.
[105] Pakulsht JD, Benner R, Amon R, Eadie B, Whitledge T. 1995. Community metabolism and nutrient cycling in the Mississippi River plume: evidence for intense nitrification at intermediate salinities, Mar Eco Prog Ser. 117: 207-218.
[106] Palmer M C. 1969. A Composite Rating of Algae Toleratng Organic Pollution. Journal of Phycology 5: 78–82.
[107] Pargiter, Frederick Eden, 1934 : A revenue history of the Sunderbanss, Volume-I (From 1765 to 1870) pp1-415, republished by Government of West Bengal in 2002.
[108] Patrick M, Ysebaert T, Damme SV, Bergh EV, Maris T & Struyf E. 2005. The Scheldt estuary: a description of a changing ecosystem Hydrobiologia. 540:1–11
[109] Paula, J. 1998. larval retention and dynamics of the prawns Palaemon longirostris H. Milne Edwards and Crangon crangon Linnaeus (Decapoda, Caridea) in the Mira estuary, Portugal, Inv. Reprod. Devel. 33:221-228
[110] Pennock JR. 1985. Chlorophyll distributions in the Delaware Estuary: Regulation by light-limitation. Estuar. st. Shelf Sci 21: 711-725.
[111] Perry R. 2003. A Guide to Marineplankton of southern California. Mar Sci Center, Ocean Globe 3rd edition, 1-17.
[112] Phytoplankton of Bhagirathi-Hooghly estuary: An illustrative account. Ind. Biol., [113] Pillay TVR. 1958. Biology of the Hilsa sp. Ind J Fish. 5:201–207. [114] Pomeroy LR, Johannes RE. 1968. Occurrence and respiration of ultraplankton in the
upper 500 meters of the ocean. Deep-Sea Res. 15: 381-391. [115] Porter KG, Feig YS. 1980. The use of DAPI for identifying and counting aquatic
microflora. Limnol Oceanogr. 25: 943-948. [116] Prabhahar. C, Saleshrani. K and Enbarasan R. 2011. Studies on the ecology and
distribution of phytoplankton biomass in Kadalur coastal zone Tamil nadu, India. Curr. Bot. 2(3):26-30, 2011.

Interplay of Physical, Chemical and Biological Components in Estuarine Ecosystem with Special Reference to Sundarbans, India
235
[117] Rae R, Vincent WF. 1998. Phytoplankton production in subarctic lake and river ecosystems: development of a photosynthesis– temperature–irradiance model. J Plank Res 20:1293–1312.
[118] Ram ASP, Nair S and Chandramohan D. 2003. Seasonal Shift in Net Ecosystem Production in a Tropical Estuary. Limnol. & Oceanogra. 48(4): 1601-1607.
[119] Ray S. 2008. Comparative study of virgin and reclaimed islands of Sunderbans mangrove ecosystem through network analysis. Eecol Model. 215:207-216.
[120] Reservoir, Yala Province Songklanakarin J. Sci. Technol, 26(5) : 595-607. [121] Reynolds CS. 1984. Phytoplankton periodicity: The interactions of form, function and
environmental variability. Freshwater Biology. 14: 111–142. [122] Reynolds, C. S. 1993. Scales of distribution and their role in plankton ecology,
Hydrobiol., 249, 157 – 171. [123] Richardson K. 1997. Harmful or exceptional phytoplankton blooms in the marine
ecosystem. Advances in Marine Biology 31: 301– 385. [124] Riley GA. 1967. The plankton of estuaries. In: Lauff, G. A. (ed. ) Estuaries. AAAS Publ.,
Washington D. C., p. 316-328. [125] Riley GA. 1967. The plankton of estuaries. In: Lauff, G. A. (ed. ) Estuaries. AAAS Publ.,
Washington D. C., p. 316-328. [126] Rissik D: Plankton: A Guide to their Ecology and Monitoring for Water Quality.
Suthers IM, Rissik D (eds. ). CSIRO Publishing, Collingwood, Australia; 2009. ISBN: 9780643090583.
[127] Robertson, A. I. and S. J. M. Blabber (1992). plankton, Epibenthos and fish communities. In: Tropical Mangrove Ecosystems (A. I. Robertson and D. M. Alongi Eds. ). Coastal Estuar. Stud., 41: 173-224.
[128] Rosenberg R, Elmgren R, Fleischer S, Johnsson P, Persson G, Dahlin H. 1990. Marine eutrophication studies in Sweden. Ambio. 19:102-108.
[129] Ryther JH, 1969. Photosynthesis and fish production in the sea. Science 166:72-76. 969). Photosynthesis and fish production in the sea. Science. 166:72-76.
[130] Ryther JH, 1969. Photosynthesis and fish production in the sea. Science 166:72-76. 969). Photosynthesis and fish production in the sea. Science. 166:72-76.
[131] S. K. Mukhopadhyay, H. Biswas, T. K. De and T. K. Jana, 2006, Fluxes of nutrients from the tropical River Hooghly at the land-ocean boundary of Sunderbanss, NE Coast of Bay of Bengal, India, Journal of Marine System 62: 9 - 21.
[132] Santelli CM, Orcutt BN, Banning E, Bach W, Moyer CL, Sogin ML, Staudigel H, Edwards KJ: Abundance and diversity of microbial life in ocean crust. Nature 2008, 453: 653-657 doi: 10. 1038.
[133] Santoro, A. E. ;Francis, C. A. ;de Sieyes, N. R. ;Boehm, A. B. 2008. Shifts in the relative abundance of ammonia-oxidizing bacteria and archaea across physicochemical gradients in a subterranean estuary. Environmental Microbiology. 10(4): 1068-1079.
[134] Santra S C and Pal U C 1989 Phytoplankton of Bhagirathi- Hooghly estuary. An illustrative account. Indian Biology. 29: 1-27.
[135] Santra, S. C., Das, U. C., Sima Sen, T. M., Rita Saha, Dutta, S. & Gosh Dastidae, P. 1989. abundance of ammonia-oxidizing bacteria and archaea across

Ecological Water Quality – Water Treatment and Reuse
236
physicochemical gradients in a subterranean estuary. Environmental Microbiology. 10(4): 1068-1079.
[136] Sanyal, P. and Bal, A. R. 1986. Some observations on abnormal adaptations of mangrove in Indian Sunderbanss. Indian Soc. Coastal agric. Res. 4: 9-15.
[137] Sarkar A., S. Sengupta S, McArthur JM, Ravenscroft P, M. K. Bera, Ravi Bhushan, A. Samanta and S. Agrawal; 2009. Evolution of Ganges–Brahmaputra western delta plain: Clues from sedimentology and carbon isotopes. Quaternary Science Reviews., 28: 2564 - 2581.
[138] Scheffer M, Carpenter S, Foley JA, Folke C, Walker B. 2001. Catastrophic shifts in ecosystems. Nature. 413: 591–596.
[139] Sieburth, JMcN., SmatacekV, . and Lenz, J. 1978. Pelagic ecosystem structure: heterotrophic compartments of the plankton and their relationship to plankton size fractions. Limnol. Oceanogr., 23, 1256–1263.
[140] Sodhi NS, Brok BW, Bradshaw CJA. 2007. Diminishing Habitats in Regions of High Diversity. Trophial conservation Biology, . Blackwell Publishing Ltd, 1-32, ISBN 978-1-4051-5073-6.
[141] Sogin ML, Morrison HG, Huber JA, Welch DM, Huse SM, Neal PR, Arrieta JM, Herndl GJ. 2006. Microbial diversity in the deep sea and the underexplored ‘‘rare biosphere”.
[142] Spalding, M. 1997. The global distribution and status of mangrove ecosystems. International Newsletter of Coastal Management‐Intercoast Network, Special edition, 1 : 20-21.
[143] Spiers, A. G., 1999. Review of international/continental wetland resources. In: C. M. Finlayson and A. G. Spiers (eds. ), Global Review of Wetland Resources and Priorities for Wetland Inventory. Wetlands Internation Publication 13. Wetlands International, Springer Science, pp 65-87.
[144] Stanley, D. J. ; Hait, A. K. ; 2000 Holocene depositional patterns, neotectonics and Sunderbans mangroves in the western Ganges-Brahmaputra delta. Journal of Coastal Research, 2000 – pp26-39
[145] Steele HL, Streit WR: Metagenomics. 2005. advances in ecology and biotechnology. FEMS Microbiol Lett 2005, 247: 105-111.
[146] Stockner, JG. and Antia, NJ. 1986. Algal picoplankton from marine and freshwater ecosystems: A multidisciplinary perspective. Can. J. Fish. Aquat. Sci. 43: 2472–2503.
[147] Stolte W, Mccollin T, Noordeloos A. and. Riegman R. 1994. Effect of nitrogen-source on the size distribution within marinephytoplankton population. Journal of Experimental Marine Biology and Ecology . 184: 83–97.
[148] Struyf E. 2005. The Scheldt estuary: a description of a changing ecosystem Hydrobiologia 540:1–11
[149] Sundh I, Bell RT. 1992. Extracellular dissolved organic carbon released from phytoplankton as a source of carbon for heterotrophic bacteria in lakes of different humic content. Hydrobiol 229:93–106.
[150] Teague, C. C. ; Barrick, D. E. ; Lilleboe, P. M. ; Cheng, R. T. ; Geoscience and Remote Sensing Symposium, 2007, IGARSS 2007, IEEE International 23-28 July 2007 p 2491 – 2494, Barcelona

Interplay of Physical, Chemical and Biological Components in Estuarine Ecosystem with Special Reference to Sundarbans, India
237
[151] Tomas CR. 1997. Identifying marine phytoplankton. Academic Press, Harcourt Brace and Company, Torpnt. 858
[152] Tomlinson, B. P. 1986. The botany of mangrove. Cambridge University Press. London. UK.
[153] Tranvik LJ. 1988. Availability of dissolved organic carbon for planktonic bacteria in oligotrophic lakes of different humic content. Microb Ecol 16:311–322.
[154] Tringe SG, Rubin EM; Metagenomics. 2005. DNA sequencing of environmental samples. Nat Rev Gene. 6: 805- 814.
[155] Trivedi RK and Goel PK. 1980. Chemical and Biological methods for water pollution studies. Environmental Publication (India), pp. 250.
[156] Tseng LC, R Kumar, HU Dahms, QC Chen, JS Hwang. 2008a. Monsoon driven succession of copepod assemblages in coasta l waters of northeastern Taiwan strait. Zool. Stud. 47: 46-60
[157] Tulonen T, Kankaala P, Ojala A, Arvola L (1994) Factors controlling production of phytoplankton and bacteria under ice in a humic, boreal lake. J Plank Res 16:1411–1432.
[158] Turner RE, Rabalais NN (2003) Linking landscape and water quality in the Mississippi River basin for 200 years. Bioscience 53: 563-572.
[159] Turner RE, Rabalais NN. 1991. Changes in Mississippi River water quality this century, Bio Sci. 41:140-147.
[160] UNESCO. 1978. Monograph and Oceanographic methodology. Phytoplankton Manual. Sournia, A (eds.). In UNESCO Technicalpaper No. 28, 337.
[161] Valdes-Weaver, LM., Piehler MF. Pinckney J. L, Howe KE. Rossignol K and. Paerl HW. 2006. Long-term temporal and spatial trends in phytoplankton biomass and class-level taxonomic composition in the hydrologically variable Neuse-Pamlico estuarine continuum, North Carolina U. S. A. Limnology and Oceanography. 51(3): 1410–1420.
[162] Valiela I, McClelland J, Hauxwell J, Behr PJ, Hersh D, Foreman K. 1997. Macroalgal blooms in shallow estuaries: Controls and ecophysiological and ecosystem consequences. Limnol Oceanogr. 42:1105-1118.
[163] Ventrick EL, Hayward TL. 1984. Determining chlorophyll on the 1984 CalCOFI surveys. CalCOFI Rep. 25:74-79.
[164] Volunteer Estuary Monitoring: A Methods Manual. March 2006. EPA-842-B-06-003. [165] Waniek, J. J. and N. P. Holliday: 2006 Large – scale physical control on
phytoplankton growth in the Irminger Sea, Part II: Model study of the physical and meteorological
[166] Ward DM, Bateson MM, Weller R, Ruff-Roberts AL. 1992. Ribosomal RNA analysis of microorganisms as they occur in nature, Adv Microb Ecol. 12, 219.
[167] Weiss R. 1993. Dynamics of autotrophic picoplankton in marine and freshwater ecosystems. Adv. Microb. Ecol. 13: 327.
[168] Whitman WB, Coleman DC, Wiebe WJ. 1998. Prokaryotes: the unseen majority. Proc Natl Acad Sci USA. 95:6578-6583.
[169] Williams RB. 1972. Annual phytoplankton production in a system of shallow temperate estuaries. In: Chabreck, RH. (ed. ) Proceedmgs of the Coastal Marsh and Estuary Management Synlposium. Louisiana State Univ. Press, Baton Rouge, p. 59-89.

Ecological Water Quality – Water Treatment and Reuse
238
[170] Willlams PJ. 1981. Microbial contribution to overall marine plankton metabolism: direct measurements of respiration. Ocranol Acta. 4: 359-364.
[171] Wofsy SC. 1983. A simple model to predict extinction coefficients and phytoplankton biomass in eutrophic waters. Limnol, Oceanogr. 28: 1144-1155.