interpretation at-a-glance infection inflammation
TRANSCRIPT

DOB: Sex: MRN:
Patient:
3425 Corporate WayDuluth, GA 30096
2200 GI Effects® Comprehensive Profile - StoolInterpretation At-a-Glance
2200A
© Genova Diagnostics · Robert M. David, PhD, Lab Director · CLIA Lic. #11D0255349 · Medicare Lic. #34-8475 · Georgia Lab Lic. Code #067-007 New York Clinical Lab PFI #4578 · Florida Clinical Lab Lic. #800008124
INFECTION INFLAMMATION INSUFFICIENCY
Pancreatic Elastase 1 ▼ IMBALANCE
Beneficial Bacteria ▼ PP Bacteria ▲ PP Yeast/Fungi ▲
RELATIVE ABUNDANCE
Bacteroidetes Phylum
Firmicutes Phylum
Verrucomicrobia Phylum
Fusobacteria Phylum
Euryarchaeota Phylum
Proteobacteria Phylum
Actinobacteria PhylumHEALTHYPATIENT
RESULTS COHORT*A progressive ranking scale based on a Genova proprietary algorithm that differentiates healthy and unhealthy commensal patterns.**The total number of Commensal Bacteria (PCR) that are out of reference ranges for this individual.
DRAFTGenova Diagnostics' sample reports are for representational and educational purposes only. Biomarkers, references ranges, results, and all other data may differ from actual reports. All data included in no way represents an actual patient. Any comparisons of results to actual patients, is completely incidental. All information and images are not to be reproduced without prior written consent from Genova Diagnostics. © 2018 All Rights Reserved Genova Diagnostics.

GI Effects® Comprehensive Profile - Stool
Digestion and Absorption
Inflammation and Immunology
Gastrointestinal Microbiome
2200A
Methodology: GC/MS, Automated Chemistry, EIA Results
QUINTILE DISTRIBUTION1st 2nd 3rd 4th 5th Reference Range
2.6 1.8-9.9 micromol/gProducts of Protein Breakdown (Total*)(Valerate, Isobutyrate, Isovalerate)
5.0 0.2-6.9 mg/gPhospholipids
0.5 0.4-4.8 mg/gCholesterol
12.9 1.2-29.1 mg/gLong-Chain Fatty Acids
1.1 0.3-2.8 mg/gTriglycerides
19.5 3.2-38.6 mg/gFecal Fat (Total*)
L158200100
Pancreatic Elastase 1 †
206 <=885 mcg/gFecal secretory IgA
0.6 <=4.6 mcg/gEosinophil Protein X (EPX)†
<16 <=50 mcg/g50 120
Calprotectin †
2,297 368-6,266 U/gBeta-glucuronidase
14.7 <=29.3 %Propionate %
62.8 48.1-69.2 %Acetate %
22.3 11.8-33.3 %n-Butyrate %
10.6 >=3.6 micromol/gn-Butyrate Concentration
47.5 >=23.3 micromol/gShort-Chain Fatty Acids (SCFA) (Total*)(Acetate, n-Butyrate, Propionate)
Metabolic
*Total value is equal to the sum of all measurable parts.†These results are not represented by quintile values.
© Genova Diagnostics · Robert M. David, PhD, Lab Director · CLIA Lic. #11D0255349 · Medicare Lic. #34-8475 · Georgia Lab Lic. Code #067-007 New York Clinical Lab PFI #4578 · Florida Clinical Lab Lic. #800008124
ID: Patient: Page 2
Tests were developed and their performance characteristics determined by Genova Diagnostics. Unless otherwise noted with ◆, the assays have not been cleared by the U.S. Food and Drug Administration.
A. L. Peace-Brewer, PhD, D(ABMLI), Lab Director · CLIA Lic. #34D0655571 · Medicare Lic. #34-8475
>200 mcg/g
4.61.1
DRAFT

Patient: ID: Page 3
Gastrointestinal Microbiome
ResultCFU/g stoolCommensal Bacteria (PCR)
L<DL 1.4E5 -1.6E7Prevotella spp.
H8.2E7 <=8.0E7Odoribacter spp.
<DL <=1.6E8Barnesiella spp.
H2.6E9 <=2.2E9Bacteroides vulgatus
2.8E8 <=6.4E9Bifidobacterium spp.
3.1E7 <=7.2E8Bifidobacterium longum
L<DL 1.4E7 -1.9E9Collinsella aerofaciens
Actinobacteria Phylum
7.2E4 5.5E3 -5.9E5Butyrivibrio crossotus
1.4E8 8.3E6 -5.2E9Lactobacillus spp.
2.5E9 5.8E7 -4.7E9Faecalibacterium prausnitzii
7.0E5 <=1.2E8Coprococcus eutactus
1.8E9 1.7E8 -1.5E10Clostridium spp.
Firmicutes Phylum
1.5E7 1.2E5 -5.5E7Veillonella spp.
3.0E8 9.5E7 -1.6E9Ruminococcus spp.
2.0E9 1.3E8 -1.2E10Roseburia spp.
H1.9E8 4.2E5 -1.3E8Pseudoflavonifractor spp.
4.7E6 <=3.2E7Anaerotruncus colihominis
6.6E4 <=1.8E7Desulfovibrio piger
5.2E6 9.0E4 -4.6E7Escherichia coli
1.8E6 <=1.5E7Oxalobacter formigenes
Proteobacteria Phylum
7.8E6 >=1.2E6Akkermansia muciniphila Verrucomicrobia Phylum
<DL <=8.6E7Methanobrevibacter smithii Euryarchaeota Phylum
1.7E4 <=2.4E5Fusobacterium spp. Fusobacteria Phylum
L10 12-620Firmicutes/Bacteroidetes (F/B Ratio) Firmicutes/Bacteroidetes Ratio
Reference RangeCFU/g stool
© Genova Diagnostics · Robert M. David, PhD, Lab Director · CLIA Lic. #11D0255349 · Medicare Lic. #34-8475 · Georgia Lab Lic. Code #067-007 New York Clinical Lab PFI #4578 · Florida Clinical Lab Lic. #800008124
6.1E8 3.4E6 -1.5E9Bacteroides-Prevotella group Bacteroidetes Phylum
Methodology: DNA by PCR
QUINTILE DISTRIBUTION1st 2nd 3rd 4th 5th
The Firmicutes/Bacteroidetes ratio (F/B Ratio) is estimated by utilizing the lowest and highest values of the reference range for individual organisms when patient results are reported as <DL or >UL.
The gray-shaded portion of a quintile reporting bar represents the proportion of the reference population with results below detection limit.
Commensal results and reference range values are displayed in a computer version of scientific notation, where the capital letter “E” indicates the exponentvalue (e.g., 7.3E6 equates to 7.3 x 10⁶ or 7,300,000).
2200A
DRAFT

© Genova Diagnostics · Robert M. David, PhD, Lab Director · CLIA Lic. #11D0255349 · Medicare Lic. #34-8475 · Georgia Lab Lic. Code #067-007New York Clinical Lab PFI #4578 · Florida Clinical Lab Lic. #800008124
Patient: JANE DOE ID: Page 4
NG NP PP P
No Growth Non- Pathogen
Potential Pathogen Pathogen
Additional bacteriaNon-pathogen: Organisms that fall under this category are those that constitute normal, commensal flora, or have not been recognized as etiological agents of disease.
Potential Pathogen: Organisms that fall under this category are considered potential or opportunistic pathogens when present in heavy growth.
Pathogen: The organisms that fall under this category are well-recognized pathogens in clinical literature that have a clearly recognized mechanism of pathogenicity and are considered significant regardless of the quantity that appears in culture.
Gastrointestinal Microbiome
Human microflora is influenced by environmental factors and the competitive ecosystem of the organisms in the GI tract. Pathogenic significance should be based upon clinical symptoms.
Microbiology Legend
4+
2+
4+
2+
4+
3+
Bacteriology (Culture)
Lactobacillus spp.
Escherichia coli
Bifidobacterium spp.
Additional Bacteria
alpha hemolytic Streptococcus
gamma haemolytic Streptococcus
Citrobacter amalonaticus
Streptococcus agalactiae gp B
Mycology (Culture)Candida glabrata (T. glabrata) 3+
1+ 2+ 3+ 4+
PP
NP
NP
PP
NG
NP
NP
NP
Methodology: culture/MALDI-TOF MS, Automated and Manual Biochemical Methods, Vitek 2® System Microbial identification and Antibiotic susceptibility
KOH Preparation for YeastMethodology: Potassium Hydroxide (KOH) Preparation for Yeast
Potassium Hydroxide (KOH) Preparation for YeastThese yeast usually represent the organisms isolated by culture. In the presence of a negative yeast culture, microscopic yeast may reflect organisms not viable enough to grow in culture. The presence of yeast on KOH prep should be correlated with the patient’s symptoms. However, moderate to many yeast suggests yeast overgrowth.
Results The result is reported as the amount of yeast detected microscopically:
KOH Preparation, stool Rare Yeast Detected Rare: 1-2 per slide
Few: 2-5 per high power field (HPF)
Moderate: 5-10 per HPF
Many: >10 per HPF
DRAFT

Patient: JANE DOE ID: Page 5
ParasitologyMicroscopic O&P ResultsMicroscopic O&P is capable of detecting all described gastrointestinal parasites. The organisms listed in the box represent those commonly found in microscopic stool analysis. Should an organism be detected that is not included in the list below, it will be reported in the Additional Results section. For an extensive reference of all potentially detectable organisms, please visit Additional Resources on www.gdx.net/product/gi-effects-comprehensive-stool-testGenus/species ResultsNematodes - roundwormsAcylostoma duodenale (Hookworm) Not DetectedAscaris lumbricoides Not DetectedCapillaria philippinensis Not DetectedEnterobius vermicularis Not DetectedNecator americanus (Hookworm) Not DetectedStrongyloides stercoralis Rare Ova DetectedTrichuris trichiura Not Detected
Cestodes-tapewormsDiphyllobothrium latum Not DetectedDipylidium caninum Not DetectedHymenolepis diminuta Not DetectedHymenolepis nana Not DetectedTaenia spp. Rare Ova Detected
Trematodes-flukesClonorchis/Opisthorchis spp. Not DetectedFasciola spp./Fasciolopsis buski ova Not DetectedHeterophyes/Metagonimus ova Moderate Ova DetectedParagonimus spp. Not DetectedSchistosoma spp. Not Detected
ProtozoaBalantidium coli Not DetectedBlastocystis spp. Not DetectedChilomastix mesnili Not DetectedCryptosporidium spp. Not DetectedCyclospora cayetanensis Not DetectedDientamoeba fragilis Not DetectedEntamoeba coli Not DetectedEntamoeba dispar Not DetectedEntamoeba hartmanni Not DetectedEntamoeba histolytica Not DetectedEntamoeba polecki Not DetectedEndolimax nana Not DetectedGiardia Not DetectedIodamoeba butschlii Not DetectedIsospora spp. Not Detected
Trichomonads (e.g. Pentatrichomonas) Not DetectedAdditional FindingsCharcot-Leyden Crystals Not DetectedMeat Fibers Not DetectedVegetable Fibers Not DetectedWhite Blood Cells Not DetectedOther Infectious Findings Additional Organism, Additional Organism, Additional Organism
** Indicates testing performed by Genova Diagnostics, Inc. 63 Zillicoa St., Asheville, NC 28801-0174A. L. Peace-Brewer, PhD, D(ABMLI), Lab Director - CLIA Lic. #34D0655571 - Medicare Lic. #34-8475. Tests were developed and their performance characteristics determined by Genova Diagnostics.
DRAFT

Patient: JANE DOE ID: Page 6
Type 1: Not Detected Type 4: Not Detected Type 7: Not Detected
Type 2: Detected Type 5: Not Detected Type 8: Not Detected
Type 3: Not Detected Type 6: Detected Type 9: Not Detected
ParasitologyPCR Parasitology - Protozoa
Organism Results Expected Result
Blastocystis spp. 4.00e4 Detected Not Detected
Cryptosporidium spp. <2.00e3 Not Detected Not Detected
Cyclospora cayetanensis <2.00e3 Not Detected Not Detected
Dientamoeba fragilis <2.00e3 Not Detected Not Detected
Entamoeba histolytica <2.00e3 Not Detected Not Detected
Giardia <2.00e3 Not Detected Not Detected
Blastocystis spp. Reflex Subtyping
Macroscopic Examination for WormsMethodology: Macroscopic Evaluation
No larvae detected macroscopically
Zonulin Family PeptideMethodology: EIA
Results Reference Range Zonulin Family PeptideThis test is for research use only. Genova will not provide support on interpreting the test results. This test does not detect zonulin. The Scheffler paper suggests that the IDK kit may detect a zonulin family peptide, such as properdin. Genova’s unpublished data demonstrated that the current IDK kit results were associated with stool inflammation biomarkers and an inflammationassociateddysbiosis profile.1
The performance characteristics of Zonulin Family Pepetide have been verified by Genova Diagnostics, Inc. The assay has not been cleared by U.S. Food and Drug Administration .
Zonulin Family Peptide, Stool 250.0 H 22.3-161.1 ng/mL
Reference :1. Scheffler L, et al. Widely Used Commercial ELISA Does Not Detect
Precursor of Haptoglobin2, but Recognizes Properdin as a Potential Second Member of the Zonulin Family. Front Endocrinol. 2018;9:22.
Additional ResultsMethodology: EIA, Fecal Immunochemical Testing (FIT)
Results Expected Value
Fecal Occult Blood Negative Negative
Color Brown
Consistency†† Formed/Normal
DRAFT

Patient: JANE DOE ID: Page 7
Add-on TestingMethodology
Results Expected ValueHpSA (Helicobacter pylori stool antigen) Helicobacter pylori is a bacterium which causes peptic ulcer disease and plays a role in the development of gastric cancer. Direct stool testing of the antigen (HpSA) is highly accurate and is appropriate for diagnosis and follow-up of infection.
Campylobacter Campylobacter jejuni is the most frequent cause of bacterial-induced diarrhea. While transmission can occur via the fecal-oral route, infection is primarily associated with the ingestion of contaminated and poorly cooked foods of animal origin, notably, red meat and milk.
Clostridium difficileClostridium difficile is an anaerobic, spore-forming gram-positive bacterium. After a disturbance of the gut flora (usually with antibiotics), colonization with Clostridium difficile can take place. Clostridium difficile infection is much more common than once thought.
Shiga toxin E. coli Shiga toxin-producing Escherichia coli (STEC) is a group of bacterial strains that have been identified as worldwide causes of serious human gastrointestinal disease. The subgroup enterohemorrhagic E. coli includes over 100 different serotypes, with 0157:H7 being the most significant, as it occurs in over 80% of all cases. Contaminated food continues to be the principal vehicle for transmission; foods associated with outbreaks include alfalfa sprouts, fresh produce, beef, and unpasteurized juices.
HpSA - H. pylori Negative Negative
Campylobacter spp. Negative Negative
Shiga toxin E. coli ** Negative Negative
Clostridium difficile ** Negative Negative
Fecal Lactoferrin ** Negative Negative
††Results provided from patient input
Lab Comments
DRAFT

Patient: ID: Page 8
Mycology Sensitivity
Azole AntifungalsCandida glabrata (T. glabrata) R I S-DD S NI
Fluconazole 16
Voriconazole 0.25
Non-absorbed AntifungalsCandida glabrata (T. glabrata) LOW INHIBITION HIGH INHIBITION
Nystatin
Natural AgentsCandida glabrata (T. glabrata) LOW INHIBITION HIGH INHIBITION
Berberine
Caprylic Acid
Garlic
Undecylenic Acid
Plant tannins
Uva-Ursi
© Genova Diagnostics · Robert M. David, PhD, Lab Director · CLIA Lic. #11D0255349 · Medicare Lic. #34-8475 · Georgia Lab Lic. Code #067-007 New York Clinical Lab PFI #4578 · Florida Clinical Lab Lic. #800008124 CYSEN
Methodology: Vitek 2® System Microbial Antibiotic susceptibility, Manual Minimum Inhibition Concentration
Prescriptive Agents: The R (Resistant) category implies isolate is not inhibited by obtainable levels of pharmaceutical agent.The I (Intermediate) category includes isolates for which the minimum inhibition concentration (MIC) values usually approach obtainable pharmaceutical agent levels and for which response rates may be lower than for susceptible isolates. The S-DD (Susceptible-Dose Dependent) category implies clinical efficacy when higher than normal dosage of a drug can be used and maximal concentration achieved. The S (Susceptible) column implies that isolates are inhibited by the usually achievable concentrations of the pharmaceutical agent.NI (No Interpretive guidelines established) category is used for organisms that currently do not have established guidelines for MIC interpretation.Refer to published pharmaceutical guidelines for appropriate dosage therapy.Nystatin and Natural Agents: Results for Nystatin are being reported with natural antifungals in this category in accordance with laboratory guidelines for reporting sensitivities. In this assay, inhibition is defined as the reduction level on organism growth as a direct result of inhibition by a natural substance. The level of inhibition is an indicator of how effective the substance was at limiting the growth of an organism in an in vitro environment. High inhibition indicates a greater ability by the substance to limit growth, while Low Inhibition a lesser ability to limit growth. The designated natural products should be considered investigational in nature and not be viewed as standard clinical treatment substances.
DRAFT
Patient: ID: Page 9
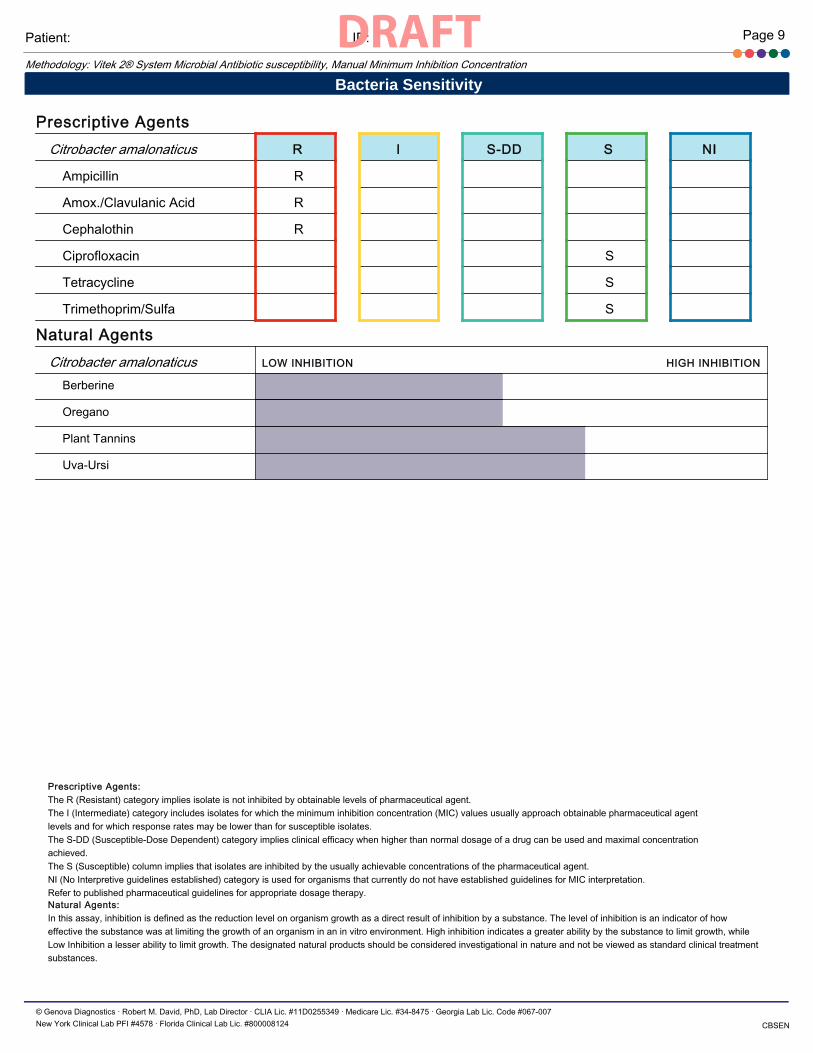
Bacteria Sensitivity
Prescriptive AgentsCitrobacter amalonaticus R I S-DD S NI
Ampicillin R
Amox./Clavulanic Acid R
Cephalothin R
Ciprofloxacin S
Tetracycline S
Trimethoprim/Sulfa S
Natural AgentsCitrobacter amalonaticus LOW INHIBITION HIGH INHIBITION
Berberine
Oregano
Plant Tannins
Uva-Ursi
© Genova Diagnostics · Robert M. David, PhD, Lab Director · CLIA Lic. #11D0255349 · Medicare Lic. #34-8475 · Georgia Lab Lic. Code #067-007 New York Clinical Lab PFI #4578 · Florida Clinical Lab Lic. #800008124
Methodology: Vitek 2® System Microbial Antibiotic susceptibility, Manual Minimum Inhibition Concentration
Prescriptive Agents: The R (Resistant) category implies isolate is not inhibited by obtainable levels of pharmaceutical agent.The I (Intermediate) category includes isolates for which the minimum inhibition concentration (MIC) values usually approach obtainable pharmaceutical agent levels and for which response rates may be lower than for susceptible isolates. The S-DD (Susceptible-Dose Dependent) category implies clinical efficacy when higher than normal dosage of a drug can be used and maximal concentration achieved. The S (Susceptible) column implies that isolates are inhibited by the usually achievable concentrations of the pharmaceutical agent.NI (No Interpretive guidelines established) category is used for organisms that currently do not have established guidelines for MIC interpretation.Refer to published pharmaceutical guidelines for appropriate dosage therapy.
CBSEN
Natural Agents: In this assay, inhibition is defined as the reduction level on organism growth as a direct result of inhibition by a substance. The level of inhibition is an indicator of how effective the substance was at limiting the growth of an organism in an in vitro environment. High inhibition indicates a greater ability by the substance to limit growth, while Low Inhibition a lesser ability to limit growth. The designated natural products should be considered investigational in nature and not be viewed as standard clinical treatment substances.
DRAFT

Page 10ID: Patient:
2200 GI Effects™ Comprehensive Profile - StoolInterpretation At-a-Glance
© Genova Diagnostics · Robert M. David, PhD, Lab Director · CLIA Lic. #11D0255349 · Medicare Lic. #34-8475 · Georgia Lab Lic. Code #067-007 New York Clinical Lab PFI #4578 · Florida Clinical Lab Lic. #800008124 2200A
Bacteroides-Prevotella
Bacteroides vulgatus
Prevotella
Odoribacter
Barnesiella
Bacteroidetes Phylum
Firmicutes Phylum
Actinobacteria Phylum
Proteobacteria Phylum
Euryarchaeota Phylum
Fusobacteria Phylum
Verrucomicrobia Phylum
Genova Diagnostics Commensal Bacteria Clinical Associations*
Commensal Bacteria
IBS IBDMetabolicSyndrome
ChronicFatigue
Auto-immune
Type 2Diabetes
High Blood Pressure
MoodDisorders
Anaerotruncus colihominis
Lactobacillus
Pseudoflavonifractor
Roseburia
Ruminococcus
Coprococcus eutactus
Clostridium
Butyrivibrio crossotus
Veillonella
Faecalibacterium prausnitzii
group
Bifidobacterium
Bifidobacterium longum
Collinsella aerofaciens
Desulfovibrio piger
Escherichia coli
Oxalobacter formigenes
Methanobrevibacter smithii
Fusobacterium
Akkermansia muciniphila
Patient Results Out of Reference Range
H
L
H
H
L
The arrows indicate Genova's clinical condition cohort test results falling below or above the reference range that is greater than that of Genova's healthy cohort.
Indicates Genova's clincial condition cohort test results falling below and above the reference range that are greater than that of Genova's healthy cohort.
Cells with bolded arrows indicate Genova's clinical condition cohort had more test results falling above versus below or more below versus above the reference range compared to that of Genova's healthy cohort.
*Information derived from GDX results data comparing a healthy cohort to various clinical condition cohorts. The chart above showing a comparison of patientresults to clincial conditions is meant for informational purposes only; it is not diagnostic, nor does it imply that the patient has a specific clinical diagnosis orcondition.
spp.
spp.
spp.
spp.
spp.
spp.
spp.
spp.
spp.
spp.
spp.
DRAFT

Page 11ID: Patient:
2200 GI Effects™ Comprehensive Profile - StoolInterpretation At-a-Glance
© Genova Diagnostics · Robert M. David, PhD, Lab Director · CLIA Lic. #11D0255349 · Medicare Lic. #34-8475 · Georgia Lab Lic. Code #067-007 New York Clinical Lab PFI #4578 · Florida Clinical Lab Lic. #800008124 2200A
Fecal Fat (Total*)
Products of Protein Breakdown (Total)
Pancreatic Elastase
Genova Diagnostics Biomarker Clinical Associations*
Biomarker
IBDMetabolicSyndrome
ChronicFatigue
Auto-immune
Type 2Diabetes
High Blood Pressure
MoodDisorders
Triglycerides
Phospholipids
Calprotectin
Eosinophil Protein X (EPX)
Cholesterol
Long-Chain Fatty Acids
Fecal secretory IgA
Short-Chain Fatty Acids (SCFA)(Total)
n-Butyrate Concentration
n-Butyrate %
Actetate %
Propionate %
Beta-glucuronidase
Patient Results Out of Reference Range IBS
L
The arrows indicate Genova's clinical condition cohort test results falling below or above the reference range that is greater than that of Genova's healthy cohort.
Indicates Genova's clincial condition cohort test results falling below and above the reference range that are greater than that of Genova's healthy cohort.
Cells with bolded arrows indicate Genova's clinical condition cohort had more test results falling above versus below or more below versus above the reference range compared to that of Genova's healthy cohort.
*Information derived from GDX results data comparing a healthy cohort to various clinical condition cohorts. The chart above showing a comparison of patientresults to clincial conditions is meant for informational purposes only; it is not diagnostic, nor does it imply that the patient has a specific clinical diagnosis orcondition.
DRAFT