interpretation of dark matter and quark-gluon plasma: the...
TRANSCRIPT

Natural Science, 2015, 7, 438-458 Published Online September 2015 in SciRes. http://www.scirp.org/journal/ns http://dx.doi.org/10.4236/ns.2015.79046
How to cite this paper: Al Shibli, M. (2015) Interpretation of Dark Matter and Quark-Gluon Plasma: The Generation of the Periodic Table Elements and Its Phase Diagram: A Novel Millennium Power Plant. Natural Science, 7, 438-458. http://dx.doi.org/10.4236/ns.2015.79046
Interpretation of Dark Matter and Quark-Gluon Plasma: The Generation of the Periodic Table Elements and Its Phase Diagram: A Novel Millennium Power Plant Murad Al Shibli Autonomous Systems Engineering Technology Department, Head, Senior Faculty, Abu Dhabi Polytechnic, Institute of Applied Technology, Abu Dhabi, UAE Email: [email protected] Received 20 June 2015; accepted 20 September 2015; published 23 September 2015
Copyright © 2015 by author and Scientific Research Publishing Inc. This work is licensed under the Creative Commons Attribution International License (CC BY). http://creativecommons.org/licenses/by/4.0/
Abstract This paper presents a novel physical interpretation of the state of matter of the quark-gluon as the most fundamental building blocks in nature. Such a model is derived based on the assumption that dark matter and dark energy behave as a perfect ideal fluid at extremely high temperature. By the virtue of Boltzmann constant of the ideal gas law and NASA’s Cosmic Microwave Background Ex-plorer (CMB) which estimate that the space has an average temperature close to 2.7251 Kelvin, then the equivalent mass-energy of the fundamental particle of the dark matter/dark energy is determined. Moreover, assuming a uniform space dark energy/dark matter density, then the crit-ical temperature at which the dark matter has a unity entity per volume is identified as 64 × 1012 K. The calculated critical temperature of the quark-gluon plasma is found to be proportional to the temperature generated by colliding heavy ions at the Relativistic Heavy Ion Collider (RHIC) and European Organization for Nuclear Research (CERN). Moreover, the individual critical tempera-tures of the quark-gluon plasma matter at which the elements of the Periodic Table are generated are explicitly determined. The generation temperature trend of the elements of the Periodic Table groups and Periods is then demonstrated. Accordingly, the phase diagram of the quark-gluon state matter is proposed. Finally, a new model of quark-gluon power generation plant is proposed and aims to serve humanity with new energy sources in the new millennium.
Keywords Dark Matter, Dark Energy, Quark-Gluon Plasma, Equation of State, Periodic Table, Standard Model

M. Al Shibli
439
1. Introduction Recent astronomical observations by the cosmic microwave background (CMB), Supernova Cosmology Project, and High-z Supernova Search Team have provided strong evidence that our universe is not only expanding, but also expanding at an accelerating rate [1]-[8]. Dark Energy was proposed for the first time in 1998 when two groups of astronomers made a survey of exploding stars, or supernovas Ia, in a number of distant galaxies [1] [3]. Those researchers found that the supernovas were dimmer than they should have been and were farther away than they should have been. The astronomers realized the only way for that to happen if the expansion of the universe had sped up at some time in the past which should account for a significant portion of a missing com-ponent in the universe [9]. The only explanation was that there was a kind of force that has a strong negative pressure acting outward in opposition to gravitational force at large scales which was proposed for the first time by Einstein in his General Relativity and given the name the cosmological constant Lambda [10]. This force is given the name Dark Energy since it is transparent and cannot be observed or detected directly. A thermody-namics model is proposed to account for the dark energy in [11]. Cosmological observations strongly suggest that the universe is dominated by a smoothly homogenous distributed dark energy component [12]-[21]. It was worth mentioning that NASA’s Cosmic Microwave Background Explorer (CMB) in 1992 estimated that the sky had a temperature close to 2.7251 Kelvin. Moreover, the Wilkinson Microwave Anisotropy Probe (WMAP) in 2003 has made a map of the temperature fluctuations of the CMB with more accuracy [12]. Furthermore, the measurements of the Wilkinson Microwave Anisotropy Probe (WMAP) satellite indicate that the universe has a flat geometry [22]-[25].
Using the Doppler Shift phenomena, scientists can learn much about the motions of galaxies. When scientists look closer at the speeds of galactic rotation, they find something strange. Based on Keplerian physics, the indi-vidual stars in a galaxy should act like the planets in our solar system—the farther away from the center, the slower they should move. On the contrary, the Doppler Shift reveals that the stars in many galaxies do not slow down at farther distances [1] [12]. Particularly, observations reveal that the stars move at flat speeds that should rip the galaxy apart because there is not enough measured mass to supply the gravity needed to hold the galaxy together. These high rotational speeds suggest that the galaxy contains more mass than was calculated. Scientists theorized that, if the galaxy was surrounded by a halo of unseen matter, the galaxy could remain stable at such high rotational speeds. Accordingly, dark matter can be defined as the unseen matter of unknown composition that does not emit or reflect enough electromagnetic radiation to be observed directly, but its presence can be inferred from gravitational effects on visible matter like galaxies and stars. Based on the Lambda-Cold Dark Matter Model (Lambda-CDM 2006), dark energy contributes about 70% of the critical density and has a nega-tive pressure [23] [24]. The cold dark matter contributes 25% [1]-[3] [12] [19] [20] [25] [26]. Meanwhile, hy-drogen, helium and stars contribute 5% and, finally the radiation contributes 55 10−× . According to present ob-servations of structures larger than galaxy-sized as well as Big Bang cosmology, dark matter accounts for the vast majority of mass in the observable universe (22%). The observed phenomena consistent with dark matter observations include the rotational speeds of galaxies, orbital velocities of galaxies in clusters, gravitational lensing of background objects by galaxy clusters, and the temperature distribution of hot gas in galaxies and clusters of galaxies.
A quark-gluon plasma (QGP) can be defined as a phase of quantum chromodynamics (QCD) which exists at extremely high temperature and/or density. This phase consists of (almost) free quarks and gluons, which are several of the basic building blocks of matter. Recent analyses from the Relativistic Heavy Ion Collider (RHIC), a 2.4-mile-circumference (atom smasher) at the U.S. Department of Energy’s (DOE) Brookhaven National La-boratory, establish that collisions of gold ions traveling at nearly the speed of light have created matter at a tem-perature of about 4 trillion degrees Celsius—the hottest temperature ever reached in a laboratory, about 250,000 times hotter than the center of the Sun [27]-[31]. This temperature, based upon measurements by the PHENIX collaboration at RHIC, is higher than the temperature needed to melt protons and neutrons into plasma of quarks and gluons. These new temperature measurements, combined with other observations analyzed over nine years of operations by RHIC’s four experimental collaborations—BRAHMS, PHENIX, PHOBOS, and STAR—in- dicate that RHIC’s gold-gold collisions produce a freely flowing liquid composed of quarks and gluons. Such a substance, often referred to as quark-gluon plasma, or QGP, filled the universe a few microseconds after it came into existence 13.7 billion years ago.
RHIC has created a new state of hot, dense matter out of the quarks and gluons that are the basic particles of

M. Al Shibli
440
atomic nuclei, but it is a state quite different and even more remarkable than had been predicted. When nuclear matter is heated beyond 2 trillion degrees, it becomes strongly coupled plasma of quarks and gluons. Experi-ments using highly energetic collisions between heavy nuclei have revealed that this new state of matter is a nearly ideal, highly opaque fluid [32].
The expansion of hot and dense matter created in a heavy ion collision at RHIC is controlled by an equation of state which describes the dependence of the pressure in the medium on its energy density. Knowledge of the equation of state is, for instance, indispensable for a correct hydrodynamic modeling of the expansion of the transient form of matter created in a gold-gold collision at RHIC [33]. The new results on the equation of state show features familiar from earlier approximate calculations; a rapid rise of the energy density in the transition region at about 1 GeV/fm3 or a temperature of about 190 MeV and a comparatively slow increase of the pressure which comes close to that of a quasi-free quark-gluon gas only at temperatures of about 600 MeV. In fact, even at these high temperatures it stays about 10% below the ideal gas limit, which is known to be reached eventually at extremely high temperatures. High statistics results on large lattices are obtained for bulk thermodynamic ob-servables, i.e. pressure, energy and entropy density, at vanishing quark chemical potential for a wide range of temperatures, 140 MeV ≤ T ≤ 800 MeV.
This paper introduces a novel physical interpretation of the state of matter of the quark-gluon as the most fundamental building blocks in nature. Such a model is derived based on the assumption that dark matter and dark energy behave as a perfect ideal fluid at extremely high temperature as presented in Section 2. By the virtue of Boltzmann constant of the ideal gas law and NASA’s Cosmic Microwave Background Explorer (CMB) which estimated that the space has an average temperature close to 2.7251 Kelvin, then the equivalent mass- energy of the fundamental particle of the dark matter/dark energy is determined. The calculated critical temper-ature of the quark-gluon plasma is found to be proportional to the temperature generated by colliding heavy ions at the Relativistic Heavy Ion Collider (RHIC) and European Organization for Nuclear Research (CERN). More- over, assuming a uniform space dark energy/dark matter density, then the critical temperature at which the dark matter has a unity entity per volume is identified as 1264 10 K× as derived in Section 3. The quark-gluon stan-dard model of the proton and Neutron is presented in Section 4. Then, an isothermal expansion model of the un-iverse is proposed in Section 5. Moreover, the individual critical temperature of the quark-gluon plasma matter at which the elements of the Periodic Table are generated is explicitly determined in Section 6. The generation temperature trend of the elements of the Periodic table groups and Periods are then demonstrated. Accordingly, a novel phase diagram of the quark-gluon state matter is proposed and a new model of quark-gluon power gen-eration plant is proposed in Section 7 that aims to serve humanity with new energy sources in the new millen-nium. Finally, conclusions are presented in Section 8.
2. Preliminary Review on the Basic Blocks of the Universe This state of matter equation relates the pressure P, temperature T and the volume V of a substance behaves as an ideal gas [34], that is
PV mRT= (1) As it can be seen easily that Equation (1) represents the energy associated with an ideal gas at given pressure
P, temperature T and the volume V, that is PV mRT E= = (2)
Note that both sides of the equation has the units of energy (work done by pressure P). Assume now that dark energy behaves like an ideal gas with a negative pressure (−P) that causes the universe to expand with a total volume V, then by dividing both side of the equation of state (5) by V, then
m EP RTV V
= = (3)
Defining the mass density as mmV
ρ = and energy density as EEV
ρ = , Equation (3) yields to
m EP RTρ ρ= = (4)
Now by taking the ratio between the mass density and energy density then

M. Al Shibli
441
E
m
RTρρ
= (5)
It can be concluded that the ratio between the mass density and energy density are proportional to the product of the temperature T and dark energy-dark matter constant R (known as Universal gas constant).
The Boltzmann constant BK is a physical constant that relates temperature to microscopic energy. B AK R N= , where AN is the Avogadro Number. 231.38 10BK J K−= × . The numerical value of BK mea-
sures the conversion factor for mapping from this microscopic energy E to the macroscopically-derived temper-ature scale.
The ideal gas law can now be expressed in terms of Boltzmann constant such that
BPV NK T= (6)
where N is the actual number of entities (particles). Now dividing both sides of (10) by volume to get the energy density then
B N B ENP K T K TV
ρ ρ= = = (7)
This shows that the ratio between the energy density and the entities density is proportional to the absolute temperature times the Boltzmann constant.
The ideal gas law can now be expressed in terms of Boltzmann constant such that
BPV Nk T E= = (8)
where N is the actual number of molecules. Now dividing both sides of (8) by the volume to get the energy den-sity then
B N B ENP k T k TV
ρ ρ= = = (9)
By taking the ration between the energy density Eρ and number of molecules density N/V, one gets
EB
N
k T ρρ
= (10)
or
EN
Bk Tρ
ρ = (11)
This shows that the ratio between the energy density and the molecular density is proportional to the absolute temperature times the Boltzmann constant. The simulation results demonstrate such a model.
3. Dark Matter, Its Critical Temperature and Physical Properties WMAP [8] determined that the universe is flat, from which it follows that the mean energy density in the un-iverse is equal to the critical density (within a 1% margin of error). This is equivalent to a mass density of 9.9 × 10⁻³⁰ g/cm3, which is equivalent to only 5.9 protons per cubic meter.
30 3 27 3E
10 3 9 3 3
9.9 10 gm cm 9.9 10 kg m
8.8981 10 J m 5.5302 10 eV m 5.5302 GeV m
ρ − −
−
= × = ×
= × = × = (12)
Now the equation of state can be expressed as a function of the number of entities per cubic meter such that,
13E
N N N
1 64.4786.4478 10 K TKB
TKρ
ρ ρ ρ= = × = (13)
The temperature at which one entity would be generated called in this work as the critical temperature and equals to 64 Tetra Kelvin. It is desired now to calculate the critical temperature at which 5.9 protons per cubic meter were produced. By the virtue of the ideal state equation, it yields

M. Al Shibli
442
10 312 3E
23N
3 3
8.8981 10 J m 10.929 10 K m5.9 1.38 10 J K
10.929 Tetra K m 10.929 TK mB
TKρ
ρ
−
−
×= = = ×
× ×
= =
(14)
It implies that 10.929 Trillion Kelvin degrees were needed to produce an equivalent 5.9 protons per cubic meter of mass-energy critical density. Furthermore, Nρ is unity when the temperature T is equal to 64.479 × 10¹² K (this would be the temperature to generate 1 protons per cubic meter).
Based on astronomical observations that the average density of dark matter and dark energy is approximately: 30 3 27 3
DM10 3 9 3 3
0.23 9.9 10 gm cm 2.2770 10 kg m
2.0466 10 J m 1.2719 10 eV m 1.2719 GeV m
ρ − −
−
= × × = ×
= × = × = (15)
Now benefiting from (11) at which CMB temperature is T = 2.73 K, then 12 36.4480 10 entities mNρ = × (16)
Since 12 36.4480 10 entities mNρ = × is corresponding to 27 32.2770 10 kg m−× , then each entity has a mass of 27 12 402.2770 10 kg m 6.4480 10 3.5313e 10 kg− −× × = × . This may serve as the most fundamental particle in nature and represent the basic block of the quarks and gluons. Such a mass 403.5313e 10 kg−× is equivalent to
23 43.1739e 10 J 1.9726 10 eV 0.19726 meV− −× = × = . It can be noticed that this particle mass 233.1739e 10 J−× is proportional to Boltzmann constant 231.38 10 J KBK −= × .
Moreover, considering the lowest temperature in nature at Boomerang nebula which is 1 Kelvin, then the dark matter should be exactly equivalent to Boltzmann constant, which is 231.38 10 JBm −= × .
As it can be seen, the mass of the electron is much heavier than this candidate particle by 2.5796 billion times, meanwhile, the proton weighs 4.7365 trillion ( 124.7365 10× ) of dark matter particles. The atomic mass unit
2atmu 0.93146 GeV c= . Now let us compare the mass of the dark matter particle to the standard value of (at-mu), which leads to the conclusion that 4.7220 Trillion ( 124.7220 10× ) dark matter particles are required to con-struct 1 unity of atomic mass unit. In other words, each dark matter particle weighs ( 132.1177 10−× ) atmu.
It is possible now to calculate the virtual momentum that dark matter particle possesses as follows: 311.0587 10 kg m sp E c −= = × ⋅ (17)
Moreover, the dark matter particle mean life time τ can be determined using Blank constant 162π 6.58 10 eV sh h −= = × ⋅ such that
1612
4
6.58 10 eV s 3.3357 10 s 3.3357 ps1.9726 10 eV
hE
τ−
−−
× ⋅= = = × =
× (18)
Additionally, based on the mean life time τ , then one can calculate the frequency of dark matter 121 0.29979 10 Hz 0.29979 THzf τ= = × = (19)
Finally the virtual wave length of such dark matter particle would be 0.001 m 1 mmcλ τ= ⋅ = = (20)
It can be concluded that it takes the dark matter particle 3.3357 ps to travel 1 mm. Meanwhile, it takes the light 3.3 ps to travel 1 mm.
4. Dark Matter and Particles Standard Model As discussed before it has seen, the mass of the electron is much heavier than this candidate particle by 2.5796 billion times, meanwhile, the proton weighs 4.7365 trillion ( 124.7365 10× ) dark matter particles. The atomic mass unit 2atmu 0.93146 GeV c= . Now let us compare the mass of the dark matter particle to the standard value of (atmu), leads to the conclusion that 4.7220 Trillion ( 124.7220 10× ) dark matter particles are required to construct 1 unity of atomic mass unit. In other words each dark matter particle weighs ( 132.1177 10−× ) atmu.
A proton has a mass of approximately 938 MeV/c2, of which the rest mass of its three valence quarks only contributes about 9.6 MeV/c2; much of the remainder can be attributed to the gluons quantum chromodynamics binding energy (QCBE).
M. Al Shibli
443
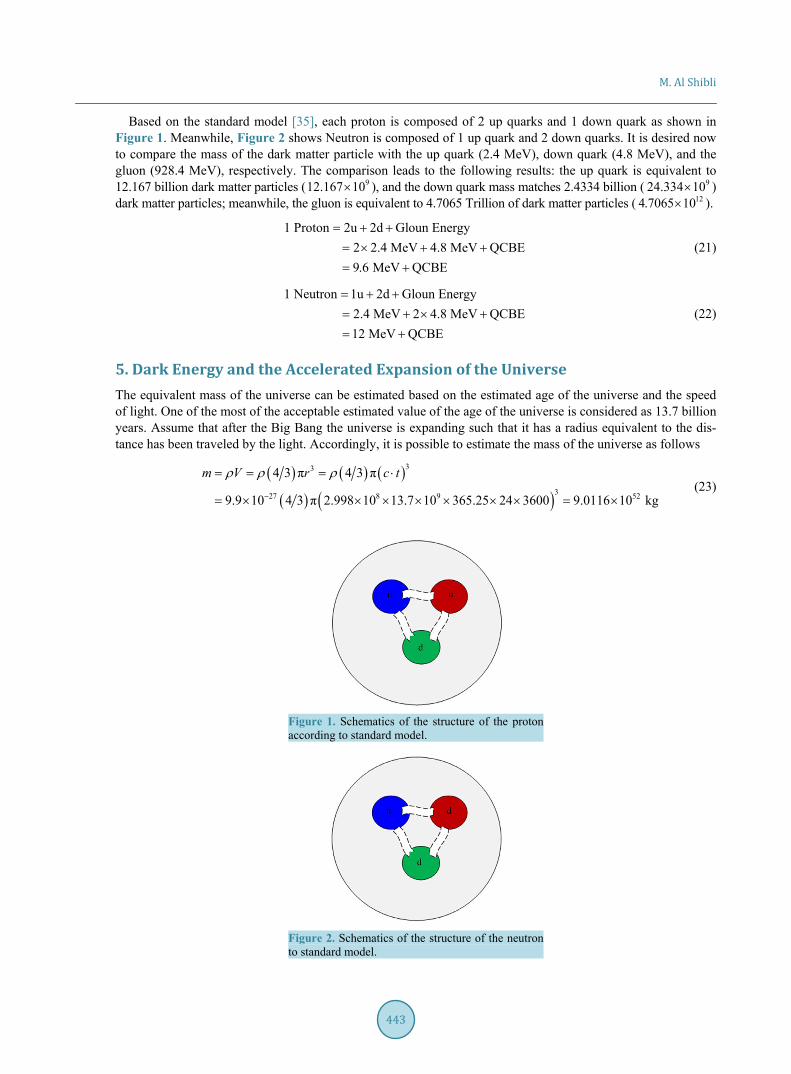
Based on the standard model [35], each proton is composed of 2 up quarks and 1 down quark as shown in Figure 1. Meanwhile, Figure 2 shows Neutron is composed of 1 up quark and 2 down quarks. It is desired now to compare the mass of the dark matter particle with the up quark (2.4 MeV), down quark (4.8 MeV), and the gluon (928.4 MeV), respectively. The comparison leads to the following results: the up quark is equivalent to 12.167 billion dark matter particles ( 912.167 10× ), and the down quark mass matches 2.4334 billion ( 924.334 10× ) dark matter particles; meanwhile, the gluon is equivalent to 4.7065 Trillion of dark matter particles ( 124.7065 10× ).
1 Proton 2u 2d Gloun Energy 2 2.4 MeV 4.8 MeV QCBE 9.6 MeV QCBE
= + += × + += +
(21)
1 Neutron 1u 2d Gloun Energy 2.4 MeV 2 4.8 MeV QCBE 12 MeV QCBE
= + += + × += +
(22)
5. Dark Energy and the Accelerated Expansion of the Universe The equivalent mass of the universe can be estimated based on the estimated age of the universe and the speed of light. One of the most of the acceptable estimated value of the age of the universe is considered as 13.7 billion years. Assume that after the Big Bang the universe is expanding such that it has a radius equivalent to the dis-tance has been traveled by the light. Accordingly, it is possible to estimate the mass of the universe as follows
( ) ( ) ( )
( ) ( )
33
327 8 9 52
4 3 π 4 3 π
9.9 10 4 3 π 2.998 10 13.7 10 365.25 24 3600 9.0116 10 kg
m V r c tρ ρ ρ−
= = = ⋅
= × × × × × × × = × (23)
Figure 1. Schematics of the structure of the proton according to standard model.
Figure 2. Schematics of the structure of the neutron to standard model.

M. Al Shibli
444
The equivalent mass of the universe can be presented in an equivalent number of protons and dark matter par-ticles as follows: 795.3878 10× protons or 922.5519 10× dark matter particles. Based on the astronomical ob-servation that the universe is expanding at an accelerating rate, based on the CMB observation that the average temperature of the sky is 2.73 K and by the virtue of the ideal equation of state then it can be assumed that the expansion process is isothermal (constant temperature). It is possible now to express the equation of state as
BTP NKV
= (24)
In thermodynamics [2], the work involved when an ideal changes from state 1 to state 2 is simply: 2 2 2
1 1 1
21 2
1
1d d d lnV V V
B B BV V V
VTW P V NK V NK T V NK TV V V→ = = = =∫ ∫ ∫ (25)
For an isothermal, reversible process, this integral equals the area under the relevant pressure-volume isotherm for an ideal gas. By convention, work is defined as the work the system does on its environment. As per Joule’s Law, Internal energy is the function of absolute temperature. In isothermal process the temperature is constant. Hence, the internal energy is constant. Moreover, the net change in internal energy is zero. Based on the ideal gas law governed by (2), .PV mRT E const= = = , it yields that
1BP Nk T
V= × (26)
Since the universe is expanding with an homogenous CMB temperature of 2.73 K, then it is desired no to ex-press the pressure to volume rate of change as follows:
1d d d d BP V V Nk TV
= ×
(27)
2
1d d BP V Nk TV
= − × (28)
2
1d dP V constV
= ×− (29)
By the virtue of (29), it is concluded that the universe rate of change of pressure with respect of its volume is inversely proportional to the negative of squared volume 21 V− as shown in Figure 3. Furthermore, since the dark energy pressure is so tiny small 10 38.8981 10 J m−× but not zero, then it yields that the universe volume is not infinite and flat. Remember that the estimated current universe volume is
( ) ( )38 94 3 π 2.998 10 13.7 10 365.25 24 3600× × × × × × which is equivalent to 78 39.1213 10 m× . Hence, the current
universe pressure to volume rate of change 88 2 31.155 10 N m m−− × .
Figure 3. QGP critical temperature for natural elements of the periodic table.
y = 40.07x-1.09
R² = 0.996
0
10
20
30
40
50
60
70
1 5 9 13 17 21 25 29 33 37 41 45 49 53 57 61 65 69 73 77 81 85 89 93 97 101
105
109
113
117
Tcri,
TK
QGP Critical Temprature

M. Al Shibli
445
6. The Generation of the Periodic Table Elements and Critical Temperature The critical temperature at which one entity would be generated is found to be equal to 64.478 Tetra Kelvin as addressed earlier in Section 3. Interestingly, the calculated critical temperature of the quark-gluon plasma is found to be proportional to the temperature generated by colliding heavy ions at the Relativistic Heavy Ion Collider (RHIC) and European Organization for Nuclear Research (CERN).
Recent analyses from the Relativistic Heavy Ion Collider (RHIC), a 2.4-mile-circumference (atom smasher) at the U.S. Department of Energy’s (DOE) Brookhaven National Laboratory, establish that collisions of gold ions traveling at nearly the speed of light have created matter at a temperature of about 4 Trillion degrees Celsius—the hottest temperature ever reached in a laboratory, about 250,000 times hotter than the center of the Sun [27]-[31]. This temperature, based upon measurements by the PHENIX collaboration at RHIC, is higher than the tempera-ture needed to melt protons and neutrons into plasma of quarks and gluons. These new temperature measurements, combined with other observations analyzed over nine years of operations by RHIC’s four experimental collabo-rations—BRAHMS, PHENIX, PHOBOS, and STAR—indicate that RHIC’s gold-gold collisions produce a freely flowing liquid composed of quarks and gluons. Such a substance, often referred to as quark-gluon plasma, or QGP, filled the universe a few microseconds after it came into existence 13.7 billion years ago. At RHIC, this liquid appears, and the quoted temperature is reached, in less time than it takes light to travel across a single proton.
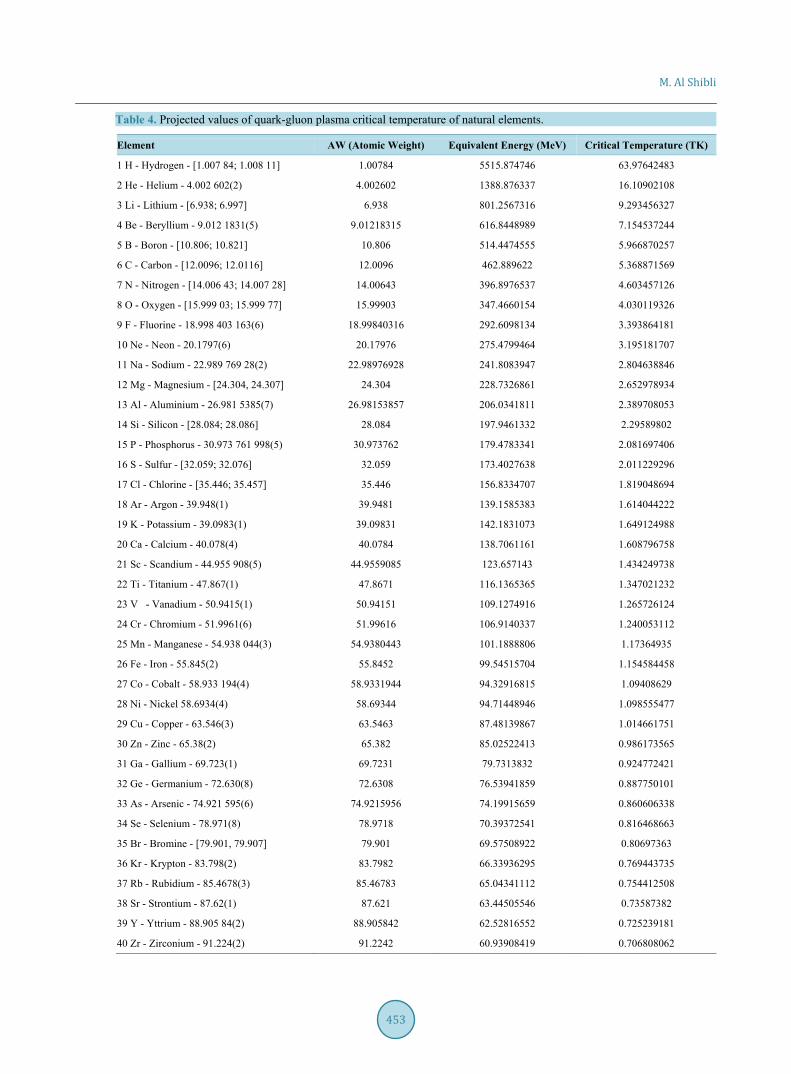
The objective in this section is to determine the individual critical temperature of the quark-gluon plasma matter at which the elements of the Periodic Table are generated. The quark-gluon plasma (QGP) critical temperature of the elements of the Periodic Table Groups and Periods is calculated by the virtue of Equation (13):
13E
N N N
1 64.4786.4478 10 K TKB
TKρ
ρ ρ ρ= = × = . Based on the results demonstrated in Novel Periodic Table
displayed in Table 1 and Table 4, it can be seen that the highest critical temperature needed to generate quark- gluon plasma (QGP) from Hydrogen atom is 64 TK (5516 MeV), followed by 16.1 TK (1389 MeV) needed to generate QGP from Helium, ended by the 0.219 TK (18.9 MeV) to produce QGP from the last Periodic undis-covered yet element. It is interesting to know that the critical temperatures at which QGP is generated out of Gold atom and Uranium atom are 0.327 TK (28.8 MeV) and 0.271 (23.4 MeV), respectively. The average QGP critical temperature of all natural elements is figured to be 1.627 TK (18.9 MeV) as demonstrated in Table 1.
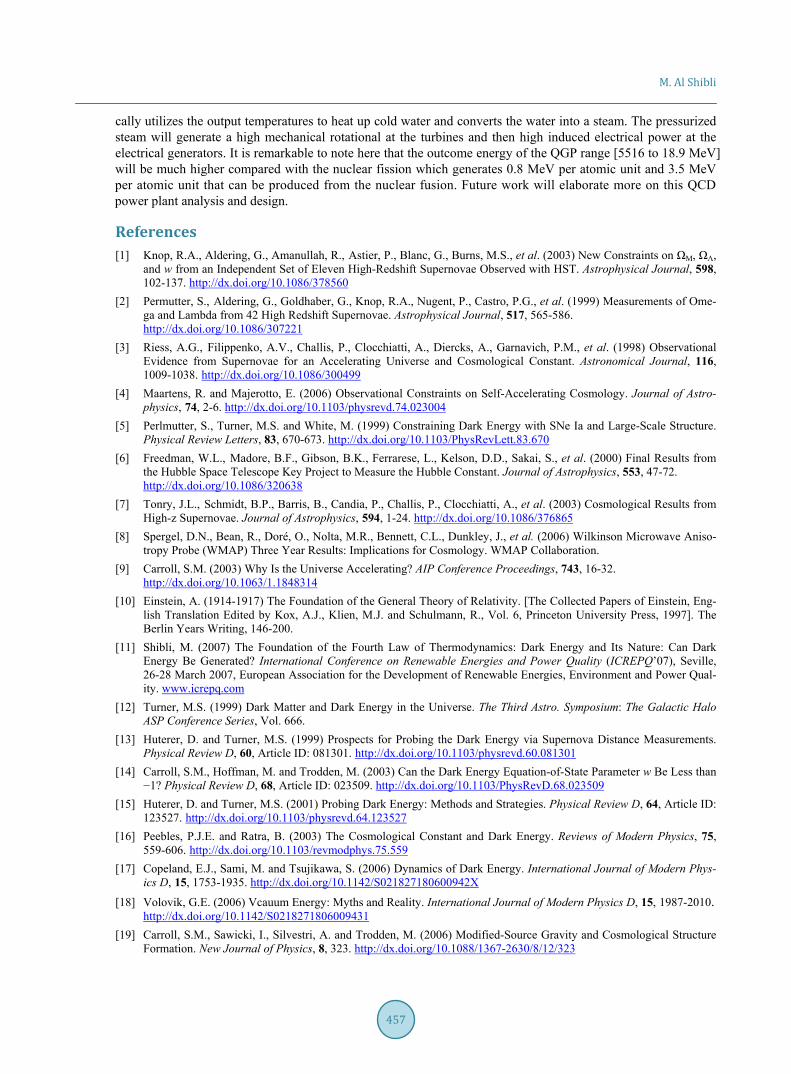
Based on these obtained primary results of QGP critical temperatures, it is interesting to test the QGP critical temperature trend of the elements of the Periodic Table Groups and Periods. It is figured out that the overall trend is of negative power regression 1.09940.07y x−= (TK) in Temperature scale and 1.0993455.1y x−= (MeV) in energy scale as shown in Figure 3 and Figure 4, respectively. This hints how was the trend at which the elements were created after the Big Bang. The QGP critical temperature is decreasing dramatically going down from Hy-drogen, through Helium and ending by the Transition metals at Period 7.
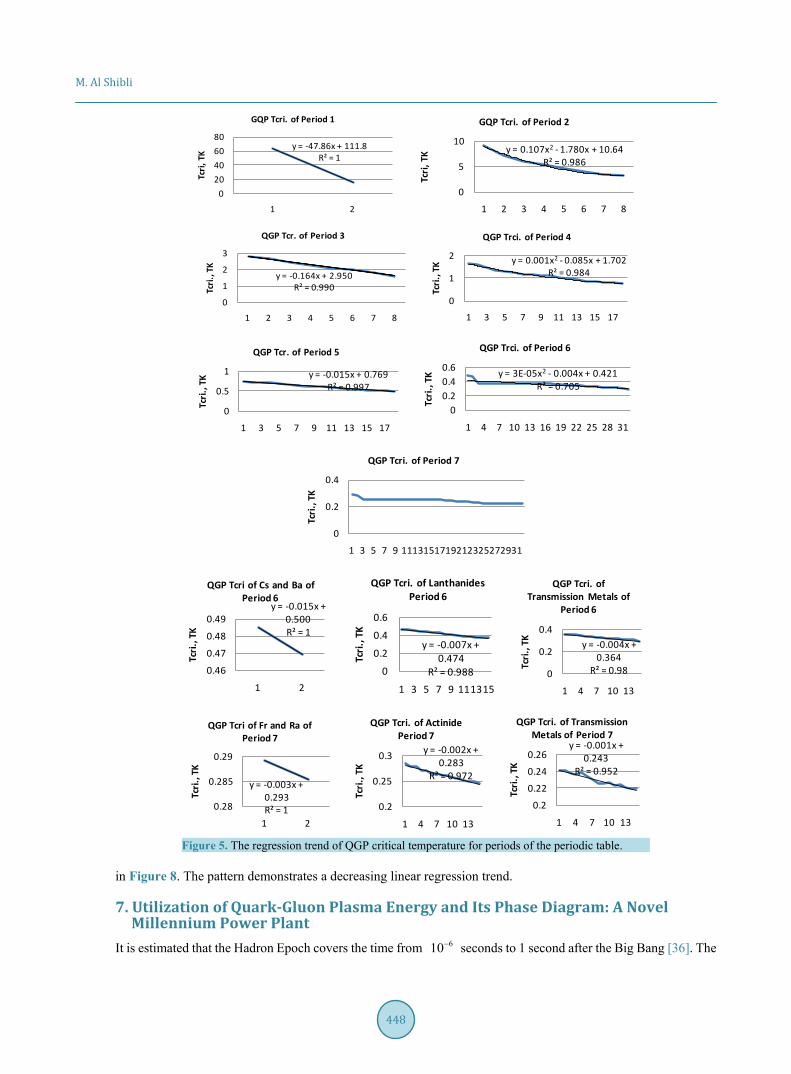
Let us examine the QGP critical temperature of the Periods and the groups separately. The critical temperature of Periods is found to have either linear trend with negative slope or quadratic decreasing trend. The first Period takes the linear form, followed by a quadratic form for the second Period, followed by a linear trend for the third Period, followed by quadratic form for the fourth Period, and then followed by a linear trend for all successive Periods fifth sixth and the seventh. Please refer to Table 2 and Figure 5. It noticed that the negative slope is in-creasing by going down from the top Period to the bottom Period from slope of −47.867 to −0.00038. The qua-dratic coefficient is also decreasing from 0.1078 in Period 2 to 0.0019 in Period 4.
On the other hand, let us now examine the QGP critical temperature of the groups. The critical temperature of groups is found to have negative power aggression trend. It is found out that both the power coefficient and neg-ative exponent are decreasing as we go from left side of the groups A to the right side groups A. Similarly, groups B are showing a QGP decreasing QGP critical temperature pattern. Please refer to Table 3, Figure 6 and Figure 7. It noticed that the negative slope is increasing by going down from the top Period to the bottom Period. For example Group 1A shows a power trend of 2.73763.055y x−= (TK) (or 1.90210.356y x−= (TK) * excluding H), and ends with 2.19916.077y x−= (TK) (or 1.5323.7873y x−= (TK) Excluding He) as displayed in Figure 6. Likely, Groups B (starting with 4B, 5B, 6B, 7B, 8B1, 8B2, 8B3, 1B and 2B) demonstrate negative power re-gression starting with 1.2471.4459y x−= and ending with 1.0671.0516y x−= (TK). The exception to this pattern is Group 3B which shows linearly decreasing trend beginning with 1.1361.5012y x−= (TK) and terminating with behavior 0.1224 0.4909y x= − + . The QGP Critical Temperatures of Lanthanide and Actinide Series are shown

M. Al Shibli
446
Table 1. Novel projected periodic table of quark-gluon plasma critical temperature of natural elements.
Group 1 2 3 4 5 6 7 8 9 10 11 12 13 14 15 16 17 18
Period
1 1 H
64.0
2 He
16.1
2 3 Li
9.29
4 Be
7.15
5 B
5.97
6 C
5.37
7 N
4.60
8 O
4.03
9 F
3.39
10 Ne
3.20
3 11 Na
2.80
12 Mg 2.65
13 Al
2.39
14 Si
2.30
15 P
2.08
16 S
2.01
17 Cl
1.82
18 Ar
1.61
4 19 K
1.65
20 Ca
1.60
21 Sc
1.434
22 Ti
1.35
23 V
1.27
24 Cr
1.24
25 Mn 1.17
26 Fe
1.15
27 Co
1.09
28 Ni
1.10
29 Cu 1.01
30 Zn
0.986
31 Ga
0.924
32 Ge
0.887
33 As
0.860
34 Se
0.816
35 Br
0.807
36 Kr
0.769
5 37 Rb
0.754
38 Sr
0.736
39 Y
0.725
40 Zr
0.707
41 Nb
0.694
42 Mo
0.672
43 Tc
0.658
44 Ru
0.638
45 Rh
0.627
46 Pd
0.606
47 Ag
0.598
48 Cd
0.574
49 In
0.562
50 Sn
0.543
51 Sb
0.530
52 Te
0.505
53 I
0.508
54 Xe
0.491
6 55 Cs
0.485
56 Ba
0.470 *
72 Hf
0.361
73 Ta
0.356
74 W
0.350
75 Re
0.346
76 Os
0.339
77 Ir
0.335
78 Pt
0.331
79 Au
0.327
80 Hg
0.321
81 TI
0.315
82 Pb
0.311
83 Bi
0.309
84 Po
0.309
85 At
0.307
86 Rn
0.290
7 87 Fr
0.289
88 Ra
0.285 **
104 Rf
0.241
105 Db
0.241
106 Sg
0.238
107 Bh
0.237
108 Hs
0.239
109 Mt
0.234
110 Ds
0.229
111 Rg
0.226
112 Cn
0.226
113 Uut
0.227
114 Fl
0.223
115 Uup 0.224
116 Lv
0.220
117 Uus
0.219
118 Uuo 0.219
Lanthanide
Series*
57 La
0.464
58 Ce
0.460
59 Pr
0.457
60 Nd
0.447
61 Pm
0.445
62 Sm
0.429
63 Eu
0.424
64 Gd
0.410
65 Tb
0.406
66 Dy
0.397
67 Ho
0.391
68 Er
0.385
69 Tm
0.382
70 Yb
0.373
71 Lu
0.369
Actinide Series**
89 Ac
0.284
90 Th
0.278
91 Pa
0.279
92 U
0.271
93 Np
0.272
94 Pu
0.264
95 Am
0.265
96 Cm
0.261
97 Bk
0.261
98 Cf
0.257
99 Es
0.255
100 Fm
0.250
101 Md
0.250
102 No
0.249
103 Lr
0.246
Alkali metals Lanthanides
Alkaline earth metals Actinides
Transition metals Nonmetals
Post-transition metals Halogens
Metalloid Noble gases
1 Atomic Number
H Symbol
64.0 Quark-Gluon Critical Temperature (TK)
Figure 4. QGP critical energy for natural elements of the periodic table.
y = 3455.x-1.09
R² = 0.9960
1000
2000
3000
4000
5000
6000
1 5 9 13 17 21 25 29 33 37 41 45 49 53 57 61 65 69 73 77 81 85 89 93 97 101
105
109
113
117
Ecri,
MeV
QGP Critical Energy

M. Al Shibli
447
Table 2. The regression trend of QGP critical temperature for periods of the periodic table.
Period Equation R²
Period 1 y = −47.867x + 111.84 1
Period 2 y = 0.1078x2 − 1.7808x + 10.64 0.986
Period 3 y = −0.1649x + 2.9508 0.9904
Period 4 y = 0.0019x2 − 0.085x + 1.7029 0.9849
Period 5 y = −0.0159x + 0.7691 0.997
Period 6 y = −0.0156x + 0.5008; y = −0.0074x + 0.4749; y = −0.0046x + 0.364 1; 0.9982; 0.98
Period 7 y = −0.0038x + 0.293; y = −0.0026x + 0.2839; y = −0.0017x + 0.2436; 1; 0.9726; 0.9552
Table 3. The regression trend of QGP critical temperature for the groups of the periodic table.
Group Equation R²
Group 1A y = 63.055x−2.737
y = 10.356x−1.902*
* (Excluding H)
R2 = 0.9981 R2 = 0.987*
Group 2A y = 8.4232x−1.776 R2 = 0.9771
Group 3A y = 6.9729x−1.867 R2 = 0.9878
Group 4A y = 6.3518x−1.821 R2 = 0.9854
Group 5A y = 5.4589x−1.73 R2 = 0.9838
Group 6A y = 4.8691x−1.669 R2 = 0.979
Group 7A y = 4.1472x−1.566 R2 = 0.9737
Group 8A y = 3.7873x−1.532 (Excluding He)
y = 16.077x−2.199 R2 = 0.9978
R2 = 0.9794**
Group 3B
y = 1.5012x − 1.136 y = −0.1801x + 0.6443 (Has been calculated with 3B)
y = −0.1823x + 0.6425 y = −0.1785x + 0.6361 y = −0.1761x + 0.6231 y = −0.1726x + 0.6173 y = −0.1646x + 0.5934 y = −0.159x + 0.5833 y = −0.149x + 0.559
y = −0.1447x + 0.5504 y = −0.1399x + 0.5367 y = −0.1351x + 0.526 y = −0.1346x + 0.5201 y = −0.1318x + 0.5134 y = −0.1236x + 0.4962 y = −0.1224x + 0.4909
R2 = 0.9864
Group 4B y = 1.4459x−1.247 R2 = 0.9819
Group 5B y = 1.3652x−1.206 R2 = 0.9779
Group 6B y = 1.3303x−1.198 R2 = 0.9807
Group 7B y = 1.2625x−1.161 R2 = 0.9779
Group 8B1 y = 1.2306x−1.148 R2 = 0.9819
Group 8B2 y = 1.1743x−1.122 R2 = 0.9776
Group 8B3 y = 1.1689x−1.136 R2 = 0.9832
Group 1B y = 1.0883x−1.077 R2 = 0.9763
Group 2B y = 1.0516x−1.067 R2 = 0.9799
M. Al Shibli
448
Figure 5. The regression trend of QGP critical temperature for periods of the periodic table.
in Figure 8. The pattern demonstrates a decreasing linear regression trend.
7. Utilization of Quark-Gluon Plasma Energy and Its Phase Diagram: A Novel Millennium Power Plant
It is estimated that the Hadron Epoch covers the time from 610− seconds to 1 second after the Big Bang [36]. The
y = -47.86x + 111.8R² = 1
020406080
1 2Tc
ri, T
K
GQP Tcri. of Period 1
y = 0.107x2 - 1.780x + 10.64R² = 0.986
0
5
10
1 2 3 4 5 6 7 8
Tcri,
TK
GQP Tcri. of Period 2
y = -0.164x + 2.950R² = 0.990
0
1
2
3
1 2 3 4 5 6 7 8
Tcri.
, TK
QGP Tcr. of Period 3
y = 0.001x2 - 0.085x + 1.702R² = 0.984
0
1
2
1 3 5 7 9 11 13 15 17
Tcri.
, TK
QGP Trci. of Period 4
y = -0.015x + 0.769R² = 0.997
0
0.5
1
1 3 5 7 9 11 13 15 17
Tcri.
, TK
QGP Tcr. of Period 5
y = 3E-05x2 - 0.004x + 0.421R² = 0.705
00.20.40.6
1 4 7 10 13 16 19 22 25 28 31Tc
ri., T
K
QGP Trci. of Period 6
0
0.2
0.4
1 3 5 7 9 1113151719212325272931
Tcri.
, TK
QGP Tcri. of Period 7
y = -0.015x + 0.500R² = 1
0.46
0.47
0.48
0.49
1 2
Tcri.
, TK
QGP Tcri of Cs and Ba of Period 6
y = -0.007x + 0.474
R² = 0.9880
0.2
0.4
0.6
1 3 5 7 9 111315
Tcri.
, TK
QGP Tcri. of Lanthanides Period 6
y = -0.004x + 0.364
R² = 0.980
0.2
0.4
1 4 7 10 13
Tcri.
, TK
QGP Tcri. of Transmission Metals of
Period 6
y = -0.003x + 0.293R² = 10.28
0.285
0.29
1 2
Tcri.
, TK
QGP Tcri of Fr and Ra of Period 7
y = -0.002x + 0.283
R² = 0.972
0.2
0.25
0.3
1 4 7 10 13
Tcri.
, TK
QGP Tcri. of Actinide Period 7
y = -0.001x + 0.243
R² = 0.952
0.2
0.22
0.24
0.26
1 4 7 10 13
Tcri.
, TK
QGP Tcri. of Transmission Metals of Period 7

M. Al Shibli
449
Figure 6. The regression trend of QGP critical temperature for groups a of the periodic table.
temperature during this epoch is estimated to decrease from 1310 K to 1010 K. At 510− seconds, the tempera-ture of the Universe was approximately 1210 K. at which quarks combine to form protons and neutrons. Astro-physics predicts that Fermi melting point of quarks into quark-gluon plasma (0.5 - 1.2 × 10¹² K) or higher. The results of this proposed analysis agree with such predictions. The phase diagram [28] of the quark-gluon plasma is a diagram at which the state of matter-energy. A new QGP phase diagram depicts the Hardon Epoch is proposed in Figure 9. The QGP phase diagram presents a critical point that separates the two phases: the hadron gas in which quarks are confined, and the quark-gluon plasma (QGP).
Experimental results on relative abundances of various hadron species created in gold-gold collisions at RHIC and their comparison with particle abundances realized in a simple hadron resonance gas (HRG) suggest that the transition back to ordinary hadrons, the so-called chemical freeze out, occurs at temperatures of about (160 - 170) MeV [32] [33]. Whether this freeze-out temperature is in any way related to the transition temperature in QCD is an important question that currently is studied extensively in large scale computer simulations. The simula-tions of the RBC-Bielefeld Collaboration performed on the QCDOC and apeNEXT computers hint at a larger transition temperature of about 190 MeV.
Based on this research analysis [37]-[42], it is found out that dark matter/dark energy behaves like an ideal fluid and there density are affected by the space temperature. Moreover, utilization of its energy can be achieved at high temperatures such as Fermi melting point. Hence Nρ is unity when the temperature T is equal to
1264 10 K× , then this temperature value is called the critical temperature. In other words at this temperature the 12 312.81 10 entities mNρ = × of dark matter particles are unified (melted) to form quark-gluon plasma which
work as the basic blocks of matter. CMB and WMAP confirm that the density of dark matter/dark energy is uniform, homogeneous and constant
y = 63.05x-2.73
0
20
40
60
80
1 2 3 4 5 6 7
Tcri.
, TK
QGP Tcri. of Group 1A
y = 8.423x-1.77
02468
10
1 2 3 4 5 6
Tcri.
, TK
QGP Tcri. of Group 2A
y = 6.972x-1.86
R² = 0.987
0
2
4
6
8
1 2 3 4 5 6
Tcri.
, TK
QGP Tcri. of Group 3A
y = 10.35x-1.90
0
20
1 2 3 4 5 6Tcri.
, TK
QGP Tcri. of Group 1A Excluding H
y = 6.351x-1.82
0
5
10
1 2 3 4 5 6
Tcri.
, TK
QGP Tcri. of Group 4A
y = 5.458x-1.73
0246
1 2 3 4 5 6
Tcri.
, TK
QGP Tcri. of Group 5A
y = 4.869x-1.66
0246
1 2 3 4 5 6
Tcri.
, TK
QGP Tcri. of Group 5A
y = 4.147x-1.56
0
2
4
6
1 2 3 4 5 6
Tcri.
, TK
QGP Tcri. of Group 7A
y = 16.07x-2.19
05
101520
1 2 3 4 5 6 7
Tcri.
, TK
8QGP Tcri. of Group 8A
y = 3.787x-1.53
0
2
4
1 2 3 4 5 6
Tcri.
, TK
QGP Tcri. of Group 1A Excluding He

M. Al Shibli
450
Figure 7. The regression trend of QGP critical temperature for groups B of the periodic table.
through the universe. Since the density is at the same order of the proton-nitron, then it is very possible that dark energy/dark matter is converted into quarks at this QGP critical temperature. Similar to Relativistic Heavy Ion Collider (RHIC), it is proposed here to generate quark-gluon plasma and utilize its associated energy. Based on Table 4, it can be seen that the generated energy QGP is ranging from 5516 MeV associated with Hydrogen, 207 MeV and 197 MeV associated with Lead and Gold atoms, respectively.
Recent analyses from the Relativistic Heavy Ion Collider (RHIC), a 2.4-mile-circumference (atom smasher) at the U.S. Department of Energy’s (DOE) Brookhaven National Laboratory, establish that collisions of gold ions traveling at nearly the speed of light have created matter at a temperature of about 4 trillion degrees Celsius— the hottest temperature ever reached in a laboratory, about 250,000 times hotter than the center of the Sun [27]-[32]. This temperature, based upon measurements by the PHENIX collaboration at RHIC, is higher than the temperature needed to melt protons and neutrons into plasma of quarks and gluons. These new temperature measurements, combined with other observations analyzed over nine years of operations by RHIC’s four expe-rimental collaborations—BRAHMS, PHENIX, PHOBOS, and STAR—indicate that RHIC’s gold-gold colli-sions produce a freely flowing liquid composed of quarks and gluons. Such a substance, often referred to as quark-gluon plasma, or QGP, filled the universe a few microseconds after it came into existence 13.7 billion years ago.
A novel Quark-Gluon Plasma power generation reactor is proposed in this work as displayed in Figure 10. It basically utilizes the output temperatures to heat up cold water and converts into a steam. The pressurized steam
y = 1.445x-1.24
0
0.5
1
1.5
2
1 2 3 4
Tcri.
, TK
QGP Tcri. of Group 4B
y = 1.365x-1.20
0
0.5
1
1.5
1 2 3 4
Tcri.
, TK
QGP Tcri. of Group 5B
y = 1.330x-1.19
0
0.5
1
1.5
1 2 3 4
Tcri.
, TK
QGP Tcri. of Group 6B
y = 1.262x-1.16
0
0.5
1
1.5
1 2 3 4
Tcri.
, TK
QGP Tcri. of Group 7B
y = 1.230x-1.14
0
0.5
1
1.5
1 2 3 4
Tcri.
, TK
QGP Tcri. of Group8B-1
y = 1.174x-1.12
0
0.5
1
1.5
1 2 3 4
Tcri.
, TK
QGP Tcri. of Group8B-2
y = 1.168x-1.13
R² = 0.983
0
0.5
1
1.5
1 2 3 4
Tcri.
, TK
QGP Tcri. of Group 8B-3
y = 1.091x-1.08
0
0.5
1
1.5
1 2 3 4
Tcri.
, TK
QGP Tcri. of Group 1B
y = 1.051x-1.06
0
0.5
1
1.5
1 2 3 4Tc
ri., T
K
QGP Tcri. of Group 2B
y = 1.501x-1.13
0
1
2
1 2 3 4
Tcri.
, TK
3QGP Tcri. of Group 3B

M. Al Shibli
451
Figure 8. The regression trend of QGP critical temperature for the lanthanides and actinides of the periodic table.
will generate a high mechanical rotational at the turbines and then high induced electrical power at the electrical generators. It is remarkable to note here that the outcome energy of the QGP range [5516 to 18.9 MeV] would be much higher compared with the nuclear fission which generates 0.8 MeV per atomic unit and 3.5 MeV per atomic unit that can be produced from the nuclear fusion as tabulated in Table 5.
8. Conclusions In this work, a new physical interpretation of the state of matter of the quark-gluon as the most fundamental building blocks in nature. Such a model is derived based on the assumption that dark matter and dark energy
y = -0.180x + 0.644
0
0.2
0.4
0.6
1 2
Tcri.
, TK
QGP Tcri. of Group La & Ac
y = -0.182x + 0.642
00.20.40.6
1 2
Tcri.
, TK
QGP Tcri. of Group Ce & Th
y = -0.178x + 0.636R² = 1
0
0.2
0.4
0.6
1 2
Tcri.
, TK
QGP Tcri. of Group Pr & Pa
y = -0.176x + 0.623
0
0.2
0.4
0.6
1 2
Tcri.
, TK
QGP Tcri. of Group Nd & U
y = -0.172x + 0.617
0
0.2
0.4
0.6
1 2Tc
ri., T
K
QGP Tcri. of Group Pm & Np
y = -0.164x + 0.593
00.20.40.6
1 2
Tcri.
, TK
QGP Tcri. of Group Sm & Pu
y = -0.159x + 0.583
0
0.2
0.4
0.6
1 2
Tcri.
, TK
QGP Tcri. of Group Eu & Am
y = -0.149x + 0.559
0
0.2
0.4
0.6
1 2
Tcri.
, TK
QGP Tcri. of Group Gd & Cm
y = -0.144x + 0.550
00.10.20.30.40.5
1 2
Tcri.
, TK
QGP Tcri. of Group Tb & Bk
y = -0.139x + 0.536
0
0.1
0.2
0.3
0.4
0.5
1 2
Tcri.
, TK
QGP Tcri. of Group Dy & Cr
y = -0.135x + 0.526
0
0.1
0.2
0.3
0.4
0.5
1 2
Tcri.
, TK
QGP Tcri. of Group Ho & Es
y = -0.134x + 0.520
0
0.2
0.4
0.6
1 2
Tcri.
, TK
QGP Tcri. of Group Er & Fm
y = -0.131x + 0.513
0
0.2
0.4
0.6
1 2
Tcri.
, TK
QGP Tcri. of Group Tm & Md
y = -0.123x + 0.496
0
0.2
0.4
1 2
Tcri.
, TK
QGP Tcri. of Group Yb & No
y = -0.122x + 0.490
00.10.20.30.4
1 2
Tcri.
, TK
QGP Tcri. of Group Lu & Lr

M. Al Shibli
452
Figure 9. The QGP phase diagram and associated critical temperature.
Figure 10. The novel QGP power generation plant.
behave as a perfect ideal fluid at extremely high temperature. By the virtue of Boltzmann constant of the ideal gas law and NASA’s Cosmic Microwave Background Explorer (CMB) which estimate that the space has an av-erage temperature close to 2.7251 Kelvin, then the equivalent mass-energy of the fundamental particle of the dark matter/dark energy is determined.
The average universe mass density of 30 39.91 10 g cm−× is equivalent to only 5.9 protons per cubic meter or 10 3 9 3 38.8981 10 J m 5.5302 10 eV m 5.5302 GeV m−× = × = . The temperature at which one entity will be gen-
erated is called in this work as the critical temperature and equals to 1264 10× Kelvin. The calculated critical temperature at which 5.9 protons per cubic meter are produced is found to be 1210.929 10× K. The equivalent mass of dark matter particle, its mean life time and frequency is further determined.
Based on the standard model, the gluon energy that bonds quarks of protons and the quarks of the neutron is investigated. Each proton quark is tied by 928.4 MeV gluon energy, Meanwhile, each proton quark is tied by
M. Al Shibli
453
Table 4. Projected values of quark-gluon plasma critical temperature of natural elements.
Element AW (Atomic Weight) Equivalent Energy (MeV) Critical Temperature (TK)
1 H - Hydrogen - [1.007 84; 1.008 11] 1.00784 5515.874746 63.97642483
2 He - Helium - 4.002 602(2) 4.002602 1388.876337 16.10902108
3 Li - Lithium - [6.938; 6.997] 6.938 801.2567316 9.293456327
4 Be - Beryllium - 9.012 1831(5) 9.01218315 616.8448989 7.154537244
5 B - Boron - [10.806; 10.821] 10.806 514.4474555 5.966870257
6 C - Carbon - [12.0096; 12.0116] 12.0096 462.889622 5.368871569
7 N - Nitrogen - [14.006 43; 14.007 28] 14.00643 396.8976537 4.603457126
8 O - Oxygen - [15.999 03; 15.999 77] 15.99903 347.4660154 4.030119326
9 F - Fluorine - 18.998 403 163(6) 18.99840316 292.6098134 3.393864181
10 Ne - Neon - 20.1797(6) 20.17976 275.4799464 3.195181707
11 Na - Sodium - 22.989 769 28(2) 22.98976928 241.8083947 2.804638846
12 Mg - Magnesium - [24.304, 24.307] 24.304 228.7326861 2.652978934
13 Al - Aluminium - 26.981 5385(7) 26.98153857 206.0341811 2.389708053
14 Si - Silicon - [28.084; 28.086] 28.084 197.9461332 2.29589802
15 P - Phosphorus - 30.973 761 998(5) 30.973762 179.4783341 2.081697406
16 S - Sulfur - [32.059; 32.076] 32.059 173.4027638 2.011229296
17 Cl - Chlorine - [35.446; 35.457] 35.446 156.8334707 1.819048694
18 Ar - Argon - 39.948(1) 39.9481 139.1585383 1.614044222
19 K - Potassium - 39.0983(1) 39.09831 142.1831073 1.649124988
20 Ca - Calcium - 40.078(4) 40.0784 138.7061161 1.608796758
21 Sc - Scandium - 44.955 908(5) 44.9559085 123.657143 1.434249738
22 Ti - Titanium - 47.867(1) 47.8671 116.1365365 1.347021232
23 V - Vanadium - 50.9415(1) 50.94151 109.1274916 1.265726124
24 Cr - Chromium - 51.9961(6) 51.99616 106.9140337 1.240053112
25 Mn - Manganese - 54.938 044(3) 54.9380443 101.1888806 1.17364935
26 Fe - Iron - 55.845(2) 55.8452 99.54515704 1.154584458
27 Co - Cobalt - 58.933 194(4) 58.9331944 94.32916815 1.09408629
28 Ni - Nickel 58.6934(4) 58.69344 94.71448946 1.098555477
29 Cu - Copper - 63.546(3) 63.5463 87.48139867 1.014661751
30 Zn - Zinc - 65.38(2) 65.382 85.02522413 0.986173565
31 Ga - Gallium - 69.723(1) 69.7231 79.7313832 0.924772421
32 Ge - Germanium - 72.630(8) 72.6308 76.53941859 0.887750101
33 As - Arsenic - 74.921 595(6) 74.9215956 74.19915659 0.860606338
34 Se - Selenium - 78.971(8) 78.9718 70.39372541 0.816468663
35 Br - Bromine - [79.901, 79.907] 79.901 69.57508922 0.80697363
36 Kr - Krypton - 83.798(2) 83.7982 66.33936295 0.769443735
37 Rb - Rubidium - 85.4678(3) 85.46783 65.04341112 0.754412508
38 Sr - Strontium - 87.62(1) 87.621 63.44505546 0.73587382
39 Y - Yttrium - 88.905 84(2) 88.905842 62.52816552 0.725239181
40 Zr - Zirconium - 91.224(2) 91.2242 60.93908419 0.706808062
M. Al Shibli
454
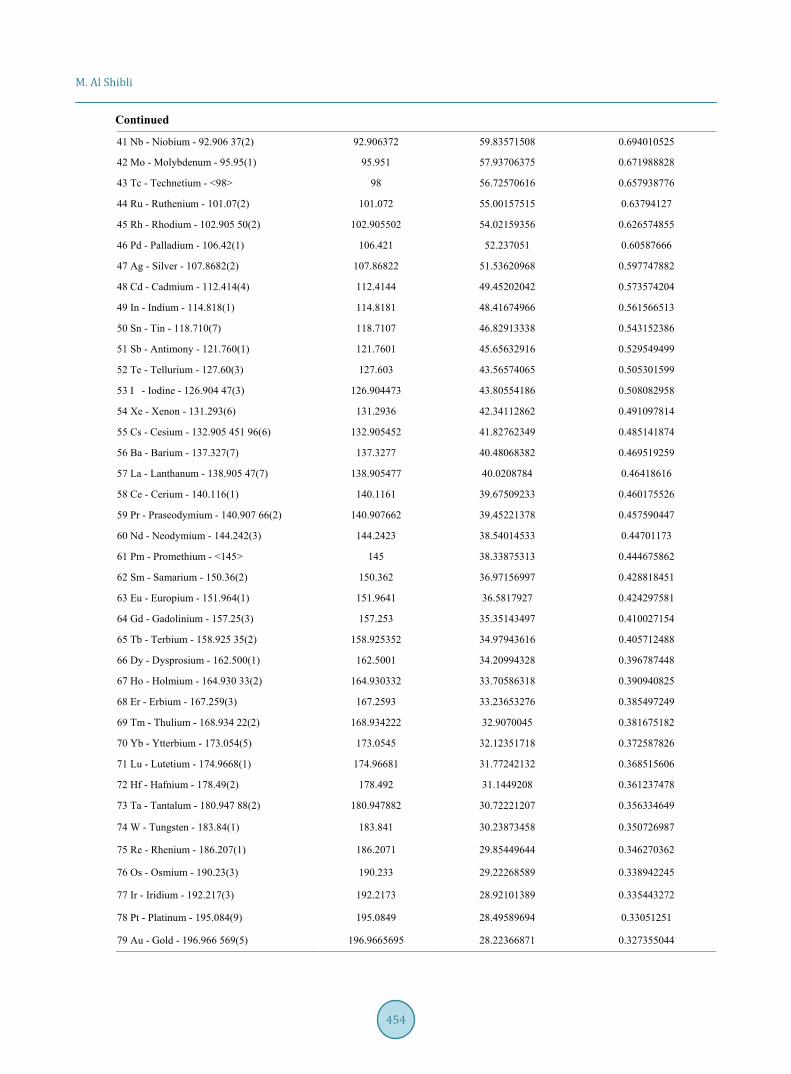
Continued
41 Nb - Niobium - 92.906 37(2) 92.906372 59.83571508 0.694010525
42 Mo - Molybdenum - 95.95(1) 95.951 57.93706375 0.671988828
43 Tc - Technetium - <98> 98 56.72570616 0.657938776
44 Ru - Ruthenium - 101.07(2) 101.072 55.00157515 0.63794127
45 Rh - Rhodium - 102.905 50(2) 102.905502 54.02159356 0.626574855
46 Pd - Palladium - 106.42(1) 106.421 52.237051 0.60587666
47 Ag - Silver - 107.8682(2) 107.86822 51.53620968 0.597747882
48 Cd - Cadmium - 112.414(4) 112.4144 49.45202042 0.573574204
49 In - Indium - 114.818(1) 114.8181 48.41674966 0.561566513
50 Sn - Tin - 118.710(7) 118.7107 46.82913338 0.543152386
51 Sb - Antimony - 121.760(1) 121.7601 45.65632916 0.529549499
52 Te - Tellurium - 127.60(3) 127.603 43.56574065 0.505301599
53 I - Iodine - 126.904 47(3) 126.904473 43.80554186 0.508082958
54 Xe - Xenon - 131.293(6) 131.2936 42.34112862 0.491097814
55 Cs - Cesium - 132.905 451 96(6) 132.905452 41.82762349 0.485141874
56 Ba - Barium - 137.327(7) 137.3277 40.48068382 0.469519259
57 La - Lanthanum - 138.905 47(7) 138.905477 40.0208784 0.46418616
58 Ce - Cerium - 140.116(1) 140.1161 39.67509233 0.460175526
59 Pr - Praseodymium - 140.907 66(2) 140.907662 39.45221378 0.457590447
60 Nd - Neodymium - 144.242(3) 144.2423 38.54014533 0.44701173
61 Pm - Promethium - <145> 145 38.33875313 0.444675862
62 Sm - Samarium - 150.36(2) 150.362 36.97156997 0.428818451
63 Eu - Europium - 151.964(1) 151.9641 36.5817927 0.424297581
64 Gd - Gadolinium - 157.25(3) 157.253 35.35143497 0.410027154
65 Tb - Terbium - 158.925 35(2) 158.925352 34.97943616 0.405712488
66 Dy - Dysprosium - 162.500(1) 162.5001 34.20994328 0.396787448
67 Ho - Holmium - 164.930 33(2) 164.930332 33.70586318 0.390940825
68 Er - Erbium - 167.259(3) 167.2593 33.23653276 0.385497249
69 Tm - Thulium - 168.934 22(2) 168.934222 32.9070045 0.381675182
70 Yb - Ytterbium - 173.054(5) 173.0545 32.12351718 0.372587826
71 Lu - Lutetium - 174.9668(1) 174.96681 31.77242132 0.368515606
72 Hf - Hafnium - 178.49(2) 178.492 31.1449208 0.361237478
73 Ta - Tantalum - 180.947 88(2) 180.947882 30.72221207 0.356334649
74 W - Tungsten - 183.84(1) 183.841 30.23873458 0.350726987
75 Re - Rhenium - 186.207(1) 186.2071 29.85449644 0.346270362
76 Os - Osmium - 190.23(3) 190.233 29.22268589 0.338942245
77 Ir - Iridium - 192.217(3) 192.2173 28.92101389 0.335443272
78 Pt - Platinum - 195.084(9) 195.0849 28.49589694 0.33051251
79 Au - Gold - 196.966 569(5) 196.9665695 28.22366871 0.327355044

M. Al Shibli
455
Continued
80 Hg - Mercury - 200.592(3) 200.5923 27.71352242 0.321438061
81 Tl - Thallium - [204.382; 204.385] 204.382 27.19965165 0.31547788
82 Pb - Lead - 207.2(1) 207.21 26.82843108 0.311172241
83 Bi - Bismuth - 208.980 40(1) 208.980401 26.601151 0.30853611
84 Po - Polonium - <209> 209 26.59865648 0.308507177
85 At - Astatine - <210> 210 26.47199621 0.307038095
86 Rn - Radon - <222> 222 25.0410775 0.290441441
87 Fr - Francium - <223> 223 24.92878567 0.289139013
88 Ra - Radium - <226> 226 24.59787258 0.285300885
89 Ac - Actinium - <227> 227 24.48951191 0.284044053
90 Th - Thorium - 232.037 7(4) 232.03774 23.95782343 0.277877211
91 Pa - Protactinium - 231.035 88(2) 231.035882 24.06171351 0.27908219
92 U - Uranium - 238.028 91(3) 238.028913 23.3548065 0.270883059
93 Np - Neptunium - <237> 237 23.45619917 0.272059072
94 Pu - Plutonium - <244> 244 22.78327543 0.264254098
95 Am - Americium - <243> 243 22.87703376 0.265341564
96 Cm - Curium - <247> 247 22.50655548 0.261044534
97 Bk - Berkelium - <247> 247 22.50655548 0.261044534
98 Cf - Californium - <251> 251 22.14788528 0.256884462
99 Es - Einsteinium - <252> 252 22.05999684 0.255865079
100 Fm - Fermium - <257> 257 21.63081402 0.25088716
101 Md - Mendelevium - <258> 258 21.54697366 0.249914729
102 No - Nobelium - <259> 259 21.46378071 0.248949807
103 Lr - Lawrencium - <262> 262 21.21801223 0.246099237
104 Rf - Rutherfordium - <267> 267 20.82067118 0.241490637
105 Db - Dubnium - <268> 268 20.7429821 0.240589552
106 Sg - Seaborgium - <271> 271 20.513355 0.237926199
107 Bh - Bohrium - <272> 272 20.43793825 0.237051471
108 Hs - Hassium - <270> 270 20.58933039 0.238807407
109 Mt - Meitnerium - <276> 276 20.14173625 0.233615942
110 Ds - Darmstadtium - <281> 281 19.78334236 0.229459075
111 Rg - Roentgenium - <280> 285 19.50568142 0.226238596
112 Cn - Copernicium - <285> 285 19.50568142 0.226238596
113 Uut - Ununtrium - <284> 284 19.57436339 0.227035211
114 Fl - Flerovium - <289> 289 19.23570659 0.223107266
115 Uup - Ununpentium - <288> 288 19.30249724 0.223881944
116 Lv - Livermorium - <293> 293 18.97310309 0.220061433
117 Uus- <294> 294 18.90856872 0.219312925
118 Uuo - Ununoctium - <294> 294 18.90856872 0.219312925
Average 140.3485256 1.627846409

M. Al Shibli
456
Table 5. Comparison of QGP energy outcome with other energy sources.
No. Energy Source Output Energy, MeV
1 QGP of Hydrogen 5515/atomic unit
2 QGP of Helium 1389/atomic unit
3 QGP of Lead 207/atomic unit
4 QGP of Gold 197/atomic unit
5 Nuclear Fission 0.8/atomic unit
6 Nuclear Fusion 3.5/atomic unit
7 Hydrogen Ion annihilation 938/atomic unit
926 MeV gluon energy.
Moreover, this research has investigated the expansion of the universe based on the thermodynamics isother-mal concept. It is concluded that the universe rate of change of pressure with respect of its volume is inversely proportional to the negative of squared volume 21 V− . Furthermore, since the dark energy pressure is so tiny,
10 38.8981 10 J m−× , but not zero, then it yields that the universe volume is not infinite and flat with current un-iverse pressure to volume rate of change 88 2 31.155 10 N m m−− × .
Furthermore, the individual critical temperature of the quark-gluon plasma matter at which the elements of the Periodic Table are generated is determined. Based on the results, a novel Periodic Table is introduced. It can be seen that the highest critical temperature needed to generate quark-gluon plasma (QGP) from Hydrogen atom is 64 TK (5516 MeV), followed by 16.1 TK (1389 MeV) needed to generate QGP from Helium, and ended by the 0.219 TK (18.9 MeV) to produce QGP from the last Periodic undiscovered yet element. It is interesting to know that the critical temperatures at which QGP is generated out of Gold atom and Uranium atom are 0.327 TK (28.8 MeV) and 0.271 (23.4 MeV), respectively. The average QGP critical temperature of all natural elements is figured to be 1.627 TK (18.9 MeV).
Additionally, the QGP critical temperature trend of the elements of the Periodic Table Groups and Periods is then tested. It is figured out that the overall trend is of negative power regression 1.09940.07y x−= (TK) in Temperature scale and 1.0993455.1y x−= (MeV) in energy scale. This hints how is the trend at which the elements are created after the Big Bang. The QGP critical temperature is decreasing dramatically going down from Hy-drogen, through Helium and ending by the Transition metals at Period 7. Then, the QGP critical temperatures of the Periods and the groups are examined separately. The critical temperature of Periods is found to have either linear trend with negative slope or quadratic decreasing trend. The first Period takes the linear form, followed by a quadratic form for the second Period, followed by a linear trend for the third Period, followed by quadratic form for the fourth Period, and then followed by a linear trend for all successive Periods fifth, sixth and the seventh. It is noticed that the negative slope is increasing by going down from the top Period to the bottom Period from slope −47.867 to −0.00038. The quadratic coefficient is also decreasing from 0.1078 in Period 2 to 0.0019 in Period 4.
On the other hand, the QGP critical temperatures of the groups are investigated. The critical temperature of groups is found to have negative power aggression trend. It is found out that both the power coefficient and neg-ative exponent are decreasing as we go from left side of the groups A to the right side of groups A. Similarly, groups B are showing a decreasing QGP critical temperature pattern. It noticed that the negative slope is in-creasing by going down from the top Period to the bottom Period. For example, Group 1A shows a power trend of 2.73763.055y x−= (TK) (or 1.90210.356y x−= (TK) * excluding H), and ends with 2.19916.077y x−= (TK) (or 1.5323.7873y x−= (TK) Excluding He). Likely, Groups B (starting with 4B, 5B, 6B, 7B, 8B1, 8B2, 8B3, 1B and 2B) demonstrate negative power regression starting with 1.2471.4459y x−= and ending with
1.0671.0516y x−= (TK). The exception to this pattern is Group 3B which shows linearly decreasing trend begin-ning with 1.1361.5012y x−= (TK) and terminating with behavior 0.1224 0.4909y x= − + (TK). The QGP critical temperatures of lanthanide and actinide series pattern demonstrate a decreasing linear regression trend.
A new QGP phase diagram depicts that the Hardon Epoch is proposed in this work. The QGP phase diagram presents a critical point that separates the two phases: the hadron gas in which quarks are confined, and the quark-gluon plasma (QGP). Finally, a novel Quark-Gluon Plasma power generation reactor is proposed. It basi-
M. Al Shibli
457
cally utilizes the output temperatures to heat up cold water and converts the water into a steam. The pressurized steam will generate a high mechanical rotational at the turbines and then high induced electrical power at the electrical generators. It is remarkable to note here that the outcome energy of the QGP range [5516 to 18.9 MeV] will be much higher compared with the nuclear fission which generates 0.8 MeV per atomic unit and 3.5 MeV per atomic unit that can be produced from the nuclear fusion. Future work will elaborate more on this QCD power plant analysis and design.
References [1] Knop, R.A., Aldering, G., Amanullah, R., Astier, P., Blanc, G., Burns, M.S., et al. (2003) New Constraints on ΩM, ΩΛ,
and w from an Independent Set of Eleven High-Redshift Supernovae Observed with HST. Astrophysical Journal, 598, 102-137. http://dx.doi.org/10.1086/378560
[2] Permutter, S., Aldering, G., Goldhaber, G., Knop, R.A., Nugent, P., Castro, P.G., et al. (1999) Measurements of Ome-ga and Lambda from 42 High Redshift Supernovae. Astrophysical Journal, 517, 565-586. http://dx.doi.org/10.1086/307221
[3] Riess, A.G., Filippenko, A.V., Challis, P., Clocchiatti, A., Diercks, A., Garnavich, P.M., et al. (1998) Observational Evidence from Supernovae for an Accelerating Universe and Cosmological Constant. Astronomical Journal, 116, 1009-1038. http://dx.doi.org/10.1086/300499
[4] Maartens, R. and Majerotto, E. (2006) Observational Constraints on Self-Accelerating Cosmology. Journal of Astro-physics, 74, 2-6. http://dx.doi.org/10.1103/physrevd.74.023004
[5] Perlmutter, S., Turner, M.S. and White, M. (1999) Constraining Dark Energy with SNe Ia and Large-Scale Structure. Physical Review Letters, 83, 670-673. http://dx.doi.org/10.1103/PhysRevLett.83.670
[6] Freedman, W.L., Madore, B.F., Gibson, B.K., Ferrarese, L., Kelson, D.D., Sakai, S., et al. (2000) Final Results from the Hubble Space Telescope Key Project to Measure the Hubble Constant. Journal of Astrophysics, 553, 47-72. http://dx.doi.org/10.1086/320638
[7] Tonry, J.L., Schmidt, B.P., Barris, B., Candia, P., Challis, P., Clocchiatti, A., et al. (2003) Cosmological Results from High-z Supernovae. Journal of Astrophysics, 594, 1-24. http://dx.doi.org/10.1086/376865
[8] Spergel, D.N., Bean, R., Doré, O., Nolta, M.R., Bennett, C.L., Dunkley, J., et al. (2006) Wilkinson Microwave Aniso-tropy Probe (WMAP) Three Year Results: Implications for Cosmology. WMAP Collaboration.
[9] Carroll, S.M. (2003) Why Is the Universe Accelerating? AIP Conference Proceedings, 743, 16-32. http://dx.doi.org/10.1063/1.1848314
[10] Einstein, A. (1914-1917) The Foundation of the General Theory of Relativity. [The Collected Papers of Einstein, Eng-lish Translation Edited by Kox, A.J., Klien, M.J. and Schulmann, R., Vol. 6, Princeton University Press, 1997]. The Berlin Years Writing, 146-200.
[11] Shibli, M. (2007) The Foundation of the Fourth Law of Thermodynamics: Dark Energy and Its Nature: Can Dark Energy Be Generated? International Conference on Renewable Energies and Power Quality (ICREPQ’07), Seville, 26-28 March 2007, European Association for the Development of Renewable Energies, Environment and Power Qual-ity. www.icrepq.com
[12] Turner, M.S. (1999) Dark Matter and Dark Energy in the Universe. The Third Astro. Symposium: The Galactic Halo ASP Conference Series, Vol. 666.
[13] Huterer, D. and Turner, M.S. (1999) Prospects for Probing the Dark Energy via Supernova Distance Measurements. Physical Review D, 60, Article ID: 081301. http://dx.doi.org/10.1103/physrevd.60.081301
[14] Carroll, S.M., Hoffman, M. and Trodden, M. (2003) Can the Dark Energy Equation-of-State Parameter w Be Less than −1? Physical Review D, 68, Article ID: 023509. http://dx.doi.org/10.1103/PhysRevD.68.023509
[15] Huterer, D. and Turner, M.S. (2001) Probing Dark Energy: Methods and Strategies. Physical Review D, 64, Article ID: 123527. http://dx.doi.org/10.1103/physrevd.64.123527
[16] Peebles, P.J.E. and Ratra, B. (2003) The Cosmological Constant and Dark Energy. Reviews of Modern Physics, 75, 559-606. http://dx.doi.org/10.1103/revmodphys.75.559
[17] Copeland, E.J., Sami, M. and Tsujikawa, S. (2006) Dynamics of Dark Energy. International Journal of Modern Phys-ics D, 15, 1753-1935. http://dx.doi.org/10.1142/S021827180600942X
[18] Volovik, G.E. (2006) Vcauum Energy: Myths and Reality. International Journal of Modern Physics D, 15, 1987-2010. http://dx.doi.org/10.1142/S0218271806009431
[19] Carroll, S.M., Sawicki, I., Silvestri, A. and Trodden, M. (2006) Modified-Source Gravity and Cosmological Structure Formation. New Journal of Physics, 8, 323. http://dx.doi.org/10.1088/1367-2630/8/12/323

M. Al Shibli
458
[20] Carroll, S.M. (2001) The Cosmological Constant. Living Reviews of Relativity, 4. http://dx.doi.org/10.12942/lrr-2001-1 [21] Dvali, G. and Turner, M. (2003) Dark Energy as a Modifications of the Friedmann Equation. Journal of Astrophysics,
2, 11. [22] Spergel, D.N., Bean, R., Doré, O., Nolta, M.R., Bennett, C.L., Dunkley, J., et al. (2007) Three-Year Wilkinson Micro-
wave Anisotropy Probe (WMAP) Observations. The Astrophysical Journal Supplement Series, 170, 377-408. http://dx.doi.org/10.1086/513700
[23] Komatsu, E., Smith, K.M., Dunkley, J., et al. (2010) Seven-Year Wilkinson Microwave Anisotropy Probe (WMAP) Observations: Cosmological Interpretation. Astrophysical Journal Supplement Series. http://arxiv.org/abs/1001.4538v3
[24] Spergel, D.N., Verde, L., Peiris, H.V., Komatsu, E., Nolta, M.R., Bennett, C.L., et al. (2003) First Year Wilkinson Mi-crowave Anisotropy Probe (WMAP) Observations: Determination of Cosmological Parameters. The Astrophysical Journal Supplement Series, 148, 175-194. http://dx.doi.org/10.1086/377226
[25] Shibli, M. (2011) The Foundation of the Theory of the Universe Dark Energy and Its Nature. Natural Science, 3, 165-185. http://dx.doi.org/10.4236/ns.2011.33023
[26] Jacak, B.V. and Müller, B. (2015) The Exploration of Hot Nuclear Matter. Science, 337, 310-314. http://dx.doi.org/10.1126/science.1215901
[27] US Department of Energy’s (DOE) Brookhaven National Laboratory (2010) New Findings on Hot Quark Soup Pro-duced at RHIC.
[28] Stephanov, M.A. (2006) QCD Phase Diagram: An Overview. High Energy Physics—Lattice, arXiv.org. [29] Fukao, Y. (2006) The Overview of the Spin Physics at RHIC-PHENIX Experiment. High Energy Physics, arXiv.org. [30] Sowinski, J. (2007) Exploring the Spin Structure of the Proton with Two-Body Partonic Scattering at RHIC. High
Energy Physics, arXiv.org. [31] Song, H.C., Bass, S.A., Heinz, U.W., Hirano, T. and Shen, C. (2011) 200 A GeV Au+Au Collisions Serve a Nearly
Perfect Quark-Gluon Liquid. Physical Review Letters, 106, Article ID: 192301. http://dx.doi.org/10.1103/PhysRevLett.106.192301
[32] Cheng, M., Christ, N.H., Datta, S., van der Heide, J., Jung, C., Karsch, F., Kaczmarek, O., Laermann, E., Mawhinney, R.D., Miao, C., Petreczky, P., Petrov, K., Schmidt, C., Soeldner, W. and Umeda, T. (2008) The QCD Equation of State with Almost Physical Quark Masses. Physical Review D, 77, Article ID: 014511. http://dx.doi.org/10.1103/PhysRevD.77.014511
[33] Cheng, M., Christ, N.H., Datta, S., van der Heide, J., Jung, C., Karsch, F., Kaczmarek, O., Laermann, E., Mawhinney, R.D., Miao, C., Petreczky, P., Petrov, K., Schmidt, C. and Umeda, T. (2006) The Transition Temperature in QCD. Physical Review D, 74, Article ID: 054507. http://dx.doi.org/10.1103/PhysRevD.74.054507
[34] Cengel, Y.A. and Boles, M.A. (2006) Thermodynamics: An Engineering Approach. Fifth Edition, McGraw Hill, New York.
[35] Coughlan, G.D., Dodd, J.E. and Gripaios, B.M. (2006) The Ideas of Particle Physics: An Introduction for Scientists. [36] Hawking, S.W. (1998) A Brief History of Time: From the Big Bang to Black Holes. Bantam Books, Inc., New York. [37] Shibli, M. (2008) The Equation of State of Dark Energy and Dark Matter: Boltzmann Constant and the Unified Entity:
Utilization of Space Energy. ICREPQ’08, Santander, 12-14 March 2008, European Association for the Development of Renewable Energies, Environment and Power Quality.
[38] Shibli, M. (2009) The Fundamental Particle and Energy Quanta of Dark Matter and Dark Energy: Boltzmann Particles and Utilization Its Energy. International Conference on Renewable Energies and Power Quality (ICREPQ’09), Valen-cia, 15-17 April 2009, pp.
[39] Freese, K. and Kinney, W.H. (2002) The Ultimate Fate of Life in an Accelerating Universe. Physics Letters B, 588, 1-8. http://dx.doi.org/10.1016/S0370-2693(02)02122-6
[40] Mohr, P.J., Taylor, B.N. and Newell, D.B. (2007) CODATA Recommended Values of the Fundamental Physical Con-stants. National Institute of Standards and Technology, Gaithersburg.
[41] Emsley, J. (2001) Nature’s Building Blocks: An A-Z Guide to the Elements (New Edition). Oxford University Press, New York.
[42] Shibli, M. (2011) The Basic Blocks of the Universe Matter: Boltzmann Fundamental Particle and Energy Quanta of Dark Matter and Dark Energy. Natural Science, 3, 743-749. http://dx.doi.org/10.4236/ns.2011.39099