interpretation of geotechnical properties … · · 2009-08-05one of the most pressing needs for...
TRANSCRIPT
July 2008Balasingam MuhunthanFarid Sariosseiri
WA-RD 715.1
Office of Research & Library Services
WSDOT Research Report
INTERPRETATION OF GEOTECHNICAL PROPERTIES OF CEMENT TREATED SOILS


Research Report
FHWA Contract DTFH61-05-C-00008
Compaction Control of Marginal Soils in Fills
INTERPRETATION OF GEOTECHNICAL PROPERTIES
OF CEMENT TREATED SOILS
by
Balasingam Muhunthan and Farid Sariosseiri Washington State Transportation Center (TRAC)
Washington State University Department of Civil & Environmental Engineering
Pullman, WA 99164-2910
Prepared for The Federal Highway Administration
U.S. Department of Transportation
Hamid Ghasemi, Project Technical Manager
July 2008

1. REPORT NO. 2. GOVERNMENT ACCESSION NO. 3. RECIPIENTS CATALOG NO WA-RD 715.1
4. TITLE AND SUBTITLE 5. REPORT DATE July 2008 6. PERFORMING ORGANIZATION CODE
Interpretation of Geotechnical Properties of Cement Treated Soils 7. AUTHOR(S) 8. PERFORMING ORGANIZATION REPORT NO. Balasingam Muhunthan and Farid Sariosseiri
9. PERFORMING ORGANIZATION NAME AND ADDRESS 10. WORK UNIT NO. 11. CONTRACT OR GRANT NO.
Washington State University Department of Civil & Environmental Engineering Pullman, WA 99164-2910 12. CO-SPONSORING AGENCY NAME AND ADDRESS 13. TYPE OF REPORT AND PERIOD COVERED
Final Report 14. SPONSORING AGENCY CODE
Research Office Washington State Department of Transportation PO Box 47372 Olympia, WA 98504-7372 Project Manager: Kim Willoughby 360.705.7978
15. SUPPLEMENTARY NOTES This study was conducted in cooperation with the U.S. Department of Transportation, Federal Highway Administration. 16. ABSTRACT
One of the most pressing needs for research in the geotechnical area is on the issue of the use of marginal soils (e.g. silts, soft rock, etc.) for fills and as backfill material for walls and bridge abutments. The lack of availability of higher quality materials and the added costs for these materials will eventually force engineers to use marginal soils when in the past these marginal soils were replaced with materials of better quality. Often however, high water content and low workability of these soils pose difficulties for construction projects. Frequently, additives such as lime, cement, fly ash, lime-cement-fly ash admixture, cement kiln dust, emulsified asphalt, Geofiber, and polymer stabilizers are used to improve their engineering properties. The choice and effectiveness of an additive depends on the type of soil and its field conditions. Nevertheless knowledge of mechanistic behavior of treated soil is equally important as selecting the stabilizer.
This study first presents a critical examination of the use of various additives on soil improvement projects. It then presents a comprehensive examination of the effectiveness of cement treatment on geotechnical properties of soils from Aberdeen, Everett, and Palouse regions from the state of Washington. The addition of cement was found to improve the drying rate, workability and compaction characteristics of the soils. Significant improvement in unconfined compressive strength and modulus of elasticity are attained by cement treatment of these soils.
Results of undrained triaxial tests showed that while cement treatment improved shear strength significantly, the type of failure behavior varied greatly. Non-treated, 5%, and 10% cement treated soils displayed ductile, planar, and splitting type of failure, respectively. For 10% cement treated soils pore pressures rose rapidly to confining pressures resulting in zero effective confining pressure at failure. Consequently, specimens split vertically. Therefore, while increase in strength can be achieved by cement treatment, high percentages of cement should be used with extreme caution in field applications.
The results of triaxial tests on Aberdeen soil were interpreted using the critical state framework. As a result of cement treatment interlocking increased, critical state friction remained constant and soils displayed anisotropic behavior. The anisotropic model presented by Muhunthan and Masad (1997) was used to predict the undrained stress path. A combination of this model with extended Griffith theory can be used to predict the complete shear behavior of cement treated soil in q-p΄ space. The main contributions of this study to practice are on quantifying improvement in mechanical behavior due to cement treatment and highlighting the fact that higher percentages of cement could turn stabilization from beneficial to an extremely dangerous practice. 17. KEY WORDS 18. DISTRIBUTION STATEMENT Fill material, marginal soils, cement treated soil 19. SECURITY CLASSIF. (of this report) 20. SECURITY CLASSIF. (of this page) 21. NO. OF PAGES 22. PRICE None None
ii

DISCLAIMER
The contents of this report reflect the views of the authors, who are responsible for the
facts and accuracy of the data presented herein. The contents do not necessarily reflect
the official views or policies of the Washington State Department of Transportation or
the Federal Highway Administration. This report does not constitute a standard,
specification, or regulation.
iii

EXECUTIVE SUMMARY
One of the most pressing needs for research in the geotechnical area is on the
issue of the use of marginal soils (e.g. silts, soft rock, etc.) for fills and as backfill
material for walls and bridge abutments. The lack of availability of higher quality
materials and the added costs for these materials will eventually force engineers to use
marginal soils when in the past these marginal soils were replaced with materials of better
quality. Often however, high water content and low workability of these soils pose
difficulties for construction projects. Frequently, additives such as lime, cement, fly ash,
lime-cement-fly ash admixture, cement kiln dust, emulsified asphalt, Geofiber, and
polymer stabilizers are used to improve their engineering properties. The choice and
effectiveness of an additive depends on the type of soil and its field conditions.
Nevertheless knowledge of mechanistic behavior of treated soil is equally important as
selecting the stabilizer.
This study first presents a critical examination of the use of various additives on
soil improvement projects. It then presents a comprehensive examination of the
effectiveness of cement treatment on geotechnical properties of soils from Aberdeen,
Everett, and Palouse regions from the state of Washington. The addition of cement was
found to improve the drying rate, workability and compaction characteristics of the soils.
Significant improvement in unconfined compressive strength and modulus of elasticity
are attained by cement treatment of these soils.
Results of undrained triaxial tests showed that while cement treatment improved
shear strength significantly, the type of failure behavior varied greatly. Non-treated, 5%,
and 10% cement treated soils displayed ductile, planar, and splitting type of failure,
iv

respectively. For 10% cement treated soils pore pressures rose rapidly to confining
pressures resulting in zero effective confining pressure at failure. Consequently,
specimens split vertically. Therefore, while increase in strength can be achieved by
cement treatment, high percentages of cement should be used with extreme caution in
field applications.
The results of triaxial tests on Aberdeen soil were interpreted using the critical
state framework. As a result of cement treatment interlocking increased, critical state
friction remained constant and soils displayed anisotropic behavior. The anisotropic
model presented by Muhunthan and Masad (1997) was used to predict the undrained
stress path. A combination of this model with extended Griffith theory can be used to
predict the complete shear behavior of cement treated soil in q-p΄ space.
The main contributions of this study to practice are on quantifying improvement
in mechanical behavior due to cement treatment and highlighting the fact that higher
percentages of cement could turn stabilization from beneficial to an extremely dangerous
practice.
v

TABLE OF CONTENTS
Page
List of Figures ………………………………………………………………………….....x
List of Tables…………………………………………………………………………...xvii
CHAPTER ONE: INTRODUCTION……………………………………………..………1
1.1 Introduction…………………………………………………………………....1
1.2 Objectives……………………………………………………………….…….3
1.3 Organization of report…………………………………………………….…...4
CHAPTER TWO: BACKGROUND………………………………………………..…….5
2.1 Introduction……………………………………………………………..……..5
2.2 Lime stabilization………………………………………………………..…….5
2.2.1Chemical reaction……………………………………………….…...6
2.2.2 Lime treatment application and advantages………………….……..7
2.2.3 Compaction characteristics…………………………………….……7
2.2.4 Swell potential………………………………………………….…...8
2.2.5 Shear strength and stress-strain behavior……………………….….10
2.2.6 Fatigue and durability……………………………………………...12
2.2.7 Suitability…………………………………………………………..12
2.2.8 Quantity…………………………………………………….………14
2.3 Cement stabilization………………………………………………………….14
2.3.1 Strength…………………………………………………………….15
2.3.2 Durability……………………………………………………….….20
2.3.3 Compressibility……………………………………………….……21
vi

2.4 Fly ash………………………………………………………………….…….22
2.5 Lime-cement-fly ash…………………………………………………….…...23
2.6 Emulsified asphalt………………………………………………………........25
2.7 Cement kiln dust…………………………………………………….……….26
2.8 Selection of additive………….…………………………………….………..28
2.8.1 Currin et al. method……………………………………….…….....28
2.8.2 US Army Corps of Engineers method……………………….….....28
2.9 Non-traditional stabilizers…………………………………………….….......32
2.9.1 Polymers…………………………………………………………...32
2.9.2 Fiber reinforcement…………………………………….…………..33
2.9.3 Salt (Sodium Chloride) …………………………………………....34
2.10 Environmental issues…………………………………………………….....35
2.11 Failure criteria for cement treated soils…………………………………….36
2.11.1 Introduction…………..……………………………………….….36
2.11.2 Griffith and modified Griffith crack theory………………………36
2.11.3 Johnston’s failure criterion......................................................…...42
2.11.4 Critical state framework and Cam-clay failure criterion……........43
2.11.4.1 Introduction……………………….................................43
2.11.4.2 State of soils………………………………………….…46
2.11.4.3 Liquidity index, confining stress and soil behavior….…49
CHAPTER THREE: EXPERIMENTAL WORK………………………………….……52
3.1 Materials……………………………………………………………………..52
3.2 Testing program……………………………………………………………..56
vii

3.2.1 Drying rate of the soils (solidification)……………………………56
3.2.2 Atterberg limits, Casagrande method……………………………..56
3.2.3 Atterberg limits, fall cone test (cone penetration)…………………57
3.2.4 Standard proctor (compaction)…………………………………….59
3.2.5 Unconfined compressive strength…………………………………59
3.2.5.1 Specimen preparation…………………………………….60
3.2.6 Consolidated-undrained triaxial……………………………………61
3.2.6.1 Specimen preparation…………………………………….61
3.2.6.2 Saturation……………………………………………...…62
3.2.6.3 Consolidation and shearing………………………………64
3.2.7 Oedometer test (consolidation)…………………………………….65
CHAPTER FOUR: RESULTS AND DISCUSSION……………………………………66
4.1 Introduction…………………………………………………………………..66
4.2 Grain size analysis………………………………………………………...…66
4.3 Solidification………………………………………………………….……...67
4.4 Atterberg limits………………………………………………………………69
4.5 Compaction characteristics…………………………………………………..71
4.6 Unconfined compressive strength……………………………………………73
4.6.1 Aberdeen soil………………………………………………………73
4.6.2 Everett soil…………………………………………………………76
4.6.3 Palouse loess……………………………………………………….79
4.7 Consolidated-undrained triaxial……………………………...………………83
4.7.1 Aberdeen soil....................................................................................83
viii

4.7.2 Everett soil........................................................................................90
4.8 Oedometer………………………………………............................................96
4.9 Failure criteria..................................................................................................98
4.9.1 Mohr-Coulomb failure envelope.......................................................98
4.9.1.1 Aberdeen soil.....................................................................98
4.9.1.2 Everett soil.......................................................................100
4.9.2 Griffith and modified Griffith crack theory....................................101
4.9.2.1 Aberdeen soil...................................................................101
4.9.2.2 Everett soil.......................................................................104
4.9.3 Johnston failure criterion................................................................106
4.9.3.1 Aberdeen soil...................................................................106
4.9.3.2 Everett soil.......................................................................107
CHAPTER FIVE: CRITICAL STATE FRAMEWORK AND MECHANICAL
BEHAVIOR OF CEMENT TREATED SOILS……………...........109
5.1 Introduction…………………………………………………………......…..109
5.2 Determining the critical state parameter………………………...………….109
5.3 Effect of cement treatment on stress path…………………………………..110
5.4 Plastic energy dissipation and yield surface……………………………..…114
5.5 Brittle behavior in q-p΄ space.........................................................................117
5.6 Liquidity index and limits of soil behavior....................................................119
CHAPTER SIX: CONCLUSIONS………………………………….....................….…121
6.1 Introduction....................................................................................................121
6.2 Observations..................................................................................................122
ix
6.3 Conclusions....................................................................................................126
ACKNOWLEDGMENTS …………………………………………………………… 128
REFERENCES………………………………………………………………........……128
x
LIST OF FIGURES
Page
Figure 2.1 Changes in compaction characteristics by addition of lime………………8
Figure 2.2 Swell pressure density relationship……………………………………….9
Figure 2.3 Swell potential as a function of plasticity index…………………………10
Figure 2.4 Stress-strain characteristics of lime stabilized Goose Lake clay with
time………………………………………………………………………11
Figure 2.5 Flexural fatigue response curves of lime-stabilized soils in Illinois……..13
Figure 2.6 Relationship between cement content and unconfined compressive
strength for cement treated soil…………………………………………16
Figure 2.7 Effect of curing time on unconfined compressive strength of cement
treated soils……………………………………………………………..17 Figure 2.8 Effect of cement content on effective cohesion for several coarse-grained
and fine-grained soils……………………………………………………19
Figure 2.9 Effect of relative compaction on unconfined compressive of cement
treated soils………………………………………………………………19
Figure 2.10 Relationship between unconfined compressive strength and durability of
cement treated soils………………………………………………………20
Figure 2.11 Consolidation curve for Bangkok clay…………………………………..21
Figure 2.12 Determination of appropriate stabilizer based on Currin et al. (1976) ….29
Figure 2.13 Gradation triangle for selecting a commercial stabilizer based on army
manual……….........……………………………………………………..30
xi

Figure 2.14 Failure envelope based on Griffith crack theory in terms of principal
stresses………………………………………………………………...…37
Figure 2.15 Failure envelope based on Griffith crack theory in terms of shear and
normal stresses…………………………………………………………..38
Figure 2.16 Failure envelope based on modified Griffith crack theory in terms of shear
and normal stresses………………………………………………………39
Figure 2.17 Comparison between measured strength and predicted values by Griffith
theory for cement treated gravel…………………………………………40
Figure 2.18 Comparison between measured strength and predicted values by Griffith
theory for cement treated silty clay oil………………………………… 40
Figure 2.19 Failure envelope for cement treated soils………………………………..41
Figure 2.20 Critical state line in q-p' space……………………………………...……45
Figure 2.21 Critical state line in V-ln P΄ space…………………………………….…45
Figure 2.22a Limits of stable states of soils in normalized q/pcrit - p/pcristress space…47
Figure 2.22b Limits of stable states of soils in V-ln p' space………………...………47
Figure 2.23 Liquidity and limits of soil behavior in LI-log p΄ space……..….……….50
Figure 3.1 Loess distribution map in North America……………………………..…53
Figure 3.2 Glacial till distribution map…………………………………………...…54
Figure 3.3 Grays Harbor basin areas…………………………………………….…..54
Figure 3.4 Distribution of Lincoln Creek formation in Grays Harbor basin………...55
Figure 3.5 Fall cone test apparatus…………………………………………………..57
Figure 3.6 Schematic results of fall cone test……………………………………….58
Figure 3.7(a) Specimens during curing period…………………………………………60
Figure 3.7(b) Specimens being immersed in water……………………………………..60
Figure 3.8 Custom built mold for triaxial test……………………………………….62
xii
Figure 3.9 Relationship between pore pressure parameter B and degree of saturation
……………………………………………………………………………64
Figure 4.1 Grain size distribution of the soils……………………………………….66
Figure 4.2 Solidification characteristics for Aberdeen soil………………………….68
Figure 4.3 Solidification characteristics for Everett soil…………………………….68
Figure 4.4 Solidification characteristics for Palouse loess…………….…………….69
Figure 4.5 Variation of plastic behavior of Aberdeen soil for different cement content
……………………………………………………………………………70
Figure 4.6 Variation of plastic behavior of Palouse loess for different cement content
……………………………………………………………………………71
Figure 4.7 Effect of cement treatment on optimum water content of soils………….72
Figure 4.8 Effect of cement treatment on maximum dry density of soils…………...72
Figure 4.9 Effect of cement treatment on unconfined stress-strain behavior of
Aberdeen soil, unsoaked samples………………………………………..73
Figure 4.10 Effect of cement treatment on unconfined stress-strain behavior of
Aberdeen soil, soaked samples…………………………………………..74
Figure 4.11 Disintegration of specimens after being immersed in water…………….74
Figure 4.12 Effect of cement treatment on unconfined compressive strength of
Aberdeen soil…………………………………………………………….75
Figure 4.13 Effect of cement treatment on modulus of elasticity of Aberdeen soil…..76
Figure 4.14 Effect of cement treatment on unconfined stress-strain behavior of
Everett soil for unsoaked samples………………………………………77
Figure 4.15 Effect of cement treatment on unconfined stress-strain behavior of
Everett soil for soaked samples…………………………………………..77
Figure 4.16 Effect of cement treatment on unconfined compressive strength of
Everett soil……………………………………………….………………78
xiii
Figure 4.17 Effect of cement treatment on modulus of elasticity of Everett soil…….78
Figure 4.18 Effect of cement treatment on unconfined stress-strain behavior of
Palouse loess for unsoaked samples………………….…………………80
Figure 4.19 Effect of cement treatment on unconfined stress-strain behavior of
Palouse loess for soaked samples……………………..…………….…..80
Figure 4.20 Effect of cement treatment on unconfined compressive strength of
Palouse loess…………………………………………………………...81
Figure 4.21 Effect of cement treatment on modulus of elasticity of Palouse loess….81
Figure 4.22 Deviator stress versus axial strain increment for non-treated Aberdeen
soil…………………………….……...………………………………….84
Figure 4.23 Pore pressure versus axial strain increment for non-treated Aberdeen soil
…………………………………………………………………………85
Figure 4.24 Deviator stress versus axial strain increment for 5% cement treated
Aberdeen soil…………………………………………………….………85
Figure 4.25 Pore pressure versus axial strain increment for 5% cement treated
Aberdeen soil……………………………………………………………86
Figure 4.26 Deviator stress versus axial strain increment for 10% cement treated
Aberdeen soil…………………………………………………….……..86
Figure 4.27 Pore pressure versus axial strain increment for 10% cement treated
Aberdeen soil...........................................................................................87
Figure 4.28 Ductile type of failure for non-treated Aberdeen soil..............................87
Figure 4.29 Planar type of failure for 5% cement treated Aberdeen soil....................88
xiv

Figure 4.30 Splitting type of failure for 10% cement treated Aberdeen soil..............88
Figure 4.31 Variation of peak deviator stress versus confining pressure for Aberdeen
Soil at different cement content................................................................89
Figure 4.32 Variation of brittleness index versus confining pressure for non-treated,
5% and 10% cement treated Aberdeen soil...............................................90
Figure 4.33 Deviator stress versus axial strain increment for non-treated Everett soil
………………………………………………………………………….91
Figure 4.34 Pore pressure versus axial strain increment for non-treated Everett
soil………………………………………………………………………..91
Figure 4.35 Deviator stress versus axial strain increment for 5% cement treated
Everett soil………………….…...………………………………………92
Figure 4.36 Pore pressure versus axial strain increment for 5% cement treated
Everett soil………………………………………………………………92
Figure 4.37 Deviator stress versus axial strain increment for 10% cement treated
Everett soil……………………………………………………………….93
Figure 4.38 Pore pressure versus axial strain increment for 10% cement treated
Everett soil…………………………………………………..…………..93
Figure 4.39 Variation of peak deviator stress versus confining pressure for Everett soil
at different cement content.........................................................................94
Figure 4.40 Variation of brittleness index versus confining pressure for non-treated,
5%, and 10% cement treated Everett soil..................................................95
Figure 4.41 Strain increment versus vertical pressure for non-treated and cement
treated Aberdeen soil……………………….......………………………..97
xv

Figure 4.42 Void ratio versus vertical pressure for non-treated and cement treated
Aberdeen soil……………………………………………………........….97
Figure 4.43 Mohr-Coulomb failure envelope for non-treated Aberdeen soil…..........99
Figure 4.44 Mohr-Coulomb failure envelope for 5% cement treated Aberdeen soil...99
Figure 4.45 Mohr circles for 10% cement treated Aberdeen soil………....................99
Figure 4.46 Mohr-Coulomb failure envelope for non treated Everett soil……….....100
Figure 4.47 Mohr-Coulomb failure envelope for 5% cement treated Everett soil…..101
Figure 4.48 Mohr circles for 10% cement treated Everett soil…………...................101
Figure 4.49 Measured values and predicted strength using Griffith and modified
Griffith crack theory for non-treated Aberdeen soil…………................102
Figure 4.50 Measured values and predicted strength using Griffith and modified
Griffith crack theory for 5% cement treated Aberdeen soil…….............103
Figure 4.51 Measured values and predicted strength using Griffith and modified
Griffith crack theory for 10% cement treated Aberdeen soil…...............103
Figure 4.52 Measured values and predicted strength using Griffith and modified
Griffith crack theory for non-treated Everett soil………………............104
Figure 4.53 Measured values and predicted strength using Griffith and modified
Griffith crack theory for 5% cement treated Everett soil………….........105
Figure 4.54 Measured values and predicted strength using Griffith and modified
Griffith crack theory for 10% cement treated Everett soil……...............105
Figure 4.55 Comparison between measured and predicted normalized principal
stresses for non-treated Aberdeen soil using Johnston criterion……......106
xvi

Figure 4.56 Comparison between measured and predicted normalized principal
stresses for 5% cement treated Aberdeen soil using Johnston criterion..107
Figure 4.57 Comparison between measured and predicted normalized principal
stresses for non-treated Everett soil using Johnston criterion…….........108
Figure 4.58 Comparison between measured and predicted normalized principal
stresses for 5% cement treated Everett soil using Johnston criterion…..108
Figure 5.1 Undrained stress path for non-treated Aberdeen soil...............................111
Figure 5.2 Undrained stress path for 5% cement treated Aberdeen soil...................111
Figure 5.3 Undrained stress path for 10% cement treated Aberdeen soil.................112
Figure 5.4 Schematic illustration of undrained stress path for highly cemented soils
..................................................................................................................113
Figure 5.5 The comparison between modified cam clay and model presented by
Muhunthan and Masad for non treated Aberdeen soil.............................116
Figure 5.6 The comparison between modified cam clay and model presented by
Muhunthan and Masad for 5% cement treated Aberdeen soil.................116
Figure 5.7 Extended and modified Griffith theory for 5% cement treated Aberdeen
soil............................................................................................................118
Figure 5.8 Schematic plot of stress path for cement treated soil...............................118
Figure 5.9 Ductile type of failure with vertical crack for non-treated Aberdeen soil
.....................................120
xvii

LIST OF TABLES
Page
Table 2.1 Cement kiln dust (CKD) composition……………………………….…..27
Table 2.2 Guide for selecting stabilizing additives, (EM 1110-3-137)…………….31
Table 2.3 Properties of polypropylene fibers……………………………………….34
Table 3.1 Geotechnical properties of Aberdeen, Everett, and Palouse soils……….52
Table 3.2 B values for different soils at complete or nearly complete saturation…..64
Table 4.1 Atterberg limits for non-treated and cement treated Aberdeen soil using
Casagrande method and fall cone method at different cement content….69
Table 4.2 Summary of unconfined compressive strength and modulus of elasticity of
non-treated and cement treated soils……………..………………………82
Table 4.3 Mean value of unconfined compressive strength of different soils modified
from Kasama et al. (2007)………………………….……………………83
Table 4.4 Consolidation parameters for non-treated and cement treated Aberdeen
soil………………………………………………………………………..98
Table 4.5 Effective shear strength parameter of non-treated and cement treated soil
based on Mohr-Coulomb failure criterion……………...……………..100
Table 4.6 Values of μ for Aberdeen and Everett soil at different cement content...104
Table 5.1 Critical state parameters for non-treated and cement treated Aberdeen soil
………………………………………………………………….……….110
Table 5.2 Liquidity index for non-treated and cement treated Aberdeen soil at
different confining pressure.....................................................................119
xviii

Table 5.3 Summary of predicted behavior according to Figure 2.23 and observed
behavior for non-treated and cement treated Aberdeen soil...................119
xix
CHAPTER ONE
INTRODUCTION
1.1 Introduction
Increased costs associated with the use of high quality materials have led to the
need for local soils to be used in geotechnical and highway construction. Often however,
high water content and low workability of these soils pose difficulties for construction
projects. Frequently, additives such as lime, cement, fly ash, lime-cement-fly ash
admixture, cement kiln dust, emulsified asphalt, Geofiber, and polymer stabilizers are
used to improve their engineering properties. The choice and effectiveness of an additive
depends on the type of soil and its field conditions. Nevertheless knowledge of
mechanistic behavior of treated soil is equally important as selecting the stabilizer.
High water content and low workability of local soils in the western side of
Washington State have often caused difficulties for highway construction projects. The
addition of a few percentages by weight of Portland cement has shown its effectiveness
towards better control of workability during compaction in some projects (Lowell 2005).
Therefore based on past experience and environmental concerns Washington Department
of Transportation decided to use Portland cement as stabilization agent. However, there is
a need to systematically examine cement treatment effectiveness for a range of soils
encountered and also study the mechanical properties of cement stabilized soils for
highway embankment applications. Type and location of the soils that needed
improvement prior to use were selected by Department Of Transportation officials.
1

In this study, the term modification is used for improvement in workability and
compaction characteristics whereas the term stabilization is adopted for improvement in
mechanical behavior of cement treated soils.
The beneficial effects of cement on the performance of soils have been widely
documented (Balmer 1958; Mitchell 1976; Uddin et al. 1997; Lo and Wardani 2002).
Cement treatment leads to improvement in the mechanical properties of soils. However,
the findings of different researchers on the role of Portland cement on compacted
properties as well as strength and modulus have not been entirely consistent. For
example, Balmer (1958) and Clough et al. (1981) reported cement treatment increased
cohesion while internal friction angle remained constant. On the other hand, Uddin et al.
(1997) stated that internal friction angle increased significantly. Some studies have
indicated that at very low cement contents, improvement in strength is due to an increase
in friction angle rather than cohesion (Rocha et al. 1961; Abboud 1973). Research has
also shown that cohesion increases with curing time while friction angle remains constant
(Nash et al. 1965; Wissa et al. 1965; Abboud 1973).
Abboud (1973) reported that cement treated soils exhibit brittle types of failure at
low confining pressures and a more plastic failure type at high confining pressures i.e.,
Mohr-Coulomb failure envelope for cement treated soils is curved. Several failure
criteria, including Griffith crack theory and modified Griffith crack theory (Mitchell
1976), have been proposed to account for the strength behavior of soil. The brittle to
ductile transition of shear behavior of soils as a function of mean stress is the basis of the
modern concept of the Critical State Soil Mechanics (Schofield and Wroth 1968;
Schofield 2005). Schofield (1998) has disputed that the Mohr-Coulomb criterion,
2

popularized by Terzaghi and underpinning the developments of soil mechanics, is valid
for a limited range of stress levels. He has argued that the strength of remolded soils (be
it sand or clay) is governed by its critical state friction and particle interlocking. The use
of friction and particle interlocking may enable us to better interpret the strength of
cement stabilized soils.
1.2 Objectives
The overall objective of this research is to study the compaction, strength and
deformation characteristics of cement treated soils. The specific objectives of the study
are as follows:
1- Investigation of the solidification, workability, and compaction characteristics of
Portland cement treated soils.
2- Investigation of the mechanical properties of cement treated soils.
3- Interpretation of mechanical behavior of cement treated soil using critical state
frame work.
Tests were performed on three types of soils. They were collected from the
Palouse area in Eastern Washington, Aberdeen and Everett area in western Washington.
The effect of different percentages of cement was evaluated using Atterberg limits,
compaction characteristics, unconfined compressive strength, and modulus of elasticity.
In addition, consolidated undrained triaxial tests with pore water pressure measurements,
fall cone test, and Oedometer were conducted on Aberdeen soil. The results are
interpreted using Mohr-Coulomb, Griffith, modified Griffith, and Johnston (1985)
strength criteria as well as using the critical state framework.
3

1.3 Organization of report
Chapter Two presents a background of the study. It includes the effect and
performance of different modifiers including lime, Portland cement, fly ash, lime-
cement-fly ash admixture, emulsified asphalt, cement kiln dust, polymers, Geofibers, and
salt. The chapter also presents an examination of different failure criteria including
classical Mohr-Coulomb, Griffith crack theory, modified Griffith crack theory, the
criterion suggested by Johnston (1985). This chapter concludes with discussion on the
critical state framework.
Experimental methods are given in Chapter Three. This chapter presents a
summary of material properties and testing programs. This includes tests on
solidification, Atterberg limits, standard proctor, unconfined compressive strength,
consolidated-undrained triaxial, fall cone, and Oedometer. Results and discussion are
presented in Chapter Four. Interpretation of mechanical behavior of cement treated soil
using critical state framework is given in Chapter Five. Chapter Six presents conclusions
drawn from this study.
4

CHAPTER TWO
BACKGROUND 2.1 Introduction
A summary of the performance of a number of widely used additives in
geotechnical practice is discussed first. It includes, lime, Portland cement, fly ash, lime-
cement-fly ash admixture, emulsified asphalt, cement kiln dust (CKD), Geofiber
reinforcement, salt, and non-traditional polymer stabilizers. It is followed by discussion
of several failure criteria including Griffith and modified Griffith theory, Johnston
criterion (1985), and critical state framework and cam clay model.
2.2 Lime stabilization Lime is one of the oldest and still popular additives used to improve fine-grained
soils. Construction of Denver International Airport is an example of using lime
stabilization method. Following are the four major lime-based additives used in
geotechnical construction; hydrated high calcium lime Ca(OH)2, Calcitic quick lime CaO,
monohydrated dolomitic lime Ca(OH)2 MgO, and dolomitic quick lime CaO MgO.
Lime treatment of soil facilitates the construction activity in three ways (Mallela
et al. 2004). First, a decrease in the liquid limit and an increase in the plastic limit results
in a significant reduction in plasticity index. Reduction in plasticity index facilitates
higher workability of the treated soil. Second, as a result of chemical reaction between
soil and lime a reduction in water content occurs. This facilitates compaction of very wet
soils. Further, lime addition increases the optimum water content but decreases the
maximum dry density and finally immediate increase in strength and modulus results in a
stable platform that facilitates the mobility of equipments.
5

2.2.1 Chemical reaction
When lime is mixed with clayey material in the presence of water several
chemical reactions take place. They include cation exchange, flocculation-agglomeration,
pozzolanic reaction, and carbonation (Mallela et al. 2004). Cation exchange and
flocculation-agglomeration are the primary reactions, which take place immediately after
mixing. During these reactions, the monovalent cations that are generally associated with
clay minerals are replaced by the divalent calcium ions. These reactions contribute to
immediate changes in plasticity index, workability, and strength gain.
Pozzolanic reaction occurs between lime and, the silica and alumina of the clay
mineral and produces cementing material including calcium-silicate-hydrates and calcium
alumina hydrates. The basic pozzolanic reactions are as follows:
Ca(OH)2 + SiO2→ CaO-SiO2-H2O (2.1)
Ca(OH)2 + Al2O3→ CaO- Al2O3-H2O (2.2)
Pozzolanic reactions are time and temperature dependent and may continue for a
long period of time. Addition of lime to soil increases its pH; studies have shown that
when the pH of the soil increases to 12.4, which is the pH of saturated limewater, the
solubility of silica and alumina increase significantly. Therefore, as long as sufficient
calcium from the lime remains in the mixture and the pH remains at least 12.4,
pozzolanic reaction will continue.
In some instances, lime reacts with carbon dioxide to produce calcium carbonate
instead of calcium-silicate-hydrates and calcium alumina hydrates. Such carbonation is
6

an undesirable reaction from the point of soil improvement (Bergado et al. 1996; Mallela
et al. 2004).
2.2.2 Lime treatment applications and advantages Lime treatment has been found to result in an increase in optimum water content,
a decrease in maximum dry density, a decrease in swell potential, an increase in strength,
an increase in modulus of elasticity, and an increase in fatigue strength. The effect of
lime on soil can be categorized into two groups, immediate and long-term stabilization.
Increased workability of soil is the result of immediate modification, which is the main
contributor in early construction stages. Increased strength and durability is considered
long-term stabilization that takes place during and after curing.
2.2.3 Compaction characteristics
Effect of lime treatment in compaction characteristics of a low plasticity clay soil
is shown in Figure 2.1. Lime treatment reduces maximum dry density and increase
optimum water content (Mallela et al. 2004; Thompson 1966). Increase in optimum water
content facilitates compaction of soils which are wet of optimum in their natural
condition. Results of studies have also revealed that optimum water content increases
with increasing in lime content (Mallela et al. 2004; Tabatabi 1997; Thompson 1966).
7

Figure 2.1: Changes in compaction curve by addition of lime to a low plasticity clay soil (Mallela et al. 2004).
2.2.4 Swell potential
Relationship between swell pressure and dry density for Porterville clay is shown
in Figure 2.2, for different lime content. It can be observed that as lime content increases,
swell pressure decreases significantly. This enables its use in reducing the swelling
potential of expansive soils. Figure 2.3, shows the relationship between plasticity index
8
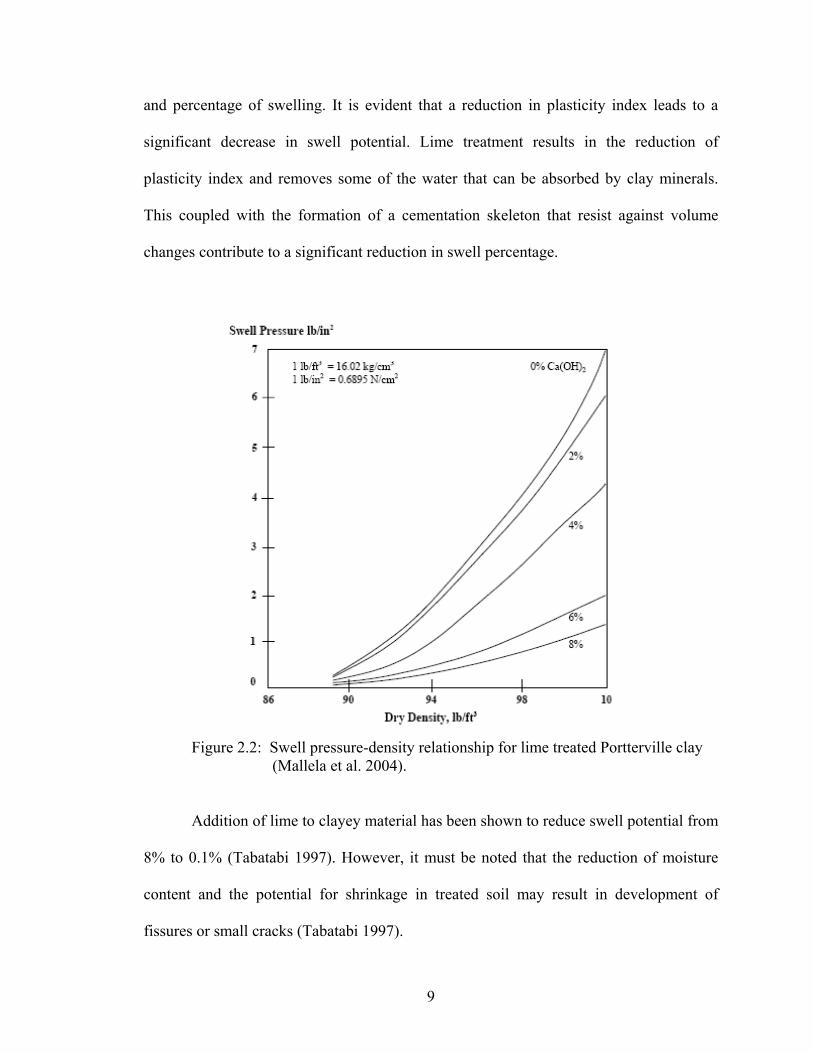
and percentage of swelling. It is evident that a reduction in plasticity index leads to a
significant decrease in swell potential. Lime treatment results in the reduction of
plasticity index and removes some of the water that can be absorbed by clay minerals.
This coupled with the formation of a cementation skeleton that resist against volume
changes contribute to a significant reduction in swell percentage.
Figure 2.2: Swell pressure-density relationship for lime treated Portterville clay (Mallela et al. 2004).
Addition of lime to clayey material has been shown to reduce swell potential from
8% to 0.1% (Tabatabi 1997). However, it must be noted that the reduction of moisture
content and the potential for shrinkage in treated soil may result in development of
fissures or small cracks (Tabatabi 1997).
9

Figure 2.3: Swell potential as a function of plasticity index (Mallela et al. 2004).
2.2.5 Shear strength and stress-strain behavior
Lime treatment leads to significant increase in strength. The immediate increase
in strength results from flocculation-agglomeration reaction and leads to better
workability, whereas long-term strength gain is due to pozzolanic reactions. Thompson
(1966) stated that addition of lime to fine-grained soils yields a substantial increase in
cohesion and minor improvement in internal friction angle. The effect of curing time on
unconfined compressive strength of the lime treated material is shown in Figure 2.4. It
can be observed as that curing time increases, unconfined compressive strength increases
while strain corresponding to peak stress decreases. In the other words lime treated soils
display brittle behavior.
10
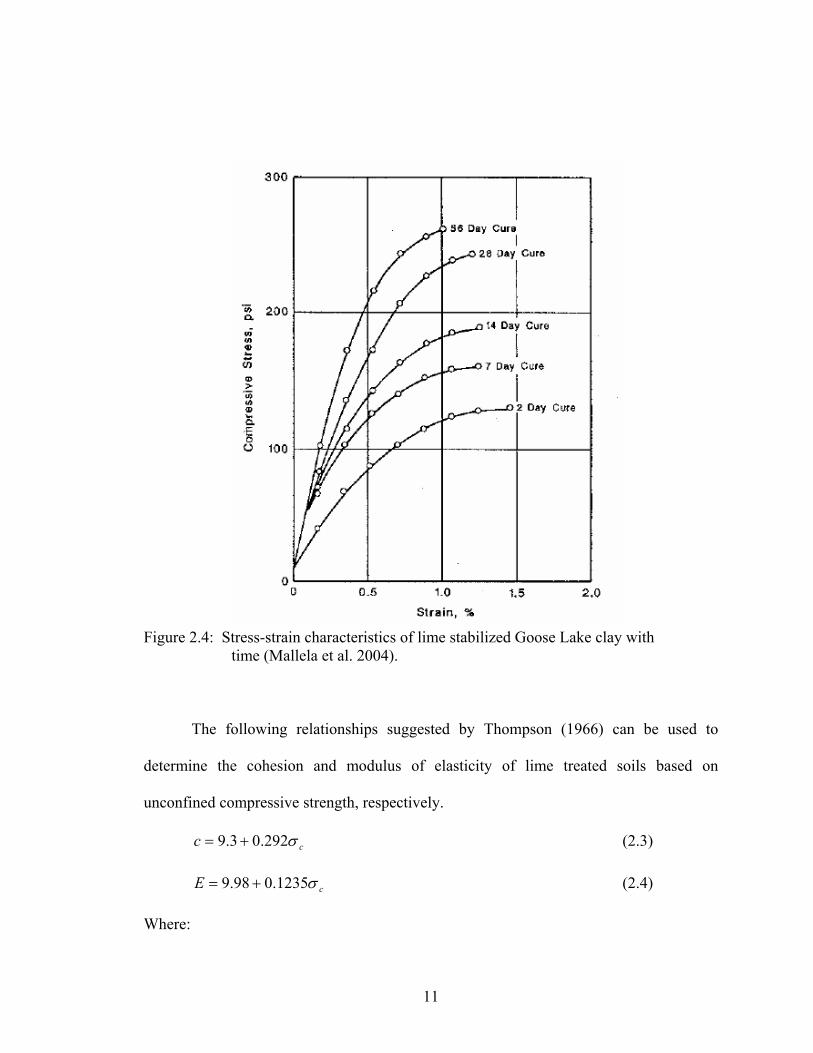
Figure 2.4: Stress-strain characteristics of lime stabilized Goose Lake clay with time (Mallela et al. 2004).
The following relationships suggested by Thompson (1966) can be used to
determine the cohesion and modulus of elasticity of lime treated soils based on
unconfined compressive strength, respectively.
cc σ292.03.9 += (2.3)
cE σ1235.098.9 += (2.4)
Where:
11

c: Cohesion (psi)
E: Modulus of elasticity (ksi)
σc: Unconfined compressive strength (psi)
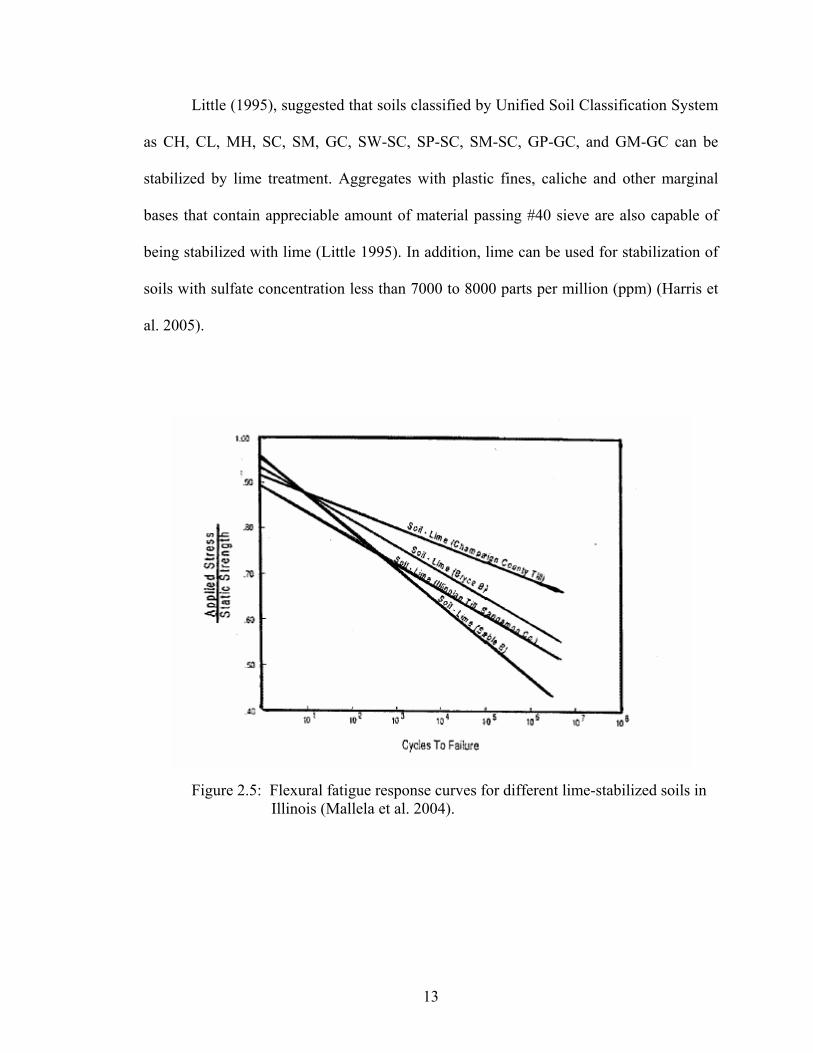
2.2.6 Fatigue and durability
Fatigue strength is related to the number of cycles of loads that the material can
carry at a given stress level. Addition of lime to soil increases its fatigue strength
significantly. Figure 2.5, shows the fatigue response of lime-stabilized soils. It is evident
that as the ratio of applied stress to strength decreases, the number of cycles of loads
needed to cause failure of treated material increases (Mallela et al. 2004; Tabatabai
1997). Lime treated soils gain in ultimate strength over time thus contributing to the
reduction in applied stress to strength and an increase in fatigue strength.
Studies have shown that moisture and freeze-thaw cycles have less effect on lime
treated materials compared with non-treated materials. It has also been recognized that
the resistance of lime treated material against freeze-thaw cycles is highly dependent on
their immediate strength. The higher immediate strength is associated with resistance to
higher number of freeze-thaw cycles (Tabatabai 1997).
2.2.7 Suitability
Lime works best for clayey soils, especially those with moderate to high plasticity
index (PI>15). Due to lack of aluminates and silicates in silts and granular material
pozzolanic reactions do not take place, therefore lime does not work well for these
materials. In order to stabilize silts and granular materials with lime, pozzolanic
admixtures such as fly ash need to be used in addition to lime.
12
Little (1995), suggested that soils classified by Unified Soil Classification System
as CH, CL, MH, SC, SM, GC, SW-SC, SP-SC, SM-SC, GP-GC, and GM-GC can be
stabilized by lime treatment. Aggregates with plastic fines, caliche and other marginal
bases that contain appreciable amount of material passing #40 sieve are also capable of
being stabilized with lime (Little 1995). In addition, lime can be used for stabilization of
soils with sulfate concentration less than 7000 to 8000 parts per million (ppm) (Harris et
al. 2005).
Figure 2.5: Flexural fatigue response curves for different lime-stabilized soils in Illinois (Mallela et al. 2004).
13

2.2.8 Quantity
The amount of lime required varies based on the characteristics of the material
that needs to be treated and the desired degree of stabilization. For modification purposes,
normally 2% to 3% by dry weight of the soil is sufficient (Das 1990; Maher et al. 2005).
Larger quantities are required for pozzolanic reactions, and thus strength gain to occur.
For stabilization purposes, typically 5% to 10% by weight of the dry soil are used (Das
1990).
In order to determine the optimum lime requirement for soil stabilization several
methods have been presented. For example Hilt and Davidson (1960) suggested the
following for optimum lime content (Bergado et al. 1996):
25.135
%+=
ClayofContentLimeOptimum (2.5)
U.S. Army Corps of Engineers manuals, EM1110-3-1370 and TM 5-822-14, have
presented methods and guidelines to determine the optimum lime content for
modification and stabilization purposes. Eades and Grim (1966) suggested that the
minimum amount of lime required to stabilize a soil is that can maintain a pH of at least
12.4. Since all available methods are based on empirical observations, additional
laboratory testing is needed to identify the optimum lime content for a given soil and
environmental conditions.
2.3 Cement stabilization
Soil cement stabilization technique has also been in existence for a long time. A
construction project near Johnsonville, South Carolina in 1935 was one of the first
controlled construction project in which cement was used as a soil stabilizer in the United
14

States (Das 1990). Cement treatment causes chemical reaction similar to lime and can be
used for both modification and stabilization purposes. Cement can be applied to stabilize
any type of soil, except those with organic content greater than 2% or having pH lower
than 5.3 (ACI 230.1R-90 1990). Many studies have shown that granular soils and clayey
materials with low plasticity index are better suited to be stabilized with cement (Currin
et al. 1976; Engineering manual 1110-3-137 1984).
Significant reduction in plasticity index and swell potential, and remarkable
increase in strength, modulus of elasticity and resistance against the effects of moisture
and freeze-thaw can be achieved by cement stabilization. Note that reduction in plasticity
index is due to an increasing of plastic limit, which is highly affected by cement content
and curing time (Bergado et al. 1996). The addition of cement was also found to increase
optimum water content but decrease the maximum dry density (Tabatabi 1997). However
report by ACI committee 230 (1990) states that cement treatment causes changes in
maximum dry density and optimum water content, but the direction of changes is not
predictable. In addition cement treatment causes immediate decrease in water content
(Bergado et al. 1996). Cement treated materials behave in a more brittle manner than
non-treated materials. (Bergado et al. 1996) reported that cement treatment changes the
behavior of soft clay from normally consolidated to overconsolidated state.
2.3.1 Strength
The effect of cement content and curing time on unconfined compressive strength
for 28 days curing is shown in Figure 2.6. It is observed that, as cement content increases
unconfined compressive strength of fine-grained as well as coarse-grained soils increases.
15

Improvement in unconfined compressive strength (in psi) varies from 40 times of cement
content for fine-grained soils up to 150 times of cement content for coarse-grained soils.
In addition, unconfined compressive strength increases with increasing curing time. Note
that improvement due to curing time for coarse-grained soils is significant, as shown in
Figure 2.7.
Figure 2.6: Relationship between cement content and unconfined compressive strength for cement treated soils (Mitchell 1976).
The relationship between unconfined compressive strength and curing time for a
given soil and cement content was presented by Mitchell (1976):
16

( ) ( ) ⎟⎠⎞⎜
⎝⎛+=
0log
0 ddKdcdc σσ (2.6)
Where:
( )dcσ : Unconfined compressive strength at age of d days (psi)
( )0dcσ : Unconfined compressive strength at age of d0 days (psi)
K = 70C for coarse-grained soils and K = 10C for fine-grained soils, (C: Cement
content, percent by weight)
Figure 2.7: Effect of curing time on unconfined compressive strength of cement treated soils (Mitchell 1976).
Recent studies have also reported that addition of cement increases the effective
cohesion significantly (Lo and Wardani 2002). Figure 2.8, shows the effect of cement
content on effective cohesion of several coarse-grained and fine-grained soils. It is noted
that, this plot was obtained for 90 days curing time and 413.64 kPa (60 psi) confining
pressure. It can be seen that cement treatment leads to an increase in effective cohesion.
17

The increase in cohesion can be expressed as a function of unconfined compressive
strength directly (Mitchell 1976):
( cc )σ225.00.7 += (2.7)
Where, cσ is unconfined compressive strength (psi) and c is effective cohesion.
Studies have shown that internal friction angle remains relatively constant for
cement treated soils regardless of cement content and curing time (Clough et al. 1981;
Balmer 1958). The average values of internal friction angle are 43.8˚ and 36.1˚ for
granular and fine-grained cement treated soils, respectively (Balmer 1958). On the other
hand, recent studies have reported that cement stabilization leads to significant increase
in internal friction angle (e.g. Uddin et al. 1997). In addition, the results of undrained
triaxial test have shown that cohesion and friction angle increase with increasing curing
time and cement content. The cohesion of cement treated clay disappears at large strain,
and it behaves as purely frictional material (Bergado et al. 1996).
Delays between mixing and compaction leads to significant reduction in
unconfined compressive strength of cement treated material. Results of a particular
research showed that, losses in unconfined compressive strength were 10% to 20% and
up to 40% for four and 24 hours delay, respectively (White and Gnanendran 2005).
Results of investigations showed that unconfined compressive strength increases
with increasing relative compaction (Figure 2.9). It can be observed that, each 1%
increase in relative compaction leads to about 200 kPa increase in unconfined
compressive strength (White and Gnanendran 2005).
18

Figure 2.8: Effect of cement content on effective cohesion for several coarse-
grained and fine-grained soils (Mitchell 1976).
Figure 2.9: Unconfined compressive strength versus relative compaction
for cement treated material (White and Gnanendran 2005).
19

2.3.2 Durability In most stabilization projects, achieving a maximum level of durability is
desirable. Cement treatment has been documented to provide resistance against freeze-
thaw cycles. Relationship between unconfined compressive strength and freeze-thaw and
wet-dry cycle tests is shown in Figure 2.10. It is observed that, resistance against freeze-
thaw and wet-dry cycling increase with increasing unconfined compressive strength. As
a result the greater the percentage of cement content the better the durability.
Figure 2.10: Relationship between unconfined compressive strength and
durability of cement treated soils based on Portland Cement
Association durability criteria (ACI 230.1R-90 1990).
20

2.3.3 Compressibility
The results of Oedometer test on Bangkok clay is shown in Figure 2.11.
Significant improvement on the compressibility of cement treated soils is evident. It is
observed that preconsolidation pressure increases significantly due to addition of cement.
Coefficient of consolidation of cement treated soils gradually decreases, approximately
linearly, with increasing consolidation pressure. Results have shown that higher cement
content is associated with the greater value of coefficient of consolidation.
Figure 2.11: Consolidation curve for Bangkok clay with 25% cement content (after Bergado et al. 1996).
21

Typical amounts of cement for stabilization purposes vary from 5% to 10% of
weight of dry soil. U.S. Army Corps of Engineers, EM1110-03-137, TM 5-822-14, and
Portland Cement Association laboratory handbook (1992) provide guidelines to
determine the optimum cement content for stabilization purposes. Note, that most of the
manuals and guidelines in U.S do not recommend cement stabilization for soils with
plasticity index greater than 15. In order to overcome this, small amount of lime can be
added to soil prior to cement stabilization.
Cement treatment is more expensive than lime. For example, a cost analysis of a
project at Joshua Tree National Park, CA showed that the cost of cement stabilization for
6 inches (15 cm) of mixing depth ranged from $2.80 to $3.40 per square yard (0.836 m2)
(Maher et al. 2005). In comparison, the cost of lime stabilization for 8 inches (20 cm) of
mixing depth based on a project at Natches Trace Parkway, Madison, MS, and Bald
Knob National Wildlife Refuge, White County, AR was only $1.30 to $2.00 per square
yard (0.836 m2).
2.4 Fly ash Fly ash is a by-product of coal combustion in power plants. Fly ash contains
silica, alumina, and different oxides and alkalis in its composition, and is considered as a
pozzolanic material (Das 1990). The most common elemental compositions of fly ash
include SiO2, TiO2, Al2O3, Fe2O3, MnO, MgO, CaO, Na2O, K2O, P2O5, SO3 and organic
carbons. A guideline for selecting fly ash as soil stabilizing agent is provided in ASTM
C593.
There are two types of fly ash, type “C” and type “F”. This classification is based
on the chemical composition. Fly ash type “C” contains significant amount of free lime.
22

This type of fly ash produces pozzolanic and cementitious reactions. Cockrell et al.
(1970), have shown that the lighter color fly ash indicates the presence of high calcium
oxide and the darker color reflects high organic content. Fly ash can improve the
engineering properties of soil. However it must be noted that fly ash properties are highly
variable and depend on chemical composition of coal and combustion technology.
2.5 Lime-Cement-Fly ash
Construction of runway 9-27 at Houston International Airport is an example of
using Lime-Cement-Fly ash stabilization (Little et al. 2000). Coarse-grained soils with
little or no fines can be stabilized by a combination of lime and fly ash. The presence of
various chemical components in fly ash enables it to produce a hardened cementitious
material with improved compressive strength when mixed with lime and water. In order
to accelerate the reaction and obtain the higher compressive strength a small amount of
cement can be added. It is noted that for this admixture to be useful, fly ash must contain
components that can react with the lime.
US Army Corps of Engineers manual EM1110-03-137 and TM 5-822-14,
recommend that soils with less than 12% of material passing sieve #200 and plasticity
index of material passing sieve #40 less than 25 are suitable to be stabilized with lime-
cement-fly ash. The amount of required lime and fly ash can be obtained per guidance
from ASTM C593. In addition, 1% cement is added for additional strength gain. If the
achieved strength does not meet requirements, cement should be added in increments of
0.5% until the desired strength is obtained. The total added material should not exceed
15% of the dry weight of the soil.
23
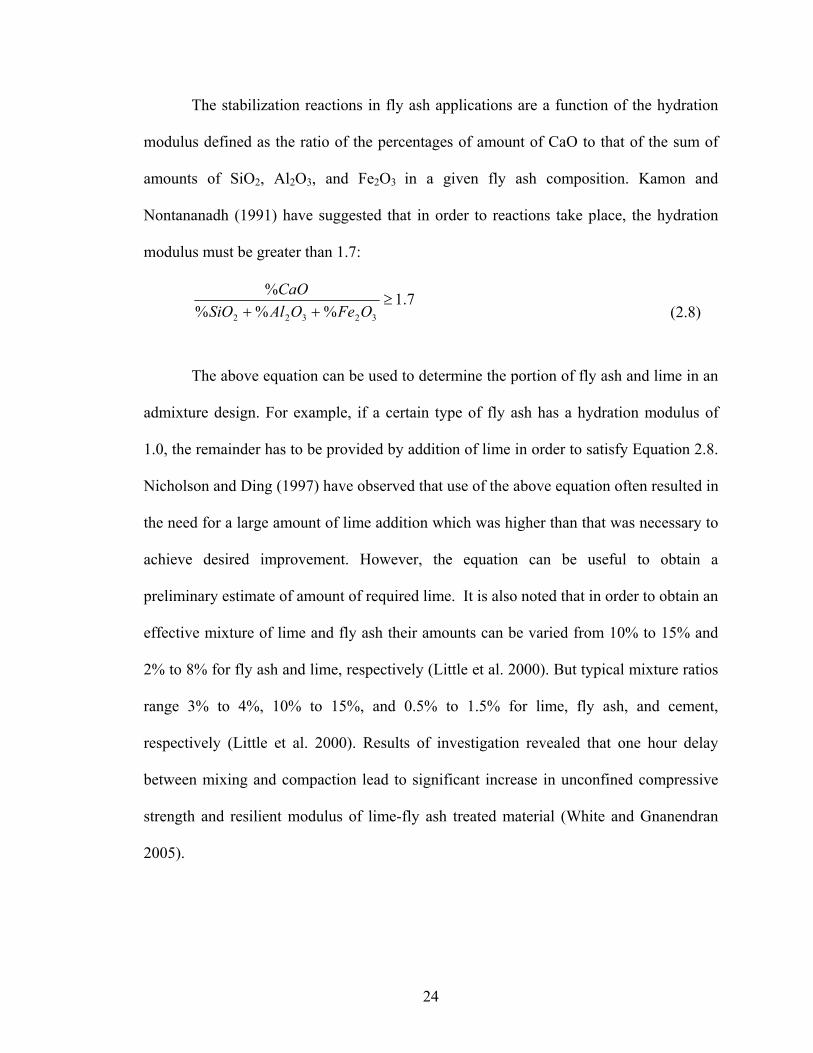
The stabilization reactions in fly ash applications are a function of the hydration
modulus defined as the ratio of the percentages of amount of CaO to that of the sum of
amounts of SiO2, Al2O3, and Fe2O3 in a given fly ash composition. Kamon and
Nontananadh (1991) have suggested that in order to reactions take place, the hydration
modulus must be greater than 1.7:
7.1%%%
%
32322
≥++ OFeOAlSiO
CaO (2.8)
The above equation can be used to determine the portion of fly ash and lime in an
admixture design. For example, if a certain type of fly ash has a hydration modulus of
1.0, the remainder has to be provided by addition of lime in order to satisfy Equation 2.8.
Nicholson and Ding (1997) have observed that use of the above equation often resulted in
the need for a large amount of lime addition which was higher than that was necessary to
achieve desired improvement. However, the equation can be useful to obtain a
preliminary estimate of amount of required lime. It is also noted that in order to obtain an
effective mixture of lime and fly ash their amounts can be varied from 10% to 15% and
2% to 8% for fly ash and lime, respectively (Little et al. 2000). But typical mixture ratios
range 3% to 4%, 10% to 15%, and 0.5% to 1.5% for lime, fly ash, and cement,
respectively (Little et al. 2000). Results of investigation revealed that one hour delay
between mixing and compaction lead to significant increase in unconfined compressive
strength and resilient modulus of lime-fly ash treated material (White and Gnanendran
2005).
24

2.6 Emulsified asphalt
Stabilization with emulsified asphalt is more applicable for coarse-grained soils;
however this method can also be applied to stabilize fine-grained soils as well. The
tendency of the soil to adsorb water decreases with increase in the amount of emulsified
asphalt. A study by Santoni et al. (2004) showed that a sample stabilized with emulsified
asphalt had the minimal loss in unconfined compressive strength when tested under the
wet condition, compared with the other samples that had been stabilized with the other
stabilization agents.
Sandy soils can be stabilized by emulsified asphalt easily, if they contain less than
25% fine material with plasticity index of less than 12. The emulsified asphalt binds sand
particles together and leads to significant increase in soil bearing capacity especially if
the soil contains some fine material (Tabatabi 1997). Typical amount of emulsified
asphalt that is used to stabilize the sandy soils is 2% to 6% of the dry weight of soil.
In order to obtain better performance of emulsified asphalt in gravelly soils the
amount of fines with the plasticity index of less than 12 must be less than 15%. Typical
amount of emulsified asphalt required to stabilize gravely soils is 2% to 6% of the dry
weight of soil.
In order to stabilize the fine soils with emulsified asphalt, the soil should have the
liquid limit less than 40 and plasticity index no grater than 18 (12 to 18). Rapid curing
asphalt emulsions work better for fine soils stabilization rather than medium and slow
curing asphalt emulsions. Typical amount of emulsified asphalt required to stabilize fine
soils is 4% to 8% of the dry weight of soil.
25

The type and amount of emulsified asphalt highly depends on type of soil and
other parameters such as atmospheric condition of the area. In order to obtain better
stabilization results soil should be mixed with water slightly less than optimum water
content, before adding emulsified asphalt. Unlike stabilization with lime, cement, and fly
ash use of emulsified asphalt does not cause pozzolanic reactions. Therefore, the strength
gain is attained based on the binding of particles alone. Consequently, the soil should be
compacted carefully. In the other words, the better results can be achieved by the better
compaction.
2.7 Cement kiln dust (CKD)
Cement Kiln Dust is a fine powdery by-product of the Portland cement
manufacturing process. Approximately, 12.9 million metric tons of CKD is generated in
the Unites States, annually. About 8.3 million tons of generated CKD is reused in Cement
manufacturing, 3.7 million tons is landfilled or stockpiled, whereas the balance is
consumed off site. The beneficial properties of CKD and its cost effectiveness compared
with other type of stabilizers have led to its use as a popular stabilization agent in recent
times. For example cement kiln dust has been used in road base stabilization purposes by
some cities and counties in the state of Oklahoma (Miller and Azad 2000).
Table 2.1, shows the percentages of the main chemical compositions of CKD.
Values in the first row are provided by Lafarge North America for a specific product and
those in the second row are mean values of 63 different CKD’s calculated from published
data by Sreekrishnavilasam et al. (2006).
26

Table 2.1: Cement kiln dust (CKD) composition.
SiO2(%) Al2O3(%) Fe2O3(%) CaO(%) MgO(%) SO3(%) Na2O(%) K2O(%) Total Alkali(%)Lafarge 12.47 2.89 1.58 41.84 0.59 7.25 0.9 1.21 1.69Mean 15.05 4.43 2.23 43.99 1.64 6.02 0.69 4 3.32
Based on the values of each component in Table 2.1, the hydration modulus
(Equation 2.8) of CKD is found to vary between 2.47 and 2.03, respectively. It indicates
that CKD can be considered a soil stabilizer. In addition, CKD has high surface area. Past
studies have shown that the specific surface area of CKD varies within 0.46 -1.4 m2/g
(Sariosseiri and Muhunthan 2008). This feature enables CKD to absorb water off the
surface of soil particles. This would be advantageous during early stages of compaction
(modification) especially when the natural water content is higher than the optimum
water content.
Results of study on comparison of effect of CKD and cement on geotechnical
properties of Palouse loess showed that addition of CKD and cement led to an increase in
optimum water content and a decrease in maximum dry density (Sariosseiri and
Muhunthan 2008). Plasticity index increased initially but decreased at higher percentage
of additives. In addition, CKD treatment resulted in a significant improvement in
unconfined compressive strength and modulus of elasticity, it must be noted these
increases for CKD treated soil are noticeably lower than that attained by addition of
cement (Sariosseiri and Muhunthan 2008). However, it is noted that due to lack of
standards and guidelines, use of CKD has not been fully accepted by government
agencies. Further research is necessary in this regard.
27

2.8 Selection of additive
Guidelines to determine the appropriate stabilizer agent for different type of soils
are abundant in the literature. Two methods that are widely used in practice are presented
below. The first one is based on Currin et al. (1976) and the second one is based on U.S.
Army Corps of Engineers publications (EM1110-03-137 and TM 5-822-14).
2.8.1 Currin et al. Method
This method uses the percentage of material passing #200 sieve and the plasticity
index of the soil in its selection as shown in Figure 2.12. This method is specifically
developed for pavement sub-grade stabilization purposes. It is supported with a number
of tables and plots to determine the amount of stabilizers.
2.8.2 U.S. Army Corps of Engineers Method
The US Army Corps Engineering manuals EM1110-3-137 and TM 5-822-14
provide valuable guidelines for soil stabilization purposes. These guidelines are
summarized in Figure 13 and in Table 2.2. Soils are first classified into selected areas
based on their gradation characteristics as in Figure 2.13. The type of stabilization
techniques and any restrictions imposed on specific areas are provided in Table 2.2. In
addition, the Army Corps of Engineers manuals also provide the required amount for the
different stabilizers based on soil type and other considerations. As noted earlier, the
above guidelines must be supplemented with extensive laboratory testing to determine
the most efficient admixture design in practice.
28

Perform sieve
analysis
Perform Atterberg limit test
<25% Passing No.200
>25% Passing No.200
PI<10
PI>10
PI<10
PI>30
10>PI<30 Cement stabilization
Cement stabilization
Cement stabilization
Cement stabilization
Cement stabilization
Lime stabilization
Lime stabilization
Lime stabilization
Bituminous stabilization
Add sufficient lime to reduce PI<30
Add sufficient lime to reduce PI<10 (subgrade)
PI<6 (base course)
Bituminous stabilization additionalrequirement for base course PI<6and percent passing No.200<72
Figure 2.12: Determination of appropriate stabilizer (Currin et al. 1976).
29

30
Figure 2.13: Gradation triangle for selecting a commercial stabilizing agent, (EM 1110- 3-137).

Material should contain at least 45% byweight of material passing sieve #4
Material should contain at least 45% byweight of material passing sieve #4
Organic and strongly acid soils fallingwithin this area not susceptible tostabilization by ordinary means
Material should contain at least 45% byweight of material passing sieve #4
Well graded material only
Well graded material only
Well graded material only
Remark
LL less than 40 and PI lessthan 20
Restriction on percent passingsieve # 200
Not to exceed 30% by weight
PI not less than 12
PI not to exceed 25
PI not to exceed 25PI not to exceed 10
b**
PI not to exceed 10
PI not less than 12PI not to exceed 25
PI not to exceed 10b**PI not less than 12PI not to exceed 25
PI not to exceed 10PI not to exceed 30PI not to exceed 12PI not to exceed 25
Restriction on liquid limitand plasticity index
PI not to exceed 25
Lime
Portland cement
Portland cement
Portland cement
Portland cement
LimeLime-Cement-Fly ash
Lime-Cement-Fly ashBituminous
Bituminous
Lime
Not to exceed 30% by weight
PI not less than 12
PI not to exceed 30
BituminousPortland cementLimeLime-Cement-Fly ash
Bituminous
Lime-Cement-Fly ash
BituminousPortland cementLimeLime-Cement-Fly ash
Type of stabilizing additive recommended
BituminousPortland cementLime-Cement-Fly ash
GW or GP
GW-GM or GP-GMor GW-GC or GP-GC
GM or GC or GM-GC
CH or CL or MH orML or OH or OL orML-CL
Soil classification*
SW or SP
SW-SM or SP-SM orSW-SC or SP-SC
SM or SC or SM-SC
2A
2B
2C
3
Area
1A
1B
1C
31 Material should contain at least 45% byweight of material passing sieve #4
Material should contain at least 45% byweight of material passing sieve #4
Organic and strongly acid soils fallingwithin this area not susceptible tostabilization by ordinary means
Material should contain at least 45% byweight of material passing sieve #4
Well graded material only
Well graded material only
Well graded material only
Remark
LL less than 40 and PI lessthan 20
Restriction on percent passingsieve # 200
Not to exceed 30% by weight
PI not less than 12
PI not to exceed 25
PI not to exceed 25PI not to exceed 10
b**
PI not to exceed 10
PI not less than 12PI not to exceed 25
PI not to exceed 10b**PI not less than 12PI not to exceed 25
PI not to exceed 10PI not to exceed 30PI not to exceed 12PI not to exceed 25
Restriction on liquid limitand plasticity index
PI not to exceed 25
Lime
Portland cement
Portland cement
Portland cement
Portland cement
LimeLime-Cement-Fly ash
Lime-Cement-Fly ashBituminous
Bituminous
Lime
Not to exceed 30% by weight
PI not less than 12
PI not to exceed 30
BituminousPortland cementLimeLime-Cement-Fly ash
Bituminous
Lime-Cement-Fly ash
BituminousPortland cementLimeLime-Cement-Fly ash
Type of stabilizing additive recommended
BituminousPortland cementLime-Cement-Fly ash
GW or GP
GW-GM or GP-GMor GW-GC or GP-GC
GM or GC or GM-GC
CH or CL or MH orML or OH or OL orML-CL
Soil classification*
SW or SP
SW-SM or SP-SM orSW-SC or SP-SC
SM or SC or SM-SC
2A
2B
2C
3
Area
1A
1B
1C
31
Table 2.2: Guide for selecting stabilizing additives, (EM 1110-3-137).
* Soil classification corresponds to MIL-STD-619. Restriction on liquid limit (LL) and plasticity index (PI) in accordance with method 103 in MIL-STD-621.
200#(%20 passb +≤** )4/

2.9 Non-traditional stabilizers In recent years an increasing number of non-traditional additives have been
developed for soil stabilization purposes. Non-traditional stabilizers can be generally
classified into major categories, including, salts, acids, enzymes, lignosulfonates,
emulsions, polymers, tree resin, and geofibers. Each group has its own suite of sub
categories of products. Shorter curing time and lack of need for special equipment and
particular construction skills have made the use of these materials favorable for
construction projects lately. Unfortunately, only few independent studies have been
conducted to verify the claim of manufacturers. Since the chemical formulas of the
products are modified often based on market tendency, it is rather difficult to evaluate the
performance of a single product. As a result, documentation on soil stabilization
performance with non-traditional additives continues to be subjective. A summary of the
results of some independent studies conducted to examine the performance of a few non-
traditional additives as a guide for future evaluations are presented below.
2.9.1 Polymers Results of the research by Little et al. (2005) show the benefit of the polymer
Soil-Sement® on stabilizing Eolian and Fluvial soils. Both types of soils are classified as
poorly graded sand based on Unified Soil Classification System. Addition of this polymer
to dry Eolian soils increased its CBR value by 992%. In addition, CBR value after freeze-
thaw cycles increased by 872%. Similarly, Soil-Sement® treated Fluvial soils showed
CBR increase of 497% and 3751% for dry and after freeze-thaw cycles, respectively. It is
noted, however, studies conducted by the same authors show that some other brands of
polymers actually decreased the CBR values of treated material compared with non-
32

treated material. The unconfined compressive strength of silty sand treated with Soil-
Sement Engineering Formula®1 by Santoni et al. (2004) also showed significant increase.
2.9.2 Fiber reinforcement Use of hair sized polypropylene fibers in geotechnical applications has been
accepted because of its cost competitiveness compared with other stabilization agents.
These materials are not affected by chemical and biological degradation and do not cause
leaching in soil (Puppala and Musenda 2000).
Puppala and Musenda (2000) have conducted a series of tests to study the
engineering properties of clayey materials reinforced with randomly oriented fibers. The
study used polypropylene fibers of nominal size of one inch and two inches in length.
The physical and chemical properties of the fibers are as shown in Table 2.3. These fibers
have high chemical resistance and can be applied in high temperature conditions. The
results showed that mixing soils with fibers increased the unconfined compressive
strength by 44% for Irving clay and 19% for San Antonio clay. In addition, mixing of
fibers also resulted in the reduction of swell pressures and shrinkage volume. The study
also showed that the length and amount of the fibers very much affect the level of
improvement. In some cases, addition of fibers resulted in the reduction of unconfined
compressive strength. Therefore, extensive laboratory testing must be conducted to
determine optimum length and amount of the fiber for a given soil.
1 Soil-Sement Engineering Formula and Soil-Sement are different products from the same manufacturer.
33

Table 2.3: Properties of polypropylene fibers (after Puppala and Musenda 2000).
Value
Electrical conductivity LowAlkali resistance
0.91551.6 to 758.453502.663241100NoneHighHigh
Melting point, (˚F)Ignition point, (˚F)AbsorptionAcid and salt resistance
PropertySpecific gravityTensile stregth, (MPa)Modulus, (MPa)
Santoni and Tingle (2002) reported the results of sand fiber stabilization
technology developed by the U.S. Army Corps of Engineers Research Center in
Vicksburg, MS. In this study, two inch long polypropylene fibers were mixed with moist
sand and the sand-fiber mixture was compacted with a smooth-drum vibratory roller. In
order to bond the sand particles with fibers, a surface-wearing coat of material such as
resin modified emulsion or emulsified asphalt were sprayed. While this method is more
applicable to immediate military constructions, the results indicated that roads built using
sand fiber stabilization method served for a reasonable length of time with little or no
maintenance. The fiber technology can be applied to a very wide variety of soils without
the need for special equipments or skills.
2.9.3 Salt (Sodium chloride) Singh and Das (1999) reported significant improvement in CBR, unconfined
compressive strength, and indirect tensile strength of salt treated material. Soil samples
were prepared from commercial clay (BB1), River Aire soil, sand, and gravel. The study
34

further showed that addition of salt resulted in increase in resilient modulus. This is
potentially useful for long-term highway pavement subgrade applications.
2.10 Environmental issues
Since most of the soil stabilization techniques using additives involve chemicals
of some kind, care must be taken toward environmental considerations. If the application
area is not appropriately protected from surface runoff the stabilized material can be
washed onto surrounding areas and damage adjacent vegetation. In the case of lime
treatment there is a potential for the rise of pH on contaminated areas. Fly ash
composition is dependent on the source of coal and the type of combustion technology
used. Most of the fly ash products have heavy metals in their composition. Therefore, fly
ash treated materials have the potential to leach and contaminate water bodies. Many
federal and state laws, regulations and specifications limit the amount of fly ash that can
be used in highway construction projects (EPA-530-K-05-002 2005). Cement appears to
have the least environmental impact compared with lime and fly ash. No environmental
impact studies on the use of polymers have been reported to date.
Based on applicability and feasibility of available stabilization method, type of
soils in sites, previous experiences, and environmental concerns Washington State
Department of Transportation decided to use cement as stabilization agent. Therefore, the
study here focuses on cement modification and stabilization, from this point onwards.
35

2.11 Failure criteria for cement treated soils
2.11.1 Introduction The Mohr-Coulomb criterion popularized by Terzaghi, has been used extensively
to characterize the failure of soils. It can be written as: φστ tan+= cf where, fτ is the
shear strength of the soil, and σ is the applied normal stress. φ and are called internal
friction angle and intrinsic cohesion, respectively. However, as pointed out before, the
use of strength parameters, and
c
c φ to soils and cement treated soils have led to number
of anomalies. Results of many studies have shown that failure envelope of cement treated
soils are curved. Consequently, it is impossible to report a particular internal friction
angle (φ ) to characterize the strength over the wide range of confining pressures. Several
failure criteria such as, Griffith crack theory, modified Griffith crack theory, Hoek and
Brown, and Johnston (1985) have been presented to improve the strength description of
geo materials. It must be noted that application of each failure criteria is limited to type of
material and stress conditions.
2.11.2 Griffith, modified, and extended Griffith crack theory
Griffith crack theory states that fracture initiation for a two dimensional loaded
brittle body with microscopic flaws can be expressed as:
)(8)( 312
31 σσσσσ −−=− t (2.9)
For 03 31 >+ σσ and if 03 31 <+ σσ , then tσσ =3 , where tσ is tensile strength of
material. Microscopic flaw includes small cracks, fissures, or grain boundaries (Parry
1995). The Griffith crack theory in terms of shear and normal stresses can be expresses in
form of Equation 2.10.
36

04.4 22 =−+ tnt σσστ (2.10)
Schematic failure envelope based on the Griffith crack theory for plane compression in
terms of principal stresses, and shear and normal stresses are shown in Figures 2.14 and
2.15, respectively. It is clear that the ratio of unconfined compressive strength to uniaxial
tensile strength is -8.
37
σ3
σ1
σt
8σt3σt
(σ1-σ3)2=8σt(σ1-σ3)
σ3
σ1
σt
8σt
(σ1-σ3)2=8σt(σ1-σ3)
3σt
Figure 2.14: Failure envelope based on Griffith theory in terms of principal stresses.

σn
τ
σt
2σt
τ2+4σt.σn-4σt2=0
σn
τ
σt
2σt
τ2+4σt.σn-4σt2=0
Figure 2.15: Failure envelope based on Griffith theory in terms shear and normal
stresses.
The original Griffith failure envelope does not account for friction in closed
cracks. Based on data from concrete and rock, McClintock and Walsh (1962) modified
the Griffith crack theory to account for friction in closed cracks. Equation 2.11 expresses
this modification in terms of principal stresses, where μ is the coefficient of internal
friction (Jaeger and Cook 1976). The modified Griffith theory in terms of shear and
normal stresses expressed in Equations 2.12 and 2.13, and illustrated in Figure 2.16.
( ) ( ) tσμμσμμσ 411 21
23
21
21 =⎥
⎦
⎤⎢⎣
⎡++−⎥
⎦
⎤⎢⎣
⎡−+ (2.11)
04.4 22 =−+ tnt σσστ For 0<nσ (2.12)
nt μσστ += 2 For 0>nσ (2.13)
38

McClintock and Walsh (1962) also recommended it can be assumed that 1=μ
and the ratio of t
c
σσ
is -10. Details of the development and derivation of Griffith and
modified Griffith crack theory are presented in Sariosseiri (2008).
σn
τ
σt
2σt
τ=2σt+μσn
τ2+4σt.σn-4σt2=0
σn
τ
σt
2σt
τ=2σt+μσn
τ2+4σt.σn-4σt2=0
Figure 2.16: Failure envelope based on modified Griffith theory in terms of shear and normal stresses.
Griffith and modified Griffith failure envelopes assumed that the ratio of t
c
σσ
is -8 and -
10 respectively, while results of studies on 13 different rocks showed that this ratio varies
between -5 and -22. However, results of study by Abboud (1973) revealed close
agreement between measured and predicted values for cement treated materials by using
Griffith and modified Griffith theory, as shown in Figures 2.17 and 2.18 for gravel and
silty clay soils, respectively.
39

σn (psi)
τ (psi)
σn (psi)
τ (psi)
Figure 2.17: Comparison between measured strength and predicted values by
Griffith theory for cement treated gravel (Mitchell 1976).
σn (psi)
τ (psi)
σn (psi)
τ (psi)
Figure 2.18: Comparison between measured strength and predicted values by Griffith theory for cement treated silty clay soil (Mitchell 1976).
40

It can be observed that modified Griffith theory can be applied for cement treated
soils. Figure 2.19 presented by Mitchell (1976) shows the variation of N1σ and
N3σ (principal stresses at failure normalized by unconfined compressive strength,cσ
σ ) for
published data. It can be observed that Griffith theory can be applied in tensile range and
low stress levels ( 1.03 <cσ
σ), whereas modified Griffith theory can be applied for a wide
range of stress levels. Mitchell (1976) found that μ can be assumed 0.89 instead of 1.0.
σ3N
σ1N
σ3N
σ1N
Figure 2.19: Failure envelope for cement treated soils (Mitchell 1976).
41
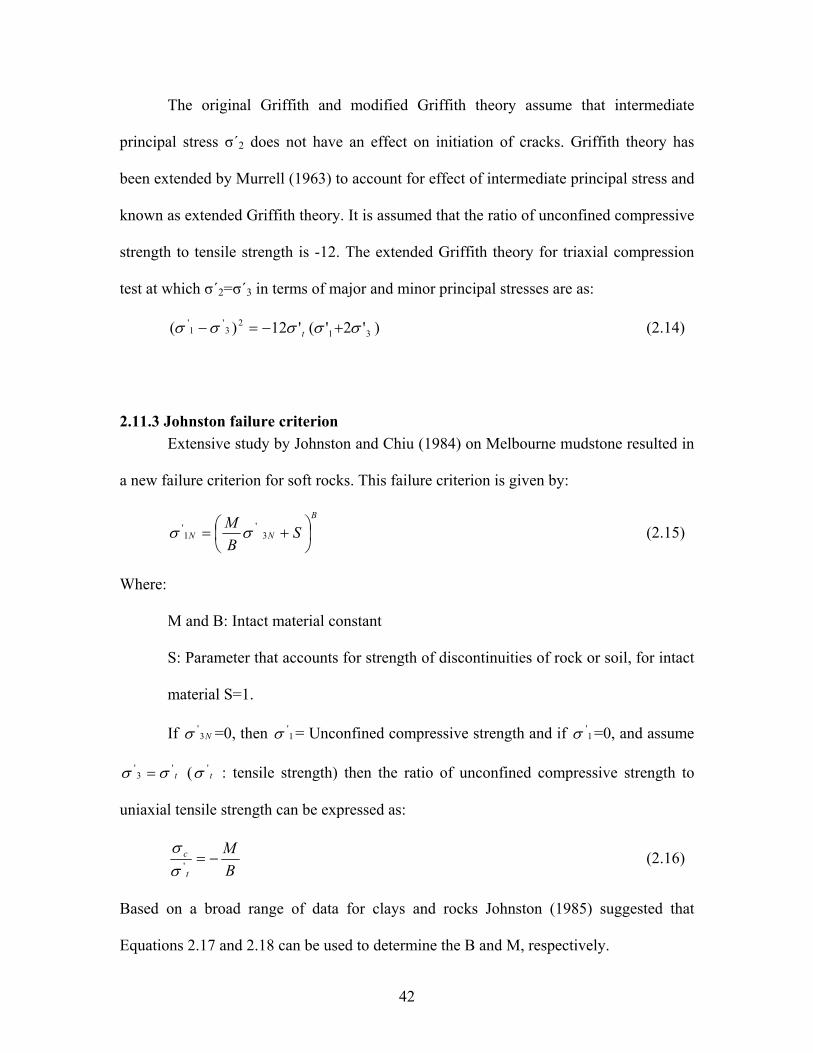
The original Griffith and modified Griffith theory assume that intermediate
principal stress σ΄2 does not have an effect on initiation of cracks. Griffith theory has
been extended by Murrell (1963) to account for effect of intermediate principal stress and
known as extended Griffith theory. It is assumed that the ratio of unconfined compressive
strength to tensile strength is -12. The extended Griffith theory for triaxial compression
test at which σ΄2=σ΄3 in terms of major and minor principal stresses are as:
(2.14)
)'2'('12)( 312
3'
1' σσσσσ +−=− t
2.11.3 Johnston failure criterion Extensive study by Johnston and Chiu (1984) on Melbourne mudstone resulted in
a new failure criterion for soft rocks. This failure criterion is given by:
B
NN SBM
⎟⎠⎞
⎜⎝⎛ += 3
'1' σσ (2.15)
Where:
M and B: Intact material constant
S: Parameter that accounts for strength of discontinuities of rock or soil, for intact
material S=1.
If =0, then = Unconfined compressive strength and if =0, and assume
( : tensile strength) then the ratio of unconfined compressive strength to
uniaxial tensile strength can be expressed as:
N3'σ 1
'σ 1'σ
t'
3' σσ = t
'σ
BM
t
c −='σσ
(2.16)
Based on a broad range of data for clays and rocks Johnston (1985) suggested that
Equations 2.17 and 2.18 can be used to determine the B and M, respectively.
42

(2.17) 2)(0172.01 cLogB σ−=
(2.18) 2)(276.0065.2 cLogM σ+=
Where, unconfined compressive strength is measured in kPa. In order to specify M for
different rock types he presented Equations 2.19 to 2.22 for Limestone, Mudstone,
Sandstone, and Granite, respectively.
(2.19) 2)(170.0065.2 cLogM σ+=
(2.20) 2)(231.0065.2 cLogM σ+=
(2.21) 2)(270.0065.2 cLogM σ+=
(2.22) 2)(659.0065.2 cLogM σ+=
It can be seen that M depends on unconfined compressive strength as well as material
type.
2.11.4 Critical state frame work and Cam-clay failure criterion 2.11.4.1 Introduction
None of the failure criteria extant in the field of soil mechanics account for the
changes in shear behavior of soils with confining stress. This important feature is
captured by Critical State Soil Mechanics (CSSM). While its original developments were
based on remolded clay, the frame work has been shown to be applicable for a wide
range of soils. Chiu and Johnston (1984) showed its applicability for soft Melbourne
mudstone.
43
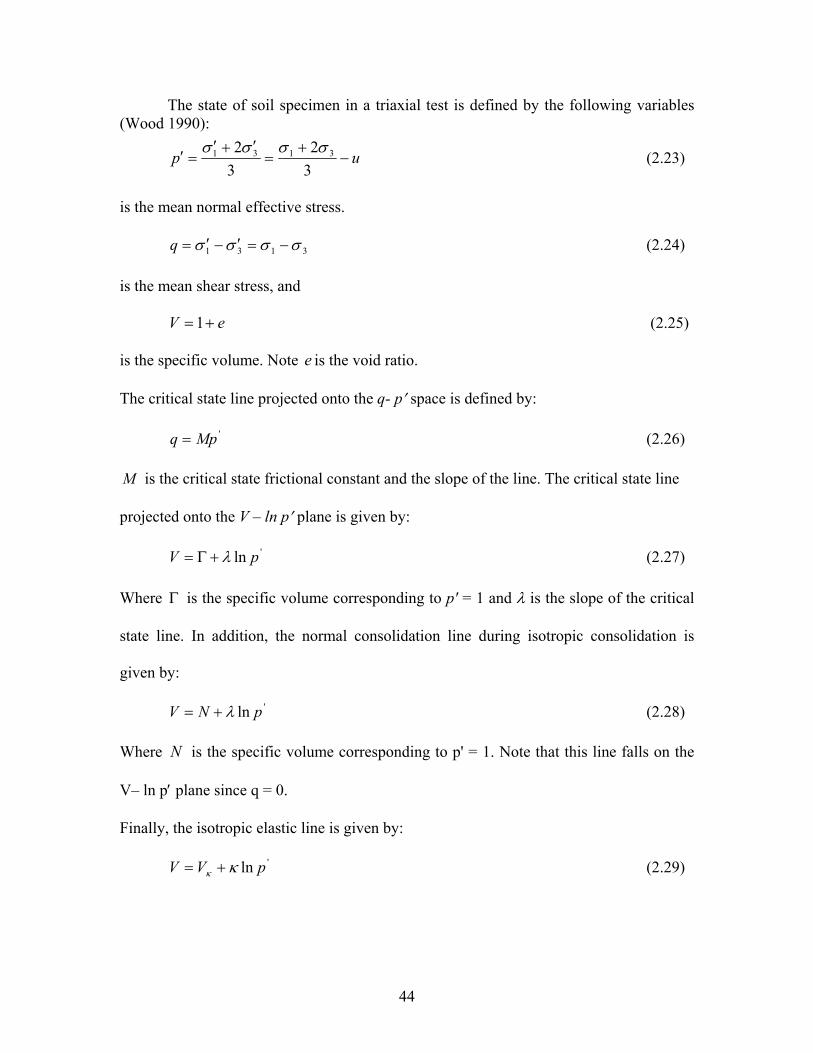
The state of soil specimen in a triaxial test is defined by the following variables (Wood 1990):
up −+
=′+′
=′32
32 3131 σσσσ
(2.23)
is the mean normal effective stress.
3131 σσσσ −=′−′=q (2.24)
is the mean shear stress, and
eV +=1 (2.25)
is the specific volume. Note e is the void ratio.
The critical state line projected onto the q- p′ space is defined by:
'Mpq = (2.26)
M is the critical state frictional constant and the slope of the line. The critical state line
projected onto the V – ln p′ plane is given by:
'ln pV λ+Γ= (2.27)
Where is the specific volume corresponding to p' = 1 and λ is the slope of the critical
state line. In addition, the normal consolidation line during isotropic consolidation is
given by:
Γ
'ln pNV λ+= (2.28)
Where is the specific volume corresponding to p' = 1. Note that this line falls on the
V– ln p′ plane since q = 0.
N
Finally, the isotropic elastic line is given by:
'ln pVV κκ += (2.29)
44

Where κ is the slope of swelling and recompression lines and is the specific volume
corresponding to p' = 1. The four basic parameters of the critical state framework, M,
κV
Γ ,
λ and κ are shown in Figures 2.20 and 2.21.
P'
q
M
Critical state line
P'
q
M
Critical state line
Figure 2.20: Critical state parameter M in q-p' spaces.
V=1+e
ln p'
Normally consolidated lineCritical state line
λκГ
N
0P'=1
Swelling and recompression line
+eV=1
ln p'
Normally consolidated lineCritical state line
λκГ
N
0P'=1
Swelling and recompression line
ln p'
Normally consolidated lineCritical state lineCritical state line
λκГ
N
0P'=1
Swelling and recompression lineSwelling and recompression line
Figure 2.21: Critical state parameters in V-ln p' space.
45

At the core of CSSM was the creation of the constitutive model called Cam-clay
based on the theory of plasticity and the prediction of the successive ductile yielding
states of specimens on the wet side of critical state (Schofield and Wroth 1968). For the
Cam-clay model, the parameters N, Г, λ, and κ are related by the simple expression:
κλ −=Γ−N (2.30)
and therefore if three are known the fourth may be established. By performing isotropic
consolidation and swelling tests in triaxial system on normally consolidated specimens
and plotting V as a function of ln p′ the parameters N, Г, λ, and κ may be obtained. For
the Cam-clay model:
λκ−λ−κ−λ+Γ
κ−λ==η VM)(M
pq
' (2.31)
'ln pVV λλ += (2.32)
Therefore, by plotting η against Vλ, a straight line with slope of –M/(λ-κ) should be
obtained. Since (λ-κ) is evaluated from the isotropic consolidation and swelling tests, M
can then be determined.
2.11.4.2 State of soils
In the critical state framework, the state of soils is defined in a 3-D, mean
effective normal stress (p'), shear stress (q) and void ratio or specific volume (V) space.
Limits to stable states of yielding are defined by the state boundary surface in the 3-D, q-
p'-V space. The 2-D representations of the normalized state boundary surface in the
q/p΄crit - p/p΄crit (p΄crit : mean effective confining pressure at critical state) and V-ln p'
spaces are as shown in Figure 2.22. Critical state soil mechanics divides the soil behavior
46

at limiting states into three distinct classes of failure; the limiting lines OA and OG
(Figure 22a) indicate states of soils undergoing fractures or cracks; AB and GE indicate
that Hvorslev’s Coulomb faults on rupture planes; BD and ED indicate Cam-clay yield
and fold of a sediment layer. Soil states on the crack surface result in the development of
unstable fissures and cracks openings. Heavily overconsolidated clays and
overcompacted sands at low confining stresses could reach this limiting state. Collapse
similar to fracture on the dilative side can also exist on the contractive domain but outside
the normal consolidation line (Figure 2.22b).
Figure 2.22: Limits of stable states of soils in (a) normalized q/pcrit - p/pcristress space stress (b) V– ln p' space (Pillai and Muhunthan 2002) (schematic).
47
Such states outside the stable yielding exist in wind deposited loose sands, air
pluviated or moist-tamped sands and result abrupt collapse upon shearing of these
materials (Pillai and Muhunthan 2001; Pillai and Muhunthan 2002). For sands and clayey
silts of low plasticity, stable yield behavior occurs only within a narrow band on both the
looser and denser side of the critical state line (Figure 2.22b).
The “no tension” or “limiting tensile strain” criteria are the most widely used
among the alternative theories to quantify tensile fracture (Schofield 1980). For the
triaxial specimen the no tension criterion with σ'3 = 0 results in p' = σ'1/3 or q/p' = 3 and
leads to vertical split cracks which is the case of line OA. For horizontally spalling
cracks, σ'1= 0 results in p' = 2/3 σ'3, q = -σ'3, or q/p' = 1.5 which is the case of line OG.
For clays or silty clays, Schofield (1980) had suggested that the change from rupture to
tensile crack occurs at a pressure p' = 0.1 p'c, where p'c is the effective confining stress at
critical state.
When the effective stress path crosses the crack surface OA, the soil element
begins to disintegrate into a clastic body and unstressed grains become free to slide apart.
In that case the average specific volume of the clastic mass can increase (large
voids/cracks) and consequently its permeability can increase significantly and instantly.
A significant internal/external shear stress at low confining stresses can cause the
crossover of the crack-surface OA and a large increase in specific volume. When such
condition occurs, the opening within the soil body may be an extensive crack or a local
pipe or channel.
48

2.11.4.3 Liquidity index, confining stress, and soil behavior
Critical state soil mechanics (Schofield and Wroth 1968) has shown that it is
possible to generalize the density or specific volume axis by converting to a liquidity
basis. It was further shown that the critical pressure is about 5 kPa at the liquid limit and
500 kPa at the plastic limit. In his Rankine lecture, Schofield (1980) mapped the
remolded soil behavior on a liquidity against pressure diagram as shown in Figure 21
utilizing the hundred fold increase in pressure from the liquid limit critical state to the
plastic limit critical state which is two log cycles, so the rupture band has half the width
of PI and will intersect the line p' = 5 kPa at LI = 0.5. This intersection is a consequence
of putting the lower limit of Coulomb rupture at p/pcrit = 0.1 (Schofield 1980). In the LI-p'
space, clear boundaries exists that separate the regions of fracture, rupture, and ductile
behavior. This is an independent and convenient approach to separate the states of
fracture/rupture/ductile yield behavior of the soil using its index properties.
Considering a body of soil initially at LI = 0.5 and subjected to an elastic
compression the map suggests at shallow depths where p' < 5kPa there may be cracks,
but for depths where 5 kPa < p' < 50 kPa the soil will remain water-tight while
deforming. In contrast a body of soil initially at LI = 0 will undergo fracture at depths for
which p < 50 kPa or about 3 m of the overburden depth. In other words, the overburden
depth should be larger than 3 m to ensure that deformation caused rupture planes (water
tight) rather than open cracks. If LI = -0.25, the depth could be about 100 kPa or 6 m of
depth.
49

Figure 2.23: Liquidity and limits of soil behavior in LI-Log p' space (after Schofield 1980).
In order to identify the band of behavior in which various states of soil lie in the
LI-p' space, Schofield (1980) defined their equivalent liquidities by projecting these
states in the direction parallel to the critical state line towards the ordinate through p' = 5
kN/m2. The equivalent liquidity LI5 can be shown to be LI5 = LI+1/2 log (p'/5) (Schofield
50

1980). Therefore, the equivalent liquidity equals liquidity as found in the ground plus a
correction for stress. A value of LI5 of less than 0.5 generally would indicate the fracture
zone. Values of 0.5 to 1.0 represent the rupture zone. Values larger than 1.0 represent
Cam-clay ductile zone.
The inset of Figure 2.23 shows the section of the behavior map at constant p'.
Stress ratios q/p' will increase as equivalent liquidity falls. In the high equivalent liquidity
range, stress ratio increases linearly as liquidity of Cam-clay falls. The Hvorslev’s surface
gives the rupture limits which allow higher stress ratios as lower values of p/pcrit are
approached, but at the no tension limits, q/p' = 3 in compression, and –1.5 in extension.
There is a general increase of limiting stress ratio as equivalent liquidity falls, but this is
not a continuous change because there is a change of limiting behavior from continuous
yield, to discrete rupture , to fracture of stiff fissured soil at equivalent liquidity below 0.5
(Schofield 1980).
The above concepts provide two independent approaches to analyze the cracking
of soils. The first approach makes use of mechanical properties determined from triaxial
tests and Oedometer tests to separate the three regions of soil behavior, the fractures, the
faults, and the ductile yield. The second approach relies on index properties (plasticity
index and liquidity index) to identify such regions. The analysis herein employed both
approaches to complement each other.
51
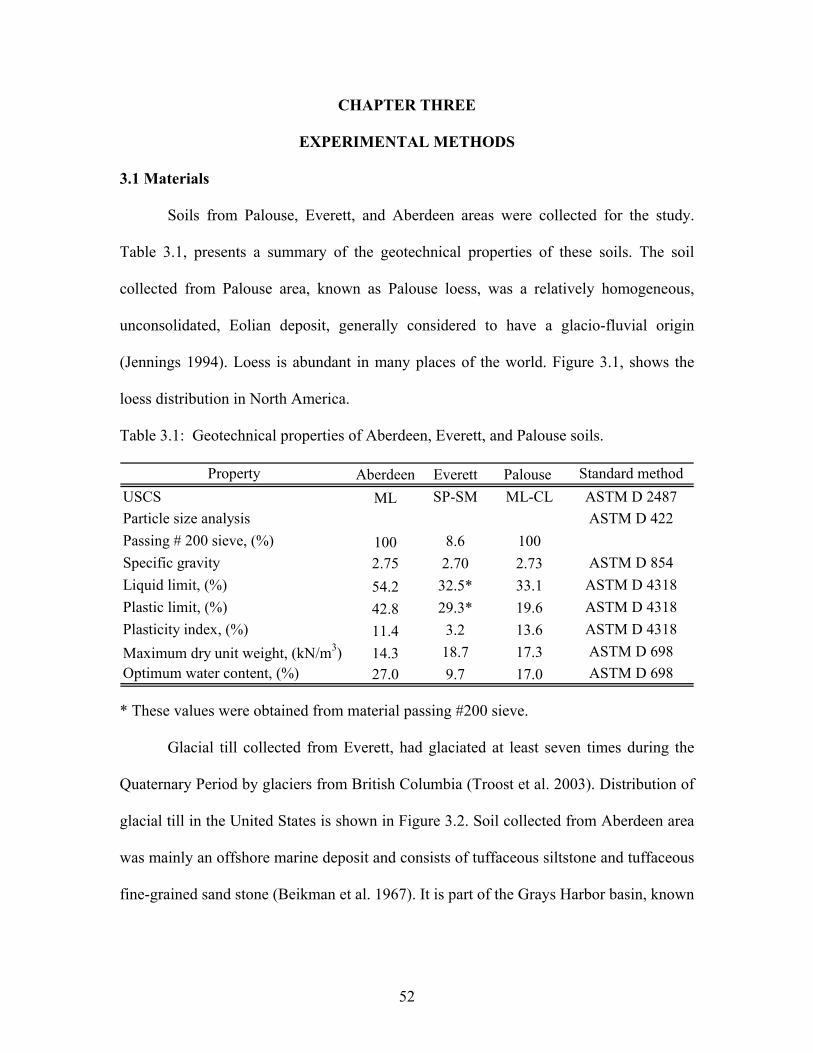
CHAPTER THREE
EXPERIMENTAL METHODS
3.1 Materials
Soils from Palouse, Everett, and Aberdeen areas were collected for the study.
Table 3.1, presents a summary of the geotechnical properties of these soils. The soil
collected from Palouse area, known as Palouse loess, was a relatively homogeneous,
unconsolidated, Eolian deposit, generally considered to have a glacio-fluvial origin
(Jennings 1994). Loess is abundant in many places of the world. Figure 3.1, shows the
loess distribution in North America.
Table 3.1: Geotechnical properties of Aberdeen, Everett, and Palouse soils.
Aberdeen Everett Palouse ML SP-SM ML-CL
100 8.6 1002.75 2.70 2.7354.2 32.5* 33.142.8 29.3* 19.611.4 3.2 13.614.3 18.7 17.327.0 9.7 17.0
Plastic limit, (%)Plasticity index, (%)
Property
Passing # 200 sieve, (%)Specific gravityLiquid limit, (%)
Particle size analysis
Standard method
ASTM D 854ASTM D 4318
ASTM D 422
ASTM D 698
USCS ASTM D 2487
Maximum dry unit weight, (kN/m3)Optimum water content, (%)
ASTM D 4318ASTM D 4318ASTM D 698
* These values were obtained from material passing #200 sieve.
Glacial till collected from Everett, had glaciated at least seven times during the
Quaternary Period by glaciers from British Columbia (Troost et al. 2003). Distribution of
glacial till in the United States is shown in Figure 3.2. Soil collected from Aberdeen area
was mainly an offshore marine deposit and consists of tuffaceous siltstone and tuffaceous
fine-grained sand stone (Beikman et al. 1967). It is part of the Grays Harbor basin, known
52
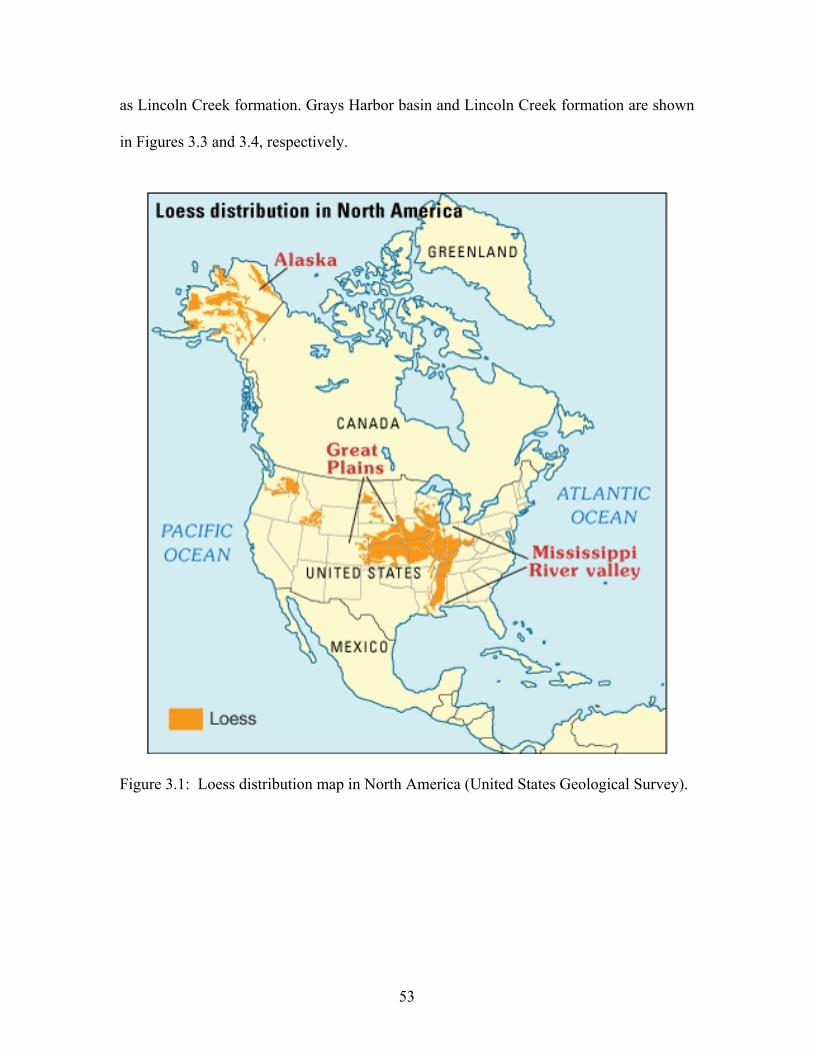
as Lincoln Creek formation. Grays Harbor basin and Lincoln Creek formation are shown
in Figures 3.3 and 3.4, respectively.
Figure 3.1: Loess distribution map in North America (United States Geological Survey).
53

Figure 3.2: Glacial till distribution map (University of Florida). Figure 3.3: Grays Harbor basin area (Beikman et al. 1967).
54

Figure 3.4: Distribution of Lincoln Creek formation in Grays Harbor basin (Beikman et al. 1967).
55

3.2 Testing program
In order to accomplish and clarify the objectives of this research, a series of soil
mechanics laboratory tests including drying rate of soils, Atterberg limits using
Casagrande and fall cone method, standard proctor (compaction), unconfined
compressive strength, consolidated-undrained triaxial, and Oedometer (consolidation)
tests were conducted on non-treated, as well as, cement treated soils.
3.2.1 Drying rate of the soils (solidification)
Solidification is the process that removes excess water from soil mass by
hydration reaction induced by addition of stabilization agent (Bennert et al. 2000). This
process was investigated by recording the reduction of moisture content of the material
with time for addition of different cement content. The soils were first oven dried, water
was added to bring them back to a certain water content. Different amounts of cement
was added to the mixture, changes in water content were measured with time. Results are
presented in a plot of water content versus time.
3.2.2 Atterberg limits, Casagrande method
Enhanced workability of materials has been shown to be associated with
reduction in plasticity index (Baran et al. 2001; Mallela et al. 2004). A series of tests with
different cement content were conducted to determine the effect of cement content on the
Atterberg limits of Palouse and Aberdeen soils. Note that, since the Everett soil is sandy,
plasticity limits were not considered. Tests were conducted 30 minutes after addition of
cement according to ASTM D4318.
56

3.2.3 Atterberg limits, fall cone test (cone penetration)
The fall cone test is a method to determine the liquid limit of soils based on
penetration of a standard cone (shape and mass) into the soils. It was originally developed
as a technique to determine the undrained shear strength of remolded cohesive soils in
Scandinavia (Koumoto and Houlsby 2001). Reliability of this technique to determine the
liquid limit of soils is widely documented (Koumoto and Houlsby 2001; Sivapullaial and
Sridharan 1985; Feng 2000). In the fall cone test (Figure 3.5), a cone with an apex angle
of 30˚ and total mass of 80 grams is suspended above, but just in contact with the sample.
The cone is permitted to fall freely for a period of 5 seconds. The water content
corresponding to a cone penetration of 20 mm is defined by British Standard 1377 as the
liquid limit (Head 1992).
Figure 3.5: Fall cone (cone penetration) test apparatus.
57

Independently, Lawrence (1980) and Wasti (1987) used two cones with different
masses to measure penetration, which can be associated to plasticity index. A typical
result of fall cone test is shown in Figure 3.6. The plasticity index is determined by:
⎟⎟⎠
⎞⎜⎜⎝
⎛−
=
1
2
21 100)(
MM
Log
LogWWPI (3.1)
Where,
W1: Water content corresponding to 20mm penetration of M1
W2: Water content corresponding to 20mm penetration of M2
Penetration (mm) [Log Scale]
Wat
er C
onte
nt (%
)
20
W1
W2
M1=80 g
M2=240 g
Penetration (mm) [Log Scale]
Wat
er C
onte
nt (%
)
20
W1
W2
M1=80 g
M2=240 g
Figure 3.6: Schematic results of fall cone test.
58

In order to determine the effect of addition of cement on plasticity of Aberdeen
soil, a series of fall cone tests on native soil and cement treated soil were conducted. For
cement treated soils two sets of sample were prepared. One was tested half an hour after
addition of cement and the other was tested after 7 days curing in an air tight container.
3.2.4 Standard proctor (compaction)
In order to investigate the effect of addition of cement on optimum water content
and maximum dry unit weight of the selected soils, a series of standard proctor tests on
non-treated and cement treated soils (2.5, 5, 7.5, and 10% cement content) were
conducted according to ASTM D 698. Cement was added to oven dried soils and mixed
until uniform color was observed before compaction. It must be noted that tests were
completed in less than an hour.
3.2.5 Unconfined compressive strength
Despite its limitations on replicating conditions in the field, the unconfined
compression test is one of the widely used laboratory tests in pavement application and
soil stabilization application. The unconfined compression strength is often used as an
index to quantify the improvement of soils due to treatment. For example, ASTM D 4609
(Standard guide for evaluating effectiveness of admixture for soil stabilization) states that
an increase in unconfined compressive strength of 345 kPa (50 psi) or more must be
achieved for a treatment to be considered effective. In addition, if specimens do not slake
during immersion, the treatment may be effective; and if no significant strength is lost
due to immersion, the treatment may be effective for waterproofing soils. Based on
59

ASTM D2166 suggestion (the largest particle diameter should be smaller than 1/6 mold
diameter), particle sizes retained on sieve #6 were removed from the soils prior to
performing the unconfined compression test. A series of unconfined compressive strength
tests were conducted on the host soils as well as cement treated soils according to ASTM
D2166 and ASTM D4609. Axial load increment was applied at a rate of 1% strain per
minute.
3.2.5.1 Specimen preparation
Specimens were prepared at optimum water content and maximum dry density for
each mixture (0, 2.5, 5, 7.5, and 10% cement content) by using the Harvard miniature
apparatus. For each cement content, two sets of specimens were prepared. One set was
tested after 7 days curing time in an air tight container with a wet sponge placed upon it.
The other set was wrapped in a plastic sheet and placed in an air tight container with a
wet sponge for seven days, then immersed in water for two days prior to testing (Figure
3.7a and 3.7b). Weights of the samples were measured before and after immersion in
water.
(a) (b) Figure 3.7: (a) Specimens during curing period, (b) Specimens being immersed in water.
60
3.2.6 Consolidated-Undrained triaxial
While unconfined compressive strength is widely used as an index in quantifying
improvement, it is evident from the discussion in Chapter Two that soil behavior is
controlled by confining pressure. In order to examine the strength behavior in detail, a
series of consolidated-undrained (CU) triaxial tests with pore pressure measurements
were conducted. This information is required for evaluating the suitability of treated
material for construction of embankments. Confining pressures were varied from 0 to 600
kPa. The latter simulates the effect of a 30 m height embankment confining pressures.
3.2.6.1 Specimen Preparation
Everett and Aberdeen soils were used in this part of the study. Consolidated-
undrained triaxial test were conducted on host soils as well as cement treated soils. The
dry material was mixed with cement thoroughly until a uniform color was observed.
Formation of clumps was avoided when water was added to soil cement mixture.
Samples were prepared at optimum water content and maximum dry density. In order to
prepare compacted specimens compatible with the triaxial machine at our laboratory and
minimize sample disturbance prior to loading, a split mold was custom-built (Figure 3.8).
The diameter and height of the mold were 7 cm and 16.4 cm, respectively. However for
Aberdeen soil splitting the mold without disturbing the sample was not possible,
therefore a sample extruder was used to extrude the compacted specimens. After the
material was placed in the mold standard proctor hammer was used to compact the soil in
five equal layers to achieve target density. The mixing and compaction was completed
within an hour. Specimens were cured for seven days. Cement treated samples were kept
61

for a day in an air tight container with a wet sponge in it, after that with the intention of
help saturation samples were immersed in water for six days prior to testing. It must be
noted that unconfined compressive strength samples in this part of the study were
prepared similar to triaxial specimens.
Figure 3.8: Custom built mold for triaxial test.
3.2.6.2 Saturation
Cured specimens were set on the base of the triaxial chamber, a filter paper and
pre-boiled porous stone were placed between the base and bottom of the sample and
between the cap and top of it. A rubber membrane was used to seal the specimen from the
chamber around it and secured with O rings at the cap and the base. Chamber was
assembled, filled with water and small confining pressure (40 kPa) was applied, then CO2
was percolated from bottom to top for 2-3 minutes to expedite displacement of the air.
Air bubbles were forced out of the system by injecting de-aired water in to the
tubes. De-aired water was allowed to percolate from bottom to top of the sample under a
small gradient (5 kPa). Percolation was continued until amount of the water flowing into
62
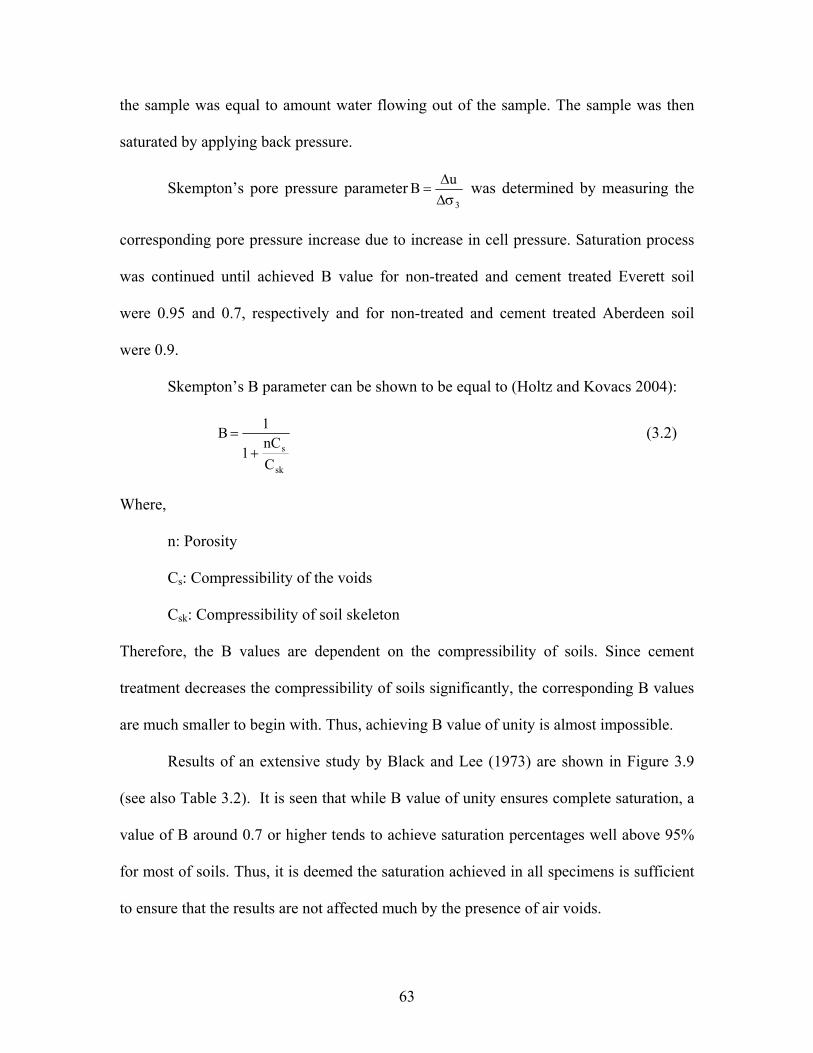
the sample was equal to amount water flowing out of the sample. The sample was then
saturated by applying back pressure.
Skempton’s pore pressure parameter3
uBσΔΔ
= was determined by measuring the
corresponding pore pressure increase due to increase in cell pressure. Saturation process
was continued until achieved B value for non-treated and cement treated Everett soil
were 0.95 and 0.7, respectively and for non-treated and cement treated Aberdeen soil
were 0.9.
Skempton’s B parameter can be shown to be equal to (Holtz and Kovacs 2004):
sk
s
CnC
1
1B+
= (3.2)
Where,
n: Porosity
Cs: Compressibility of the voids
Csk: Compressibility of soil skeleton
Therefore, the B values are dependent on the compressibility of soils. Since cement
treatment decreases the compressibility of soils significantly, the corresponding B values
are much smaller to begin with. Thus, achieving B value of unity is almost impossible.
Results of an extensive study by Black and Lee (1973) are shown in Figure 3.9
(see also Table 3.2). It is seen that while B value of unity ensures complete saturation, a
value of B around 0.7 or higher tends to achieve saturation percentages well above 95%
for most of soils. Thus, it is deemed the saturation achieved in all specimens is sufficient
to ensure that the results are not affected much by the presence of air voids.
63

Figure 3.9: Relationship between pore pressure parameter B and degree of saturation, (Black and Lee 1973). Table 3.2: B values for different soils at complete or nearly complete saturation (Black and Lee 1973).
100% 99.5% 99%0.9998 0.9920 0.98600.9988 0.9630 0.93900.9877 0.6900 0.51000.9130 0.2000 0.1000
Medium (compacted clays)Stiff (Stiff clays-sands)Very stiff (very high consolidated pressure)
SaturationSoil type
Soft normally consolidated clays
3.2.6.3 Consolidation and shearing
Specimens were consolidated at different cell pressures. Consolidation was
continued until the height of water in burettes (on triaxial panels) did not rise. Once
consolidation was completed, samples were sheared at a deformation rate of 0.5 mm per
minute (strain controlled). Pore pressure changes during shearing were recorded.
64
3.2.7 Oedometer test (consolidation)
In order to determine the effect of addition of cement on consolidation parameters
of Aberdeen soil, series of Oedometer tests on host soil as well as cement treated soils
were conducted. Specimens were prepared similar to triaxial test, then trimmed to fit into
the Oedometer ring. Non-treated and cement treated specimens were immersed in water
three days and six days prior to testing.
65
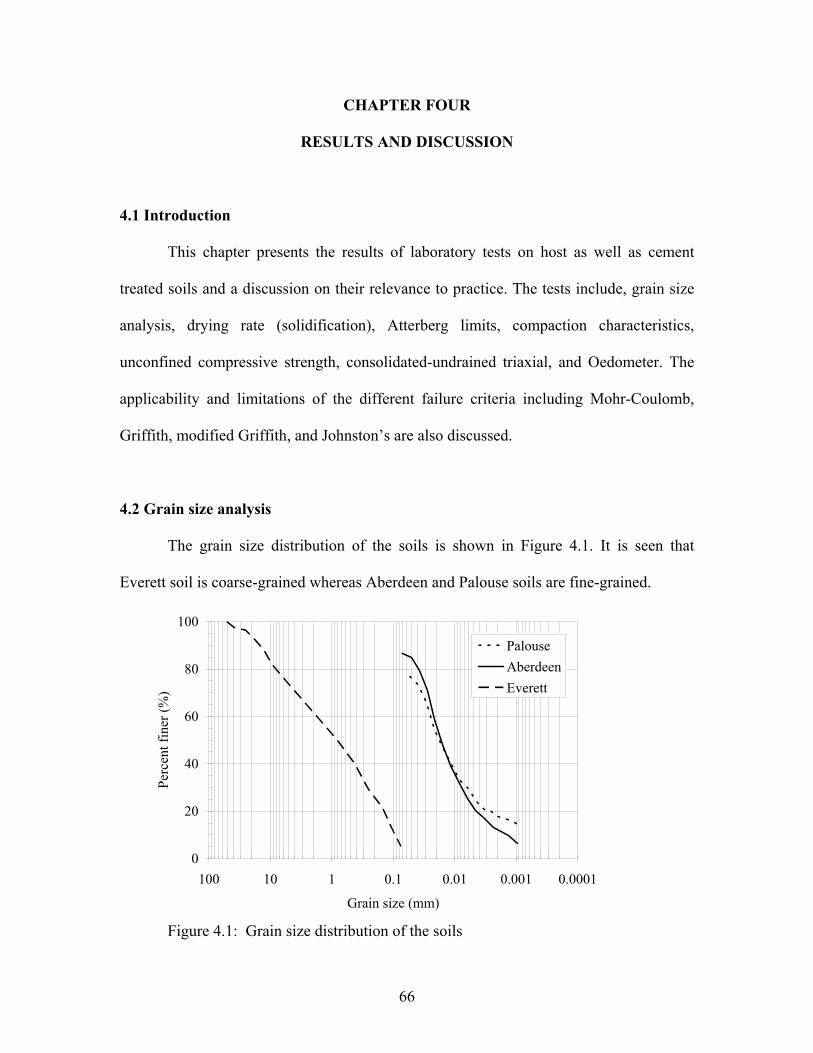
CHAPTER FOUR
RESULTS AND DISCUSSION
4.1 Introduction
This chapter presents the results of laboratory tests on host as well as cement
treated soils and a discussion on their relevance to practice. The tests include, grain size
analysis, drying rate (solidification), Atterberg limits, compaction characteristics,
unconfined compressive strength, consolidated-undrained triaxial, and Oedometer. The
applicability and limitations of the different failure criteria including Mohr-Coulomb,
Griffith, modified Griffith, and Johnston’s are also discussed.
4.2 Grain size analysis
The grain size distribution of the soils is shown in Figure 4.1. It is seen that
Everett soil is coarse-grained whereas Aberdeen and Palouse soils are fine-grained.
0
20
40
60
80
100
0.00010.0010.010.1110100
Grain size (mm)
Perc
ent f
iner
(%)
Palouse AberdeenEverett
Figure 4.1: Grain size distribution of the soils
66
4.3 Solidification
The effect of cement treatment on the solidification characteristics of Aberdeen,
Everett, and Palouse soils in the laboratory is as shown in Figures 4.2, 4.3, and 4.4,
respectively. These observations were made at room temperature (24˚C) for conditions of
different cement contents. It can be observed that addition of cement leads to significant
reduction in water content of the soils. Initial drying rate increased with cement content,
soils displayed nearly equal drying rate after 30 minutes of addition of cement. The
results also show that mixed soils could lose significant amount of water depending on
the type of soils. This will facilitate the compaction of soils wet of optimum that are often
encountered in west of Washington state. However, it is necessary to perform compaction
within the first few minutes to avoid loss of large amount of water.
Use of a drying rate curve as has been done here in the laboratory would facilitate
contractors with the choice of appropriate mixing time to achieve a given reduction of
water content in practice. In addition, it is suggested that allowance be made for
prevailing atmospheric and site conditions on the drying rate for field applications.
67
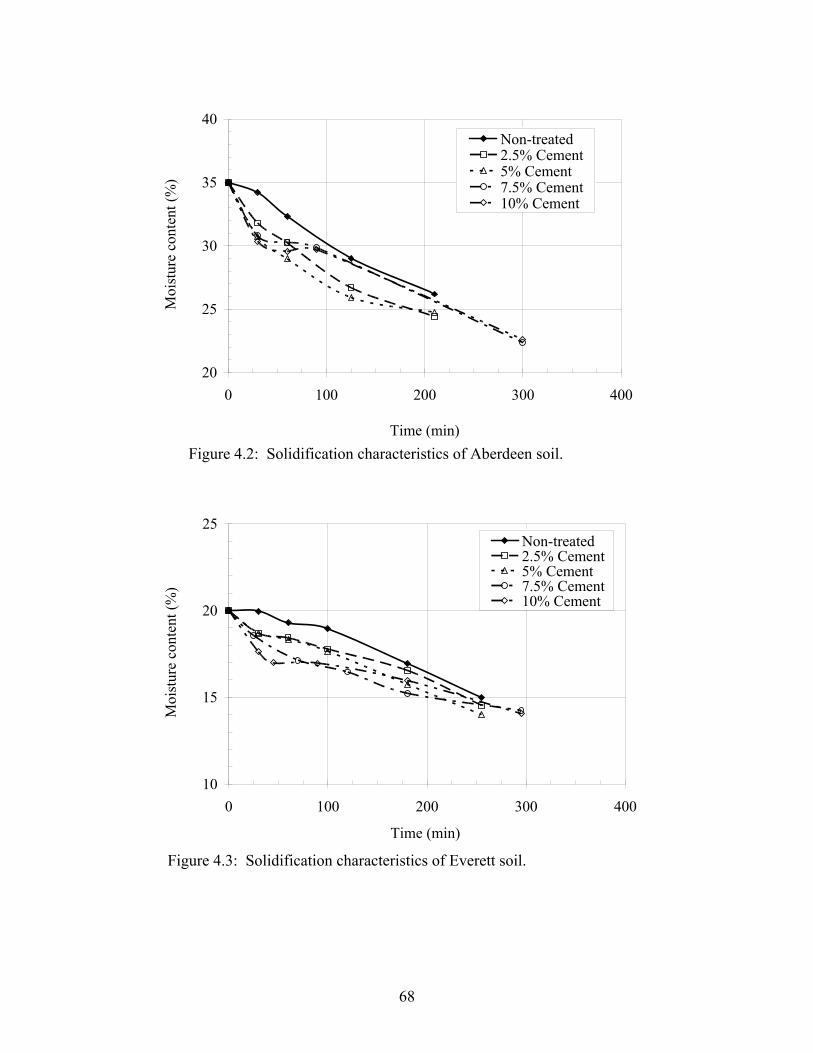
20
25
30
35
40
0 100 200 300 400
Time (min)
Moi
stur
e co
nten
t (%
)
Non-treated2.5% Cement5% Cement7.5% Cement10% Cement
Figure 4.2: Solidification characteristics of Aberdeen soil.
25
10
15
20
0 100 200 300 400
Time (min)
Moi
stur
e co
nten
t (%
)
Non-treated 2.5% Cement 5% Cement 7.5% Cement
10% Cement
Figure 4.3: Solidification characteristics of Everett soil.
68

LL (%) PL(%) PI(%)30 min 30 min 30 min 30 min 7 days 30min 7 days 30 min 7 days
54 42.8 11.42.5% Cement content 56.4 41.8 14.6 NP NP NP NP NP NP5.0% Cement content 54.9 44.8 10.1 67.2 57.2 58.1 50.9 9.1 6.37.5% Cement content 54.1 45.7 8.4 NP NP NP NP NP NP10% Cement content 53.1 46.9 6.2 66.6 61.5 57.1 56.4 9.5 5.1
53 7.6
LL (%) PL (%) PI (%)Fall cone testCasagrande method
60.6Non-treated
NP: Not performd.
20
25
30
35
0 100 200 300 400
Time (min)
Moi
stur
e co
nten
t (%
)Non-treated 2.5% Cement
5% Cement 7.5% Cement
10% Cement
Figure 4.4: Solidification characteristics of Palouse loess.
4.4 Atterberg limits
The results of Atterberg limits test using Casagrande and fall cone method for
Aberdeen soil is as shown in Table 4.1. Note that fall cone tests were performed 30
minutes and seven days after addition of cement. As observed in the past by some
investigators (Wasti 1987), it is seen that the results of Casagrande and fall cone do not
match well.
Table 4.1: Atterberg limits for Aberdeen soil using Casagrande and fall cone method for different cement content.
69

Since the Casagrande method is widely used in North America, the effect of
cement addition on Atterberg limits discussed here based on it from this point onwards.
Variation of liquid and plastic limits for different cement content for Aberdeen soil is
shown in Figure 4.5. It can be seen that liquid limit increased slightly (initially) and
decreased with increasing in cement content, while plastic limit remained relatively
constant. Consequently the plasticity index increased initially followed by a decrease
with increase in cement content.
Variation of liquid limit and plastic limit for Palouse loess for different cement
content is shown in Figure 4.6. It can be seen that liquid limit increased initially and
decreased gradually as cement content increased. Plastic limit increased initially and
remained relatively constant with increasing in cement content. Therefore plasticity index
increased initially and decreased as cement content increased.
0
20
40
60
80
0 2.5 5 7.5 10 12.5
Cement content (% of dry weight of soil)
Wat
er c
onte
nt (
%)
Plasticity indexLiquid limitPlastic limit
Figure 4.5: Variation of plastic behavior of Aberdeen soil for different cement content
70
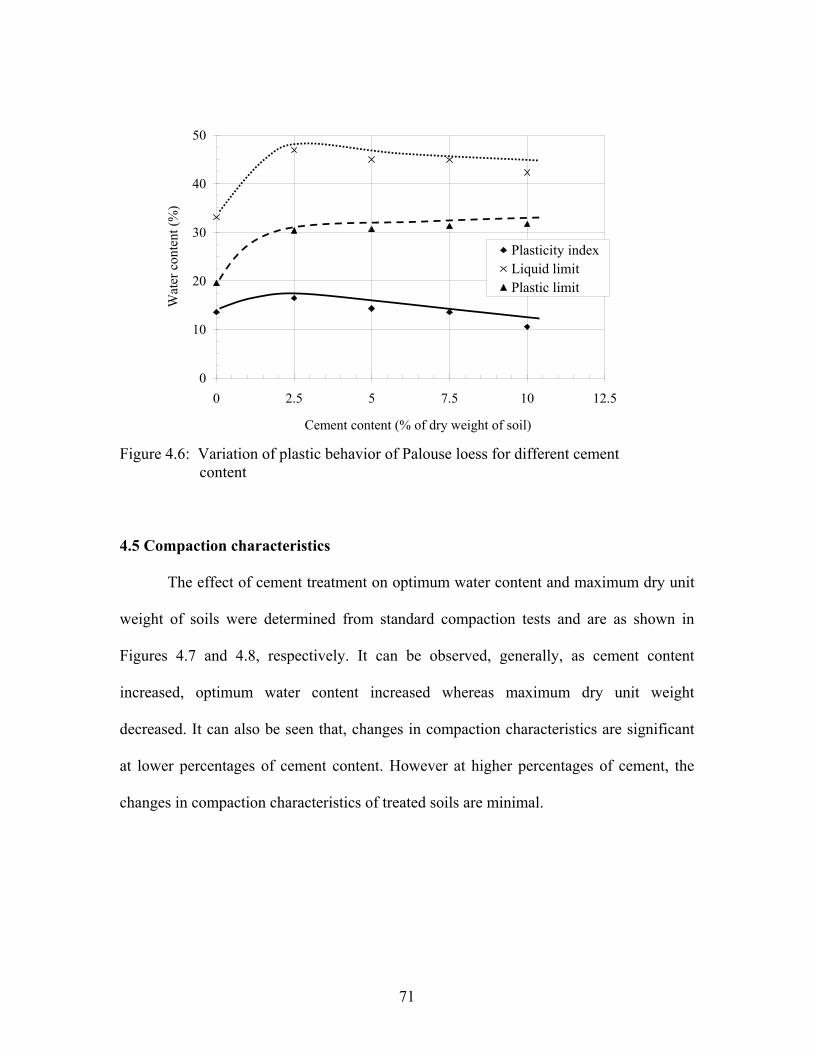
0
10
20
30
40
50
0 2.5 5 7.5 10 12.5
Cement content (% of dry weight of soil)
Wat
er c
onte
nt (%
)
Plasticity indexLiquid limitPlastic limit
Figure 4.6: Variation of plastic behavior of Palouse loess for different cement content
4.5 Compaction characteristics
The effect of cement treatment on optimum water content and maximum dry unit
weight of soils were determined from standard compaction tests and are as shown in
Figures 4.7 and 4.8, respectively. It can be observed, generally, as cement content
increased, optimum water content increased whereas maximum dry unit weight
decreased. It can also be seen that, changes in compaction characteristics are significant
at lower percentages of cement content. However at higher percentages of cement, the
changes in compaction characteristics of treated soils are minimal.
71

12
14
16
18
20
0 2.5 5 7.5 10 12.5
Cement content (% of dry weight of soil)
Max
imum
dry
den
sity
(kN
/m3 )
Aberdeen soilEverett soilPalouse loess
5
10
15
20
25
30
0 2.5 5 7.5 10 12.5
Cement content (% of dry weight of soil)
Opt
imum
wat
er c
onte
nt (%
) Aberdeen soilEverett soilPalouse loess
Figure 4.7: Effect of cement treatment on optimum water content of the soils.
Figure 4.8: Effect of cement treatment on maximum dry density of the soils.
72
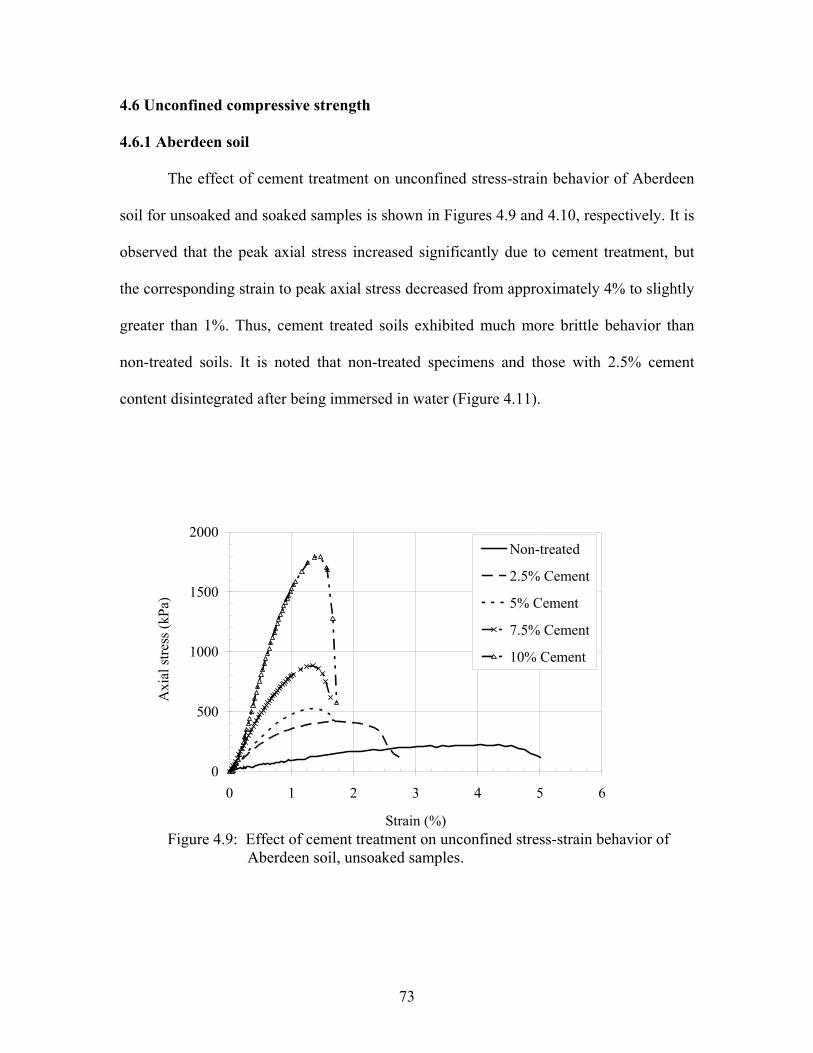
4.6 Unconfined compressive strength
4.6.1 Aberdeen soil
The effect of cement treatment on unconfined stress-strain behavior of Aberdeen
soil for unsoaked and soaked samples is shown in Figures 4.9 and 4.10, respectively. It is
observed that the peak axial stress increased significantly due to cement treatment, but
the corresponding strain to peak axial stress decreased from approximately 4% to slightly
greater than 1%. Thus, cement treated soils exhibited much more brittle behavior than
non-treated soils. It is noted that non-treated specimens and those with 2.5% cement
content disintegrated after being immersed in water (Figure 4.11).
0
500
1000
1500
2000
0 1 2 3 4 5 6
Strain (%)
Axi
al st
ress
(kPa
)
Non-treated
2.5% Cement
5% Cement
7.5% Cement
10% Cement
Figure 4.9: Effect of cement treatment on unconfined stress-strain behavior of Aberdeen soil, unsoaked samples.
73

0
500
1000
1500
2000
0 1 2 3 4 5 6
Strain (%)
Axi
al st
ress
(kPa
)
5% Cement
7.5% Cement
10% Cement
Figure 4.10: Effect of cement treatment on unconfined stress-strain behavior of Aberdeen soil, soaked samples.
Figure 4.11: Disintegration of specimens after being immersed in water.
74

The effect of addition of cement on unconfined compressive strength of Aberdeen
soil is shown in Figure 4.12, for unsoaked and soaked samples. It can be observed that
cement treatment leads to significant increase in unconfined compressive strength
especially for cement contents greater than 5%. Surprisingly, soaked samples with 7.5%
and 10% cement content exhibited greater unconfined compressive strength compared
with unsoaked samples. Figure 4.13, shows the effect of cement treatment on modulus of
elasticity at 30% of peak axial stress for soaked and unsoaked samples. It can be observed
that modulus of elasticity increased significantly with cement content.
0
500
1000
1500
2000
0 2.5 5 7.5 10 12.5
Cement content (% of dry weight of soil)
Unc
onfin
ed c
ompr
essi
ve st
reng
th (k
Pa)
SoakedUnsoaked
Figure 4.12: Effect of cement treatment on unconfined compressive strength of Aberdeen soil.
75

0
100
200
300
0 2.5 5 7.5 10 12.5
Cement content (% of dry weight of soil)
Mod
ulus
of e
last
icity
(MPa
)
SoakedUnsoaked
Figure 4.13: Effect of cement treatment on modulus of elasticity of Aberdeen soil.
4.6.2 Everett soil
The effect of cement treatment on unconfined stress-strain behavior of Everett
soil for unsoaked and soaked samples are shown in Figures 4.14 and 4.15, respectively. It
is observed that, cement treatment led to significant increase in peak axial stress, but
corresponding strain to peak axial stress decreased slightly. Therefore treated soils
exhibited more brittle behavior compared with non-treated soils. Non-treated specimens
disintegrated after being immersed in water. The effect of cement treatment on
unconfined compressive strength and modulus of elasticity at strain corresponding to
30% of peak axial stress are shown in Figures 4.16 and 4.17, respectively.
76

0
500
1000
1500
2000
0 1 2 3 4 5 6
Strain (%)
Axi
al st
ress
(kPa
)Non-treated
2.5% Cement
5% Cement
7.5% Cement
10% Cement
Figure 4.14: Effect of cement treatment on unconfined stress-strain behavior of
Everett soil for unsoaked samples.
0
500
1000
1500
2000
0 1 2 3 4 5 6
Strain (%)
Axi
al st
ress
(kPa
)
2.5% Cement
5% Cement
7.5% Cement
10% Cement
Figure 4.15: Effect of cement treatment on unconfined stress-strain behavior of Everett soil for soaked samples.
77
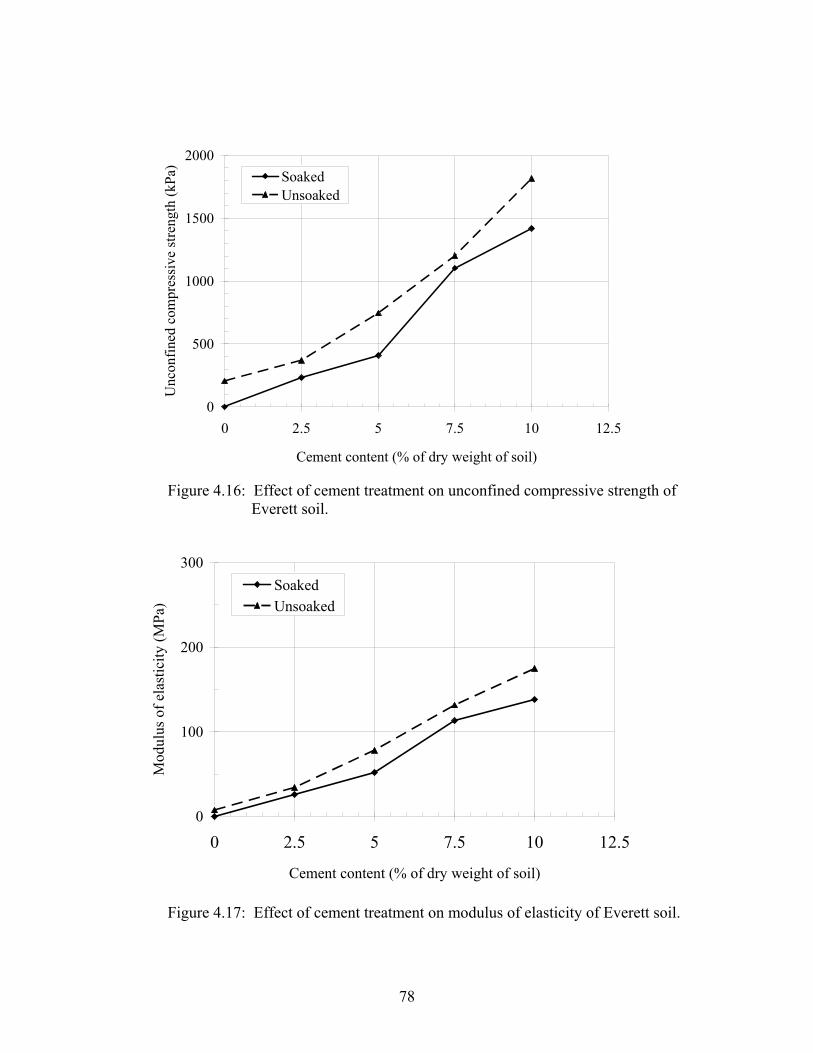
0
500
1000
1500
2000
0 2.5 5 7.5 10 12.5
Cement content (% of dry weight of soil)
Unc
onfin
ed c
ompr
essi
ve st
reng
th (k
Pa)
Soaked Unsoaked
Figure 4.16: Effect of cement treatment on unconfined compressive strength of Everett soil.
0
100
200
300
0 2.5 5 7.5 10 12.5
Cement content (% of dry weight of soil)
Mod
ulus
of e
last
icity
(MPa
)
Soaked Unsoaked
Figure 4.17: Effect of cement treatment on modulus of elasticity of Everett soil.
78

It can be observed that cement treatment resulted in significant increase in
unconfined compressive strength and modulus of elasticity. It is noted that, unsoaked
samples exhibited significant greater unconfined compressive strength compared with
soaked samples.
4.6.3 Palouse loess
The effect of cement treatment on unconfined stress-strain behavior of Palouse
loess for unsoaked and soaked samples are shown in Figures 4.18 and 4.19, respectively.
It is observed that, peak axial stress increased significantly due to cement treatment, but
corresponding strain to peak axial stress decreased from approximately 5% to slightly
greater than 1%. Thus, cement treated soils exhibited much more brittle behavior
compared with non-treated soils. As with the other soils, non-treated specimens of
Palouse loess disintegrated after being immersed in water.
The effect of cement treatment on unconfined compressive strength and modulus
of elasticity at strain corresponding to 30% of peak axial stress is shown in Figures 4.20
and 4.21, respectively. It can be observed that cement treatment resulted in significant
increase in unconfined compressive strength and modulus of elasticity of Palouse loess.
79

0
1000
2000
3000
4000
5000
6000
0 1 2 3 4 5 6
Strain (%)
Axi
al st
ress
(kPa
)
Non-treated2.5% Cement5% Cement7.5% Cement10% Cement
Figure 4.18: Effect of cement treatment on unconfined stress-strain behavior of
Palouse loess for unsoaked samples.
0
1000
2000
3000
4000
5000
6000
0 1 2 3 4 5 6
Strain (%)
Axi
al st
ress
(kPa
)
2.5% Cement
5% Cement
7.5% Cement 10% Cement
Figure 4.19: Effect of cement treatment on unconfined stress-strain behavior of Palouse loess for soaked samples.
80
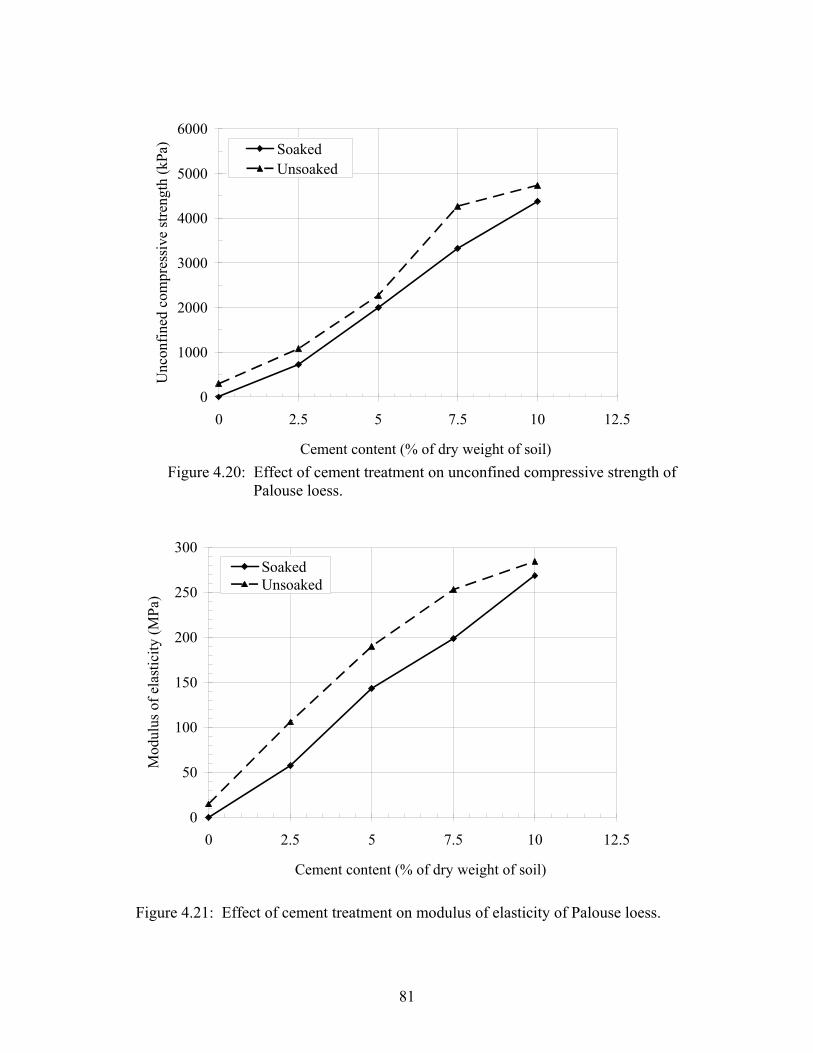
0
1000
2000
3000
4000
5000
6000
0 2.5 5 7.5 10 12.5
Cement content (% of dry weight of soil)
Unc
onfin
ed c
ompr
essi
ve st
reng
th (k
Pa) Soaked
Unsoaked
Figure 4.20: Effect of cement treatment on unconfined compressive strength of Palouse loess.
0
50
100
150
200
250
300
0 2.5 5 7.5 10 12.5
Cement content (% of dry weight of soil)
Mod
ulus
of e
last
icity
(MPa
)
Soaked Unsoaked Figure 4.21: Effect of cement treatment on modulus of elasticity of Palouse loess.
81

A summary of unconfined compressive strength and modulus of elasticity of the
soils, for unsoaked and soaked conditions, is given in Table 4.2. It can be seen that
addition of small percentages of cement led to significant improvement in unconfined
compressive strength of Palouse loess, whereas higher percentages of cement were
needed to improve Aberdeen and Everett soils. Note that Palouse loess and Aberdeen soil
had nearly the same grain size distribution yet their unconfined compressive strength
varied with cement addition. For comparison purposes, a summary of the variation of
mean unconfined compressive strength of different types of cement treated soils as
reported by Kasama et al. (2007) is presented in Table 4.3. It can be seen that in general
sandy and clay soils attained the maximum unconfined compressive strength (see also
Mitchell 1976). Since Everett soil is coarse-grained it was expected to exhibit higher
strength compared with Palouse and Aberdeen soils. However, this was not the case here.
Table 4.2: Summary of unconfined compressive strength and modulus of elasticity of non-treated and cement treated soils.
Unsoaked Soaked Unsoaked Soaked0 211.7 0 9.33 0
2.5 389.3 0 40 05 534.3 286.4 58 37
7.5 843.8 975 99 6510 1735.4 1818 145.1 1610 206.9 0 7.55 0
2.5 371.1 231.8 34.2 25.95 746.3 410.4 78.35 52
7.5 1202.3 1104 131.7 112.910 1816.6 1420.1 174.8 134.2
12.5 294.3 0 14.76 015 1077 719.1 105.9 57.1
17.5 2270.2 1997 190 143.320 4270.1 3328.3 253 198.3
22.5 4736.7 4383.1 284.2 268.2
Aberdeen
Modulus of elasticity (Mpa)
Everett
Palouse
Soils Cement content (%)
Unconfined compressive strength (kPa)
82

Table 4.3: Mean value of unconfined compressive strength
of different soils modified from Kasama et al. (2007).
1.584.77
Silt 1.92Clay 4.72Unknown 2.92
1.15Kanto laom 1.86Kuroboku 0.26Other 0.63
3.49Masado 10.74Peat 0.43Diatom soil 3.24
Unusual soil
Cohesive soil
Organic soil
Volcanic soil
Waste
Soil type Mean (Mpa)
GravelSandy soil
4.7 Consolidated-undrained triaxial
4.7.1 Aberdeen soil
Figures 4.22 to 4.27 show the deviator stress (q) and pore pressure versus axial
strain increment for non-treated and cement treated Aberdeen soil for different confining
pressures. It is observed that deviator stress increased with increasing in confining
pressure. The increase was significant with the addition of cement. The stress strain and
pore pressure response of non-treated soil is typical of ductile material behavior. This was
also reflected in the bulging of the specimens nearing failure (Figure 4.28). Addition of
5% cement resulted in the soils attaining a peak deviator stress at about 2% strain
increment and progressive softening afterwards. These cement treated specimens failed
83
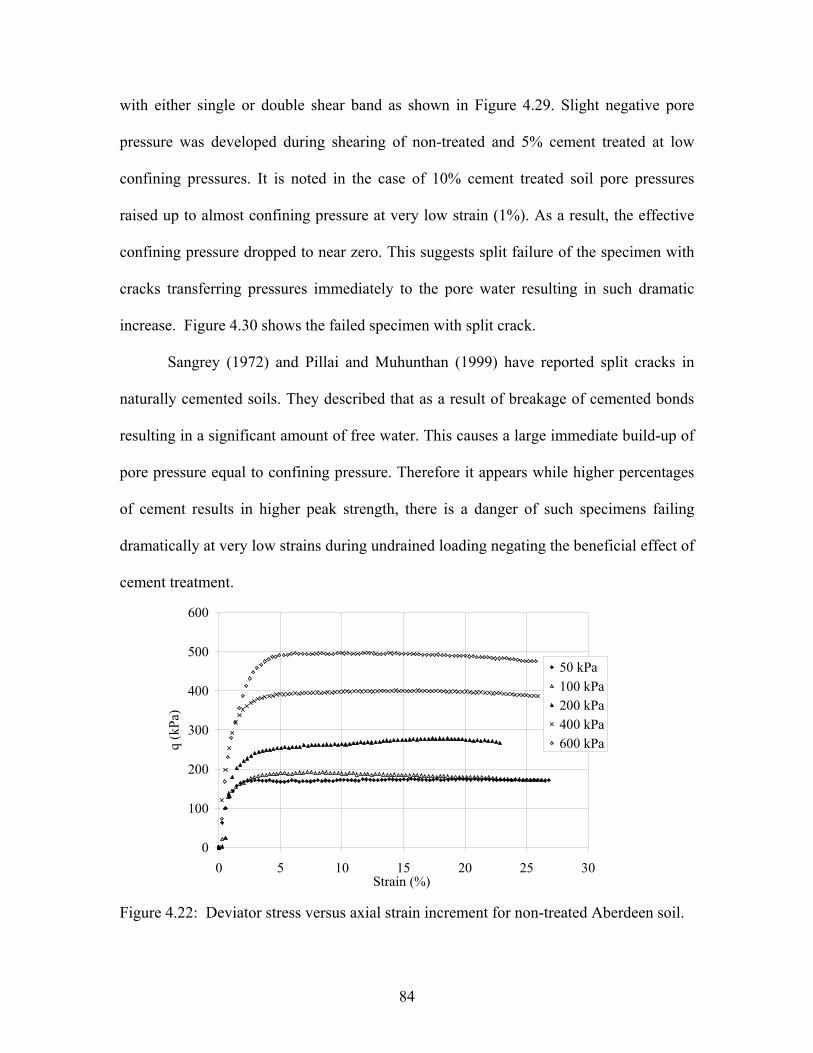
with either single or double shear band as shown in Figure 4.29. Slight negative pore
pressure was developed during shearing of non-treated and 5% cement treated at low
confining pressures. It is noted in the case of 10% cement treated soil pore pressures
raised up to almost confining pressure at very low strain (1%). As a result, the effective
confining pressure dropped to near zero. This suggests split failure of the specimen with
cracks transferring pressures immediately to the pore water resulting in such dramatic
increase. Figure 4.30 shows the failed specimen with split crack.
Sangrey (1972) and Pillai and Muhunthan (1999) have reported split cracks in
naturally cemented soils. They described that as a result of breakage of cemented bonds
resulting in a significant amount of free water. This causes a large immediate build-up of
pore pressure equal to confining pressure. Therefore it appears while higher percentages
of cement results in higher peak strength, there is a danger of such specimens failing
dramatically at very low strains during undrained loading negating the beneficial effect of
cement treatment.
0
100
200
300
400
500
600
0 5 10 15 20 25 30Strain (%)
q (k
Pa)
50 kPa100 kPa 200 kPa 400 kPa 600 kPa
Figure 4.22: Deviator stress versus axial strain increment for non-treated Aberdeen soil.
84

-100
0
100
200
300
400
5000 5 10 15 20 25 30
Strain (%)
Pore
pre
ssur
e (k
Pa)
50 kPa100 kPa200 kPa400 kPa600 kPa
0
200
0 5 10 15 20 25 30Strain (%)
q (k
Pa)
400
600
80050 kPa100 kPa200 kPa400 kPa600 kPa
Figure 4.23: Pore pressure versus axial strain increment for non-treated Aberdeen soil.
Figure 4.24: Deviator stress versus axial strain increment for 5% cement treated
Aberdeen soil.
85
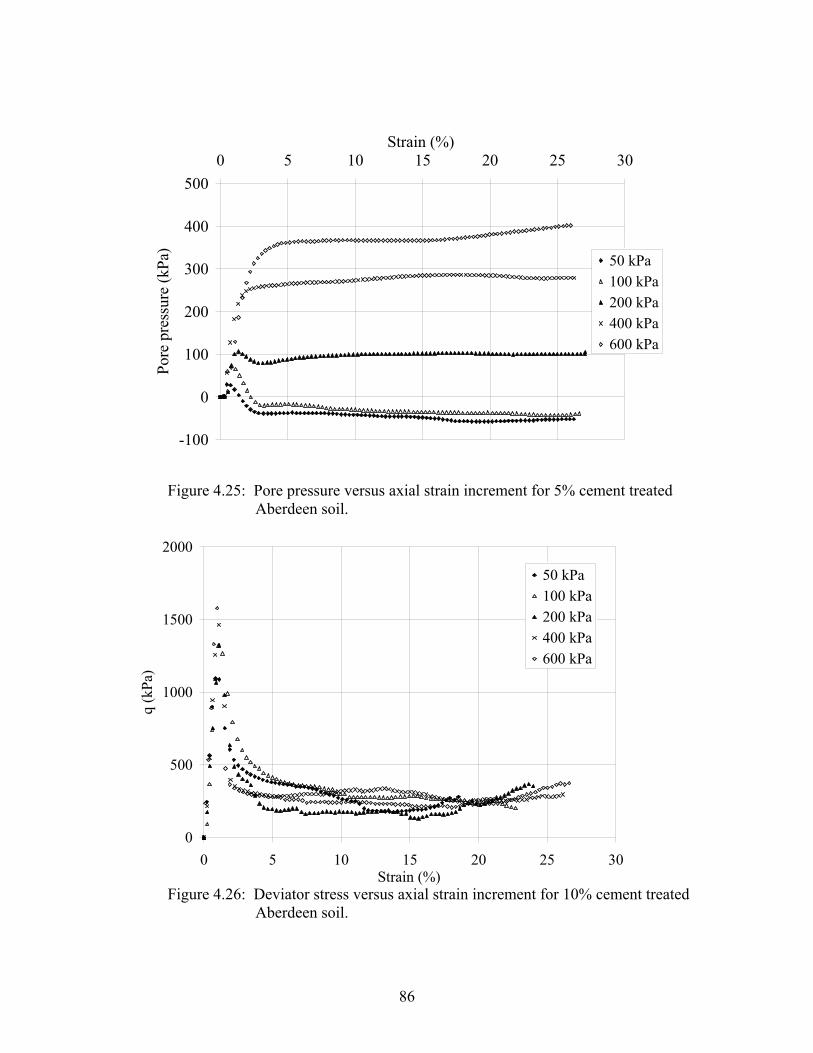
-100
0
100
200
300
400
500Po
re p
ress
ure
(kPa
)0 5 10 15 20 25 30
Strain (%)
50 kPa100 kPa200 kPa400 kPa600 kPa
Figure 4.25: Pore pressure versus axial strain increment for 5% cement treated Aberdeen soil.
0
500
1000
1500
2000
0 5 10 15 20 25 30Strain (%)
q (k
Pa)
50 kPa 100 kPa 200 kPa
400 kPa 600 kPa
Figure 4.26: Deviator stress versus axial strain increment for 10% cement treated Aberdeen soil.
86

0
200
400
600
800
0 5 10 15 20 25 30Strain (%)
Pore
pre
ssur
e (k
Pa)
50 kPa100 kPa200 kPa400 kPa600 Kpa
Figure 4.27: Pore pressure versus axial strain increment for 10% cement treated Aberdeen soil.
Figure 4.28: Ductile type of failure for non-treated Aberdeen soil.
87

Figure 4.29: Planar type of failure for 5% cement treated Aberdeen soil.
Figure 4.30: Splitting type of failure for 10% cement treated Aberdeen soil.
Figure 4.31 shows variation of peak deviator stress versus confining pressure for
non-treated, 5%, and 10% cement treated Aberdeen soil. It was observed that as
88

confining pressure increased peak deviator stress increased. In addition cement treatment
led to significant increase in peak deviator stress. However, as mentioned before use of
high percentages of cement may lead to dramatic drop in strength after attaining peak
values.
0
500
1000
0 200 400 600 800 1000
Confining pressure (kPa)
q (k
Pa)
1500
2000
Non-treated
5% Cement treated
10% Cement treated
Figure 4.31: Variation of peak deviator stress versus confining pressure for Aberdeen soil at different cement content.
The decrease in post peak deviator stress is due to inter-particle bond breakage
and can be quantified by brittleness index defined by Bishop (1971).
p
rpB q
qqI
−= (4.1)
Where, , , and are brittleness index, peak deviator stress, and residual deviator
stress, respectively. Figure 4.32 shows the variation of brittleness index versus confining
pressure for non-treated, 5%, and 10% Aberdeen soil. It can be observed that as a result
of cement treatment brittleness index increased significantly. It is also observed that for
non-treated and 10% cement treated soil brittleness index is relatively constant while for
BI pq rq
89

5% cement treated specimens brittleness index increased initially and decreased at higher
confining pressures.
0
0.2
0.4
0.6
0.8
1
0 200 400 600 800Confining pressure (kPa)
Brit
tlene
ss in
dex Non-treated
5% cement treated10% cement treated
Figure 4.32: Variation of brittleness index versus confining pressure for non-
treated, 5%, and 10% cement treated Aberdeen soil.
4.7.2 Everett soil
Figures 4.33 to 4.38 show the deviator stress (q) and pore pressure versus axial
strain increment for non-treated and cement treated Everett soil for different confining
pressures. It is observed that deviator stress increased with increasing in confining
pressure and also as cement content increased, deviator stress increased significantly.
Non-treated and 5% cement treated specimens displayed ductile type of failure at
lower confining pressures while brittle type of failure was observed at higher confining
pressures. This was opposite of expectation. For 5% cement treated development of
negative pore pressure was observed at lower confining pressures. For 10% cement
treated pore pressure raised up to almost confining pressure therefore effective confining
pressure at failure was near zero. As in the case of Aberdeen soil peak deviator stress was
90

approximately at 1% strain increment and splitting type of failure was observed, leading
to dramatic increase in pore pressure equal to confining pressure.
0
200
400
600
800
0 5 10 15 20 25 30
Strain (%)
q (k
Pa)
100 kPa200 kPa400 kPa600 kPa
Figure 4.33: Deviator stress versus axial strain increment for non-treated Everett soil.
0
200
400
600
0 5 10 15 20 25 30
Strain (%)
Pore
pre
ssur
e (k
Pa)
100 kPa 200 kPa 400 kPa 600 kPa Figure 4.34: Pore pressure versus axial strain increment for non-treated Everett
soil.
91

0
500
1000
1500
2000
0 5 10 15 20 25Strain (%)
q (k
Pa)
100 kPa200 kPa600 kPa
Figure 4.35: Deviator stress versus axial strain increment for 5% cement treated Everett soil.
-200
0
200
4000 5 10 15 20 25
Strain (%)
Pore
pre
ssur
e (k
Pa)
100 kPa 200 kPa
600 kPa
Figure 4.36: Pore pressure versus axial stress increment for 5% cement treated Everett soil.
92
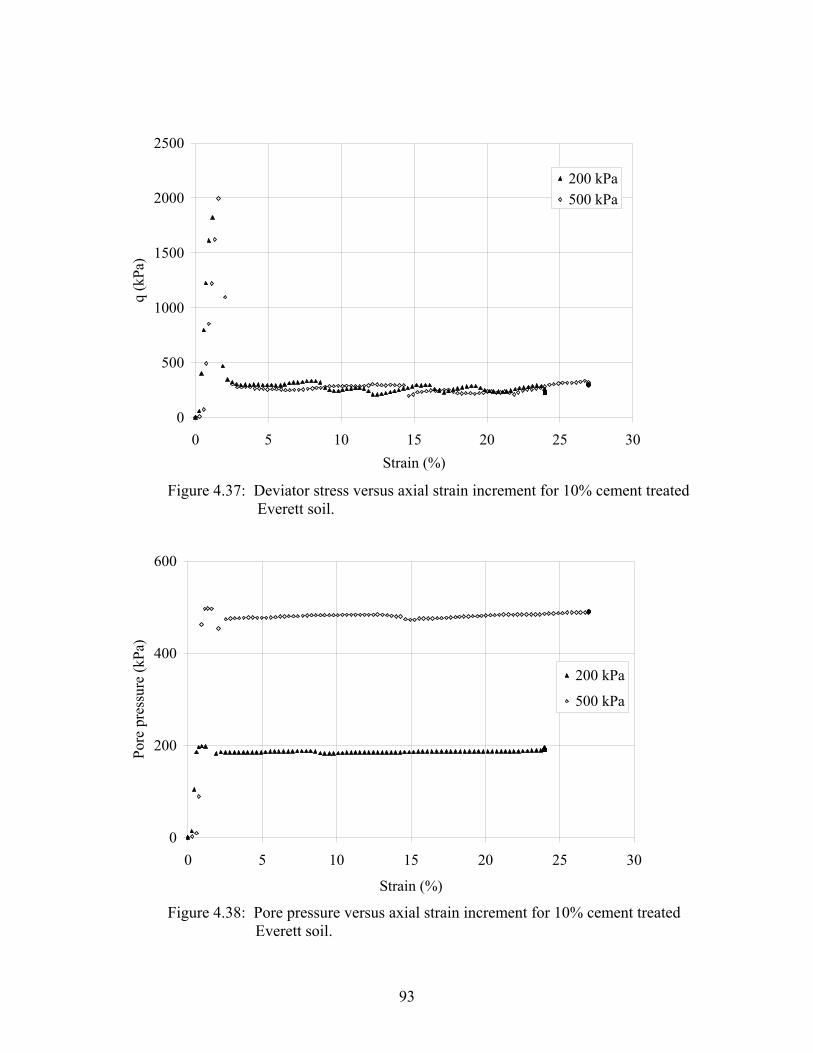
0
500
1000
1500
2000
2500
0 5 10 15 20 25 30Strain (%)
q (k
Pa)
200 kPa500 kPa
Figure 4.37: Deviator stress versus axial strain increment for 10% cement treated
Everett soil.
0
200
400
600
0 5 10 15 20 25 30
Strain (%)
Pore
pre
ssur
e (k
Pa)
200 kPa 500 kPa
Figure 4.38: Pore pressure versus axial strain increment for 10% cement treated Everett soil.
93

Variation of peak deviator stress versus confining pressure for Everett soil is
shown in Figures 4.39. It can be observed that as confining pressure increased peak
deviator stress increased. In addition cement treatment led to significant increase in peak
deviator stress.
Figure 4.40 shows variation of brittleness index versus confining pressure for
non-treated, 5%, and 10% cement treated Everett soil. It can be observed that for non-
treated and 5% cement treated specimens brittleness index increased with increasing in
confining pressure. It also can be seen that 10% cement treated soils exhibited much
higher brittleness index compared with non-treated and 5% cement treated soils.
0
1000
2000
3000
4000
5000
0 200 400 600 800 1000
Confining pressure (kPa)
q (k
Pa)
Non-treated
5% Cement treated
10% Cement treated
Figure 4.39: Variation of peak deviator stress versus confining pressure for Everett soil at different cement content.
94

0
0.2
0.4
0.6
0.8
1
0 200 400 600 800Confining pressure (kPa)
Brit
tlene
ss in
dex
Non-treated 5% cement treated10% cement treated
Figure 4.40: Variation of brittleness index versus confining pressure for non- treated, 5%, and 10% cement treated Everett soil.
Based on the undrained triaxial compression tests on host and cement treated
Aberdeen and Everett soils the following conclusion are drawn:
• Addition of cement resulted to a significant increase in peak deviator stress.
• As cement content increased strain corresponding to peak deviator stress
decreased remarkably.
• For 10% cement treated soils post peak deviator stress was drastically lower than
peak deviator stress.
• For 10% cement treated soils at the peak deviator stress pore pressure raised
almost equal to confining pressures. Therefore, effective confining pressures were
near zero.
95
• For both soils, generally, brittleness index increased with increasing in cement
content.
• Brittleness index for non-treated and 10% cement treated Aberdeen soil found to
be relatively constant respect with confining pressure.
• For 5% cement treated Aberdeen soil, brittleness index increased initially and
decreased at higher confining pressures.
• For non-treated and 5% cement treated Everett soil brittleness index increased
with increasing in confining pressure.
4.8 Oedometer
The compressibility of non-treated and cement treated Aberdeen soil as
determined by Oedometer test are shown in Figures 4.41 and 4.42. It is noted that for
cement treated soils the solid phase was split into soil and cement in calculating the void
ratio:
cementsoil
void
VVV
e+
= (4.2)
In addition the specific gravity of the cement is assumed to be 3.15. It can be seen
that cement treatment led to substantial reduction in compressibility. The results of values
of coefficient of volume change (mv), compression index (Cc), and swelling index (Cs)
are presented in Table 4.4. The reduction of compressibility of cement treated soils would
result in reduced settlements in the field.
96

0
2
4
6
8
1 10 100 1000Load (kPa)
Stra
in (%
)
Non-treated10% Cement treated5% Cement treated
Figure 4.41: Strain increment versus vertical pressure for non-treated and cement treated Aberdeen soil.
0.7
0.8
0.9
1
1.11 10 100 1000
Load (kPa)
Voi
d ra
tio, e
Non-treated 5% Cement treated 10% Cement Treated Figure 4.42: Void ratio versus vertical pressure for non-treated and cement treated Aberdeen soil.
97
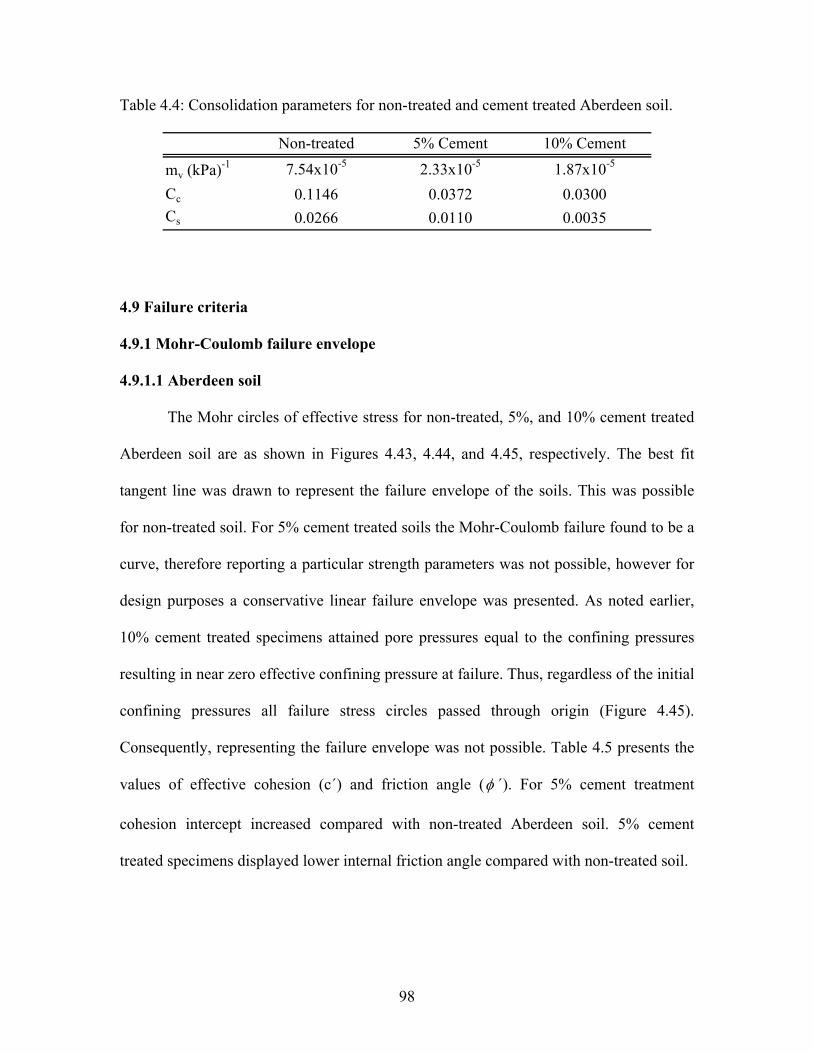
Table 4.4: Consolidation parameters for non-treated and cement treated Aberdeen soil.
mv (kPa)-1
Cc
Cs 0.0266
2.33x10⁻⁵ 1.87x10⁻⁵
0.0372 0.03000.0110 0.0035
5% Cement 10% Cement
7.54x10⁻⁵
0.1146
Non-treated 4.9 Failure criteria
4.9.1 Mohr-Coulomb failure envelope
4.9.1.1 Aberdeen soil
The Mohr circles of effective stress for non-treated, 5%, and 10% cement treated
Aberdeen soil are as shown in Figures 4.43, 4.44, and 4.45, respectively. The best fit
tangent line was drawn to represent the failure envelope of the soils. This was possible
for non-treated soil. For 5% cement treated soils the Mohr-Coulomb failure found to be a
curve, therefore reporting a particular strength parameters was not possible, however for
design purposes a conservative linear failure envelope was presented. As noted earlier,
10% cement treated specimens attained pore pressures equal to the confining pressures
resulting in near zero effective confining pressure at failure. Thus, regardless of the initial
confining pressures all failure stress circles passed through origin (Figure 4.45).
Consequently, representing the failure envelope was not possible. Table 4.5 presents the
values of effective cohesion (c΄) and friction angle (φ ΄). For 5% cement treatment
cohesion intercept increased compared with non-treated Aberdeen soil. 5% cement
treated specimens displayed lower internal friction angle compared with non-treated soil.
98

0 100 200 300 400 500 600 700 8000
100
200
300
400
Normal Stress (kPa)
She
ar S
tress
(kP
a)
0 100 200 300 400 500 600 700 8000
100
200
300
400
Normal Stress (kPa)
She
ar S
tress
(kP
a)
Figure 4.43: Mohr-Coulomb failure envelope for non-treated Aberdeen soil.
0 100 200 300 400 500 600 700 800 900 10000
100
200
300
400
Normal Stress (kPa)
She
ar S
tress
(kP
a)
0 100 200 300 400 500 600 700 800 900 10000
100
200
300
400
Normal Stress (kPa)
She
ar S
tress
(kP
a)
Figure 4.44: Mohr-Coulomb failure envelope for 5% cement treated Aberdeen. soil 1000
0 200 400 600 800 1000 1200 1400 1600 18000
200
400
600
800
Normal Stress (kPa)
She
ar S
tress
(kP
a)
Figure 4.45: Mohr circles for 10% cement treated Aberdeen soil.
99

Table 4.5: Effective shear strength parameters of non-treated and cement treated soil based on Mohr-Coulomb failure criterion.
c' (kPa)φ' ˚
50 10029 29 35
Non-treated 5% Cement treatedAberdeen Everett
Non-treated 5% Cement treated3334
60
4.9.1.2 Everett soil
Figures 4.46 to 4.48 show effective Mohr circles stress for non-treated, 5%, and
10% cement treated Everett soil, respectively. The best fit tangent line was drawn to
represent the failure envelope of the soils. However, 10% cement treated soils behaved
similar to 10% cement treated Aberdeen soil therefore drawing a line to represents failure
envelope was not possible. For 5% cement treated cohesion intercept and friction angle
increased (Table 4.5). It is evident from the above discussion use of Mohr-Coulomb
failure criterion is not useful to describe shear strength of 10% cement treated Aberdeen
and Everett soils.
0 100 200 300 400 500 600 700 800 900 10000
100
200
300
400
Normal Stress (kPa)
She
ar S
tress
(kP
a)
0 100 200 300 400 500 600 700 800 900 10000
100
200
300
400
Normal Stress (kPa)
She
ar S
tress
(kP
a)
Figure 4.46: Mohr-Coulomb failure envelope for non treated Everett soil.
100

1000
0 200 400 600 800 1000 1200 1400 1600 1800 2000 2200 24000
200
400
600
800
Normal Stress (kPa)
She
ar S
tress
(kP
a)
1000
0 200 400 600 800 1000 1200 1400 1600 1800 2000 2200 24000
200
400
600
800
Normal Stress (kPa)
She
ar S
tress
(kP
a)
Figure 4.47: Mohr-Coulomb failure envelope for 5% cement treated Everett soil.
1200
0 200 400 600 800 1000 1200 1400 1600 1800 2000 2200
200
400
600
800
1000
Normal Stress (kPa)
She
ar S
tress
(kP
a)
Figure 4.48: Mohr circles for 10% cement treated Everett soil.
4.9.2 Griffith and modified Griffith crack theory
4.9.2.1 Aberdeen soil
The measured shear stress values for non-treated, 5%, and 10% cement treated
Aberdeen soil are as shown in Figure 4.49, 4.50, and 4.51, respectively. On the same
plots values of failure shear strength predicted by Griffith (Equation 2.10) and Modified
101
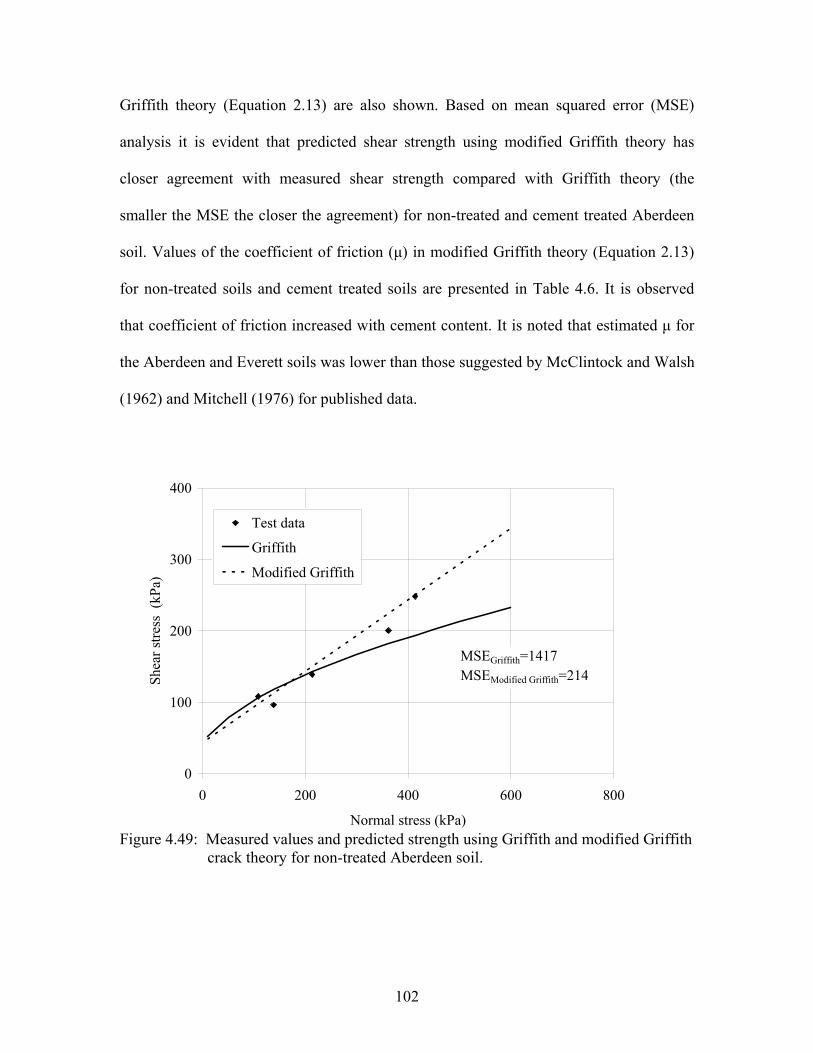
Griffith theory (Equation 2.13) are also shown. Based on mean squared error (MSE)
analysis it is evident that predicted shear strength using modified Griffith theory has
closer agreement with measured shear strength compared with Griffith theory (the
smaller the MSE the closer the agreement) for non-treated and cement treated Aberdeen
soil. Values of the coefficient of friction (μ) in modified Griffith theory (Equation 2.13)
for non-treated soils and cement treated soils are presented in Table 4.6. It is observed
that coefficient of friction increased with cement content. It is noted that estimated μ for
the Aberdeen and Everett soils was lower than those suggested by McClintock and Walsh
(1962) and Mitchell (1976) for published data.
0
100
200
300
400
0 200 400 600 800
Normal stress (kPa)
Shea
r stre
ss (
kPa)
Test data
Griffith
Modified Griffith
MSEGriffith=1417MSEModified Griffith=214
Figure 4.49: Measured values and predicted strength using Griffith and modified Griffith crack theory for non-treated Aberdeen soil.
102

0
200
400
600
0 200 400 600 800
Normal stress (kPa)
Shea
r stre
ss (
kPa)
Test data
Griffith
Modified Griffith
MSEGriffith=595MSEModified Griffith=209
Figure 4.50: Measured values and predicted strength using Griffith and modified Griffith crack theory for 5% cement treated Aberdeen soil.
0
200
400
600
800
1000
0 200 400 600 800 1000
Normal stress (kPa)
Shea
r stre
ss (
kPa)
Test data
Griffith
Modified Griffith
MSEGriffith=5018MSEModified Griffith=931.3
Figure 4.51: Measured values and predicted strength using Griffith and modified Griffith crack theory for 10% cement treated Aberdeen soil.
103

Table 4.6: Values of μ for Aberdeen and Everett soil at different cement content. Non-treated 5% Cement 10% Cement
Aberdeen 0.50 0.50 0.65Everett 0.50 0.54 0.65
4.9.2.2 Everett soil
The measured shear stress values for non-treated, 5%, and 10% cement treated
Everett soil are as shown in Figure 4.52, 4.53, and 4.54, respectively. On the same plots
values of failure shear strength predicted by Griffith (Equation 2.10) and Modified
Griffith theory (Equation 2.13) are also shown. Based on MSE analysis it can be seen that
for non-treated and cement treated Everett soil Griffith and modified Griffith is more
applicable, respectively. It is noted that coefficient of friction (μ) increased with cement
content (Table 4.6).
0
100
200
300
400
0 200 400 600 800
Normal stress (kPa)
Shea
r stre
ss (
kPa)
Test data Griffith
Modified Griffith
MSEGriffith=851MSEModified Griffith=2126
Figure 4.52: Measured values and predicted strength using Griffith and modified Griffith crack theory for non-treated Everett soil.
104

0
200
400
600
800
1000
0 500 1000 1500 2000
Normal stress (kPa)
Shea
r stre
ss (
kPa)
Test data
Griffith
Modified Griffith
MSEGriffith=18511MSEModified Griffith=472.2
Figure 4.53: Measured values and predicted strength using Griffith and modified Griffith crack theory for 5% cement treated Everett soil.
0
500
1000
1500
0 500 1000 1500 2000Normal stress (kPa)
Shea
r stre
ss (
kPa)
Test data
GriffithModified Griffith
MSEGriffith=5800.8MSEModified Griffith=1027
Figure 4.54: Measured values and predicted strength using Griffith and modified Griffith crack theory for 10% cement treated Everett soil.
105

4.9.3 Johnston failure criterion
4.9.3.1 Aberdeen soil
The comparison of measured and predicted normalized principal stresses values at
failure for non-treated and 5% cement treated soils using Johnston criterion (Equation
2.16) are as shown in Figures 4.55 and 4.56. The B and M values of the criterion were
obtained from Equations 2.18 and 2.20, respectively. The S value was determined by trial
and error method to obtain the lowest MSE value. It is observed that Johnston method is
applicable to predict normalized principal stresses for non-treated and 5% cement treated
Aberdeen soil. In case of 10% cement treatment, as a result of zero effective confining
pressure at failure Johnston criterion is not applicable (normalized minor stress falls on
σ1N axis).
0
2
4
6
0 0.5 1 1.5 2σ3N
σ 1N
Test data
Johnston
M=2.99B=0.91S=0.50
MSE=0.045
Figure 4.55: Comparison between measured and predicted normalized principal stresses at failure for non-treated Aberdeen soil using Johnston criterion.
106

0
2
4
6
0 0.5 1 1.5 2σ3N
σ 1N
Test dataJohnston
M=3.24B=0.88S=0.40
MSE=0.015
Figure 4.56: Comparison between measured and predicted normalized principle stresses at failure for 5% cement treated Aberdeen soil using Johnston criterion.
4.9.3.2 Everett soil
The comparison of measured and predicted normalized principal stress values at
failure for non-treated and 5% cement treated Everett soil using Johnston criterion
(Equation 2.16) are as shown in Figures 4.57 and 4.58. The B value was obtained from
Equation 2.18 and M value was determined from Equations 2.20 and 2.21 for non-treated
and 5% cement treated Everett soil, respectively. The S value was determined by trial and
error method to obtain the lowest MSE value, it must be noted S value for 5% cement
treated soils was significantly higher than that for non-treated Everett soil. It is observed
that Johnston method is applicable to predict normalized principal stresses for non-treated
107

and 5% cement treated Aberdeen soil. In case of 10% cement treatment similar to
Aberdeen soil Johnston criterion is not applicable.
0
2
4
6
8
0 1 2 3σ3N
σ 1N
Test dataJohnston
M=3.52B=0.91S=0.40
MSE=0.521 Figure 4.57: Comparison between measured and predicted normalized principle stresses at failure for non-treated Everett soil using Johnston criterion.
0
2
4
6
8
0 1 2 3
σ3N
σ 1N
Test data
Johnston
M=3.77B=0.87S=0.75
MSE=0.04 Figure 4.58: Comparison between measured and predicted normalized principle stresses at failure for 5% cement treated Everett soil using Johnston criterion
108
CHAPTER FIVE
CRITICAL STATE FRAMEWORK AND MECHANICAL BEHAVIOR OF
CEMENT TREATED SOILS
5.1 Introduction
Soil strength is considered to be a unique function of cohesion and friction angle
in using the Mohr-Coulomb failure criterion. However, as discussed in Chapter Two,
critical state soil mechanics suggested that the strength of soils (be it sand, silt, or clay) is
governed by the critical state friction and inter-particle locking. Further, depending on the
combinations of void ratio and effective confining pressure, soil behavior changes its
characteristics from brittle to faulting to ductile. Different criteria are needed to quantify
such behavior in these different regions. The critical state framework has been used to
describe these different characteristics successfully for clays and sand in the past. The
framework is examined here to highlight its feasibility to quantify the behavior of cement
treated soils. The description is limited to the case of Aberdeen soil.
5.2 Critical state parameters
Critical state soil parameters for non-treated and cement treated Aberdeen soil
were determined from laboratory test results. The critical state parameters λ and κ were
determined by (Wood 1990):
303.2cC
=λ (5.1)
303.2
sC=κ (5.2)
109

where Cc and Cs are the compression and swelling index obtained, from Oedometer test
respectively. The parameters N and Г were found by constructing V-ln p΄ plots from
triaxial test data. The critical state friction parameter M was obtained by plotting triaxial
test results in q-p΄ space (Figures 5.1 to 5.3). A summary of the critical state parameters
for non-treated and cement treated Aberdeen soil are given in Table 5.1. Note that N and
Г are usually used in critical state numerical models. They are reported here for
completeness only and are not used in following discussions.
Table 5.1: Critical state parameters for non-treated and cement treated Aberdeen soil.
λ 0.0498 0.0162 0.0130κ 0.0116 0.0048 0.0015N 1.8886 2.0680 2.0793Г 1.8504 2.0566 2.0678M 1.40 1.40
5% Cement treated
Non-treated 10% Cement treated
Critical state parameter
5.3 Effect of cement treatment on stress path
Plots of deviator stress (q) versus effective confining stress (p΄) for non-treated,
5% and 10% cement treated Aberdeen soil are shown in Figures 5.1, 5.2, and 5.3,
respectively. It can be observed that for both non-treated and 5% cement treated soils the
effective stress paths of specimens consolidated at lower stresses rise up above the
critical state line to reach a constant stress ratio defined by the Hvorslev surface
(Muhunthan and Schofield 2000). Thereafter, these materials progressively degrade and
tend toward the critical state with slope M =1.40. On the other hand, 10% cement treated
soil specimens attain a much higher constant ratio with a slope equal to 3 (i.e. ) '3pq =
110

line. This slope corresponds to the surface on which soil is prone to develop tensile
cracks (Muhunthan and Schofield 2000). Indeed as reported earlier these specimens were
observed to fail with split cracks (Figure 4.30).
q = 1.40 p'
0
200
400
600
800
0 200 400 600 800
p' (kPa)
q (k
Pa)
50 kPa100 kPa200 kPa400 kPa600 kPa
p'cs
cs
Figure 5.1: Undrained stress path for non-treated Aberdeen soil.
q = 1.40 p'
0
200
400
600
800
1000
0 200 400 600 800 1000
p' (kPa)
q (k
Pa)
50 kPa
100 kPa
200 kPa
400 kPa
600 kPa
p'cs
cs
Figure 5.2: Undrained stress path for 5% cement treated Aberdeen soil.
111

q = 1.40 p'
0
500
1000
1500
2000
0 200 400 600 800 1000p' (kPa)
q (k
Pa)
50 kPa 100 kPa 200 kPa 400 kPa
600 kPa
Figure 5.3: Undrained stress path for 10% cement treated Aberdeen soil. The region between the Hvorslev surface and the critical state surface could be
considered as a measure of the amount of interlocking associated with a specimen. A
comparison of these regions in Figures 5.1 and 5.2 show that addition of cement leads to
increase in interlocking. The intersection of Hvorslev and the critical state surfaces is the
critical state of these specimens. The corresponding pressure at this state is the critical
confining pressure. It is seen that addition of cement leads to an increase in the value of
the critical pressure meaning the brittle to ductile transition will occur at higher pressures.
The unique undrained stress path of cemented soil observed in the case of 10%
cement treated soils (Figure 5.3) is the result of failure of cemented bonding and is
independent from general effective stress patterns (Sangrey 1972; Pillai and Muhunthan
1999). In addition, cemented soils (naturally or artificially) exhibit anisotropic behavior
112

3
M
p΄
q
A
B
C
Ko line
O D
3
M
p΄
q
A
B
C
Ko line
O D
=
(Wong and Mitchell 1975; Rotta et al. 2003). Schematic illustration of undrained stress
path for cemented soils is shown in Figure 5.4. This is slightly different from the
conceptual model presented by Pillai and Muhunthan (1999). Based on their observation
of slope failures in natural cemented soils in Eastern Canada, they assumed that the point
C is on or very close to critical state line whereas the results of the present study and that
by Sangrey (1972) show that the undrained stress path may continue and end up on point
B which is on the fracture line q . At point B, as a result of failure of cemented
bonding pore pressure increases to confining pressure, consequently effective confining
pressure drops to zero and specimen splits vertically (Figure 4.30).
'3p
Schofield (1980) divided behavior of remolded soils into fold (ODC), fault
(OAC), and fracture (between q axis and OB) zones (Figure 5.4). It is seen that highly
cement treated soils extend the limit of the fracture region from point A to B. It must be
noted for 10% cement treated Aberdeen soil, it was observed that point B corresponds to
1% strain (Figure 4.26).
Figure 5.4: Schematic illustration of undrained stress path for highly cemented soils.
113

5.4 Plastic energy dissipation and yield surface
Researchers have proposed a number of ways to define the yield surface of soils
and subsequently the shape of the effective stress path. The family of yield surface
developed based on plastic energy dissipation as was done in the case of cam clay
(Roscoe et al. 1963) and modified cam clay (Roscoe and Burland 1968) models are prime
examples of this approach. These basic formulations did not account for development of
anisotropy.
In order to incorporate the effects of anisotropy within the family of critical state
models, Muhunthan and Masad (1997) have proposed a modification to the plastic energy
dissipation equation with an anisotropic parameter (α):
22 )()('' qqvqv Mpqp δεαδεδεδεδε ++=+ (5.7)
where vδε and qδε are the plastic volumetric and shear strain increments, respectively.
M is the friction constant from soil and ' is the mean effective pressure. A detailed
description of the fabric parameter and its mathematical formulation are presented in
Muhunthan et al (1996). Similar energy dissipation formulations for modeling soil
behavior have been used by Dafalias (1987) and Collins and Kelly (2002).
Rearrangement of Equation 5.7 and application of the normality, and integration results
in the anisotropy yield function as:
p
⎥⎦
⎤⎢⎣
⎡−+−+
= 22
22
)()(
αηαη
MM
pp in
o
(5.8)
Where inη is the initial value of 'pq and is the value of whenop 'p inηη = . If 0=α
Equation 5.8 reduces to the modified cam clay yield function (Roscoe and Burland 1968).
114

The general shape of the anisotropic yield surface consists of a rotated and distorted
ellipse. The effective state path surface can be obtained by combining the yield function
and volumetric behavior (Muhunthan et al. 1996):
λκλ
αηαη
−
⎥⎦
⎤⎢⎣
⎡−+−+
= 22
22
)()(
MM
pp in
o
(5.9)
The comparison between observed and predicted stress path using modified cam
clay and the model presented by Muhunthan and Masad (1997) for non-treated and 5%
cement treated Aberdeen soil are shown in Figures 5.5 and 5.6, respectively. It can be
seen that the model presented by Muhunthan and Masad (1997) captures the stress path
for non-treated and 5% cement treated specimens well. Since compaction of specimens
inside the mold induces anisotropy use of the anisotropic parameter becomes necessary to
capture the behavior. Appropriate values of inη andα were found by fitting Equation 5.9
on observed undrained stress paths of specimens. For both specimens inη found to be 0.2
and α found to be 0.3 and 0.4 for non-treated and 5% cement treated specimens,
respectively. It is evident that the addition of cement resulted in an increase in fabric
parameter (α ). However, further investigation needs to be conducted to find the more
accurate relationship between cement content and fabric parameter.
It is evident that none of the models capture the behavior above the critical state
line in the region of the Hvorslev state. It is proposed to model the behavior in this region
using the different Griffith criteria discussed in the previous chapters.
115
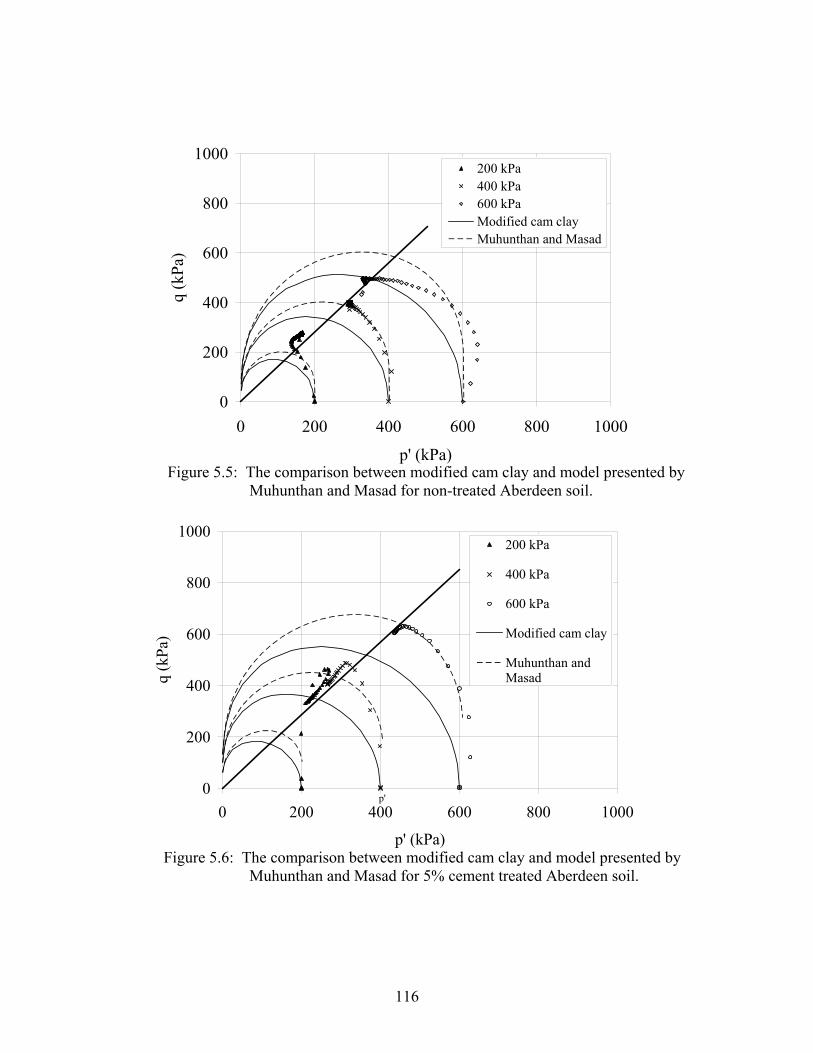
0
200
400
600
800
1000
0 200 400 600 800 1000
p' (kPa)
q (k
Pa)
200 kPa400 kPa600 kPaModified cam clayMuhunthan and Masad
Figure 5.5: The comparison between modified cam clay and model presented by
Muhunthan and Masad for non-treated Aberdeen soil.
0
200
400
600
800
1000
0 200 400 600 800 1000
p' (kPa)
q (k
Pa)
200 kPa
400 kPa 600 kPa
Modified cam clay
Muhunthan andMasad
p'
Figure 5.6: The comparison between modified cam clay and model presented by Muhunthan and Masad for 5% cement treated Aberdeen soil.
116

5.5 Brittle behavior in q-p΄ space
The extended Griffith criterion (Equation 2.14) for triaxial compression test (σ΄2=
σ΄3) in terms of q and p΄ becomes:
) (5.10) 3(12 '2 pq tσ−=
In addition, modified Griffith criterion (Equation 2.11) for triaxial compression test
becomes:
31
4'22 μμ
σμ
−+
+= tp
q (5.11)
The complete derivation of the above form is presented in Sariosseiri (2008).
It can be seen that extended Griffith theory curve requires only the knowledge of
unconfined compressive strength whereas modified Griffith theory requires knowledge of
both unconfined compressive strength and coefficient of friction (μ). The predicted
values of these criteria for soil are as shown in Figure 5.7. Note that, for extended Griffith
theory σt was found to be -1/14 of unconfined compressive strength, while for modified
Griffith theory σt found to be -1/10 of unconfined compressive strength. The latter value
is the same as suggested by McClintock and Walsh (1962). In addition μ was found to be
0.5. Since both criteria predict the shear strength values well, it is preferred to use
extended Griffith criterion as it only needs knowledge of unconfined compressive
strength.
Therefore, based on the test results conducted in this study it is suggested to use a
combination of Muhunthan and Masad (1997) and the extended Griffith criterion to
predict the behavior of cement treated soils. In this hybrid model, for confining pressures
lower than p΄A (confining pressure corresponds to point A at which extended Griffith line
117

and critical state line intercept) stress path raises to extended Griffith line then falls on
critical state line. For confining pressures greater than p΄A stress path ends on critical state
line. The location of point A can be determined by knowledge of unconfined compressive
strength and M.
0
200
400
600
800
1000
0 200 400 600 800 1000
p' (kPa)
q (k
Pa)
Critical state
ExtendedGriffith ModifiedGriffith
Figure 5.7: Extended and modified Griffith theory for 5% cement treated
Aberdeen soil.
Extended Griffith
Critical state
p' (kPa)
q (k
Pa)
Undrained stress path
A
p'A
Muhunthan and Masad (1997)
Figure 5.8: Schematic plot of stress path for cement treated soils.
118
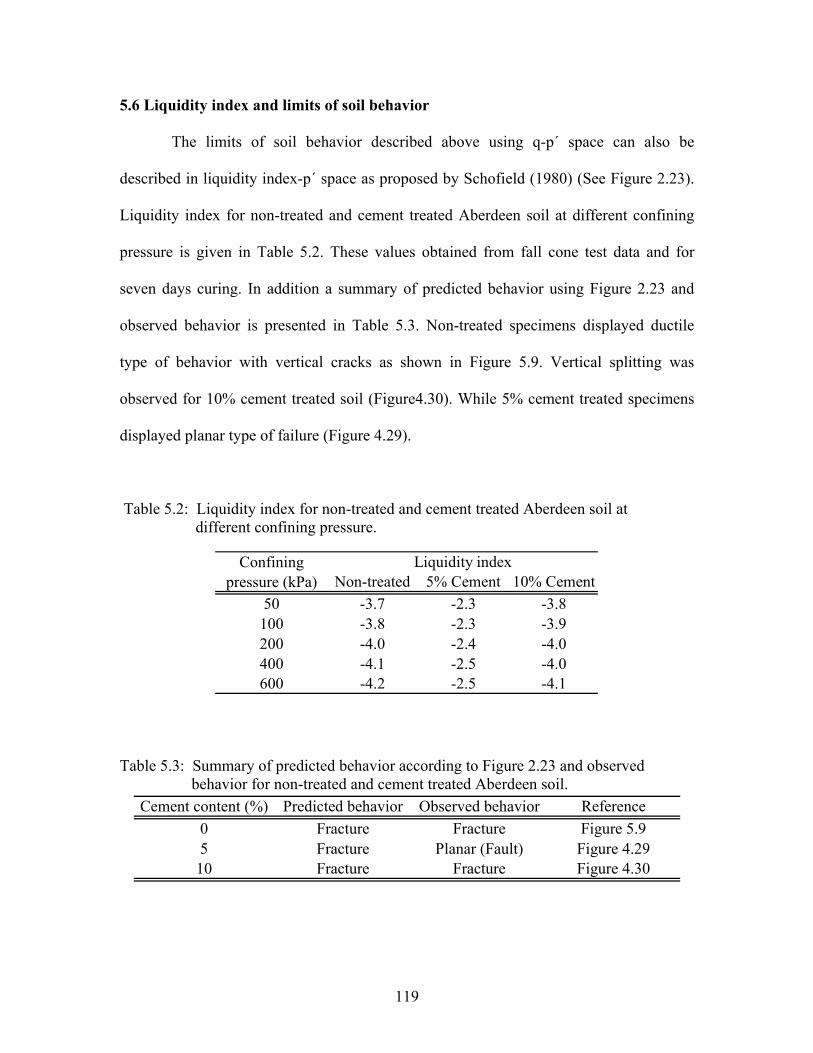
5.6 Liquidity index and limits of soil behavior
The limits of soil behavior described above using q-p΄ space can also be
described in liquidity index-p΄ space as proposed by Schofield (1980) (See Figure 2.23).
Liquidity index for non-treated and cement treated Aberdeen soil at different confining
pressure is given in Table 5.2. These values obtained from fall cone test data and for
seven days curing. In addition a summary of predicted behavior using Figure 2.23 and
observed behavior is presented in Table 5.3. Non-treated specimens displayed ductile
type of behavior with vertical cracks as shown in Figure 5.9. Vertical splitting was
observed for 10% cement treated soil (Figure4.30). While 5% cement treated specimens
displayed planar type of failure (Figure 4.29).
Table 5.2: Liquidity index for non-treated and cement treated Aberdeen soil at different confining pressure.
Non-treated 5% Cement 10% Cement
50 -3.7 -2.3 -3.8100 -3.8 -2.3 -3.9200 -4.0 -2.4 -4.0400 -4.1 -2.5 -4.0600 -4.2 -2.5 -4.1
Liquidity indexConfining pressure (kPa)
Table 5.3: Summary of predicted behavior according to Figure 2.23 and observed behavior for non-treated and cement treated Aberdeen soil.
ReferenceFigure 5.9
Figure 4.29Figure 4.30
FractureFractureFracture
Planar (Fault)Fracture
05
10
FractureCement content (%) Predicted behavior Observed behavior
119

Figure 5.9: Ductile type of failure with vertical crack for non-treated Aberdeen soil.
For non-treated and 10% cement treated specimens, as it was predicted, fracture
behavior was observed. In case of 5% cement treatment also fracture behavior was
predicted but planar (fault) behavior was observed. It is concluded that, as a result of
cement treatment rupture zone in Figure 2.23 was widened. However, further study is
required to be able generalize the latter for different type of soils.
120

CHAPTER SIX
CONCLUSIONS
6.1 Introduction
This study made a comprehensive examination of the effectiveness of cement
treatment on geotechnical properties of soils encountered in Washington State. The
results of the study provides details on the compaction, strength and deformation
characteristics of in situ soils as well as those mixed with different percentages of
cement.
Three soils from Aberdeen and Everett in western and Palouse area in eastern part
of the state were collected. Series of soil mechanics laboratory tests including grain size
analysis, Atterberg limits, solidification, standard proctor, unconfined compressive
strength, consolidated-undrained triaxial, and oedometer on host soils as well as cement
treated soils were performed. The strength and deformation characteristics were
examined in detail using several classical failure criteria such as Mohr-Coulomb, Griffith
crack theory, modified Griffith crack theory, and a recent criterion by Johnston proposed
for soft rocks. None of these criteria accounted for the combined effects of density and
confining pressure on soil behavior.
The study made use of the critical state framework to interpret the strength and
deformation behavior of non-treated and cement treated Aberdeen soil. This framework
explicitly accounts for the combined effects of density and pressure and as such provided
some significant insight into the different types of observed soil behavior. A new
anisotropic critical state model proposed by Masad and Muhunthan (1997) was found to
be able to predict the effective stress path of compacted Aberdeen soil (non-treated and
121
5% cement treated) in wet side of the critical state line. It was also found that extended
Griffith theory is applicable to identify the Hvorslev’s surface in q-p΄ space. Thus, it is
necessary to use a combination of the two formulations to describe the behavior of
cement treated soils.
6.2 Observations
Based on the results of the study the followings were observed:
• Cement treatment led to significant increase in initial drying rate of the soils
(Figures 4.2, 4.3, and 4.4).
• Generally, drying rate increased with increasing in cement content (Figures
4.2, 4.3, and 4.4).
• For Aberdeen and Palouse soil, addition of cement increased plasticity index
initially, while higher percentages of cement led to reduction in plasticity
index (Figures 4.5 and 4.6).
• Generally, as cement content increased, optimum water content increased and
maximum dry density decreased (Figures 4.7 and 4.8).
• Addition of cement led to significant increase in unconfined compressive
strength and modulus of elasticity of specimens (Figures 4.9, 4.10 and 4.12 to
4.21).
• Non-treated specimens disintegrated after being immersed in water. This was
also the case for 2.5% cement treated Aberdeen soil (Figure 4.11).
• Addition of cement resulted in a significant increase in peak deviator stress
(Figures 4.22, 4.24, 4.26, 4.33, 4.35, and 4.37).
122

• As cement content increased strain corresponding to peak deviator stress
decreased remarkably (Comparison of Figures 4.22, 4.24, and 4.26 and
comparison of 4.33, 4.35, and 4.37) .
• For non-treated and 5% cement treated Aberdeen and 5% cement-treated
Everett soils, at low confining pressures, negative pore pressures developed
(Figures 4.23, 4.25, and 4.36).
• For 10% cement treated soils post peak deviator stress was drastically lower
than peak deviator stress (Figures 4.26 and 4.37).
• For 10% cement treated soils at the peak deviator stress pore pressure raised
to near confining pressures. Therefore effective confining pressures were near
zero at failure (Figures 4.27 and 4.38).
• Non-treated, 5%, and 10% cement treated soils displayed ductile, planar, and
splitting type of failure, respectively in triaxial test (Figures 4.28, 4.29, and
4.30) depending on the confining stress.
• Generally, brittleness index increased with increasing in cement content
(Figures 4.32 and 4.40).
• Brittleness index for non-treated and 10% cement treated Aberdeen soil found
to be relatively constant respect with confining pressure (Figure 4.32).
• For 5% cement treated Aberdeen soil brittleness index increased initially and
decreased at higher confining pressures (Figure 4.32).
• For non-treated and 5% cement treated Everett soil brittleness index increased
with increasing in confining pressure (Figure 4.40).
123

• As a result of cement treatment, coefficient of volume change, compression
index, swelling index decreased significantly. In addition these values
decreased with increasing in cement content (Figures 4.41 and 4.42 and Table
4.4).
• Cement treatment led to increasing in cohesion intercept (Comparison of
Figures 4.43 and 4.44, and comparison of Figures 4.46 and 4.47).
• As a result of addition of cement internal friction angle (φ΄) of Everett soil
increased (Comparison of Figures 4.46 and 4.47).
• Failure envelope for 5% cement treated Aberdeen soil found to be curved;
therefore reporting particular strength parameters were not possible. However
for design purposes conservative strength parameters were presented (Figure
4.44).
• Soils (Aberdeen and Everett) treated with 10% cement developed pore
pressures equal to confining pressures reducing the effective confining
pressures to zero at failure. Thus, all Mohr circles passed through origin;
consequently, drawing a single line to represent Mohr-Coulomb failure was
not possible (Figures 4.45 and 4.48).
• Based on mean squared error (MSE) analysis modified Griffith theory was
more applicable compared with Griffith theory to predict the shear strength of
non-treated and cement treated Aberdeen soil within confining pressures
ranging from 0 to 600 kPa (Figures 4.49 to 4.51).
• Based on MSE analysis shear strength of non-treated Everett soil could be
predicted using Griffith theory whereas shear strength of cement treated
124

specimens could be predicted using Modified Griffith theory within confining
pressures ranging from 0 to 600 kPa (Figures 4.52 to 4.54).
• Coefficient of friction (μ) increased with increasing in cement content (Table
4.6).
• Johnston failure criterion accurately predicted normalized principal stresses of
non-treated and 5% cement treated Aberdeen and Everett soils within
confining pressures ranging from 0 to 600 kPa (Figures 4.55 to 58).
• Johnston criterion was not applicable for 10% cement treated Aberdeen and
Everett soils due to zero effective confining pressure at failure.
• As a result of cement treatment interlocking between particles increased while
critical state friction remained constant (Figures 5.1 and 5.2).
• Interlocking between particles decreased with increasing confining pressure
(Figures 5.1 and 5.2).
• As a result of cement treatment critical state confining pressure (confining
pressure correspond to point at which Hvorslev’s surface and critical state line
intercept) increased (Figures 5.1 and 5.2).
• For non-treated and 5% cement treated soils for confining pressures smaller
than critical stress path raised to Hvorslev’s surface and ultimately reached to
critical state line (Figures 5.1 and 5.2).
• For 10% cement treated soils undrained stress path ended on unconfined
compressive stress line (Figure 5.3).
• Cement treated Aberdeen soil displayed anisotropy type of behavior (Figures
5.5 and 5.6).
125

• The model presented by Muhunthan and Masad (1997) showed close
agreement between predicted and observed undrained stress path of
compacted Aberdeen soil in wet side of critical state (Figures 5.5 and 5.6).
• Extended Griffith theory and modified Griffith theory (for triaxial) can be
used to predict the maximum deviator stress in q-p΄ space, the ratio of
unconfined compressive strength to tensile strength found to be -14 and -10
for extended Griffith and modified Griffith (in q-p΄ space), respectively
(Figure 5.7).
• For confining pressures less than confining pressure correspond to the point at
which critical state line and extended Griffith theory intercepts, stress path
raised to extended Griffith theory line and dropped on critical state line
(Figures5.7 and 5.8).
6.3 Conclusions
Based on the above observations following conclusions can be drawn:
• Evaluation of effectiveness of a stabilization agent based solely on
improvement of unconfined compressive strength of treated soil as done by
current state of practice is not safe. Since soil behavior is mainly controlled by
confining pressure and water content performing triaxial test to simulate the
field condition, in addition to unconfined compressive strength test is
necessary.
• As a result of addition of cement soil behavior changes from ductile to rigid
(displaying fracture type of behavior at failure) resulting in significant
126
reduction in post peak deviator stress. Therefore, for an earth structure treated
with high percentage of cement allowable load and deformation need to be
identified.
• Behavior of cement treated Aberdeen soil in q-p΄ space can be predicted by
combining Muhunthan and Masad (1997) model and extended Griffith theory
for samples consolidated at near or greater than the critical confining pressure.
Samples consolidated below this pressure behave elastically until the peak
stress is attained. For these cases, a combination of elastic with extended
Griffith criterion is suggested.
• In comparison between non-treated and 5% cement treated Aberdeen soil, it
was observed that as a results of cement treatment inter-particle locking
increased while critical state friction angle remained constant. Therefore
improvement can be quantified in different confining pressures by using
critical state framework.
127

ACKNOWLEDGEMENTS
This research was conducted through the Washington State Transportation Center
(TRAC) with funding from the Federal Highway Administration (FHWA). The authors
thank Tom Badger and Steve Lowell for their assistance on collecting samples and
providing information on cement treated fills construction in Everett, WA.
REFRENCES
Abboud, M. M. (1973). Mechanical properties of cement-treated soils in relation to their use in embankment construction, Ph. D dissertation, University of California, Berkeley, CA.
ACI 230.1R-90. (1990). State-of-the-Art report on soil Cement, ACI Material Journal, 87
(4). ASTM D4609-01. (2006). Standard guide for evaluating effectiveness of admixtures for
soil stabilization, Annual Book of ASTM Standards, 4.08, 757-761. Balmer, G. G. (1958). Shear strength and elastic properties of soil-cement mixture under
triaxial loading, Portland Cement Association Research and Development Laboratories.
Baran, B., Ertuk, T, Sarikaya, Y., and Alemdarglu, T. (2001). “Workability test method
for metals applied to examine a workability measure (plastic limit) for clays.” Applied Clay Science, 20(1-2), 53-63.
Beikman, H. M., Rau, W. W., and Wagner, H. C. (1967). Lincoln Creek formation, Grays
Harbor basin southwestern Washington, Geological survey bulletin 1244-I. Bennert, T. A., Maher, M. H., Jafari, F., and Gucunski, N. (2000). “Use of dredged
sediments from Newark harbor for geotechnical application.” Geotechnics of high water content materials, ASTM special technical publication, STP 1374.
Bergado, D. T., Anderson, L. R., Miura, N., and Balasubramaniam, A. S. (1996). Soft
ground improvement, ASCE Press. Bishop, A. W. (1971). “The influence of progressive failure on the choice of stability
analysis.” Geotechnique, 21(2), 168-172. Black, D. K. and Lee, K. L. (1973). “Saturating laboratory samples under back pressure.”
Journal of The Soil Mechanics and Foundation Division, ASCE, 99(SM1), 75-93.
128

Burland, J. B. (1965). Discussion, Geotechnique, 15, 211-214. Burland, J. B., Rampello, S., Georgiannou, V. N. and Calabresi, G. (1996). ”A laboratory
study of the strength of four stiff clays.” Geotechnique, 46(3), 491-514. Chiu, H. K., and Johnston, I. W. (1984). “The application of critical state concepts to
Melbourne mudstone.” Fourth Australia- New Zealand conference on Geomechanics, (84/2), 29-33.
Clough, G. W., Sitar, N., Bachus, R. C., and Shafii-Rad, N. (1981). “ Cemented sands
under static loading.” Journal of The Geotechnical Engineering Division, ASCE, 107(GT6). 799-817.
Cokrell, C. F., Muter, R. B., Leonard, J. W, and Anderson, R. E. (1970). Application of
floatation for recovery of calcium constituents from limestone modified fly ash. West Virginia University, Coal Resource Bureau and School of Mines.
Collins, I. F. and Kelly, P. A. (2002). “A thermomechanical analysis of soil models.”
Geotechnique, 52(7), 507-518. Currin, D. D., Allen, J. J., and Little, D. N. (1976). “ Validation of soil stabilization index
system with manual development.” Report No. FJSRL-TR-0006, Frank J. Seisler Research Laboratory, United States Air Force Academy, Colorado.
Das, B. M. (1990). Principle of foundation engineering, PWS-KENT publishing
company, Boston. Eades, J. L. and Grim, R. E. (1966). “A quick test to determine lime requirements for
lime stabilization.” Highway Research Record, Washington, D.C., 139, 61-75. Engineering manual 1110-3-137. (1984). Soil stabilization for pavements mobilization
construction, Department of the Army, Corps of engineers office of the chief of engineers.
EPA-530-K-05-002. (2005). Using coal ash in highway construction: a guide to benefits
and impacts, United States Environmental Protection Agency. Feng, T. W. (2000).”Fall-cone penetration and water content relationship of clays.”
Geotechnique, 50(2), 181-187. Harris, P., Sebesta, S., Holdt, V. J., and Scullion, T. (2006). “Recommendations for
stabilization of high sulfate soils in Texas.” Transportation Research Board, Washington, D.C., (1952), 71-79.
129

Head, K. H. (1992). Manual of soil laboratory testing. 1, 2nd Edition, Pentech Press Limited.
Hilt, G.H. and Davidson, D.T. (1960). “Lime fixation in clayey soils.” Bulletin No. 304,
Highway Research Record, Washington, D.C., 20-32. Holtz, R. D. and Kovacs, W. D. (2004). Introduction to geotechnical engineering.
Pearson Education Taiwan Ltd. Jaeger, J. C. and Cook, N. G. W. (1976). Fundamentals of rock mechanics, John Wiley &
Sons, Inc. Jennings, A. T. (1994). Dynamic properties of unsaturated loess, MS thesis, University
of Idaho, Moscow, Idaho. Johnston, I. W. (1985). “Strength of intact geomechanical materials.” Journal of
Geotechnical Engineering, 111(6), 730-749. Johnston, I. W. and Chiu, H. K. (1984). “Strength of weathered Melbourne mudstone.”
Journal of Geotechnical Engineering, 110(7), 875-898. Kamon, M. and Nontananandh, S. (1991). “Combining industrial wastes with lime for
soil stabilization.” Journal of Geotechnical Engineering, 117(1), 1-17. Koumoto, T. and Houlsby, G. T. (2001). “Theory and practice of fall cone test.”
Geotechnique, 51(8), 701-712. Kasama, K., Zen, K., and Iwataki, K. (2007). “High-strengthening of cement-treated clay
by mechanical dehydration.” Soils and Foundations, 47(2), 171-184. Little, D. N. (1995). Stabilization of pavement subgrades and base courses with lime,
Kendall/Haunting publishing company. Little, D. N., Males, E. H., Prusinski, J. R., and Stewart, B. (2000). Cementitious
stabilization, Transportation in the New Millennium: State of the Art and Future Directions, Perspectives from Transportation Research Board Standing Committees.
Little, L., Connor, B., Carlson, R. F. (2005). Tests of soil stabilization products, phase 1,
University of Alaska Fairbanks. Lawrence, D. M. (1980). Some properties associated with Kaolinite soils. MS Thesis,
Cambridge University, UK. Lo, S. R., and Wardani, S. P. R. (2002). “Strength and dilatancy of a stabilized by a
cement and fly ash mixture.” Canadian Geotechnical Journal, 39(1), 77-89.
130

Lowell, S. (2005). Personnel communication, Washington Department of Transportation, Olympia, WA.
Maher, M., Marshall, C., Harrison, F. and Baumgaertner, K. (2005). Context sensitive
roadway surfacing selection guide, FHWA-CFL/TD-05-004. Mallela, J., Quintus, H. V., and Smith, K. (2004). Consideration of lime-stabilized layers
in mechanistic-empirical pavement design. The National Lime Association. McClintock, F. A. and Walsh, J. B. (1962). “ Friction on Griffith cracks in rocks under
pressure.” Proceedings of Fourth U.S. National Congress on Applied Mechanics, 2, 1015-1022, Berkeley, CA.
Miller, G. A., and Azad, S. (2000).” Influence of soil type on stabilization with cement
kiln dust.” Construction and Building Materials, 14(2), 89-97. Mitchell, J. K. (1976). “The properties of Cement-stabilized soils.” Proceeding of
Residential Workshop on Materials and Methods For Low Cost Road, Rail, and Reclamation Works, 365-404, Leura, Australia, Unisearch Ltd.
Muhunthan, B., Chameau, J. L., and Masad, E. (1996). “Fabric effects on the yield
behavior of soils.” Soils and Foundations, Japanese Society of Geotechnical Engineering, 36(3), 85-97.
Muhunthan, B. and Masad, E. (1997). “Fabric effects on stress-strain behavior of clays.”
Proceedings of Sixth International Symposium on Plasticity and Its Current Application, Juneau, Alaska.
Muhunthan, B. and Schofield, A. N. (2000). “Liquefaction and dam failure.” ASCE
Geotechnical Special Publication, GeoDenver Conference, Slope Stability 2000, (101), 266-280, Denver, CO.
Murrell, S. A. F. (1963). “A criterion for brittle fracture of rocks and concrete under
triaxial stress and the effect of pore pressure on the criterion.” Proceedings of Fifth Rock Mechanics Symposium, University of Minnesota, 563-577.
Nash, J. K. T. L., Jardine, F. M., and Humphrey, J. D., (1965). “The economic and
physical feasibility of soil-cement dams.” Proceedings of the Sixth International Conference on Soil Mechanics and Foundation Engineering, 2, 517-521, Montreal, Canada.
Nicholson, P. G. and Ding, M. (1997). “Improvement of tropical soils with waste ash and
lime.” American Society for Testing Materials, 1257, 195-204. Novello, E. A. and Johnston, I. W. (1995). ”Geotechnical materials and the critical state.”
Geotechnique, 45(2), 223-235.
131
Parry, R. H. G. (1995). Mohr circles, stress paths and Geotechnics, E&FN Spon Pillai, V. S. and Muhunthan, B. (2002). “Discussion of an investigation of the effect of
soils state on the capacity of driven piles in sand, by Klotz. E.U and Coop, M.R., Geotechnique, 52(8), 620-621.
Pillai, V. S. and Muhunthan, B. (2001). “A review of the initial static shear(Kα)and
confining stress(Kσ)on failure mechanism and earthquake liquefaction of soil.” Proceeding of 4th International Conference on Recent Advances in Geotechnical Earthquake Engineering and Soil Dynamics, San Diego, CA.
Pillai, V.S. and Muhunthan, B. (1999). “Landslides in cemented and normally
consolidated soils: a review of failure mechanism using stress-path.” Proceedings of 13th annual Vancouver Geotechnical Society Symposium, Vancouver, British Columbia.
Portland Cement Association, (1992). Soil-Cement Laboratory Handbook, Skokie,
Illinois. Puppala, A. J. and Musenda, C. (2000).” Effects of fibers reinforcement on strength and
volume change behavior of expansive soils.” Transportation Research Board, Washington D.C., (1736), 134-140.
Rocha, M., Folque, J., and Esteves, V. P. (1961). “The application of cement stabilized
soils in the construction of earth dams.” Fifth International Conference on Soil Mechanics and Foundation Engineering, Paris, France.
Roscoe, K. H. and Burland, J. B. (1968). On the generalized stress strain behavior of wet
clay, Engineering plasticity, Cambridge University Press. Roscoe, K. H., Schofield, A. N., and Thurairajah, A. (1963). “Yielding of clays in states
wetter than critical.” Geotechnique, 13(2), 211-240. Rotta, G. V., Consoli, N. C., Prietto, P. D. M., Coop, M. R., and Graham, J. (2003).
“Isotropic yielding in an artificially cemented soil cured under stress.” Geotechnique, 53(5), 493-501.
Running, D. L. (1996). An energy-based model for soil liquefaction, Ph D dissertation,
Washington State University, Pullman, WA. Sangrey, D. A. (1972). “Naturally cemented sensitive soils.” Geotechnique, 22(1), 139-
152.
132

Santoni, R. L., Tingle, J. S. and Nieves, M. (2004). “Accelerated strength improvement of silty sand using nontraditional additives.” Transportation Research Board, Washington, D.C., (1936), 34-42.
Santoni, R. L., Tingle, J. S. (2002). Building roads on soft and silty soils,
www.almc.army.mil/alog/issues/JanFeb02/MS698.htm - 18k. Sariosseiri, F. (2008). Critical State Framework for Interpretation of Geotechnical
Properties of Cement Treated Soils, Ph.D. Dissertation, Washington State University, Pullman, WA..
Sariosseiri, F. and Muhunthan, B. (2008). “Geotechnical properties of Palouse loess
modified with cement kiln dust and Portland cement.” Proceedings of Geocongress 2008, Geochallenge of sustainability in the Geoenvironment, New Orleans, LA
Schofield, A. N. (2005). Disturbed soil properties and geotechnical design, Thomas
Telford Ltd. Schofield, A. N. (1998). ”Mohr Coulomb error correction.” Ground Engineering, 31(8),
30-32. Schofield, A. N. (1980). “Cambridge geotechnical centrifuge operations.” Geotechnique,
30(3), 227-268. Schofield, A. N. and Wroth, C. P. (1968). Critical state soil mechanics, McGraw-Hill,
New York. Singh, G. V. and Das, B. M. (1999). “Soil stabilization with sodium chloride.”
Transportation Research Board, (1673), 46-55. Sivapullaiah, P. V. and Sridharan, A. (1985). “Liquid limit of soil mixtures.”
Geotechnical Testing Journal, 8(3), 111-116. Sreekrishnavilasam, A., King, S., Santagata, M. (2006). “Characterization of fresh and
landfilled cement kiln dust for reuse in construction applications.” Geoenvironmental Engineering, 85(1-2), 165-173.
Thompson, M. R. (1966). “Shear strength and elastic properties of lime-soil mixtures.”
Highway Research Record, Washington, D.C., 139, 1-14. Tabatabi, A. M. (1997). Pavement [Roosazi Rah], University’s publication center,
Tehran, Iran. Technical manual 5-822-14/AFJMAN 32-1019. (1994). Soil stabilization for pavement,
Department of Army and Air force, Washington D.C.
133

Troost, K. G., Booth, D. B., and Laparade, W. T. (2003). Quaternary geology of Seattle, Geology Society of America, Field guide 4.
Uddin, K., Balasubramaniam, A. S., and Bergardo, D. T. (1997). “Engineering behaviors
of cement-treated Bangkok soft clay.” Geotechnical Engineering Journal, (28)1, 89-119.
University of Florida, http://grunwald.ifas.ufl.edu. United States Geological Survey, http://esp.cr.usgs.gov.
Wasti, Y. (1987). “Liquid and plastic limits as determined from the fall cone and Casagrande methods.” Geotechnical Testing Journal, 10(1), 26-30.
Wissa, A. E. Z., Ladd, C. C., and Lambe, T. W. (1965). “Effective stress-strength
parameters of stabilized soils.” Proceedings of the Sixth International Conference on Soil Mechanics and Foundation Engineering, Montreal, Canada.
White, W. G. and Gnanendran, C. T. (2005). “The influence of compaction method and
density on the strength and modulus of cementitiously stabilized pavement material.” The International Journal of Pavement Engineering, 6(2), 97-110.
Wood, D. M. (1990). Soil behavior and critical state soil mechanics, Cambridge
university press. Wong, P. K. K. and Mitchell, R. J. (1975). ”Yielding and plastic flow of sensitive
cemented clay.” Geotechnique, 25(4), 763-782.
134