interpreting mls observations of the variabilities of tropical upper tropospheric o 3 and co chenxia...
Post on 18-Dec-2015
214 views
TRANSCRIPT
Interpreting MLS Observations of the Interpreting MLS Observations of the Variabilities of Tropical Upper Variabilities of Tropical Upper
Tropospheric OTropospheric O33 and CO and CO
Chenxia Cai, Qinbin Li, Nathaniel Livesey and Jonathan JiangChenxia Cai, Qinbin Li, Nathaniel Livesey and Jonathan Jiang(with thanks to MLS Team)(with thanks to MLS Team)
Jet Propulsion LaboratoryCalifornia Institute of Technology
Pasadena, California
3rd GEOS-Chem Users’ Meeting

• Background
- Derived tropospheric ozone columns from previous satellite observations (e.g. TOMS, GOME) have been examined to understand the distribution of (tropical) tropospheric O3. The drawback of column (tropospheric ozone) data is its lack of vertical information.
- Aura Microwave Limb Sounder (MLS) provides global coverage of observations of concentrations for O3 and CO in the upper troposphere.
• Objectives
- To characterize the seasonal variations of O3 and CO in the tropical upper troposphere through interpreting MLS observations and SHADOZ data using the GEOS-Chem model.
- To quantify the relative source contributions to tropical upper tropospheric O3 and CO.
- To investigate inter-hemispheric transport in the tropical upper troposphere.

Data & Model
• Study period: 2005
• Datasets
- MLS 147 hPa O3 and CO. Concentrations were averaged monthly onto 4o latitude by 8o longitude grid.
- MOPITT 150 hPa CO. Concentrations were averaged monthly onto 4o latitude by 8o longitude grid.
- SHADOZ ozonesonde data.
- GEOS-Chem full chemistry simulation (v7.4.10)

Compare MLS with LIDAR O3 (INTEX-B) and in situ CO (WB-57 ARGUS)
Product Low alt. limit
Vertical resolution
Single profile precision Comments
Ozone 215 hPa ~2.5km 20 – 40 ppbv
Carbon monoxide 215 hPa ~4 km 15 – 40 ppbv ~2x high bias at 215 hPa
= 147 hPa = 215 hPa = 316 hPa (not recommended)
= 100 hPa = 147 hPa = 215 hPa
Open symbols indicate where LIDAR value is based on extrapolation

GEOS-Chem Simulation
• Standard full-chemistry simulations [v7- 04 -10]
- NASA GMAO GEOS-4 met. fields (2x2.5, 30 levels).
- EDGAR fossil fuel emissions; GEIA biogenic emissions.
- Monthly biomass burning emissions [Duncan et al., 2003].
(GFED emissions will also be used in sensitivity simulations to be conducted)
- 6 Tg N/yr global annual lightning NOx emissions; lightning flash rates rescaled regionally to LIS/OTD observations.
• Sensitivity simulations [v7- 04 -10] - To be conducted.
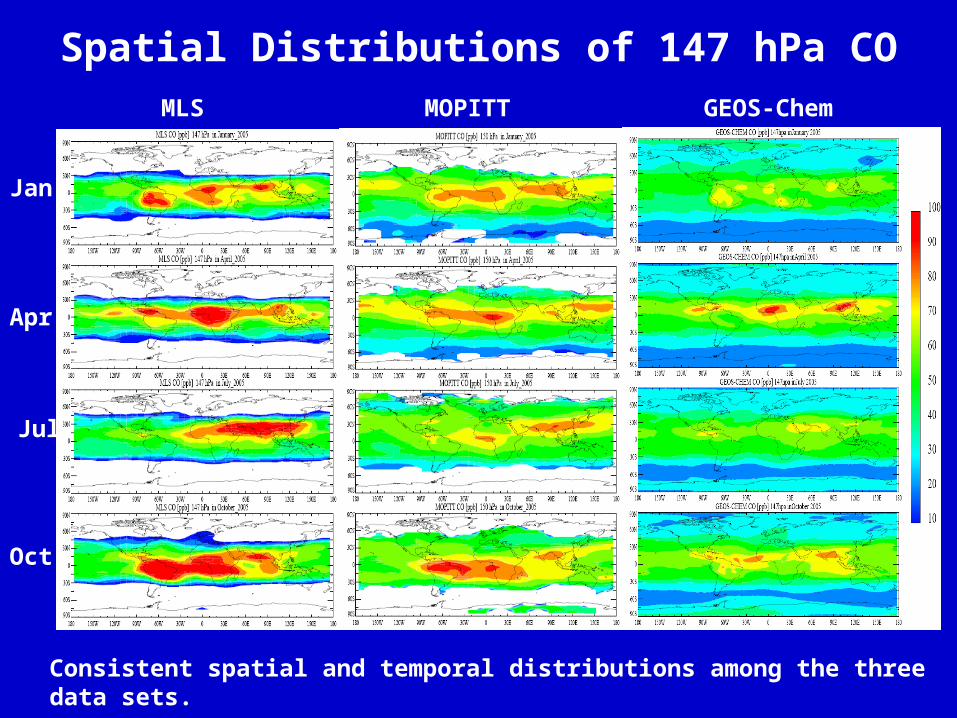
Spatial Distributions of 147 hPa CO
Consistent spatial and temporal distributions among the three data sets.
MLS MOPITT GEOS-Chem
Jan
Apr
Jul
Oct

Spatial Distributions of 147 hPa O3
MLS GEOS-CHEM
Jan
Apr
Jul
Oct
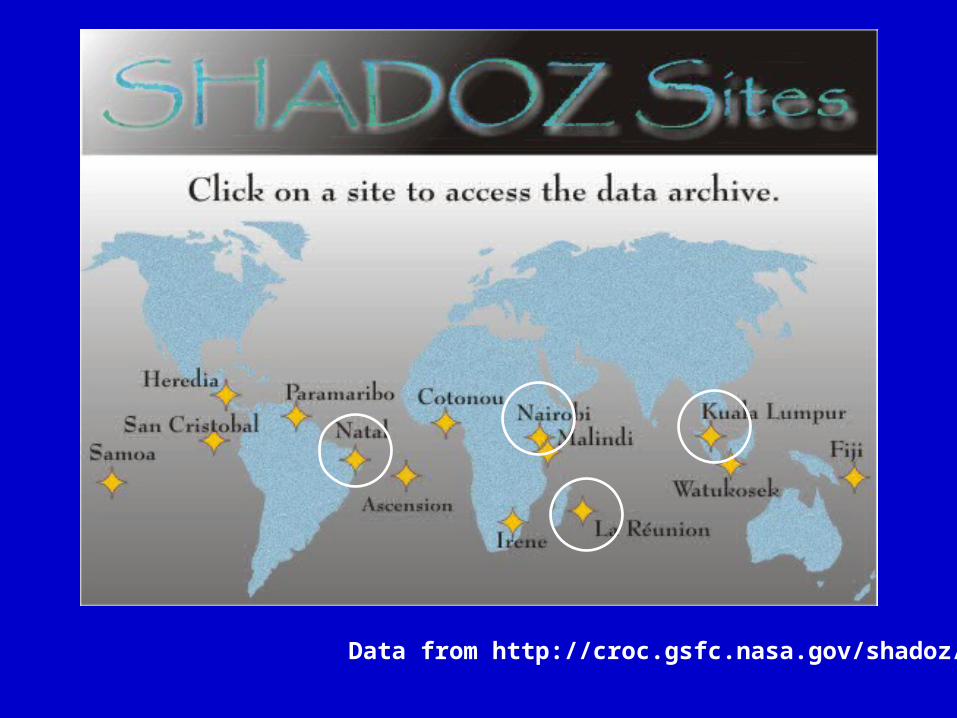
Data from http://croc.gsfc.nasa.gov/shadoz/
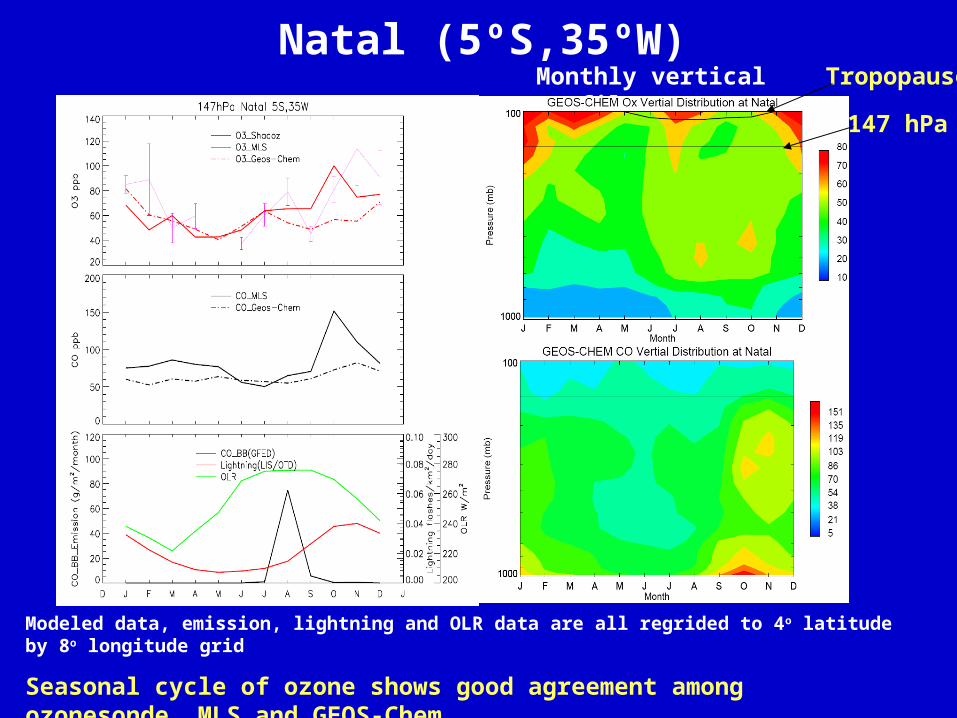
Natal (5ºS,35ºW)Monthly vertical profiles
Modeled data, emission, lightning and OLR data are all regrided to 4o latitude by 8o longitude grid
Seasonal cycle of ozone shows good agreement among ozonesonde, MLS and GEOS-Chem.
147 hPa
Tropopause
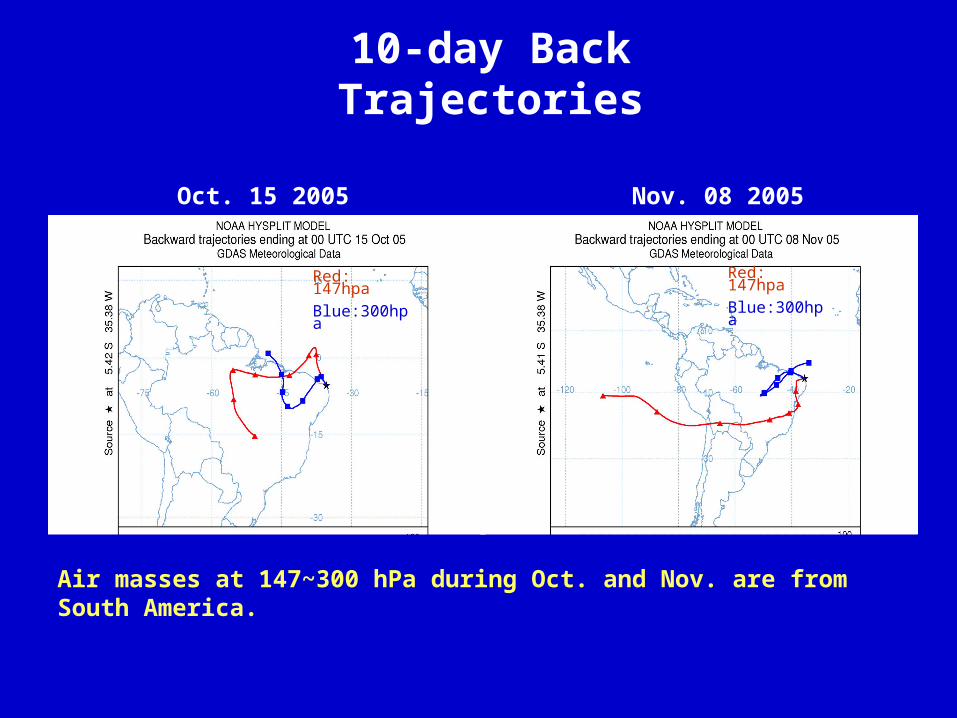
10-day Back Trajectories
Air masses at 147~300 hPa during Oct. and Nov. are from South America.
Red: 147hpa
Blue:300hpaRed: 147hpa
Blue:300hpa
Oct. 15 2005 Nov. 08 2005
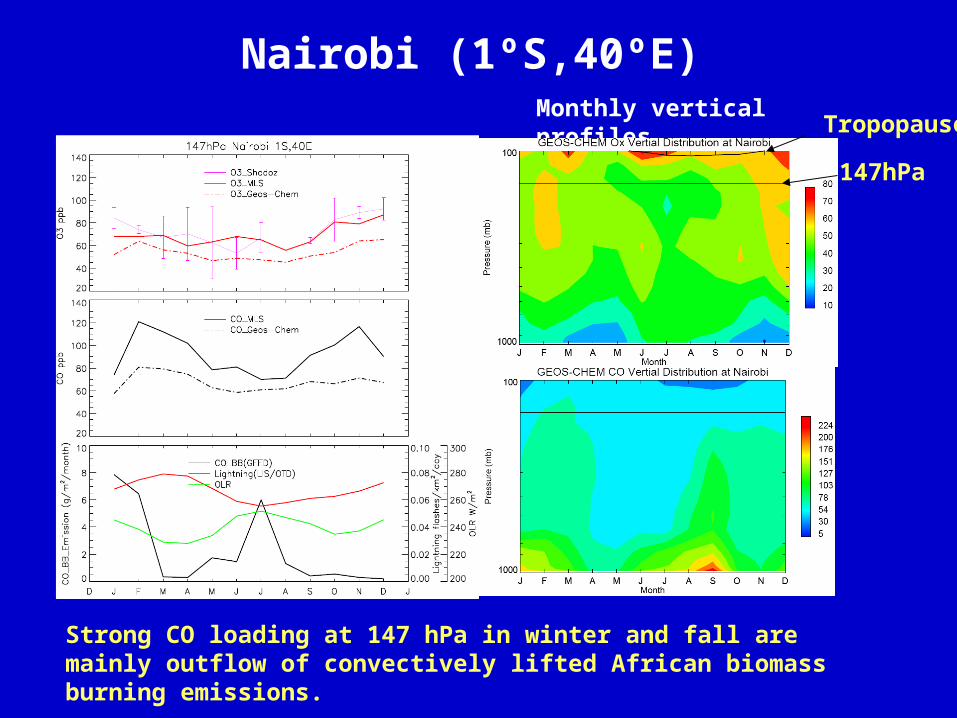
Nairobi (1ºS,40ºE)Monthly vertical profiles
Strong CO loading at 147 hPa in winter and fall are mainly outflow of convectively lifted African biomass burning emissions.
Tropopause
147hPa
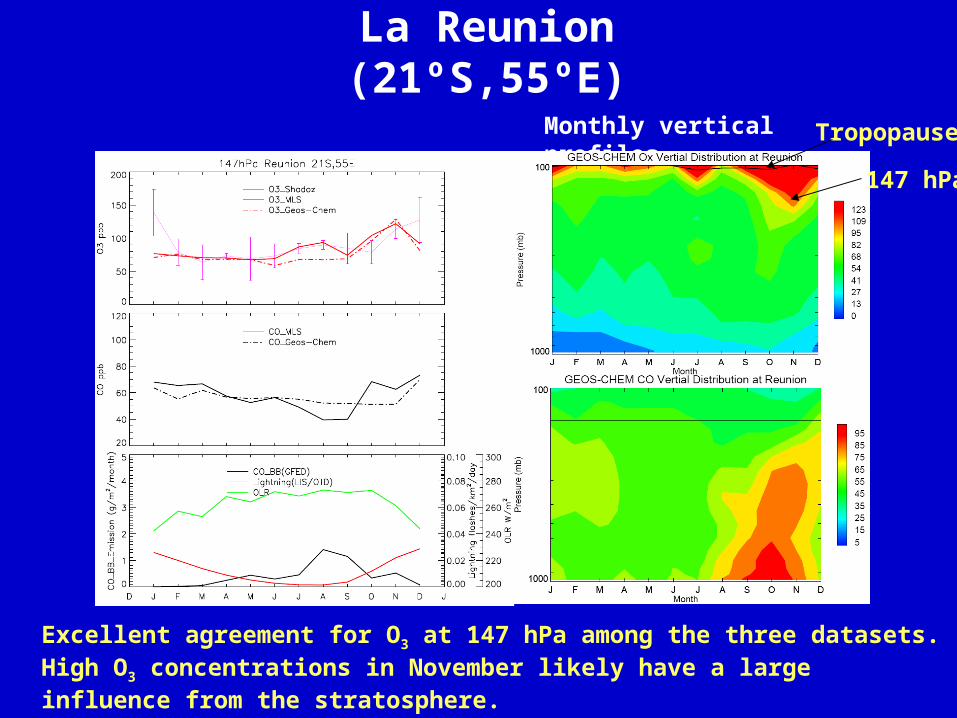
La Reunion (21ºS,55ºE)
Monthly vertical profiles
Excellent agreement for O3 at 147 hPa among the three datasets. High O3 concentrations in November likely have a large influence from the stratosphere.
147 hPa
Tropopause
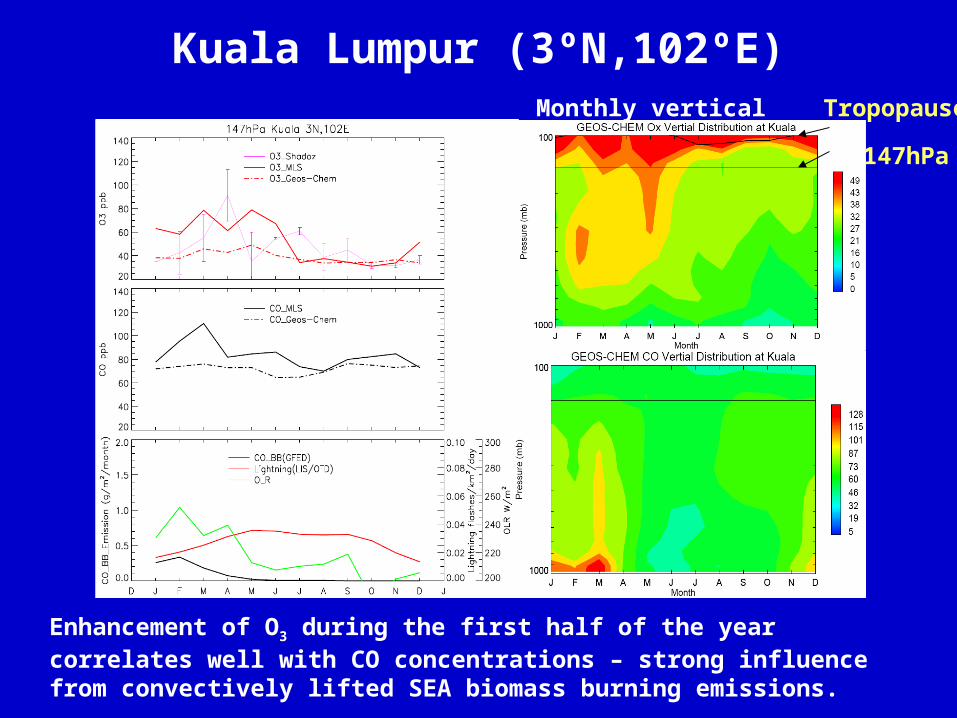
Kuala Lumpur (3ºN,102ºE)Monthly vertical profiles
Enhancement of O3 during the first half of the year correlates well with CO concentrations – strong influence from convectively lifted SEA biomass burning emissions.
Tropopause
147hPa

Conclusions
• MLS and GEOS-Chem O3 at 147 hPa in the tropics shows excellent consistency with SHADOZ ozonesonde data. Seasonal patterns of 147 hPa CO from MLS, MOPITT and GEOS-Chem are in good agreement.
• Seasonal patterns of tropical upper tropospheric O3 and CO vary significantly at different locations due to different source contributions.
• (Future work) sensitivity studies with GEOS-Chem simulations to be conducted to quantify the relative contributions from various source regions/types (biomass burning, lightning, long-range transport, etc.).

Thank you!Thank you!