intersection los calculations -...
TRANSCRIPT

INTERSECTION LOS CALCULATIONS EMBARCADERO/HARRISON & EMBARCADERO/ BRYANT
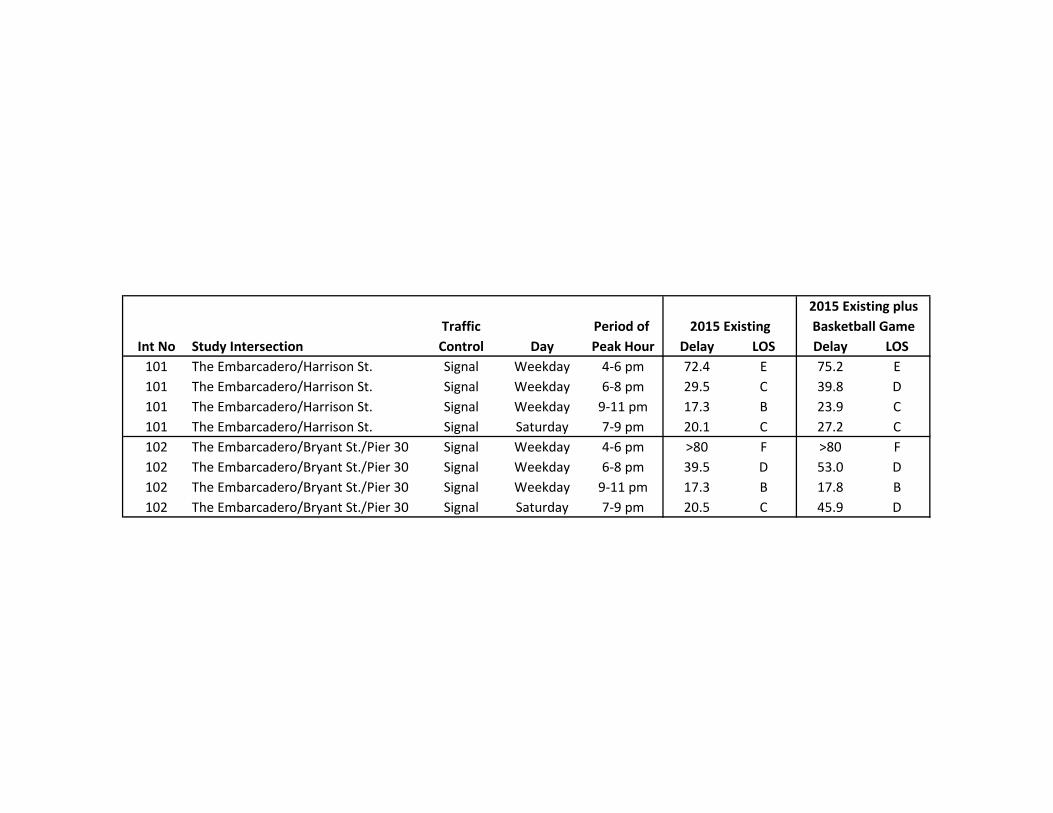
Traffic Period of Int No Study Intersection Control Day Peak Hour Delay LOS Delay LOS101 The Embarcadero/Harrison St. Signal Weekday 4‐6 pm 72.4 E 75.2 E101 The Embarcadero/Harrison St. Signal Weekday 6‐8 pm 29.5 C 39.8 D101 The Embarcadero/Harrison St. Signal Weekday 9‐11 pm 17.3 B 23.9 C101 The Embarcadero/Harrison St. Signal Saturday 7‐9 pm 20.1 C 27.2 C102 The Embarcadero/Bryant St./Pier 30 Signal Weekday 4‐6 pm >80 F >80 F102 The Embarcadero/Bryant St./Pier 30 Signal Weekday 6‐8 pm 39.5 D 53.0 D102 The Embarcadero/Bryant St./Pier 30 Signal Weekday 9‐11 pm 17.3 B 17.8 B102 The Embarcadero/Bryant St./Pier 30 Signal Saturday 7‐9 pm 20.5 C 45.9 D
2015 Existing Basketball Game2015 Existing plus

EXISTING 2015 (NO PROJECT) NO SF GIANTS GAME AT AT&T PARK
WEEKDAY PM PEAK

HCM Signalized Intersection Capacity Analysis101: The Embarcadero & Harrison St. 12/7/2015
GSW Mission Bay Arena 8/20/2015 Existing PM Peak No Giants Synchro 8 ReportTW Page 32
Movement EBL EBR NBL NBT SBT SBRLane ConfigurationsVolume (vph) 170 214 0 839 1014 192Ideal Flow (vphpl) 1900 1900 1900 1900 1600 1600Total Lost time (s) 6.8 6.8 5.4 5.4Lane Util. Factor 1.00 1.00 *0.90 *0.80Frpb, ped/bikes 1.00 0.96 1.00 0.98Flpb, ped/bikes 1.00 1.00 1.00 1.00Frt 1.00 0.85 1.00 0.98Flt Protected 0.95 1.00 1.00 1.00Satd. Flow (prot) 1540 1318 2917 2085Flt Permitted 0.95 1.00 1.00 1.00Satd. Flow (perm) 1540 1318 2917 2085Peak-hour factor, PHF 0.92 0.92 0.92 0.92 0.92 0.92Adj. Flow (vph) 185 233 0 912 1102 209RTOR Reduction (vph) 0 18 0 0 11 0Lane Group Flow (vph) 185 215 0 912 1300 0Confl. Peds. (#/hr) 73 40 140Confl. Bikes (#/hr) 117Turn Type Prot Perm NA NAProtected Phases 4 2 6Permitted Phases 4Actuated Green, G (s) 41.2 41.2 56.6 56.6Effective Green, g (s) 41.2 41.2 56.6 56.6Actuated g/C Ratio 0.37 0.37 0.51 0.51Clearance Time (s) 6.8 6.8 5.4 5.4Lane Grp Cap (vph) 576 493 1500 1072v/s Ratio Prot 0.12 0.31 c0.62v/s Ratio Perm c0.16v/c Ratio 0.32 0.44 0.61 1.21Uniform Delay, d1 24.5 25.7 18.9 26.7Progression Factor 1.00 1.00 1.77 0.62Incremental Delay, d2 1.5 2.8 1.3 96.5Delay (s) 25.9 28.5 34.6 113.1Level of Service C C C FApproach Delay (s) 27.4 34.6 113.1Approach LOS C C F
Intersection SummaryHCM 2000 Control Delay 72.4 HCM 2000 Level of Service EHCM 2000 Volume to Capacity ratio 0.88Actuated Cycle Length (s) 110.0 Sum of lost time (s) 12.2Intersection Capacity Utilization 91.7% ICU Level of Service FAnalysis Period (min) 15c Critical Lane Group

HCM Signalized Intersection Capacity Analysis102: The Embarcadero & Bryant St./Pier 30 12/7/2015
GSW Mission Bay Arena 8/20/2015 Existing PM Peak No Giants Synchro 8 ReportTW Page 33
Movement EBL EBT EBR WBL WBT WBR NBL NBT NBR SBL SBT SBRLane ConfigurationsVolume (vph) 34 4 227 7 9 4 191 781 0 17 1135 76Ideal Flow (vphpl) 1900 1900 1900 1900 1900 1900 1900 1900 1900 1600 1600 1600Total Lost time (s) 6.9 6.9 6.9 6.5 6.5 5.9 5.2 5.2Lane Util. Factor 1.00 1.00 1.00 1.00 0.95 *0.90 *0.90 *0.90Frpb, ped/bikes 1.00 0.97 0.99 1.00 1.00 1.00 1.00 0.86Flpb, ped/bikes 0.96 1.00 0.99 1.00 1.00 1.00 1.00 1.00Frt 1.00 0.85 0.98 1.00 1.00 1.00 1.00 0.85Flt Protected 0.95 1.00 0.98 0.95 1.00 0.95 1.00 1.00Satd. Flow (prot) 1481 1336 1531 1540 3079 1167 2456 898Flt Permitted 0.74 1.00 0.89 0.95 1.00 0.95 1.00 1.00Satd. Flow (perm) 1159 1336 1392 1540 3079 1167 2456 898Peak-hour factor, PHF 0.92 0.92 0.92 0.92 0.92 0.92 0.92 0.92 0.92 0.92 0.92 0.92Adj. Flow (vph) 37 4 247 8 10 4 208 849 0 18 1234 83RTOR Reduction (vph) 0 161 0 0 3 0 0 0 0 0 0 58Lane Group Flow (vph) 37 90 0 0 19 0 208 849 0 18 1234 25Confl. Peds. (#/hr) 45 24 24 45 173 77Confl. Bikes (#/hr) 2 52 80Turn Type Perm NA Perm NA Prot NA Prot NA PermProtected Phases 4 8 5 2 1 6Permitted Phases 4 8 6Actuated Green, G (s) 38.1 38.1 38.1 20.5 41.5 11.1 32.8 32.8Effective Green, g (s) 38.1 38.1 38.1 20.5 41.5 11.1 32.8 32.8Actuated g/C Ratio 0.35 0.35 0.35 0.19 0.38 0.10 0.30 0.30Clearance Time (s) 6.9 6.9 6.9 6.5 6.5 5.9 5.2 5.2Lane Grp Cap (vph) 401 462 482 287 1161 117 732 267v/s Ratio Prot c0.07 0.14 c0.28 0.02 c0.50v/s Ratio Perm 0.03 0.01 0.03v/c Ratio 0.09 0.19 0.04 0.72 0.73 0.15 1.69 0.09Uniform Delay, d1 24.3 25.2 23.8 42.1 29.5 45.2 38.6 27.9Progression Factor 1.00 1.00 1.00 0.84 0.85 1.38 1.18 2.60Incremental Delay, d2 0.5 0.9 0.2 11.2 3.0 0.3 309.1 0.1Delay (s) 24.7 26.1 24.0 46.5 28.0 62.4 354.6 72.6Level of Service C C C D C E F EApproach Delay (s) 25.9 24.0 31.6 333.2Approach LOS C C C F
Intersection SummaryHCM 2000 Control Delay 179.9 HCM 2000 Level of Service FHCM 2000 Volume to Capacity ratio 0.88Actuated Cycle Length (s) 110.0 Sum of lost time (s) 19.3Intersection Capacity Utilization 105.7% ICU Level of Service GAnalysis Period (min) 15c Critical Lane Group

EXISTING 2015 (NO PROJECT) NO SF GIANTS GAME AT AT&T PARK
WEEKDAY EVENING

HCM Signalized Intersection Capacity Analysis101: The Embarcadero & Harrison St. 11/24/2015
GSW Mission Bay Arena 8/20/2015 Existing Weekday Evening, No Giants Synchro 8 ReportTW Page 32
Movement EBL EBR NBL NBT SBT SBRLane ConfigurationsVolume (vph) 179 184 0 1019 808 189Ideal Flow (vphpl) 1900 1900 1900 1900 1600 1600Total Lost time (s) 6.8 6.8 5.4 5.4Lane Util. Factor 1.00 1.00 *0.90 *0.80Frpb, ped/bikes 1.00 0.96 1.00 0.97Flpb, ped/bikes 1.00 1.00 1.00 1.00Frt 1.00 0.85 1.00 0.97Flt Protected 0.95 1.00 1.00 1.00Satd. Flow (prot) 1540 1318 2698 2067Flt Permitted 0.95 1.00 1.00 1.00Satd. Flow (perm) 1540 1318 2698 2067Peak-hour factor, PHF 0.93 0.93 0.93 0.93 0.93 0.93Adj. Flow (vph) 192 198 0 1096 869 203RTOR Reduction (vph) 0 34 0 0 14 0Lane Group Flow (vph) 192 164 0 1096 1058 0Confl. Peds. (#/hr) 73 40 140Confl. Bikes (#/hr) 117Parking (#/hr) 10Turn Type Prot Perm NA NAProtected Phases 4 2 6Permitted Phases 4Actuated Green, G (s) 41.2 41.2 56.6 56.6Effective Green, g (s) 41.2 41.2 56.6 56.6Actuated g/C Ratio 0.37 0.37 0.51 0.51Clearance Time (s) 6.8 6.8 5.4 5.4Lane Grp Cap (vph) 576 493 1388 1063v/s Ratio Prot c0.12 0.41 c0.51v/s Ratio Perm 0.12v/c Ratio 0.33 0.33 0.79 1.00Uniform Delay, d1 24.6 24.6 21.8 26.6Progression Factor 1.00 1.00 1.89 0.33Incremental Delay, d2 1.6 1.8 2.5 7.3Delay (s) 26.1 26.4 43.8 16.0Level of Service C C D BApproach Delay (s) 26.3 43.8 16.0Approach LOS C D B
Intersection SummaryHCM 2000 Control Delay 29.5 HCM 2000 Level of Service CHCM 2000 Volume to Capacity ratio 0.72Actuated Cycle Length (s) 110.0 Sum of lost time (s) 12.2Intersection Capacity Utilization 91.7% ICU Level of Service FAnalysis Period (min) 15c Critical Lane Group

HCM Signalized Intersection Capacity Analysis102: The Embarcadero & Bryant St./Pier 30 11/24/2015
GSW Mission Bay Arena 8/20/2015 Existing Weekday Evening, No Giants Synchro 8 ReportTW Page 33
Movement EBL EBT EBR WBL WBT WBR NBL NBT NBR SBL SBT SBRLane ConfigurationsVolume (vph) 41 21 190 18 9 7 83 971 15 53 870 69Ideal Flow (vphpl) 1900 1900 1900 1900 1900 1900 1900 1900 1900 1600 1600 1600Total Lost time (s) 6.9 6.9 6.9 6.5 6.5 5.9 5.2 5.2Lane Util. Factor 1.00 1.00 1.00 1.00 0.95 *0.90 *0.90 *0.90Frpb, ped/bikes 1.00 0.97 0.99 1.00 1.00 1.00 1.00 0.87Flpb, ped/bikes 0.96 1.00 0.99 1.00 1.00 1.00 1.00 1.00Frt 1.00 0.86 0.97 1.00 1.00 1.00 1.00 0.85Flt Protected 0.95 1.00 0.97 0.95 1.00 0.95 1.00 1.00Satd. Flow (prot) 1482 1359 1507 1540 2906 1167 2456 904Flt Permitted 0.73 1.00 0.83 0.95 1.00 0.95 1.00 1.00Satd. Flow (perm) 1147 1359 1278 1540 2906 1167 2456 904Peak-hour factor, PHF 0.98 0.98 0.98 0.98 0.98 0.98 0.98 0.98 0.98 0.98 0.98 0.98Adj. Flow (vph) 42 21 194 18 9 7 85 991 15 54 888 70RTOR Reduction (vph) 0 127 0 0 5 0 0 1 0 0 0 47Lane Group Flow (vph) 42 88 0 0 29 0 85 1005 0 54 888 23Confl. Peds. (#/hr) 45 24 24 45 173 77Confl. Bikes (#/hr) 2 52 80Parking (#/hr) 0Turn Type Perm NA Perm NA Prot NA Prot NA PermProtected Phases 4 8 5 2 1 6Permitted Phases 4 8 6Actuated Green, G (s) 38.1 38.1 38.1 16.5 41.5 11.1 36.8 36.8Effective Green, g (s) 38.1 38.1 38.1 16.5 41.5 11.1 36.8 36.8Actuated g/C Ratio 0.35 0.35 0.35 0.15 0.38 0.10 0.33 0.33Clearance Time (s) 6.9 6.9 6.9 6.5 6.5 5.9 5.2 5.2Lane Grp Cap (vph) 397 470 442 231 1096 117 821 302v/s Ratio Prot c0.06 0.06 c0.35 0.05 c0.36v/s Ratio Perm 0.04 0.02 0.03v/c Ratio 0.11 0.19 0.07 0.37 0.92 0.46 1.08 0.08Uniform Delay, d1 24.4 25.1 24.1 42.1 32.6 46.6 36.6 25.0Progression Factor 1.00 1.00 1.00 0.43 0.22 1.14 0.66 0.53Incremental Delay, d2 0.5 0.9 0.3 3.4 10.7 5.8 46.9 0.2Delay (s) 24.9 26.0 24.3 21.4 17.9 59.1 71.1 13.4Level of Service C C C C B E E BApproach Delay (s) 25.8 24.3 18.1 66.5Approach LOS C C B E
Intersection SummaryHCM 2000 Control Delay 39.5 HCM 2000 Level of Service DHCM 2000 Volume to Capacity ratio 0.71Actuated Cycle Length (s) 110.0 Sum of lost time (s) 19.3Intersection Capacity Utilization 92.7% ICU Level of Service FAnalysis Period (min) 15c Critical Lane Group

EXISTING 2015 (NO PROJECT) NO SF GIANTS GAME AT AT&T PARK
WEEKDAY LATE EVENING

HCM Signalized Intersection Capacity Analysis101: The Embarcadero & Harrison St. 11/24/2015
GSW Mission Bay Arena 8/20/2015 Existing Weekday Late Evening, No Giants Game Synchro 8 ReportTW Page 32
Movement EBL EBR NBL NBT SBT SBRLane ConfigurationsVolume (vph) 85 58 0 502 621 126Ideal Flow (vphpl) 1900 1900 1900 1900 1600 1600Total Lost time (s) 6.8 6.8 5.4 5.4Lane Util. Factor 1.00 1.00 *0.90 *0.80Frpb, ped/bikes 1.00 0.96 1.00 0.98Flpb, ped/bikes 1.00 1.00 1.00 1.00Frt 1.00 0.85 1.00 0.97Flt Protected 0.95 1.00 1.00 1.00Satd. Flow (prot) 1540 1318 2698 2079Flt Permitted 0.95 1.00 1.00 1.00Satd. Flow (perm) 1540 1318 2698 2079Peak-hour factor, PHF 0.86 0.86 0.86 0.86 0.86 0.86Adj. Flow (vph) 99 67 0 584 722 147RTOR Reduction (vph) 0 42 0 0 12 0Lane Group Flow (vph) 99 25 0 584 857 0Confl. Peds. (#/hr) 73 40 140Confl. Bikes (#/hr) 117Parking (#/hr) 10Turn Type Prot Perm NA NAProtected Phases 4 2 6Permitted Phases 4Actuated Green, G (s) 41.2 41.2 56.6 56.6Effective Green, g (s) 41.2 41.2 56.6 56.6Actuated g/C Ratio 0.37 0.37 0.51 0.51Clearance Time (s) 6.8 6.8 5.4 5.4Lane Grp Cap (vph) 576 493 1388 1069v/s Ratio Prot c0.06 0.22 c0.41v/s Ratio Perm 0.02v/c Ratio 0.17 0.05 0.42 0.80Uniform Delay, d1 23.0 21.9 16.5 22.1Progression Factor 1.00 1.00 1.95 0.23Incremental Delay, d2 0.6 0.2 0.8 0.6Delay (s) 23.6 22.1 33.1 5.7Level of Service C C C AApproach Delay (s) 23.0 33.1 5.7Approach LOS C C A
Intersection SummaryHCM 2000 Control Delay 17.3 HCM 2000 Level of Service BHCM 2000 Volume to Capacity ratio 0.54Actuated Cycle Length (s) 110.0 Sum of lost time (s) 12.2Intersection Capacity Utilization 91.7% ICU Level of Service FAnalysis Period (min) 15c Critical Lane Group
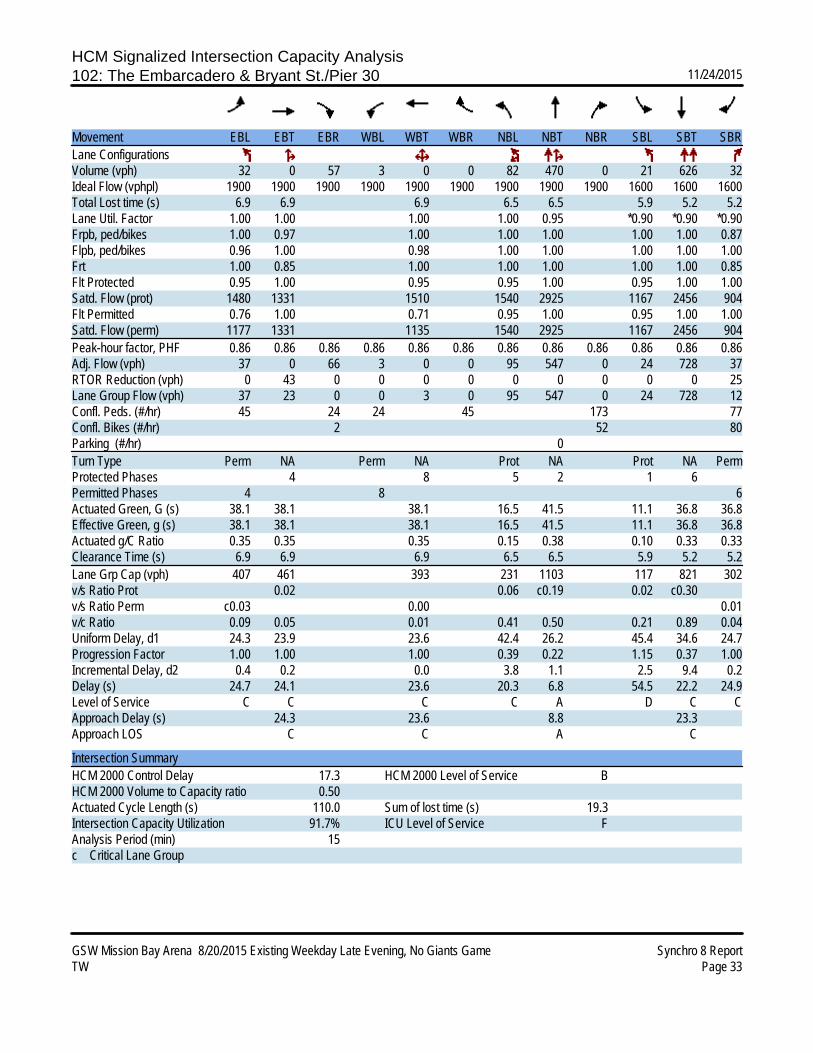
HCM Signalized Intersection Capacity Analysis102: The Embarcadero & Bryant St./Pier 30 11/24/2015
GSW Mission Bay Arena 8/20/2015 Existing Weekday Late Evening, No Giants Game Synchro 8 ReportTW Page 33
Movement EBL EBT EBR WBL WBT WBR NBL NBT NBR SBL SBT SBRLane ConfigurationsVolume (vph) 32 0 57 3 0 0 82 470 0 21 626 32Ideal Flow (vphpl) 1900 1900 1900 1900 1900 1900 1900 1900 1900 1600 1600 1600Total Lost time (s) 6.9 6.9 6.9 6.5 6.5 5.9 5.2 5.2Lane Util. Factor 1.00 1.00 1.00 1.00 0.95 *0.90 *0.90 *0.90Frpb, ped/bikes 1.00 0.97 1.00 1.00 1.00 1.00 1.00 0.87Flpb, ped/bikes 0.96 1.00 0.98 1.00 1.00 1.00 1.00 1.00Frt 1.00 0.85 1.00 1.00 1.00 1.00 1.00 0.85Flt Protected 0.95 1.00 0.95 0.95 1.00 0.95 1.00 1.00Satd. Flow (prot) 1480 1331 1510 1540 2925 1167 2456 904Flt Permitted 0.76 1.00 0.71 0.95 1.00 0.95 1.00 1.00Satd. Flow (perm) 1177 1331 1135 1540 2925 1167 2456 904Peak-hour factor, PHF 0.86 0.86 0.86 0.86 0.86 0.86 0.86 0.86 0.86 0.86 0.86 0.86Adj. Flow (vph) 37 0 66 3 0 0 95 547 0 24 728 37RTOR Reduction (vph) 0 43 0 0 0 0 0 0 0 0 0 25Lane Group Flow (vph) 37 23 0 0 3 0 95 547 0 24 728 12Confl. Peds. (#/hr) 45 24 24 45 173 77Confl. Bikes (#/hr) 2 52 80Parking (#/hr) 0Turn Type Perm NA Perm NA Prot NA Prot NA PermProtected Phases 4 8 5 2 1 6Permitted Phases 4 8 6Actuated Green, G (s) 38.1 38.1 38.1 16.5 41.5 11.1 36.8 36.8Effective Green, g (s) 38.1 38.1 38.1 16.5 41.5 11.1 36.8 36.8Actuated g/C Ratio 0.35 0.35 0.35 0.15 0.38 0.10 0.33 0.33Clearance Time (s) 6.9 6.9 6.9 6.5 6.5 5.9 5.2 5.2Lane Grp Cap (vph) 407 461 393 231 1103 117 821 302v/s Ratio Prot 0.02 0.06 c0.19 0.02 c0.30v/s Ratio Perm c0.03 0.00 0.01v/c Ratio 0.09 0.05 0.01 0.41 0.50 0.21 0.89 0.04Uniform Delay, d1 24.3 23.9 23.6 42.4 26.2 45.4 34.6 24.7Progression Factor 1.00 1.00 1.00 0.39 0.22 1.15 0.37 1.00Incremental Delay, d2 0.4 0.2 0.0 3.8 1.1 2.5 9.4 0.2Delay (s) 24.7 24.1 23.6 20.3 6.8 54.5 22.2 24.9Level of Service C C C C A D C CApproach Delay (s) 24.3 23.6 8.8 23.3Approach LOS C C A C
Intersection SummaryHCM 2000 Control Delay 17.3 HCM 2000 Level of Service BHCM 2000 Volume to Capacity ratio 0.50Actuated Cycle Length (s) 110.0 Sum of lost time (s) 19.3Intersection Capacity Utilization 91.7% ICU Level of Service FAnalysis Period (min) 15c Critical Lane Group

EXISTING 2015 (NO PROJECT) NO SF GIANTS GAME AT AT&T PARK
SATURDAY EVENING

HCM Signalized Intersection Capacity Analysis101: The Embarcadero & Harrison St. 12/7/2015
GSW Mission Bay Arena 5/29/2015 Existing Saturday Evening, No Giants Synchro 8 ReportTW Page 32
Movement EBL EBR NBL NBT SBT SBRLane ConfigurationsVolume (vph) 99 107 0 619 628 203Ideal Flow (vphpl) 1500 1500 1500 1500 1500 1500Total Lost time (s) 6.8 6.8 5.4 5.4Lane Util. Factor 1.00 1.00 *0.90 *0.80Frpb, ped/bikes 1.00 0.96 1.00 0.97Flpb, ped/bikes 1.00 1.00 1.00 1.00Frt 1.00 0.85 1.00 0.96Flt Protected 0.95 1.00 1.00 1.00Satd. Flow (prot) 1215 1040 2130 1907Flt Permitted 0.95 1.00 1.00 1.00Satd. Flow (perm) 1215 1040 2130 1907Peak-hour factor, PHF 0.97 0.97 0.97 0.97 0.97 0.97Adj. Flow (vph) 102 110 0 638 647 209RTOR Reduction (vph) 0 63 0 0 21 0Lane Group Flow (vph) 102 47 0 638 835 0Confl. Peds. (#/hr) 73 40 140Confl. Bikes (#/hr) 117Parking (#/hr) 10Turn Type Prot Perm NA NAProtected Phases 4 2 6Permitted Phases 4Actuated Green, G (s) 41.2 41.2 56.6 56.6Effective Green, g (s) 41.2 41.2 56.6 56.6Actuated g/C Ratio 0.37 0.37 0.51 0.51Clearance Time (s) 6.8 6.8 5.4 5.4Lane Grp Cap (vph) 455 389 1095 981v/s Ratio Prot c0.08 0.30 c0.44v/s Ratio Perm 0.05v/c Ratio 0.22 0.12 0.58 0.85Uniform Delay, d1 23.5 22.5 18.5 23.1Progression Factor 1.00 1.00 1.91 0.24Incremental Delay, d2 1.1 0.6 1.6 0.9Delay (s) 24.6 23.2 37.0 6.5Level of Service C C D AApproach Delay (s) 23.9 37.0 6.5Approach LOS C D A
Intersection SummaryHCM 2000 Control Delay 20.1 HCM 2000 Level of Service CHCM 2000 Volume to Capacity ratio 0.59Actuated Cycle Length (s) 110.0 Sum of lost time (s) 12.2Intersection Capacity Utilization 91.7% ICU Level of Service FAnalysis Period (min) 15c Critical Lane Group

HCM Signalized Intersection Capacity Analysis102: The Embarcadero & Bryant St./Pier 30 12/7/2015
GSW Mission Bay Arena 5/29/2015 Existing Saturday Evening, No Giants Synchro 8 ReportTW Page 33
Movement EBL EBT EBR WBL WBT WBR NBL NBT NBR SBL SBT SBRLane ConfigurationsVolume (vph) 49 3 100 1 1 6 78 564 4 21 646 68Ideal Flow (vphpl) 1500 1500 1500 1500 1500 1500 1400 1400 1400 1500 1500 1500Total Lost time (s) 6.9 6.9 6.9 6.5 6.5 5.9 5.2 5.2Lane Util. Factor 1.00 1.00 1.00 1.00 0.95 *0.90 *0.90 *0.90Frpb, ped/bikes 1.00 0.97 0.96 1.00 1.00 1.00 1.00 0.87Flpb, ped/bikes 0.96 1.00 1.00 1.00 1.00 1.00 1.00 1.00Frt 1.00 0.85 0.90 1.00 1.00 1.00 1.00 0.85Flt Protected 0.95 1.00 0.99 0.95 1.00 0.95 1.00 1.00Satd. Flow (prot) 1169 1057 1097 1134 2149 1094 2303 847Flt Permitted 0.75 1.00 0.98 0.95 1.00 0.95 1.00 1.00Satd. Flow (perm) 926 1057 1085 1134 2149 1094 2303 847Peak-hour factor, PHF 0.94 0.94 0.94 0.94 0.94 0.94 0.94 0.94 0.94 0.94 0.94 0.94Adj. Flow (vph) 52 3 106 1 1 6 83 600 4 22 687 72RTOR Reduction (vph) 0 69 0 0 4 0 0 1 0 0 0 48Lane Group Flow (vph) 52 40 0 0 4 0 83 603 0 22 687 24Confl. Peds. (#/hr) 45 24 24 45 173 77Confl. Bikes (#/hr) 2 52 80Parking (#/hr) 0Turn Type Perm NA Perm NA Prot NA Prot NA PermProtected Phases 4 8 5 2 1 6Permitted Phases 4 8 6Actuated Green, G (s) 38.1 38.1 38.1 16.5 41.5 11.1 36.8 36.8Effective Green, g (s) 38.1 38.1 38.1 16.5 41.5 11.1 36.8 36.8Actuated g/C Ratio 0.35 0.35 0.35 0.15 0.38 0.10 0.33 0.33Clearance Time (s) 6.9 6.9 6.9 6.5 6.5 5.9 5.2 5.2Lane Grp Cap (vph) 320 366 375 170 810 110 770 283v/s Ratio Prot 0.04 0.07 c0.28 0.02 c0.30v/s Ratio Perm c0.06 0.00 0.03v/c Ratio 0.16 0.11 0.01 0.49 0.74 0.20 0.89 0.09Uniform Delay, d1 24.9 24.4 23.6 42.9 29.7 45.4 34.7 25.1Progression Factor 1.00 1.00 1.00 0.40 0.20 1.15 0.49 0.48Incremental Delay, d2 1.1 0.6 0.1 7.0 4.5 2.6 10.4 0.4Delay (s) 26.0 25.0 23.6 24.2 10.4 54.8 27.5 12.5Level of Service C C C C B D C BApproach Delay (s) 25.3 23.6 12.0 26.9Approach LOS C C B C
Intersection SummaryHCM 2000 Control Delay 20.5 HCM 2000 Level of Service CHCM 2000 Volume to Capacity ratio 0.59Actuated Cycle Length (s) 110.0 Sum of lost time (s) 19.3Intersection Capacity Utilization 91.7% ICU Level of Service FAnalysis Period (min) 15c Critical Lane Group

EXISTING 2015 PLUS PROJECT BASKETBALL GAME
NO SF GIANTS GAME AT AT&T PARK WEEKDAY PM PEAK

HCM Signalized Intersection Capacity Analysis101: The Embarcadero & Harrison St. 12/7/2015
GSW Mission Bay Arena (Off-Site Parking) Existing Plus Project (Warriors Game) Weekday PM Peak, No Giants GameSynchro 8 ReportTW Page 32
Movement EBL EBR NBL NBT SBT SBRLane ConfigurationsVolume (vph) 170 214 0 857 1024 192Ideal Flow (vphpl) 1900 1900 1900 1900 1600 1600Total Lost time (s) 6.8 6.8 5.4 5.4Lane Util. Factor 1.00 1.00 *0.90 *0.80Frpb, ped/bikes 1.00 0.96 1.00 0.98Flpb, ped/bikes 1.00 1.00 1.00 1.00Frt 1.00 0.85 1.00 0.98Flt Protected 0.95 1.00 1.00 1.00Satd. Flow (prot) 1540 1318 2917 2086Flt Permitted 0.95 1.00 1.00 1.00Satd. Flow (perm) 1540 1318 2917 2086Peak-hour factor, PHF 0.92 0.92 0.92 0.92 0.92 0.92Adj. Flow (vph) 185 233 0 932 1113 209RTOR Reduction (vph) 0 18 0 0 11 0Lane Group Flow (vph) 185 215 0 932 1311 0Confl. Peds. (#/hr) 73 40 140Confl. Bikes (#/hr) 117Turn Type Prot Perm NA NAProtected Phases 4 2 6Permitted Phases 4Actuated Green, G (s) 41.2 41.2 56.6 56.6Effective Green, g (s) 41.2 41.2 56.6 56.6Actuated g/C Ratio 0.37 0.37 0.51 0.51Clearance Time (s) 6.8 6.8 5.4 5.4Lane Grp Cap (vph) 576 493 1500 1073v/s Ratio Prot 0.12 0.32 c0.63v/s Ratio Perm c0.16v/c Ratio 0.32 0.44 0.62 1.22Uniform Delay, d1 24.5 25.7 19.1 26.7Progression Factor 1.00 1.00 1.78 0.63Incremental Delay, d2 1.5 2.8 1.4 101.8Delay (s) 25.9 28.5 35.2 118.6Level of Service C C D FApproach Delay (s) 27.4 35.2 118.6Approach LOS C D F
Intersection SummaryHCM 2000 Control Delay 75.2 HCM 2000 Level of Service EHCM 2000 Volume to Capacity ratio 0.89Actuated Cycle Length (s) 110.0 Sum of lost time (s) 12.2Intersection Capacity Utilization 91.7% ICU Level of Service FAnalysis Period (min) 15c Critical Lane Group

HCM Signalized Intersection Capacity Analysis102: The Embarcadero & Bryant St./Pier 30 12/7/2015
GSW Mission Bay Arena (Off-Site Parking) Existing Plus Project (Warriors Game) Weekday PM Peak, No Giants GameSynchro 8 ReportTW Page 33
Movement EBL EBT EBR WBL WBT WBR NBL NBT NBR SBL SBT SBRLane ConfigurationsVolume (vph) 34 4 247 7 9 4 191 799 0 17 1145 76Ideal Flow (vphpl) 1900 1900 1900 1900 1900 1900 1900 1900 1900 1600 1600 1600Total Lost time (s) 6.9 6.9 6.9 6.5 6.5 5.9 5.2 5.2Lane Util. Factor 1.00 1.00 1.00 1.00 0.95 *0.90 *0.90 *0.90Frpb, ped/bikes 1.00 0.97 0.99 1.00 1.00 1.00 1.00 0.86Flpb, ped/bikes 0.96 1.00 1.00 1.00 1.00 1.00 1.00 1.00Frt 1.00 0.85 0.98 1.00 1.00 1.00 1.00 0.85Flt Protected 0.95 1.00 0.98 0.95 1.00 0.95 1.00 1.00Satd. Flow (prot) 1481 1335 1531 1540 3079 1167 2456 898Flt Permitted 0.74 1.00 0.89 0.95 1.00 0.95 1.00 1.00Satd. Flow (perm) 1159 1335 1386 1540 3079 1167 2456 898Peak-hour factor, PHF 0.92 0.92 0.92 0.92 0.92 0.92 0.92 0.92 0.92 0.92 0.92 0.92Adj. Flow (vph) 37 4 268 8 10 4 208 868 0 18 1245 83RTOR Reduction (vph) 0 175 0 0 3 0 0 0 0 0 0 58Lane Group Flow (vph) 37 97 0 0 19 0 208 868 0 18 1245 25Confl. Peds. (#/hr) 45 24 24 45 173 77Confl. Bikes (#/hr) 2 52 80Turn Type Perm NA Perm NA Prot NA Prot NA PermProtected Phases 4 8 5 2 1 6Permitted Phases 4 8 6Actuated Green, G (s) 38.1 38.1 38.1 20.5 41.5 11.1 32.8 32.8Effective Green, g (s) 38.1 38.1 38.1 20.5 41.5 11.1 32.8 32.8Actuated g/C Ratio 0.35 0.35 0.35 0.19 0.38 0.10 0.30 0.30Clearance Time (s) 6.9 6.9 6.9 6.5 6.5 5.9 5.2 5.2Lane Grp Cap (vph) 401 462 480 287 1161 117 732 267v/s Ratio Prot c0.07 0.14 c0.28 0.02 c0.51v/s Ratio Perm 0.03 0.01 0.03v/c Ratio 0.09 0.21 0.04 0.72 0.75 0.15 1.70 0.09Uniform Delay, d1 24.3 25.3 23.8 42.1 29.7 45.2 38.6 27.9Progression Factor 1.00 1.00 1.00 0.84 0.84 1.38 1.18 2.60Incremental Delay, d2 0.5 1.0 0.2 11.4 3.4 0.3 315.9 0.1Delay (s) 24.7 26.4 24.0 46.8 28.4 62.4 361.4 72.6Level of Service C C C D C E F EApproach Delay (s) 26.2 24.0 32.0 339.6Approach LOS C C C F
Intersection SummaryHCM 2000 Control Delay 181.7 HCM 2000 Level of Service FHCM 2000 Volume to Capacity ratio 0.89Actuated Cycle Length (s) 110.0 Sum of lost time (s) 19.3Intersection Capacity Utilization 106.1% ICU Level of Service GAnalysis Period (min) 15c Critical Lane Group

EXISTING 2015 PLUS PROJECT BASKETBALL GAME
NO SF GIANTS GAME AT AT&T PARK WEEKDAY EVENING

HCM Signalized Intersection Capacity Analysis101: The Embarcadero & Harrison St. 12/7/2015
GSW Mission Bay Arena (Off-Site Parking) Existing Plus Project (Warriors Game) Weekday Evening, No Giants Game Synchro 8 ReportTW Page 32
Movement EBL EBR NBL NBT SBT SBRLane ConfigurationsVolume (vph) 179 184 0 1036 878 189Ideal Flow (vphpl) 1900 1900 1900 1900 1600 1600Total Lost time (s) 6.8 6.8 5.4 5.4Lane Util. Factor 1.00 1.00 *0.90 *0.80Frpb, ped/bikes 1.00 0.96 1.00 0.98Flpb, ped/bikes 1.00 1.00 1.00 1.00Frt 1.00 0.85 1.00 0.97Flt Protected 0.95 1.00 1.00 1.00Satd. Flow (prot) 1540 1318 2698 2075Flt Permitted 0.95 1.00 1.00 1.00Satd. Flow (perm) 1540 1318 2698 2075Peak-hour factor, PHF 0.93 0.93 0.93 0.93 0.93 0.93Adj. Flow (vph) 192 198 0 1114 944 203RTOR Reduction (vph) 0 28 0 0 13 0Lane Group Flow (vph) 192 170 0 1114 1134 0Confl. Peds. (#/hr) 73 40 140Confl. Bikes (#/hr) 117Parking (#/hr) 10Turn Type Prot Perm NA NAProtected Phases 4 2 6Permitted Phases 4Actuated Green, G (s) 41.2 41.2 56.6 56.6Effective Green, g (s) 41.2 41.2 56.6 56.6Actuated g/C Ratio 0.37 0.37 0.51 0.51Clearance Time (s) 6.8 6.8 5.4 5.4Lane Grp Cap (vph) 576 493 1388 1067v/s Ratio Prot 0.12 0.41 c0.55v/s Ratio Perm c0.13v/c Ratio 0.33 0.34 0.80 1.06Uniform Delay, d1 24.6 24.7 22.1 26.7Progression Factor 1.00 1.00 1.89 0.35Incremental Delay, d2 1.6 1.9 2.6 30.6Delay (s) 26.1 26.6 44.3 40.0Level of Service C C D DApproach Delay (s) 26.4 44.3 40.0Approach LOS C D D
Intersection SummaryHCM 2000 Control Delay 39.8 HCM 2000 Level of Service DHCM 2000 Volume to Capacity ratio 0.76Actuated Cycle Length (s) 110.0 Sum of lost time (s) 12.2Intersection Capacity Utilization 91.7% ICU Level of Service FAnalysis Period (min) 15c Critical Lane Group

HCM Signalized Intersection Capacity Analysis102: The Embarcadero & Bryant St./Pier 30 12/7/2015
GSW Mission Bay Arena (Off-Site Parking) Existing Plus Project (Warriors Game) Weekday Evening, No Giants Game Synchro 8 ReportTW Page 33
Movement EBL EBT EBR WBL WBT WBR NBL NBT NBR SBL SBT SBRLane ConfigurationsVolume (vph) 41 21 332 18 9 7 83 988 15 53 940 69Ideal Flow (vphpl) 1900 1900 1900 1900 1900 1900 1900 1900 1900 1600 1600 1600Total Lost time (s) 6.9 6.9 6.9 6.5 6.5 5.9 5.2 5.2Lane Util. Factor 1.00 1.00 1.00 1.00 0.95 *0.90 *0.90 *0.90Frpb, ped/bikes 1.00 0.97 0.99 1.00 1.00 1.00 1.00 0.87Flpb, ped/bikes 0.96 1.00 0.99 1.00 1.00 1.00 1.00 1.00Frt 1.00 0.86 0.97 1.00 1.00 1.00 1.00 0.85Flt Protected 0.95 1.00 0.97 0.95 1.00 0.95 1.00 1.00Satd. Flow (prot) 1482 1348 1510 1540 2907 1167 2456 904Flt Permitted 0.73 1.00 0.78 0.95 1.00 0.95 1.00 1.00Satd. Flow (perm) 1147 1348 1214 1540 2907 1167 2456 904Peak-hour factor, PHF 0.98 0.98 0.98 0.98 0.98 0.98 0.98 0.98 0.98 0.98 0.98 0.98Adj. Flow (vph) 42 21 339 18 9 7 85 1008 15 54 959 70RTOR Reduction (vph) 0 222 0 0 5 0 0 1 0 0 0 47Lane Group Flow (vph) 42 138 0 0 29 0 85 1022 0 54 959 23Confl. Peds. (#/hr) 45 24 24 45 173 77Confl. Bikes (#/hr) 2 52 80Parking (#/hr) 0Turn Type Perm NA Perm NA Prot NA Prot NA PermProtected Phases 4 8 5 2 1 6Permitted Phases 4 8 6Actuated Green, G (s) 38.1 38.1 38.1 16.5 41.5 11.1 36.8 36.8Effective Green, g (s) 38.1 38.1 38.1 16.5 41.5 11.1 36.8 36.8Actuated g/C Ratio 0.35 0.35 0.35 0.15 0.38 0.10 0.33 0.33Clearance Time (s) 6.9 6.9 6.9 6.5 6.5 5.9 5.2 5.2Lane Grp Cap (vph) 397 466 420 231 1096 117 821 302v/s Ratio Prot c0.10 0.06 c0.35 0.05 c0.39v/s Ratio Perm 0.04 0.02 0.03v/c Ratio 0.11 0.30 0.07 0.37 0.93 0.46 1.17 0.08Uniform Delay, d1 24.4 26.2 24.1 42.1 32.9 46.6 36.6 25.0Progression Factor 1.00 1.00 1.00 0.44 0.23 1.15 0.68 0.52Incremental Delay, d2 0.5 1.6 0.3 3.5 12.4 4.3 80.4 0.2Delay (s) 24.9 27.8 24.4 21.7 20.0 58.0 105.3 13.1Level of Service C C C C B E F BApproach Delay (s) 27.5 24.4 20.1 96.9Approach LOS C C C F
Intersection SummaryHCM 2000 Control Delay 53.0 HCM 2000 Level of Service DHCM 2000 Volume to Capacity ratio 0.79Actuated Cycle Length (s) 110.0 Sum of lost time (s) 19.3Intersection Capacity Utilization 95.3% ICU Level of Service FAnalysis Period (min) 15c Critical Lane Group

EXISTING 2015 PLUS PROJECT BASKETBALL GAME
NO SF GIANTS GAME AT AT&T PARK WEEKDAY LATE EVENING

HCM Signalized Intersection Capacity Analysis101: The Embarcadero & Harrison St. 11/24/2015
GSW Mission Bay Arena (Off-Site Parking) Existing Plus Project (Warriors Game) Weekday Late Evening, No Giants GameSynchro 8 ReportTW Page 32
Movement EBL EBR NBL NBT SBT SBRLane ConfigurationsVolume (vph) 85 58 0 805 632 126Ideal Flow (vphpl) 1900 1900 1900 1900 1600 1600Total Lost time (s) 6.8 6.8 5.4 5.4Lane Util. Factor 1.00 1.00 *0.90 *0.80Frpb, ped/bikes 1.00 0.96 1.00 0.98Flpb, ped/bikes 1.00 1.00 1.00 1.00Frt 1.00 0.85 1.00 0.97Flt Protected 0.95 1.00 1.00 1.00Satd. Flow (prot) 1540 1318 2698 2081Flt Permitted 0.95 1.00 1.00 1.00Satd. Flow (perm) 1540 1318 2698 2081Peak-hour factor, PHF 0.86 0.86 0.86 0.86 0.86 0.86Adj. Flow (vph) 99 67 0 936 735 147RTOR Reduction (vph) 0 42 0 0 12 0Lane Group Flow (vph) 99 25 0 936 870 0Confl. Peds. (#/hr) 73 40 140Confl. Bikes (#/hr) 117Parking (#/hr) 10Turn Type Prot Perm NA NAProtected Phases 4 2 6Permitted Phases 4Actuated Green, G (s) 41.2 41.2 56.6 56.6Effective Green, g (s) 41.2 41.2 56.6 56.6Actuated g/C Ratio 0.37 0.37 0.51 0.51Clearance Time (s) 6.8 6.8 5.4 5.4Lane Grp Cap (vph) 576 493 1388 1070v/s Ratio Prot c0.06 0.35 c0.42v/s Ratio Perm 0.02v/c Ratio 0.17 0.05 0.67 0.81Uniform Delay, d1 23.0 21.9 19.8 22.3Progression Factor 1.00 1.00 1.98 0.24Incremental Delay, d2 0.6 0.2 1.6 0.7Delay (s) 23.6 22.1 40.9 5.9Level of Service C C D AApproach Delay (s) 23.0 40.9 5.9Approach LOS C D A
Intersection SummaryHCM 2000 Control Delay 23.9 HCM 2000 Level of Service CHCM 2000 Volume to Capacity ratio 0.54Actuated Cycle Length (s) 110.0 Sum of lost time (s) 12.2Intersection Capacity Utilization 91.7% ICU Level of Service FAnalysis Period (min) 15c Critical Lane Group

HCM Signalized Intersection Capacity Analysis102: The Embarcadero & Bryant St./Pier 30 11/24/2015
GSW Mission Bay Arena (Off-Site Parking) Existing Plus Project (Warriors Game) Weekday Late Evening, No Giants GameSynchro 8 ReportTW Page 33
Movement EBL EBT EBR WBL WBT WBR NBL NBT NBR SBL SBT SBRLane ConfigurationsVolume (vph) 32 0 57 3 0 0 82 773 0 21 637 32Ideal Flow (vphpl) 1900 1900 1900 1900 1900 1900 1900 1900 1900 1600 1600 1600Total Lost time (s) 6.9 6.9 6.9 6.5 6.5 5.9 5.2 5.2Lane Util. Factor 1.00 1.00 1.00 1.00 0.95 *0.90 *0.90 *0.90Frpb, ped/bikes 1.00 0.97 1.00 1.00 1.00 1.00 1.00 0.87Flpb, ped/bikes 0.96 1.00 0.98 1.00 1.00 1.00 1.00 1.00Frt 1.00 0.85 1.00 1.00 1.00 1.00 1.00 0.85Flt Protected 0.95 1.00 0.95 0.95 1.00 0.95 1.00 1.00Satd. Flow (prot) 1480 1331 1510 1540 2925 1167 2456 904Flt Permitted 0.76 1.00 0.71 0.95 1.00 0.95 1.00 1.00Satd. Flow (perm) 1177 1331 1135 1540 2925 1167 2456 904Peak-hour factor, PHF 0.86 0.86 0.86 0.86 0.86 0.86 0.86 0.86 0.86 0.86 0.86 0.86Adj. Flow (vph) 37 0 66 3 0 0 95 899 0 24 741 37RTOR Reduction (vph) 0 43 0 0 0 0 0 0 0 0 0 25Lane Group Flow (vph) 37 23 0 0 3 0 95 899 0 24 741 12Confl. Peds. (#/hr) 45 24 24 45 173 77Confl. Bikes (#/hr) 2 52 80Parking (#/hr) 0Turn Type Perm NA Perm NA Prot NA Prot NA PermProtected Phases 4 8 5 2 1 6Permitted Phases 4 8 6Actuated Green, G (s) 38.1 38.1 38.1 16.5 41.5 11.1 36.8 36.8Effective Green, g (s) 38.1 38.1 38.1 16.5 41.5 11.1 36.8 36.8Actuated g/C Ratio 0.35 0.35 0.35 0.15 0.38 0.10 0.33 0.33Clearance Time (s) 6.9 6.9 6.9 6.5 6.5 5.9 5.2 5.2Lane Grp Cap (vph) 407 461 393 231 1103 117 821 302v/s Ratio Prot 0.02 0.06 c0.31 0.02 c0.30v/s Ratio Perm c0.03 0.00 0.01v/c Ratio 0.09 0.05 0.01 0.41 0.82 0.21 0.90 0.04Uniform Delay, d1 24.3 23.9 23.6 42.4 30.8 45.4 34.9 24.7Progression Factor 1.00 1.00 1.00 0.39 0.19 1.15 0.37 1.00Incremental Delay, d2 0.4 0.2 0.0 3.8 4.9 2.5 10.4 0.2Delay (s) 24.7 24.1 23.6 20.3 10.8 54.6 23.4 24.9Level of Service C C C C B D C CApproach Delay (s) 24.3 23.6 11.7 24.4Approach LOS C C B C
Intersection SummaryHCM 2000 Control Delay 17.8 HCM 2000 Level of Service BHCM 2000 Volume to Capacity ratio 0.57Actuated Cycle Length (s) 110.0 Sum of lost time (s) 19.3Intersection Capacity Utilization 91.7% ICU Level of Service FAnalysis Period (min) 15c Critical Lane Group

EXISTING 2015 PLUS PROJECT BASKETBALL GAME
NO SF GIANTS GAME AT AT&T PARK SATURDAY EVENING

HCM Signalized Intersection Capacity Analysis101: The Embarcadero & Harrison St. 12/7/2015
GSW Mission Bay Arena (Off-Site Parking) Existing Plus Project (Warriors Game) Saturday Evening, No Giants Game Synchro 8 ReportTW Page 32
Movement EBL EBR NBL NBT SBT SBRLane ConfigurationsVolume (vph) 99 107 0 627 790 203Ideal Flow (vphpl) 1500 1500 1500 1500 1500 1500Total Lost time (s) 6.8 6.8 5.4 5.4Lane Util. Factor 1.00 1.00 *0.90 *0.80Frpb, ped/bikes 1.00 0.96 1.00 0.97Flpb, ped/bikes 1.00 1.00 1.00 1.00Frt 1.00 0.85 1.00 0.97Flt Protected 0.95 1.00 1.00 1.00Satd. Flow (prot) 1215 1040 2130 1929Flt Permitted 0.95 1.00 1.00 1.00Satd. Flow (perm) 1215 1040 2130 1929Peak-hour factor, PHF 0.97 0.97 0.97 0.97 0.97 0.97Adj. Flow (vph) 102 110 0 646 814 209RTOR Reduction (vph) 0 40 0 0 16 0Lane Group Flow (vph) 102 70 0 646 1007 0Confl. Peds. (#/hr) 73 40 140Confl. Bikes (#/hr) 117Parking (#/hr) 10Turn Type Prot Perm NA NAProtected Phases 4 2 6Permitted Phases 4Actuated Green, G (s) 41.2 41.2 56.6 56.6Effective Green, g (s) 41.2 41.2 56.6 56.6Actuated g/C Ratio 0.37 0.37 0.51 0.51Clearance Time (s) 6.8 6.8 5.4 5.4Lane Grp Cap (vph) 455 389 1095 992v/s Ratio Prot c0.08 0.30 c0.52v/s Ratio Perm 0.07v/c Ratio 0.22 0.18 0.59 1.02Uniform Delay, d1 23.5 23.1 18.6 26.7Progression Factor 1.00 1.00 1.91 0.33Incremental Delay, d2 1.1 1.0 1.6 12.7Delay (s) 24.6 24.1 37.2 21.5Level of Service C C D CApproach Delay (s) 24.3 37.2 21.5Approach LOS C D C
Intersection SummaryHCM 2000 Control Delay 27.2 HCM 2000 Level of Service CHCM 2000 Volume to Capacity ratio 0.68Actuated Cycle Length (s) 110.0 Sum of lost time (s) 12.2Intersection Capacity Utilization 91.7% ICU Level of Service FAnalysis Period (min) 15c Critical Lane Group

HCM Signalized Intersection Capacity Analysis102: The Embarcadero & Bryant St./Pier 30 12/7/2015
GSW Mission Bay Arena (Off-Site Parking) Existing Plus Project (Warriors Game) Saturday Evening, No Giants Game Synchro 8 ReportTW Page 33
Movement EBL EBT EBR WBL WBT WBR NBL NBT NBR SBL SBT SBRLane ConfigurationsVolume (vph) 49 3 227 1 1 6 78 572 4 21 808 68Ideal Flow (vphpl) 1500 1500 1500 1500 1500 1500 1400 1400 1400 1500 1500 1500Total Lost time (s) 6.9 6.9 6.9 6.5 6.5 5.9 5.2 5.2Lane Util. Factor 1.00 1.00 1.00 1.00 0.95 *0.90 *0.90 *0.90Frpb, ped/bikes 1.00 0.97 0.96 1.00 1.00 1.00 1.00 0.87Flpb, ped/bikes 0.96 1.00 1.00 1.00 1.00 1.00 1.00 1.00Frt 1.00 0.85 0.90 1.00 1.00 1.00 1.00 0.85Flt Protected 0.95 1.00 0.99 0.95 1.00 0.95 1.00 1.00Satd. Flow (prot) 1169 1054 1098 1134 2149 1094 2303 847Flt Permitted 0.75 1.00 0.98 0.95 1.00 0.95 1.00 1.00Satd. Flow (perm) 926 1054 1078 1134 2149 1094 2303 847Peak-hour factor, PHF 0.94 0.94 0.94 0.94 0.94 0.94 0.94 0.94 0.94 0.94 0.94 0.94Adj. Flow (vph) 52 3 241 1 1 6 83 609 4 22 860 72RTOR Reduction (vph) 0 158 0 0 4 0 0 1 0 0 0 48Lane Group Flow (vph) 52 86 0 0 4 0 83 612 0 22 860 24Confl. Peds. (#/hr) 45 24 24 45 173 77Confl. Bikes (#/hr) 2 52 80Parking (#/hr) 0Turn Type Perm NA Perm NA Prot NA Prot NA PermProtected Phases 4 8 5 2 1 6Permitted Phases 4 8 6Actuated Green, G (s) 38.1 38.1 38.1 16.5 41.5 11.1 36.8 36.8Effective Green, g (s) 38.1 38.1 38.1 16.5 41.5 11.1 36.8 36.8Actuated g/C Ratio 0.35 0.35 0.35 0.15 0.38 0.10 0.33 0.33Clearance Time (s) 6.9 6.9 6.9 6.5 6.5 5.9 5.2 5.2Lane Grp Cap (vph) 320 365 373 170 810 110 770 283v/s Ratio Prot c0.08 0.07 c0.28 0.02 c0.37v/s Ratio Perm 0.06 0.00 0.03v/c Ratio 0.16 0.24 0.01 0.49 0.76 0.20 1.12 0.09Uniform Delay, d1 24.9 25.6 23.6 42.9 29.8 45.4 36.6 25.1Progression Factor 1.00 1.00 1.00 0.40 0.20 1.17 0.59 0.53Incremental Delay, d2 1.1 1.5 0.1 7.0 4.7 1.7 60.8 0.3Delay (s) 26.0 27.1 23.6 24.2 10.7 54.7 82.2 13.5Level of Service C C C C B D F BApproach Delay (s) 26.9 23.6 12.3 76.4Approach LOS C C B E
Intersection SummaryHCM 2000 Control Delay 45.9 HCM 2000 Level of Service DHCM 2000 Volume to Capacity ratio 0.71Actuated Cycle Length (s) 110.0 Sum of lost time (s) 19.3Intersection Capacity Utilization 92.4% ICU Level of Service FAnalysis Period (min) 15c Critical Lane Group