intersectoral action for health and well-being in ... well-being in khayelitsha: a health sector...
TRANSCRIPT

Intersectoral action for health and well-being in Khayelitsha:
A health sector perspective 14 March 2013
Virginia De Azevedo

Cape Town & migration
Khayelitsha
Health indicators of inequality in the city
What prompted us to get involved in improving access to W&S in Khayelitsha
How we conceptualized our role in that process
Our experience in dealing with a no. of role-players involved, amongst others:
1. Other city departments
2. Communities
3. Leadership structures
4. NGOs
Conclusion

Population ~ 3,6 million
Divided in 8 health sub districts
Continued in-migration against a housing backlog resulted in proliferation of informal settlements of various sizes
City adopted norms for provision of basic services (access to water, toilets and solid waste removal)
EHPs carry out weekly inspection visits to informal settlements to monitor health hazards
Failure to meet city adopted norms and problems with access to water, sanitation and waste management are reported to relevant departments

Cape Town population estimated increase for
the next 15 years (2010-2025) =13%
i.e. ~4,2 million
In 2012 = Cape Town has 287 informal
settlements

Migration from the EC into the poorest parts of the city: Khayelitsha, Guguletu, Nyanga
Migration of skilled people (mainly Gauteng & KZN) into the wealthier areas of Southern and Northern suburbs and the Atlantic seaboard

(UNHabitat, 2010)

Urbanization Workshop 22 Feb 2011
Cape Town is experiencing significant, although not exceptional, population growth
Pattern of urbanization in Cape Town:
1. Growth concentrated among poor
2. Youthful population – median age=26
3. High child dependency ratio
4. Exacerbated by high unemployment
5. Household growth exceeds population growth
6. Increasing no. of households will not be able to provide for themselves and will be reliant on public sector for a range of services
In the context of existing inequalities, this growth, if not properly managed, could tilt the city to a path of declining social indicators
The ability of the economy to absorb additional population is limited
Keith Smith –Strategic Development Information & GIS Department

Peri-urban township Situated 30 kilometres outside Cape Town
Population close to 500,000 Of which ~ 2 thirds live in 46 informal settlements


X2.3
X1.5
x3
x2

0.0
5.0
10.0
15.0
20.0
25.0
30.0
35.0
East Khay Klip M/Plain North South Tyger West CoCT
CAPE TOWN trend: ANC HIV Prevalence 2005 - 2011
2005 2006 2007 2008 2009 2010 2011

ARV enrolments by sub-district 2010-2012
0
1000
2000
3000
4000
5000
6000
7000
Eastern Khayelitsha Klipfontein MP Northern Tygerberg Southern Western
RIC 25 735

803
1275
704 705 612
348
656 536
689
TB Case Notification Rate (100,000 population)

71
68
70
77 77
78
80 83
84
85
20
03
20
04
20
05
20
06
20
07
20
08
20
09
20
10
20
11
Q1
20
12
Cape Town TB Cure Rate: New Smear+ Cases
75
74
76
78 79 79
81
82
83
84
20
03
20
04
20
05
20
06
20
07
20
08
20
09
20
10
20
11
Q1
20
12
Cape Town Success Rate: ALL TB Cases

0
100
200
300
400
500
600
700
800
900
No. of HIV+ TB Clients
0
10
20
30
40
50
60
70
80
No. of MDR TB Cases diagnosed

45
31
56 58
40
58
111
75
60
2012: male condom distribution
(no. of condoms /male >15 years of age/ year)
0
5 000
10 000
15 000
20 000
25 000
30 000
East North South West Khay Klip M/Plain Tyger
Cape Town: STIs-New Cases
2004 2005 2006 2007 2008 2009 2010

42
25
23
16
0
5
10
15
20
25
30
35
40
45
Eastern Khayelitsha Klipfontein M/Plain Northern Southern Tygerberg Western City
Cape Town, IMR: 2003-2010 (No. of babies dying under 1 year, out of 1,000 live births)
2003 2004 2005 2006 2007 2008 2009 2010

The maps show the plotting of diarrhoea deaths in 3 consecutive diarrhoea seasons.
66 deaths DDS 2011/2012
91 deaths DDS 2010/2011
170 deaths
DDS 2009/2010
The clustering of deaths in certain areas is obvious. Although the density of dots was reduced in subsequent seasons, the geographical pocket areas where the dots are located, by and large remain fixed from one season to the next.


Informal settlements are too dense and inappropriately situated (wetlands, road reserves, servitudes)
Sub district most affected by the backlog in access to basic services
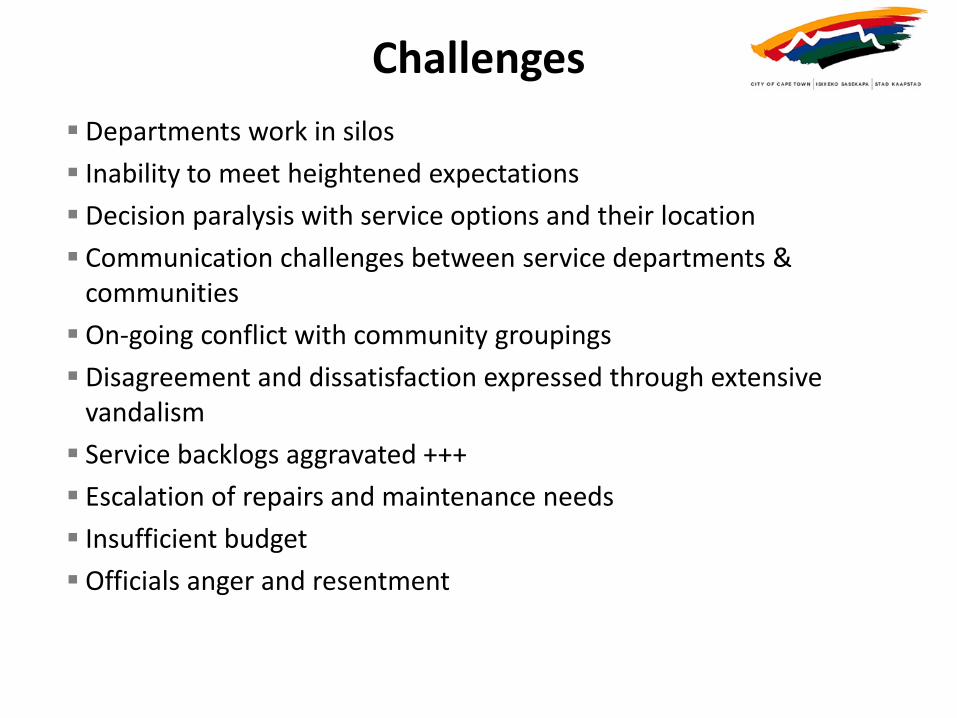
Departments work in silos
Inability to meet heightened expectations
Decision paralysis with service options and their location
Communication challenges between service departments & communities
On-going conflict with community groupings
Disagreement and dissatisfaction expressed through extensive vandalism
Service backlogs aggravated +++
Escalation of repairs and maintenance needs
Insufficient budget
Officials anger and resentment
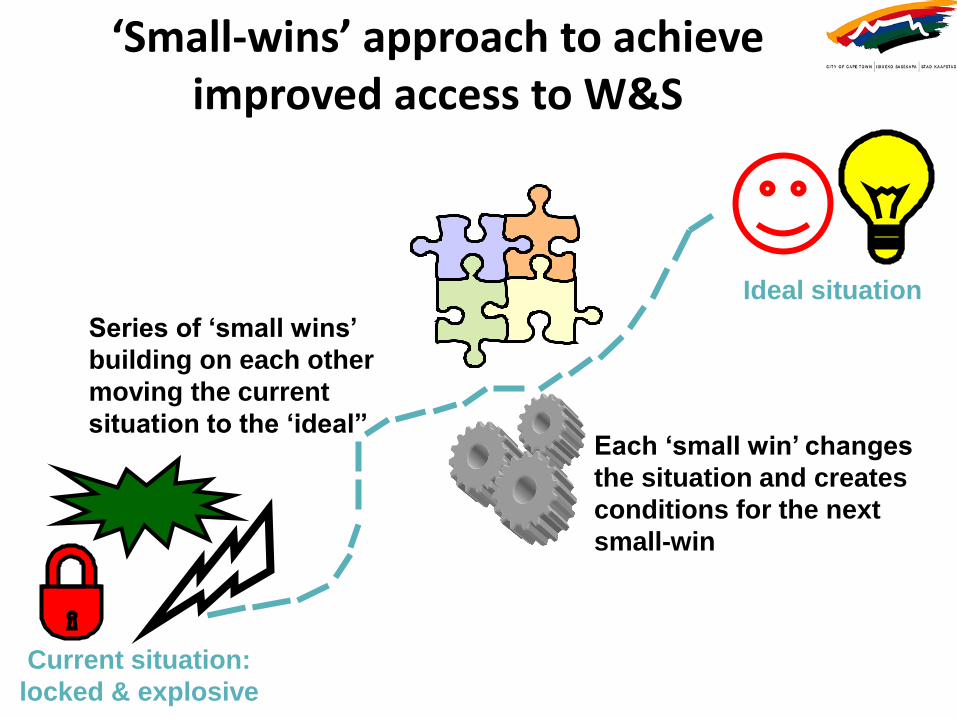
Current situation:
locked & explosive
Series of ‘small wins’
building on each other
moving the current
situation to the ‘ideal” Each ‘small win’ changes
the situation and creates
conditions for the next
small-win
Ideal situation

Social Justice
Coalition
Community
SANCO
ESKOM
Media
Reticulation Storm
water
Housing
30 different stakeholders in informal
settlements
Other
NGOs
SCM


The Environmental Health perspective:
1. Limited resources and competing needs
2. Difficulty in prioritization
3. Communication challenges
4. Skills challenges
5. Long delivery timeframes
6. Lack of trust

Insufficient funding
Insufficient land
Technical solutions too costly
Too many people migrating
Insufficient maintenance budget
Community frustration & extensive vandalism
Excessive use with high wear & tear
Insufficient basic infrastructure
Increased infrastructure backlog Not all sanitation options available
ISs too dense, located in inhabitable, flooding areas and reserves
On-going metal theft
Parts replaced with cheaper plastic options
Political agitation on sanitation options, moves & de-densification

Many competing needs
Which basic infrastructure to start 1st?
Huge infrastructure backlog
Human rights access issues
In which sub district to start 1st?
Focus on new installations? Political agitation rewarded with priority given
In which of the 287 ISs to start 1st?
Focus on maintenance? No coherent plan is possible


Poor communication between departmental silos
Poor communication between officials & residents
Unrealistic expectations of communities
Political interference for personal gain
Unrealistic expectations of officials regarding ‘ownership’
Lack of residents cohesiveness & refusal to have infrastructure installed at their door-step
IS development plan not clearly articulated & communicated
Lack of SOPs for: officials, contractors & residents

Officials poor behavioural skills
Poor systems for interdepartmental feedback
Lack of community understanding of how the infrastructure works
Lack of political savvy of officials
Poor systems for feedback to residents Officials poor
understanding of community dynamics
Poor systems to develop awareness & educate residents
Officials poor communication skills
Lack of political savvy of communities

Provision of basic services is a long process
Residents unrealistic expectations of what can be done
Lack of quick & obvious results & progress
Involvement of communities is a long and difficult process
Lack of informal settlements SOPs for:
1. Planning 2. Installation 3. Maintenance
Interference and agitation by various groupings
Service departments need to spend budget allocated
Service departments spend the budget where it is easy, not where the need is the greatest

No trust between officials & residents
Officials resentment
Residents anger frustration & vandalism
Lack of info with regards to city contractors
NGOs scepticism
No transparency regarding informal settlements strategy & plans Employment used as
source of power & influence
Residents don’t trust Sub-Council employment database

It has been a long frustrated journey and we are no where near a breakthrough
The informal settlements in Cape Town, where poverty, HIV and other overlapping vulnerabilities concentrate, are highly politically contested spaces
There is no common understanding between the various role-players and no coherent plan of action to overcome current problems
Progressive realization of access to W&S is still a long way ahead
Environmental Health is ideally positioned to contribute to (perhaps lead) the path to achieving that.

Thank you
STIs
Teenage pregnancies